




Abstract
This paper proposes an integrated DEMATEL–ISM–CN–BN framework for modeling the coupling and evolution of explosion risks in hydrogenation processes. The novelty of this approach lies in its systematic integration of four distinct methodologies, combining static structural analysis with dynamic probabilistic reasoning to comprehensively capture risk interactions across multiple system levels. Specifically, the framework identifies risk factors, reveals causal and system-level hierarchical propagation pathways, and quantifies risk evolution. Applied to a diesel hydrogenation unit, the model captures cross-level interactions involving reactor pressure, compressor anomalies, and flow reversals. A composite weighting system—based on centrality (α), hierarchy (β), and clustering (θ)—facilitates risk prioritization. Sensitivity analysis and the sensitivity–importance (SI) matrix highlight critical components such as the hydrofinishing reactor and hydrogen compressors. The results demonstrate the framework's capability to quantify complex interdependencies and support targeted risk mitigation in high-risk chemical operations.
Introduction
With the increasing global demand for clean energy and the ongoing transformation of the energy industry, hydrogenation processes have been increasingly applied to the petrochemical sector (Cui et al., 2024; Mateus-Rubiano et al., 2024). These processes convert various feedstocks into high-quality fuels via catalytic hydrogenation and play a pivotal role in national energy strategies (Qian et al., 2022; Sahu et al., 2024). However, due to the inherent high-pressure and high-temperature operating conditions, as well as the flammable and explosive properties of hydrogen, hydrogenation systems exhibit complex accident evolution mechanisms, including multi-factor coupling and nonlinear risk propagation (Rahim et al., 2024). Incomplete risk identification has become a major contributor to severe fire and explosion accidents in hydrogenation units. Additionally, insufficient understanding of coupling mechanisms further exacerbates the complexity and severity of such incidents (Nazerifard et al., 2023).
Existing studies have explored risk factor identification in hydrogenation processes from multiple perspectives (Ishola et al., 2020). For instance, fuzzy linguistic approaches have been applied to develop hierarchical risk models for refinery units, and process hazard analysis (PHA) templates have been proposed for hydrogenation stages (Wolbers, 2024). However, fuzzy models generally suffer from subjectivity in expert judgment, limiting their objectivity and reproducibility. PHA templates, although systematic, often fail to capture dynamic changes or interactions between risk factors. Machine learning techniques have also been used to screen high-risk components (Elsherir et al., 2015; Rachman & Ratnayake, 2019), and physical simulation tools like ALOHA and PHAST have been employed for consequence analysis (Bariha et al., 2023). Yet, machine learning models depend heavily on data quality and quantity, making them challenging to apply in scenarios with limited historical incident records. Similarly, simulation tools such as ALOHA and PHAST primarily focus on single-event scenarios and rarely consider systemic interactions or cascading risks. Overall, current approaches often exhibit redundancy and fragmentation, failing to address complex multidimensional interactions among risk factors comprehensively. Most rely on static, fragmented analyses and lack dynamic modeling capabilities to elucidate cross-level risk transmission pathways, limiting their applicability in inherently hazardous systems (Yang et al., 2023a; 2023b).
To overcome these methodological gaps and address the limitations identified, this study proposes a comprehensive analytical framework by integrating four distinct methodologies: Decision-Making Trial and Evaluation Laboratory (DEMATEL), Interpretive Structural Modeling (ISM), Complex Networks (CN), and Bayesian Networks (BN) (Zhong & Zhang, 2025). DEMATEL is effective in quantifying causal relationships between factors (Bashan & Ust, 2019; Karasan & Kahraman, 2019; Tan & Zhang, 2020), while ISM clarifies hierarchical structures within systems (Chen et al., 2023; Liu et al., 2020) CN models contribute by revealing global topological structures and local clustering patterns, essential for identifying implicit critical nodes and characterizing time-varying risk migration (Li et al., 2025; Lu et al., 2025). BN enables probabilistic reasoning under uncertainty, allowing for dynamic risk evolution analysis (Feng et al., 2019; Li et al., 2023).
By synergistically combining DEMATEL, ISM, CN, and BN, this study develops a novel four-stage coupling model (DEMATEL-ISM-CN-BN), establishing a full-chain risk analysis methodology that integrates risk identification, relationship analysis, structural hierarchy, and probabilistic evolution. Specifically, DEMATEL quantifies causal interactions among risk factors (Lv et al., 2024); ISM reveals system-level hierarchical dependencies (Li et al., 2024a); CN captures global network topology and node clustering properties; BN models probabilistic risk evolution under uncertainty.
Furthermore, we introduce a composite risk prioritization index combining centrality (α), hierarchical importance (β), and clustering coefficient (θ), along with a sensitivity–importance (SI) matrix to facilitate the identification of critical nodes and interactions. This integrated analytical framework is particularly suited to hydrogenation processes, as these systems frequently involve complex hierarchical fault propagation, nonlinear feedback loops, and intricate cross-subsystem interactions—features difficult to comprehensively analyze using any single approach alone.
The remainder of this paper is organized as follows: Section 2 describes the methodological foundation and computational procedures of the proposed framework. Section 3 presents the case study and analyzes the results. Section 4 summarizes the key findings and outlines directions for future research.
Research on the Risk Factor Analysis Method of Hydrogenation Process Explosion Accident Risk Factors
This section details the integrated DEMATEL-ISM-CN-BN framework used to model the coupling mechanisms and dynamic evolution of fire and explosion risks in hydrogenation units. The sequence DEMATEL-ISM-CN-BN is intentionally designed to reflect the logical flow of risk propagation analysis. DEMATEL first quantifies the pairwise causal influences among risk factors, which are then fed into the ISM to construct a hierarchical structural model. This hierarchy serves as the foundation for complex network (CN) analysis to reveal topological patterns and key nodes. Subsequently, the same structural framework is applied to the Bayesian Network (BN) to model the probabilistic evolution of risk (Figure 1).

Research Idea of This Paper.
2.1 DEMATEL for Causal Relationship Quantification
Considering the high degree of correlation and coupling between the diesel hydrogenation process and its equipment, leading to significant interactions among risk factors, DEMATEL provides a comprehensive framework for analyzing the coupling of these risk factors (Du & Shen, 2024). The process involves the following steps:
Step 1: Determine the Direct Impact Matrix.
Step 1: Construct the initial direct-relation matrix A based on expert judgment using a predefined scale (e.g., 0 to 3 indicating no to strong influence).

Step 2: Normalize the direct-relation matrix to obtain the standardized matrix B (

Step 3: Compute the total influence matrix T by aggregating direct and indirect effects through matrix operations.

Where, I is the denotes matrix.
Step 4: Calculate the prominence (R + C) and relation (R - C) of each factor, where R is the sum of row values and C is the sum of column values in the total influence matrix.


Factors with exhibiting prominence and positive relation values are identified as key drivers of systemic risk propagation (Wang et al., 2024).
The Interpretive Structural Modelling (ISM) approach is one of the most widely used analytical methods in systems engineering theory. Considering the cascading nature of risk propagation in the hydrogenation process, this study employs ISM to stratify risk factors into different levels and establish a hierarchical model of risk factors within the hydrogenation process (Huo et al., 2023; Li et al., 2024b). The procedure involves the following steps:
Step 1: Calculate the Overall Impact Matrix.
The overall impact matrix H (

Step 2: Determine the Reachability Matrix (K).
The reachability matrix K is derived from the total influence matrix H. Determine a threshold to filter unimportant relations in the reachable matrix K. The threshold λ is usually the mean of the overall impact matrix H added to the standard deviation.

Step 3: Construct the Hierarchical Structure.
Remove the corresponding rows and columns from K to identify the highest-level factor set. Repeat this process iteratively until all factors have been assigned levels. The sequence in which rows and columns are removed determines the final hierarchical network structure.
2.3 Complex Network Analysis for Topological Insights
Although the classical clustering coefficient is defined for undirected graphs, it is adapted here to evaluate the local interconnectivity of risk factors in a directed network. Following methods used by Hao et al. (2023), the neighborhood of each node is treated as undirected for the purpose of computing clustering coefficients, which provides a practical measure of local density and coupling strength in risk propagation analysis. Considering the strong chain coupling among the risk factors in the hydrogenation process. This study introduces complex network theory to calculate the clustering coefficients of the risk factors, as well as the degrees of the network nodes, including out-degree, in-degree, and total degree (Kang et al., 2024).
The out-degree number of edges extending from this node to other nodes (

The clustering coefficient reflects the local clustering of risk factors in a complex network. The agglomeration coefficient of risk factors is calculated as follows:

Where n denotes the number of neighboring nodes to node Xi, and li represents the number of connected edges between the neighboring nodes.
After determining the centrality (α), hierarchical weight values (β), and clustering coefficients (θ) of the risk factors, Eq. (11) is used to calculate the composite weight values (Hao et al., 2023).

BN (Bayesian Network) is employed to quantify the probabilistic influence of risk factors and simulate accident evolution. Based on the ISM structure (Hong & Sheng, 2023; Lixia & Si, 2024): 1.Root nodes represent fundamental causes; 2.Intermediate nodes correspond to transmission factors; 3.Leaf nodes represent direct accident scenarios.
In hydrogenation processes, the available datasets are often insufficient to populate a comprehensive training library. Additionally, expert-based methods are prone to subjective bias. To address these limitations and ensure reliable results, fuzzy set theory is adopted as the methodological basis for deriving the probability table. The CPT is subsequently determined by integrating expert knowledge with fuzzy set theory.
The sensitivity (Rov) of risk factors to a flaring accident is calculated based on Eq. (11), and the identification of key risk factors for the flaring accident scenario of a hydrogenation unit is systematically carried out (Zhang et al., 2024).

By integrating the two attributes of importance and sensitivity of risk factors, the SI (sensitivity and importance) index is defined as the product of the degree of importance and the degree of sensitivity, as shown in equation (12).

Where Si and Ii represent the importance weight and sensitivity weight of the ith risk factor, respectively.
Case Introduction
In this study, a diesel hydrofinishing unit with an annual capacity of 4 million tonnes from a petrochemical company in China is used as an example. A portion of the diesel hydrotreating process flow is illustrated in Figure 2. After the mixed feedstock oil passes through the feedstock oil buffer tank SR-1, it is heated in the heating furnace E-1, and then enters the hydrogenation reactor R-1 together with the mixed hydrogen. The reaction products are separated by the hot and cold high-pressure separator, and the resulting products then proceed to the refining stage. The final product is high-quality diesel fuel. The key equipment involved in this process includes the hydrogenation reactor, compressor, separator, and other associated components.
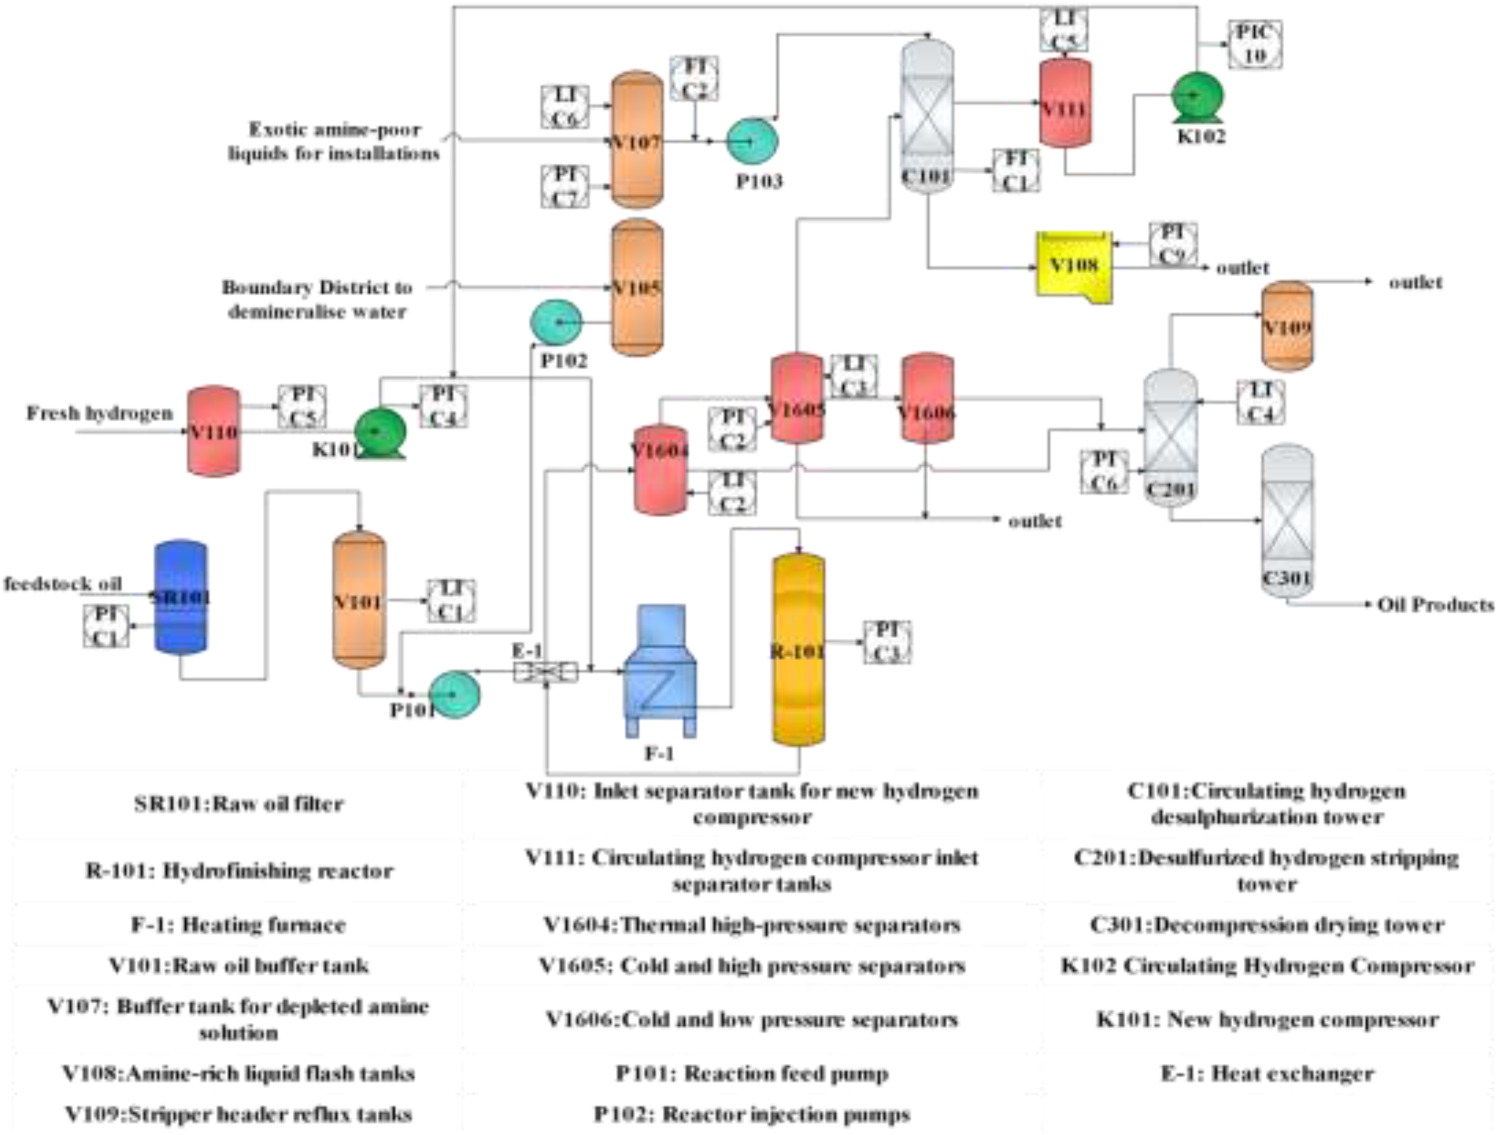
Diesel Hydrogenation Process Flow Diagram.
Risk factor identification was performed through a combination of historical documentation and expert-based hazard analysis. Data sources included piping and instrumentation diagrams (P&IDs), process flow diagrams (PFDs), accident investigation reports, and plant safety evaluations. Hazard and Operability Analysis (HAZOP) and expert interviews were utilized to systematically identify process deviations and assess their potential consequences within the diesel hydrotreating system.
As summarized in Table 1, nine primary equipment-level risk factors (denoted as C1–C9) were identified, including the feedstock buffer tank V101, hydrogen compressors, and the hydrofinishing reactor. Additionally, 28 process deviation events (F1–F28) were extracted as secondary risk factors. Together, these two groups form a hierarchical two-tier risk factor system employed in the subsequent modeling stages.
Hydrogenation Unit Fire or Explosion Risk Assessment System (A).

Hydrogenation Unit Fire or Explosion Risk Assessment System (A).
Based on DEMATEL Risk Factor Centrality Calculations
Expert Information.
Expert Information.

Table of Data on the Weights of the First-Level Factors.

Data Table of Secondary Factor Weights.
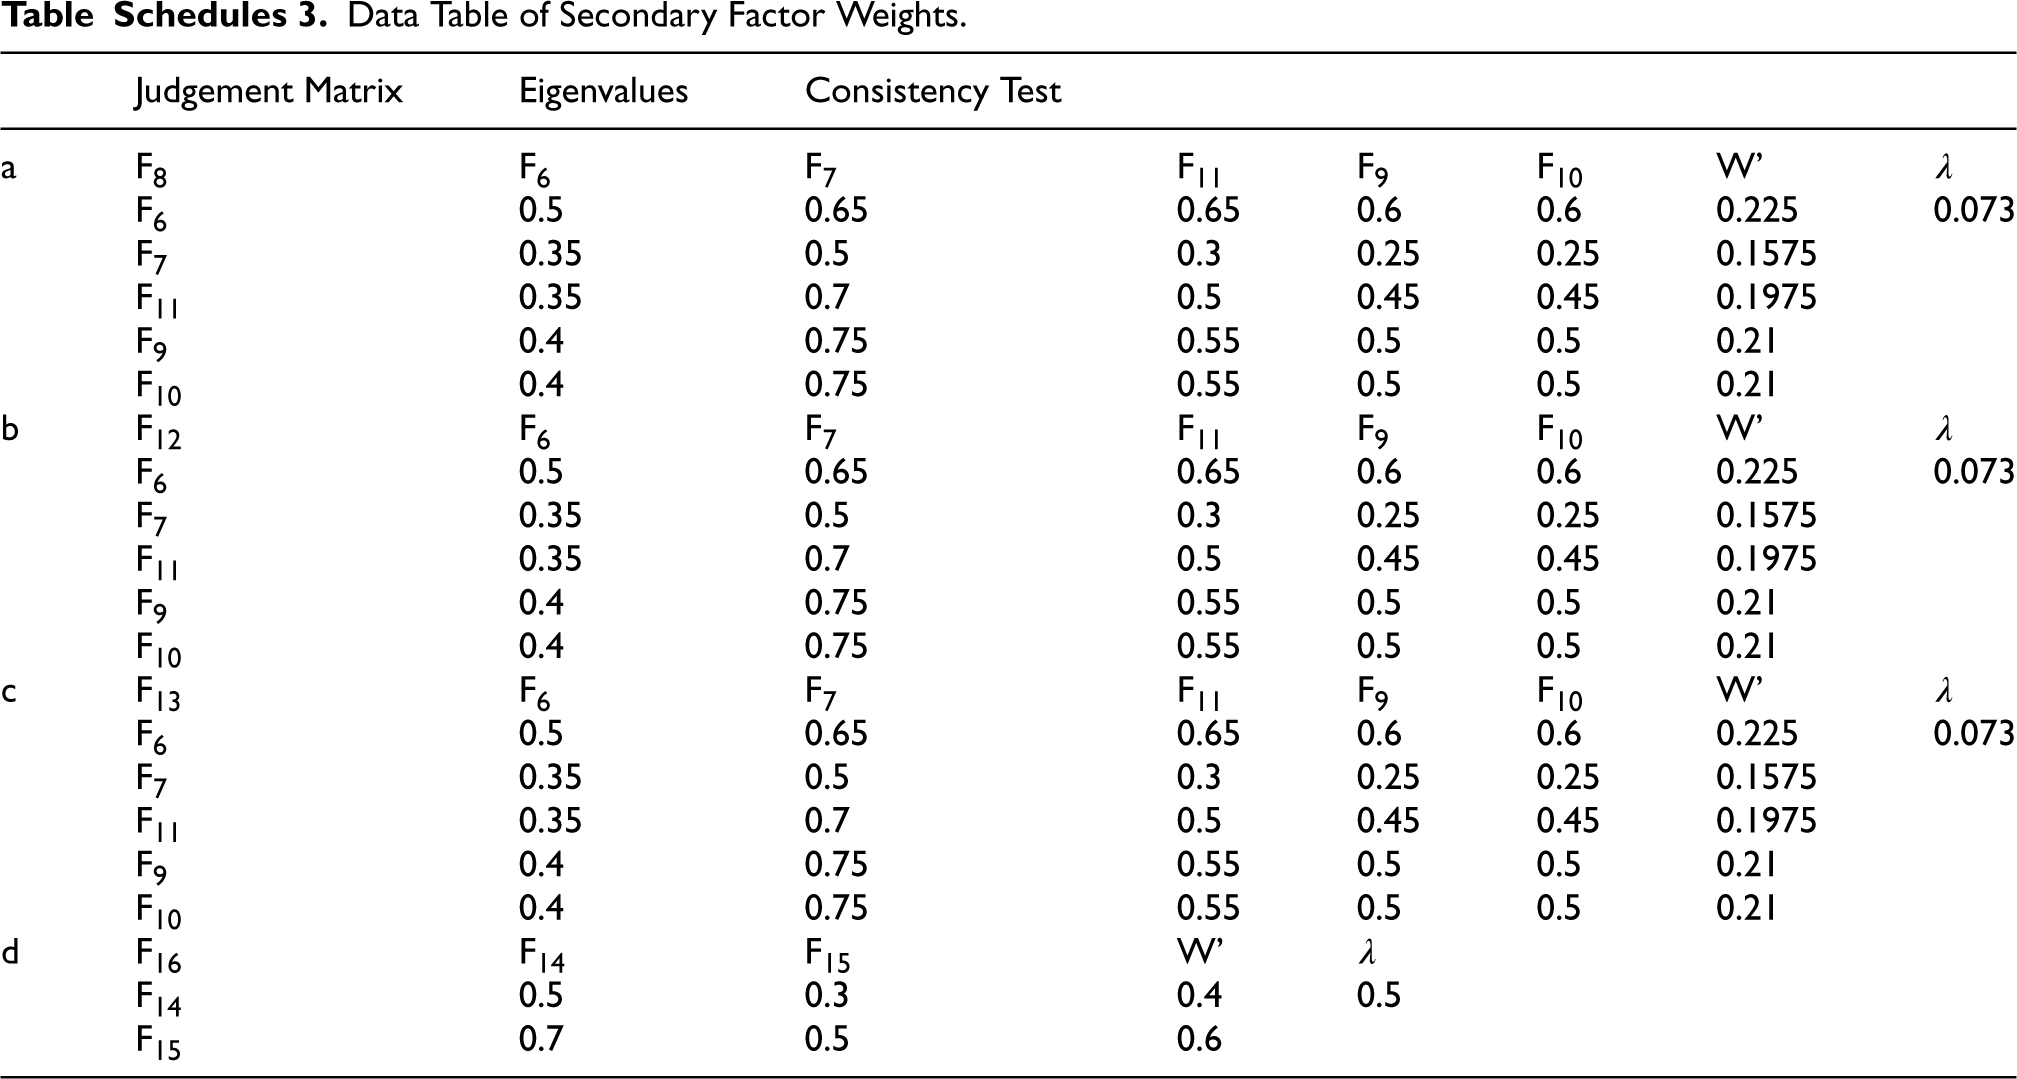
Data Table for Three Levels of Factor Weights.

Four-Level Factor Weighting Data Table.
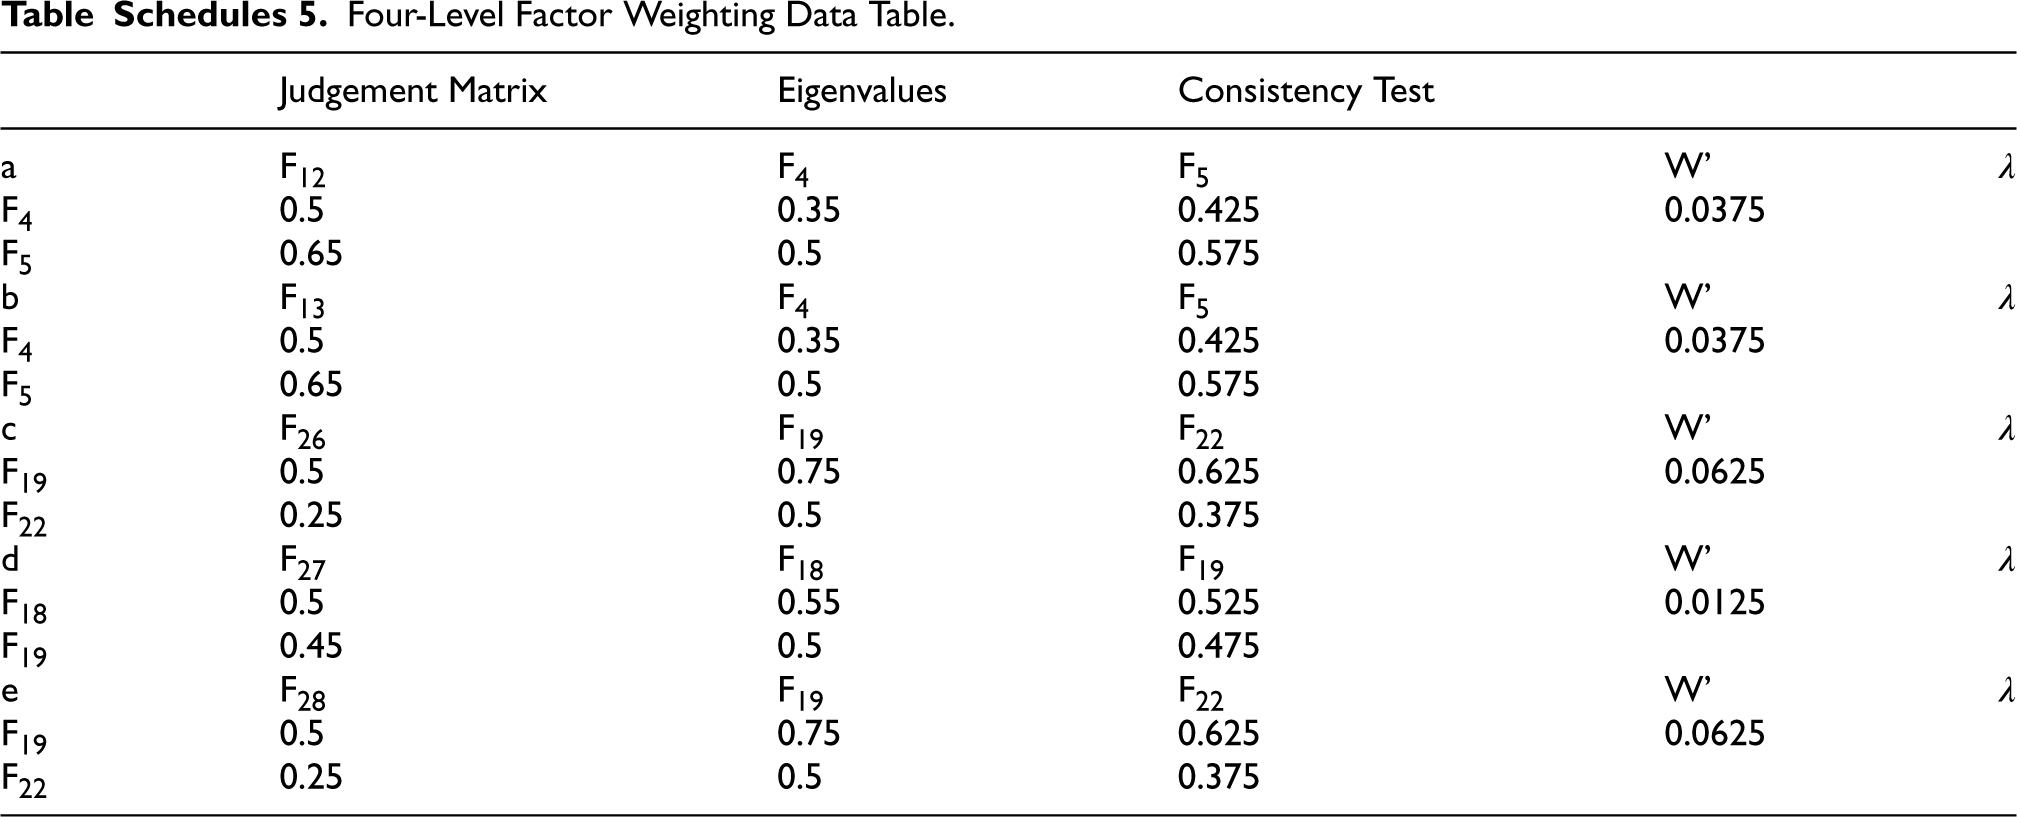
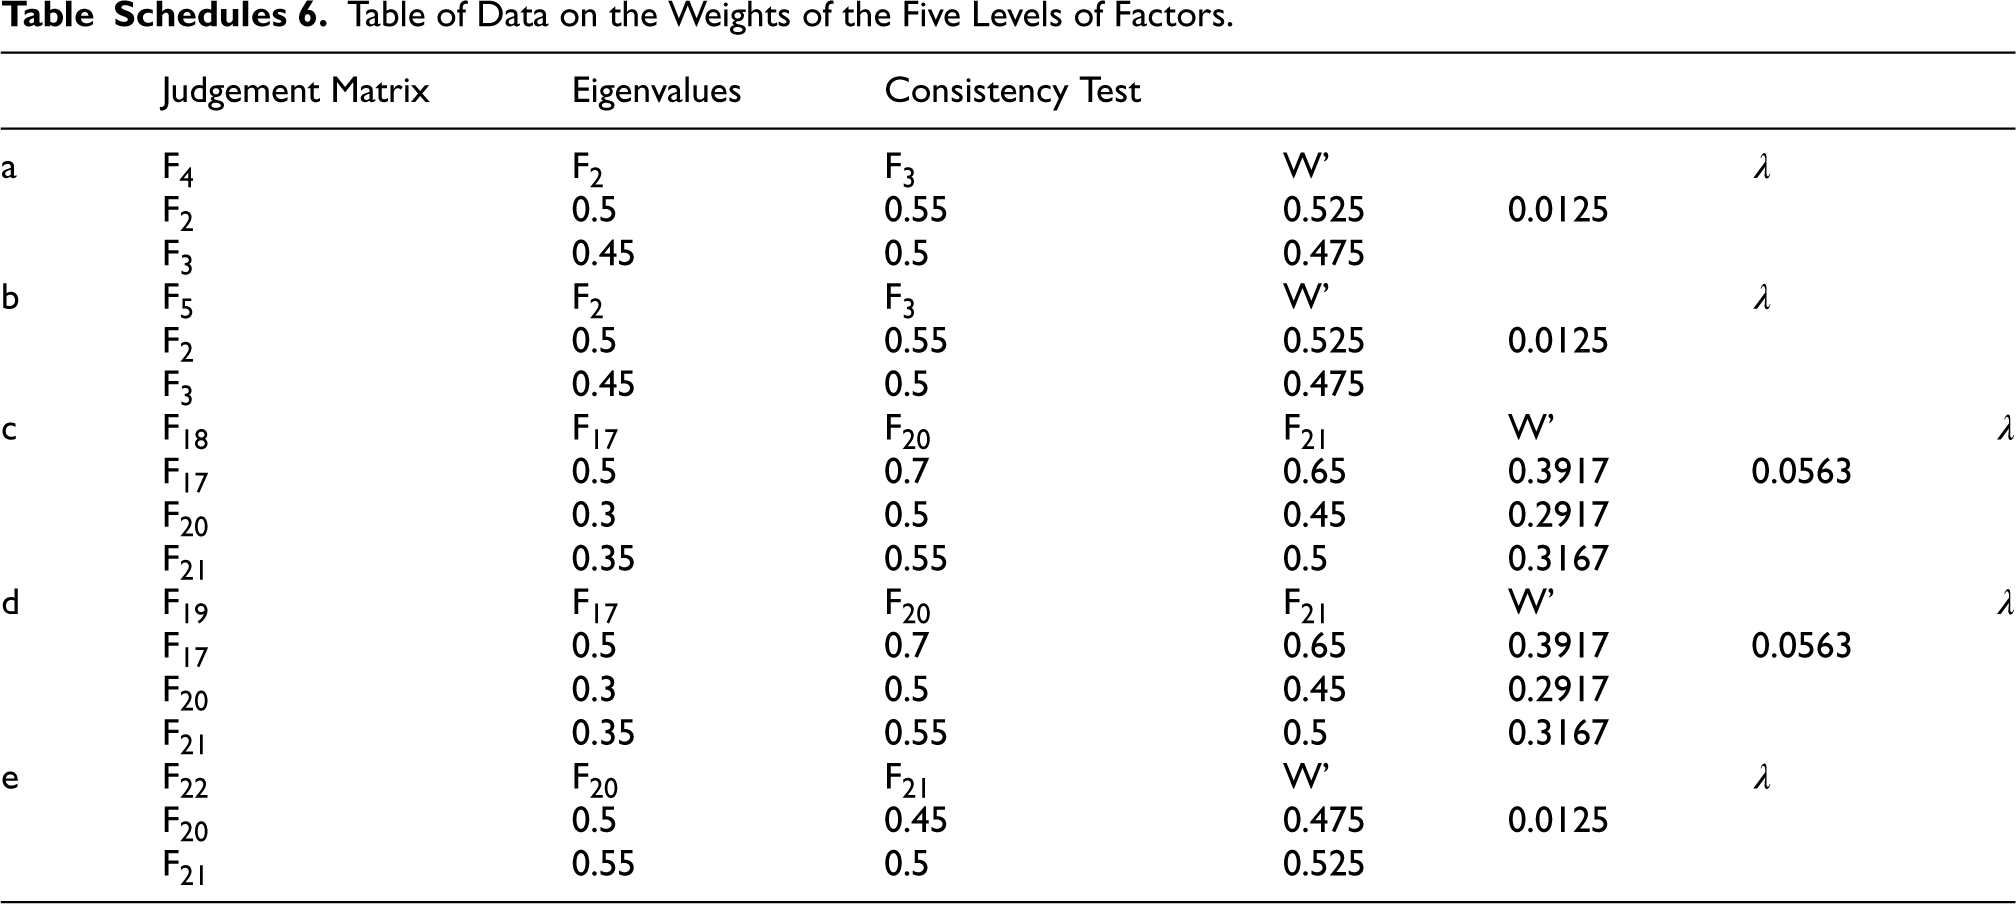
Table of Data on the Weights of the Five Levels of Factors.
Data Table for six Levels of Factor Weights.
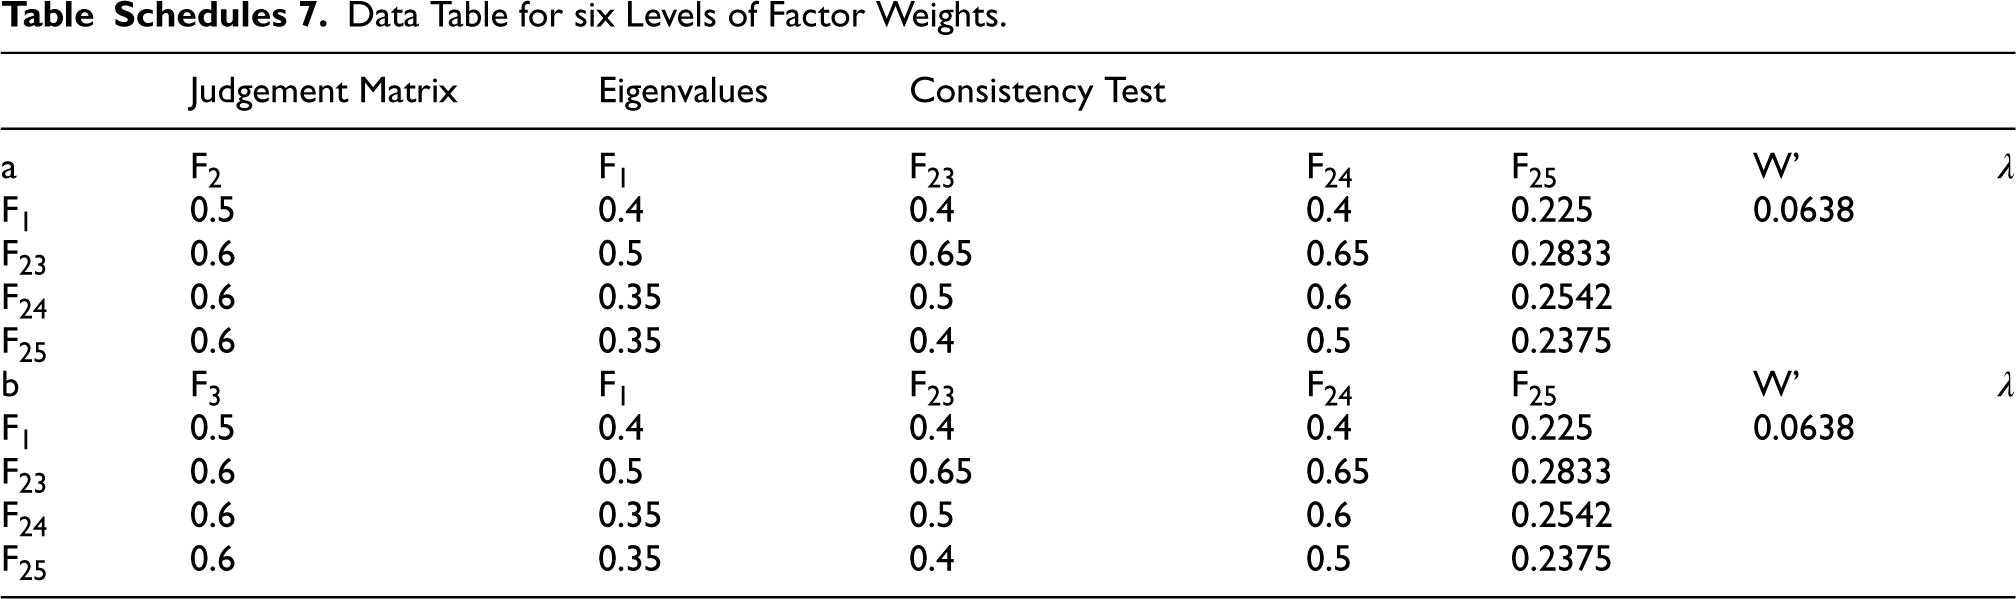
Following DEMATEL analysis, Interpretive Structural Modeling (ISM) was applied to identify the hierarchical relationships among risk factors. Using the total influence matrix T, a reachability matrix was derived with a predefined threshold λ, determined by the mean and standard deviation of T. Iterative filtering of the matrix yielded a six-level hierarchical structure.
To quantify the relative importance of each factor in the hierarchy, a Fuzzy Analytic Hierarchy Process (FAHP) was employed. Pairwise comparison matrices were constructed within and across levels using expert judgment, and consistency checks were applied. The resulting hierarchical weights (β) are presented in Schedules 2 through 7. Factors F12, F13, and F5 emerged with high hierarchical importance, further validating their central roles (Yan et al., 2016).
CN-Based Calculation of Risk Factor Clustering Coefficients
The complex network model, developed based on DEMATEL–ISM analysis consists of 28 directed nodes and 126 weighted edges, where each node represents a risk factor associated with fire and explosion hazards in the hydrogenation process. The directed edges capture the magnitude and direction of influence between pairs of factors. The network exhibits a high degree of interconnectivity and feedback, with several nodes exhibiting multiple outgoing and incoming links, highlighting their central role in the propagation of risk. Each node represents a secondary risk factor, and directed edges denote causal links derived from matrix T. For each node, in-degree, out-degree, and total degree were computed, indicating the intensity and direction of interconnections. The local clustering coefficient (θ) was then calculated using Equation (9), offering insight into the extent of neighborhood interconnectivity.
Bayesian Network Based Risk Evolution Path Analysis for Hydrogenation Process
Based on the hierarchical structure derived in Section 3.3, a Bayesian Network (BN) model was constructed to evaluate the probabilistic evolution of combustion and explosion risks in the diesel hydrogenation process (Figure 3). The nodes are arranged in a three-tier structure derived from ISM analysis: root nodes (e.g., F1, F23–F25) represent initiating causes, intermediate nodes indicate propagation pathways, and leaf nodes correspond to direct accident consequences. The top event (T = 1) denotes the occurrence of a fire or explosion. This diagram reflects the logical and probabilistic dependencies among risk factors. The conditional probability tables (CPTs) were populated through a combination of sensor data from field operations and expert elicitation, utilizing fuzzy set theory to mitigate subjectivity in qualitative estimates.
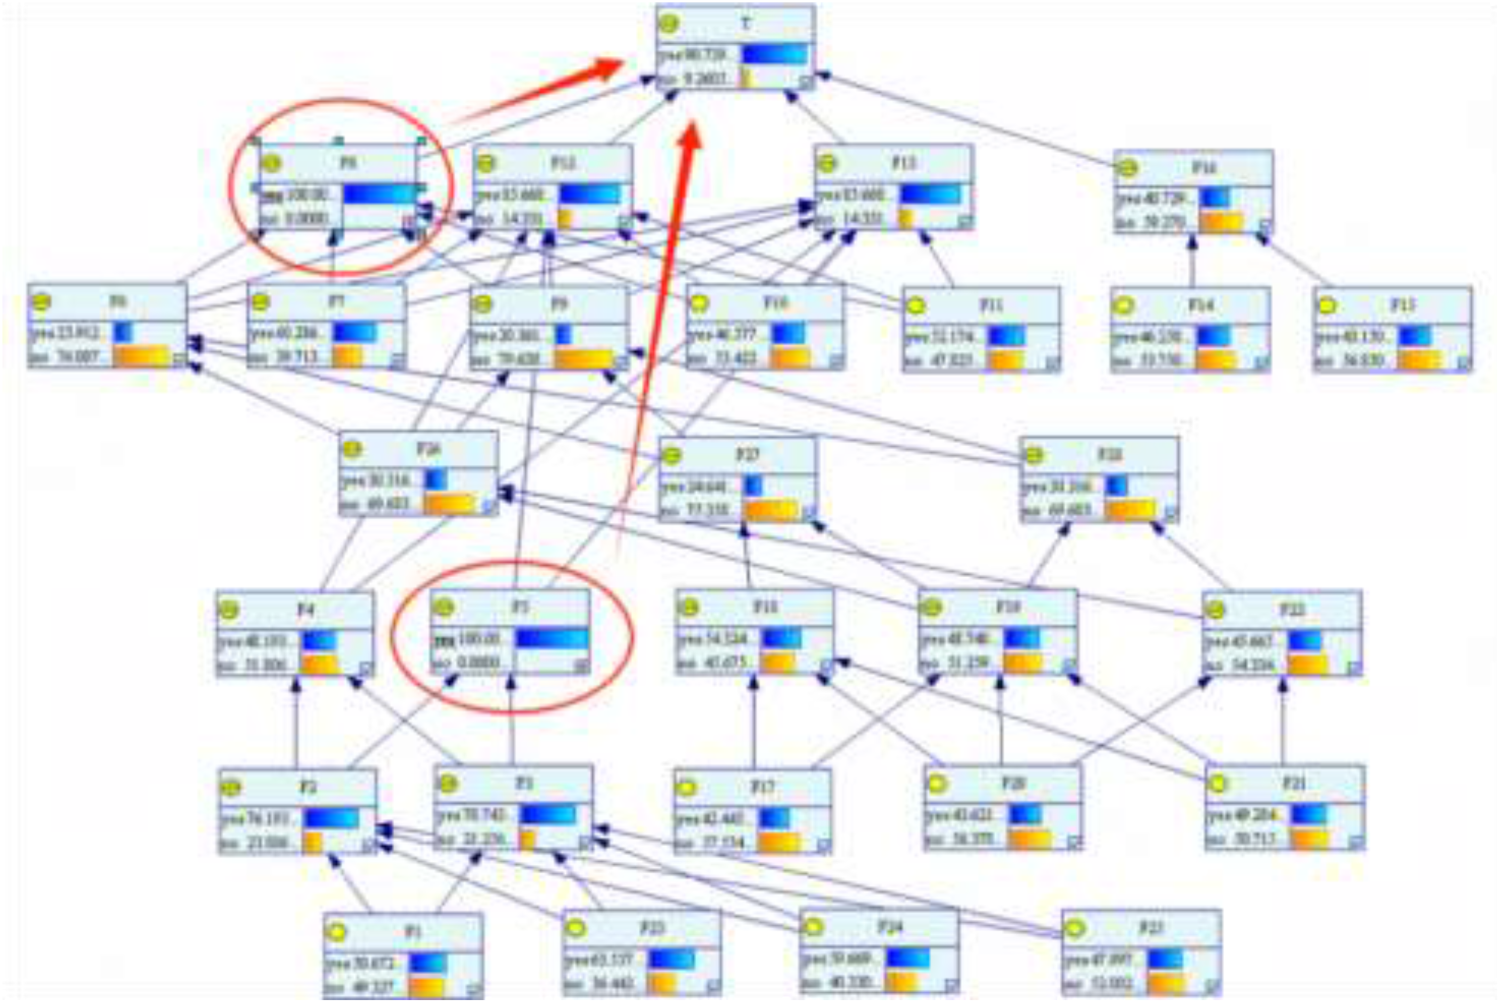
BN Modelling of Fire and Explosion Incidents in the Hydrogenation Process.
To assess the practical utility of the developed BN model, a historical incident was selected for validation. On March 12, 2018, a fire and explosion accident occurred in the feedstock buffer tank of a diesel hydrogenation unit at a petrochemical facility in Jiujiang, Jiangxi Province. According to the official accident investigation report, the event was triggered initiated by abnormal pressure fluctuations in the circulating hydrogen compressor. This initiated an interlock shutdown of the hydrogen feed pump, allowing high-pressure hydrogen to backflow into the feedstock buffer tank. The resulting overpressure breach led to ignition and explosion. This scenario corresponds directly to risk factors F5 (flow reversal at the feed pump) and F8 (compressor overpressure).
By updating the relevant nodes in the BN model to reflect this accident scenario, the posterior probability of the top event (T = 1) was recomputed using reverse inference. The resulting value of 90.74% indicates a high probability of accident occurrence under these conditions, demonstrating the model's effectiveness in replicating real-world accident dynamics. The posterior update is illustrated in Figure 5, which highlights the increased probabilities of upstream causal nodes following evidence injection.

Causality Diagram of Risk Factors.
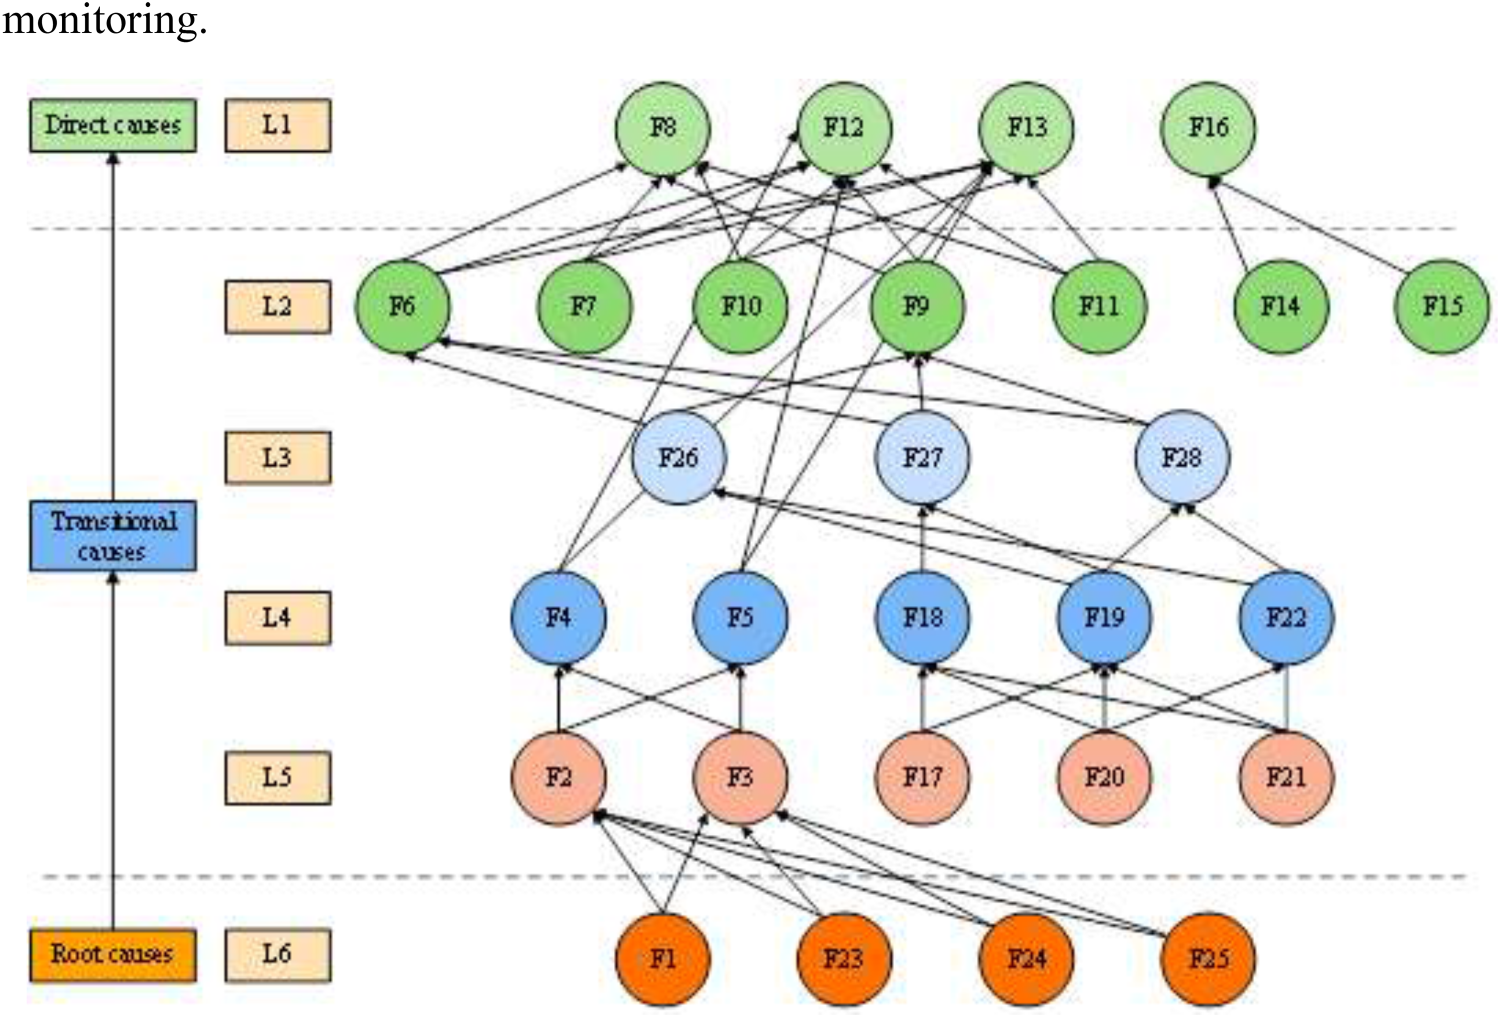
Multi-Level Hierarchical Structure Model of Risk Factors for Hydrogenation Plants Fire and Explosion Accidents.
Based on expert input, the direct influence matrix A was constructed, normalized, and extended into a total influence matrix T using matrix algebra (Table 2).
Combined Impact Matrix of Risk Factors T.
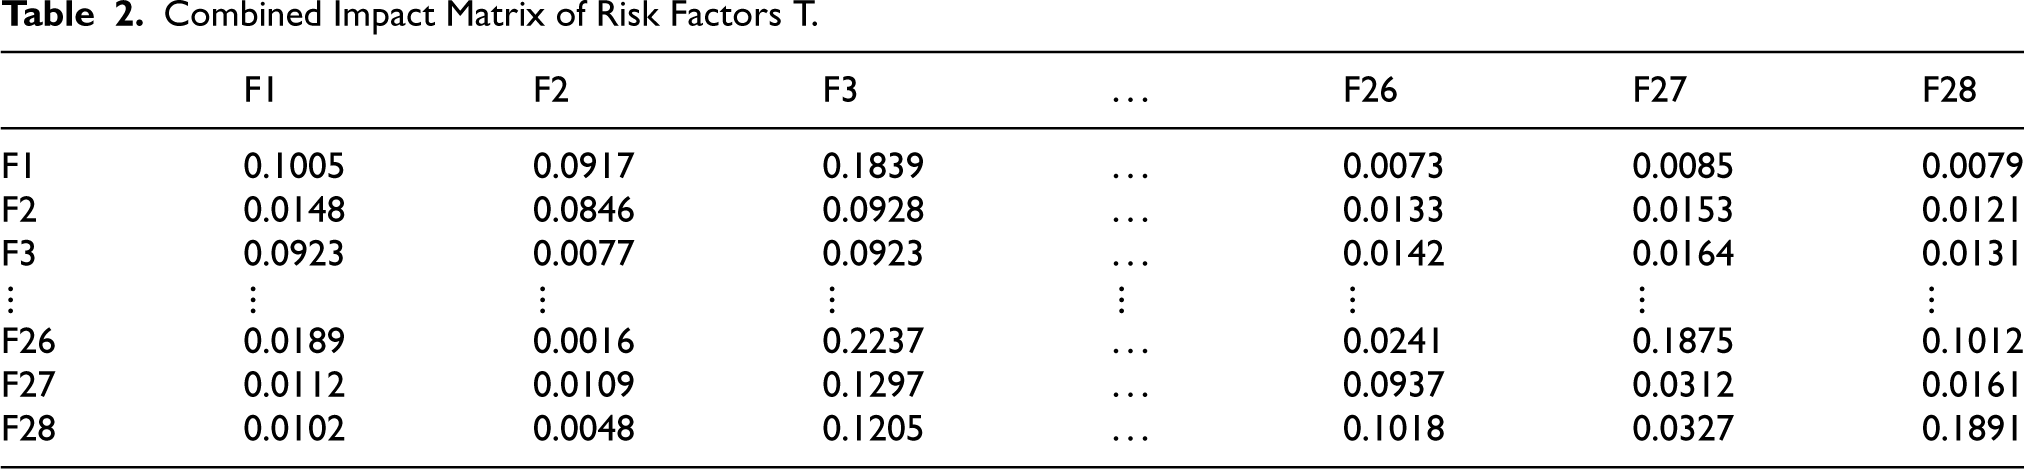
Combined Impact Matrix of Risk Factors T.
The results, summarized in Table 3, reveal that factors such as F12 (high pressure in R-101) and F13 (high differential pressure in R-101) exhibit the highest centrality, indicating their key role in propagating systemic risk. In contrast, factors like F7 and F11 possess low centrality, suggesting limited systemic influence.
Influenced Degree, Influencing Degree,Centrality and Causality Degree of Risk Factors.

The causal structure of the identified risk factors is visualized in Figure 4, which illustrates the direct and indirect influence pathways throughout the system. As shown, F12 (high pressure in hydrofinishing reactor R-101) and F13 (high differential pressure in R-101) exhibit the highest centrality values, identifying them as core nodes within the causal network. Their deviation has the potential to initiate multi-level cascading failures, particularly impacting downstream separation and compression units.
In contrast, factors such as F7 (low air feed flow) and F11 (low level in the hot high-pressure separator V1604) possess low centrality scores, indicating a limited impact on system-wide dynamics. The causality metric (R−C) further underscores the systemic risk posed by F23 (high pressure in new hydrogen compressor K101), which serves as a dominant source node capable of triggering chain reactions. Meanwhile, factors like F4 (low level in feedstock buffer tank) and F5 (reverse flow at feed pump outlet) exhibit high susceptibility (i.e., elevated Ci values), suggesting that they are easily perturbed by upstream anomalies and should be prioritized for real-time monitoring.
As shown in Figure 5, the hierarchical structure derived from the ISM model organizes the 28 risk factors into six distinct levels (L1–L6) according to their causal depth and propagation role. The lowest tier (L6) represents the root causes of hazardous events, such as upstream flow deficiencies (e.g., F1: low diesel flow) and compressor-related disturbances (e.g., F23–F25). These factors are latent in nature and exert indirect but long-range influence over downstream systems. In contrast, the highest tier (L1) includes direct triggering events, such as overpressure in the hydrofinishing reactor (F12) and flow countercurrent anomalies (F16), which are typically detected by alarms and serve as immediate precursors to accidents.
The intermediate levels (L2–L5) act as transitional causes, capturing the cascading interactions that transmit risk from root-level disturbances to surface-level failures. Notably, some factors such as F5 (feed pump flow reversal) and F22 (lean solvent pump backflow) appear in the middle layers and have both upstream and downstream connections, indicating their key roles in cross-level risk mediation. This layered structure reveals not only the vertical propagation logic but also the network centrality of certain nodes, offering a systemic perspective for prioritizing control measures.
As shown in Figure 6, F12 (Reactor High Pressure), F13 (Reactor Differential Pressure), and F5 (Flow Countercurrent at Feed Pump) are situated near the core of the network, suggesting their potential criticality. To quantify the structural importance of each node and identify key risk contributors, the clustering coefficient for each node is calculated using Equation (10). This provides a basis for understanding local density and identifying tightly coupled risk clusters within the system (Table 4).
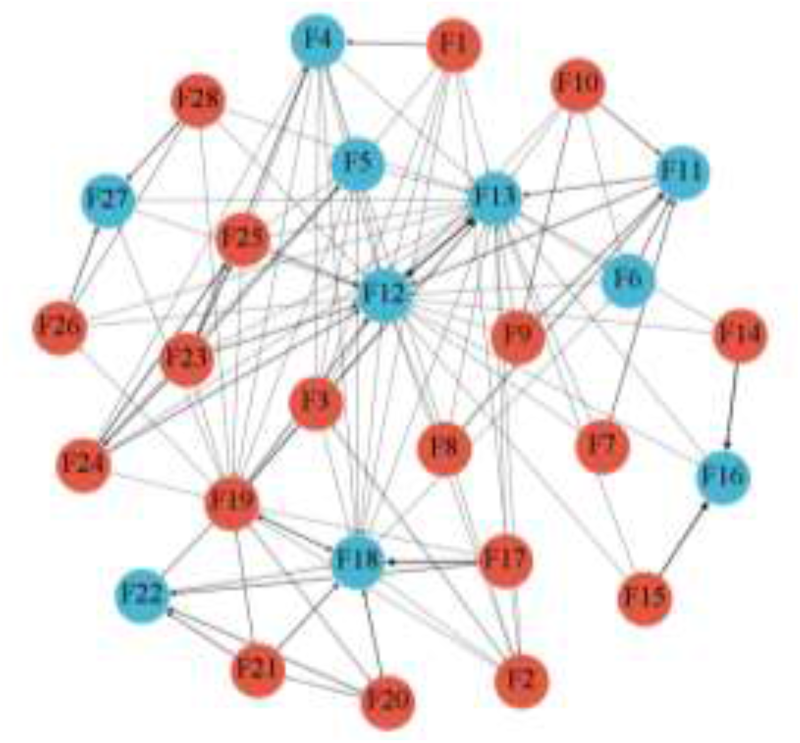
Cause-Effect Diagram of Risk Factors for Fire and Explosion Accidents at Hydrogenation Plants.
Centrality,Hierarchical Weights,Clustering Coefficient,Comprehensive Weights of Risk Factors.
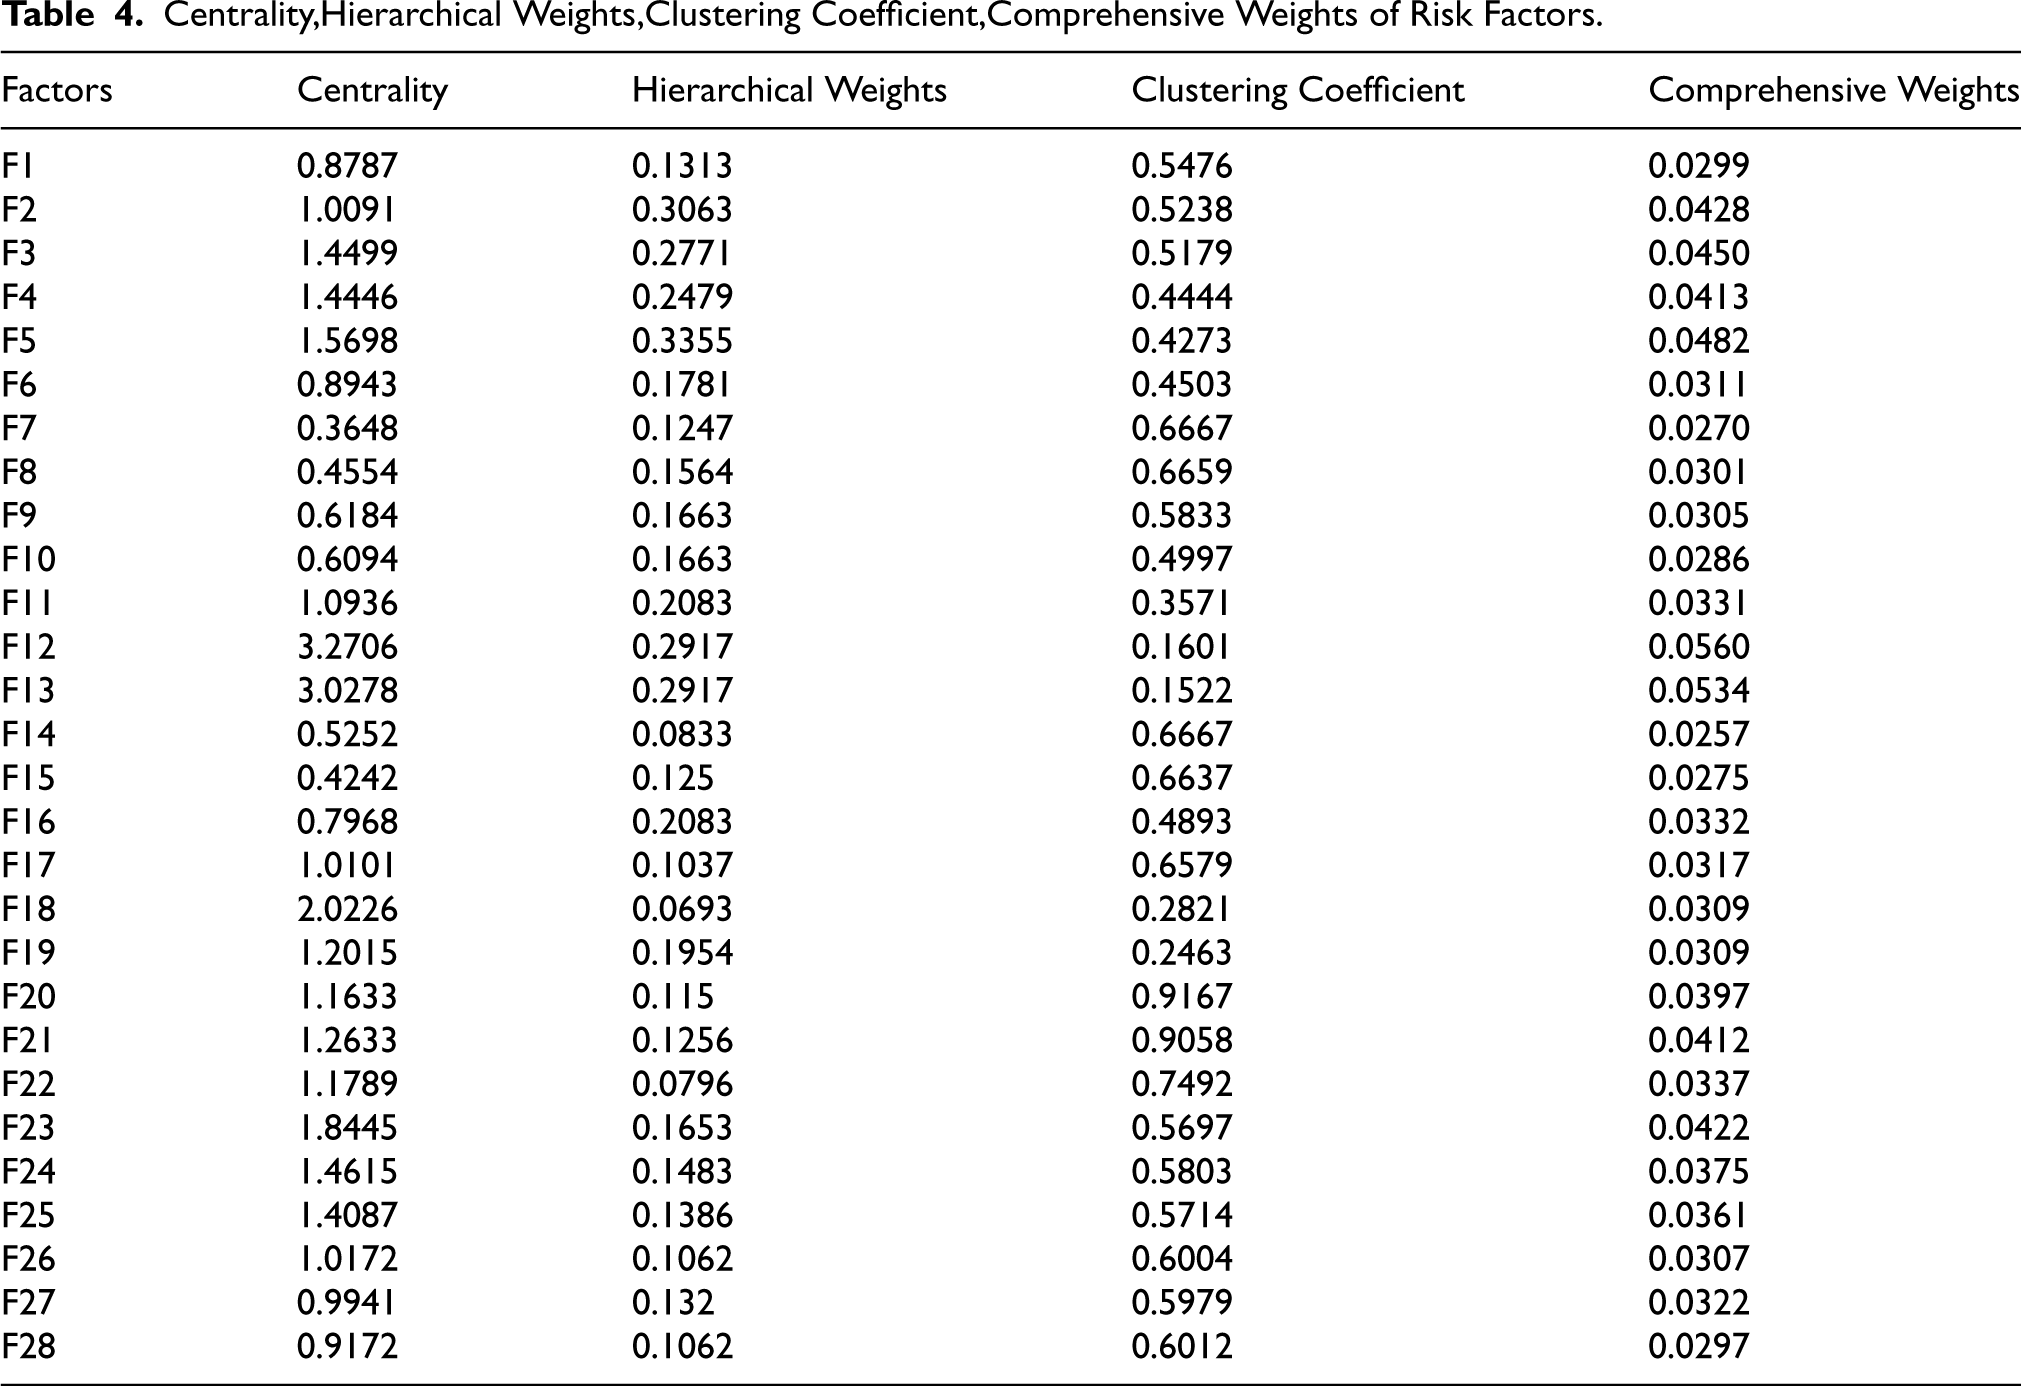
The comprehensive weights of each risk factor—incorporating centrality (α), hierarchical weight (β), and clustering coefficient (θ)—was calculated using Equation (10), and the results are summarized in Table 3. To enable a more intuitive comparison of the risk factor weights, the results were visualized, as shown in Figure 7. The analysis identifies F12 and F13 as the most influential risk sources, with integrated weights of 0.0560 and 0.0534, respectively. These values affirm the dominant role of reactor pressure control in ensuring system integrity.
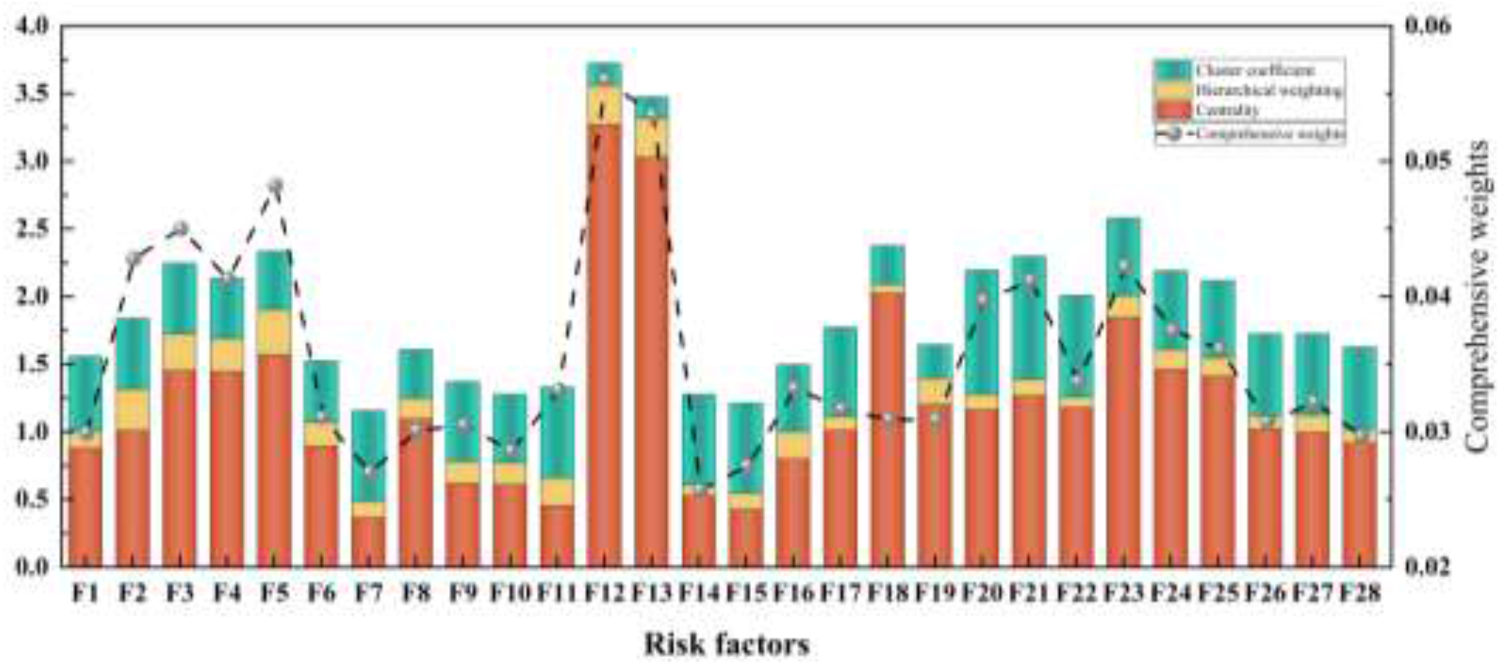
Combined Importance of Risk Factors.
Other significant contributors include F5 (reverse flow at the reaction feed pump) and F23 (high pressure in K101 compressor), with respective scores of 0.0482 and 0.0422. These findings emphasize that both pressure-related and flow-related deviations represent critical failure modes that must be addressed through interlock logic and predictive maintenance.
As shown in Figure 8, based on the BN structure developed in Section 3.2.4, a top event (T = 1) representing a fire/explosion is assumed to have occurred, and evidence is injected into the network. The posterior probabilities of related risk factors (e.g., F5, F8, F12) are recalculated through reverse inference. The color-coded bars indicate the variation in probability before and after the evidence update, thereby highlighting the most causally influential factors. Notably, F12 and F13 exhibited the largest increases in posterior probability, reinforcing their causal dominance in triggering top-level failures. This probabilistic insight complements the structural centrality results and confirms the need for continuous monitoring and control of reactor operating parameters, especially under transient or upset conditions.
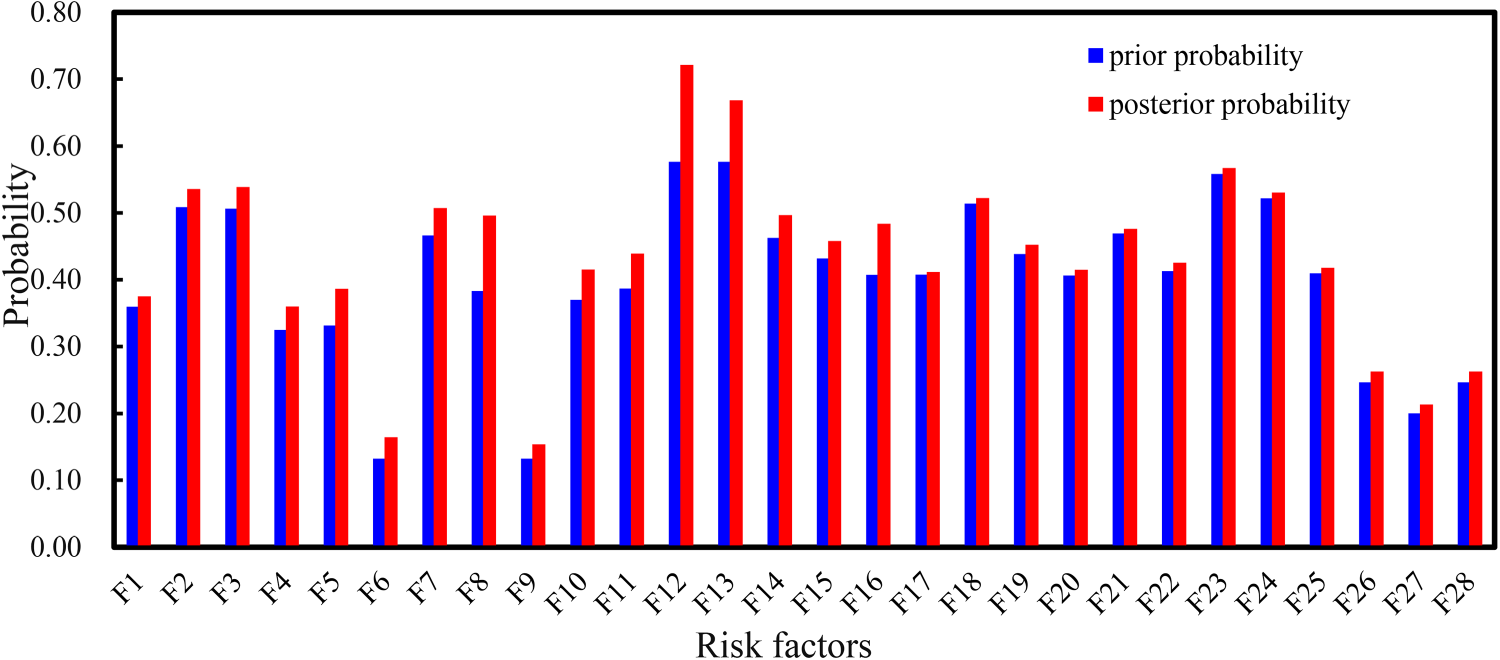
A Priori and a Posteriori Probabilities of Risk Factors.
The Rate of Variation (RoV) was computed for each risk factor using Equation (11), quantifying the relative sensitivity of individual variables to changes in the target event's probability. As illustrated in Figure 9, several factors exhibit RoV values above the threshold of 2.00, including F6, F8, and F12. These high-RoV factors exert disproportionate influence on system behavior, meaning that minor deviations in their state can lead to significant shifts in the likelihood of fire or explosion scenarios.

Sensitivity of Risk Factors.
Such findings underscore the importance of prioritizing these variables for enhanced monitoring strategies. From an engineering control perspective, they represent optimal nodes for the deployment of redundant sensors, dynamic alarm thresholds, and predictive diagnostics. Moreover, integrating high-RoV nodes into emergency response logic and real-time Bayesian updating could improve the system's resilience to evolving failure conditions.
As shown in Table 5, the Sensitivity-Importance (SI) values of the risk factors were calculated using Equation (12). The SI values of the primary-level risk factors, representing equipment-level risks, were obtained by summing the SI values of the corresponding secondary risk factors.The results indicate that secondary risk factors with higher SI values are primarily concentrated in high-risk equipment, such as the hydrofinishing reactor R-101, the recirculating hydrogen compressor K102, and the reaction feed pump P101. These components are associated with key risks, including abnormal reactor pressures, flow reversal in pumping systems, and compressor parameter fluctuations. Furthermore, the high SI values of F12 and F13 reinforce previous findings on the sensitivity of the hydrofinishing reactor R-101, confirming that loss of pressure control constitutes a major accident risk in hydrogenation units. This conclusion aligns with existing literature, further validating the critical role of precise pressure regulation in maintaining system stability and mitigating accident risks (Dang et al., 2024).
SI index of Risk Factors.

SI index of Risk Factors.
As shown in Figure 10, the Sensitivity-Importance matrix is spilt into four groups which are corresponding to four classes by three contour lines of SI (Ma et al., 2022). The yellow contour at SI = 0.0034 represents the average SI value of all risk factors. By further dividing the factors into two subgroups and averaging their SI values, the red contour at SI = 0.007 and the blue contour at SI = 0.0014 were obtained. Three contours divide the matrix into risk priority zones: SI > 0.007 (high-risk areas), 0.0034 < SI ≤ 0.007 (medium-high risk area), 0.0014 < SI ≤ 0.0034 (medium-risk area), and SI ≤ 0.0014 (low-risk areas). Key factors (e.g., F12, F13) appear in the high-risk areas. This matrix offers a dual-metric basis for prioritizing control interventions.
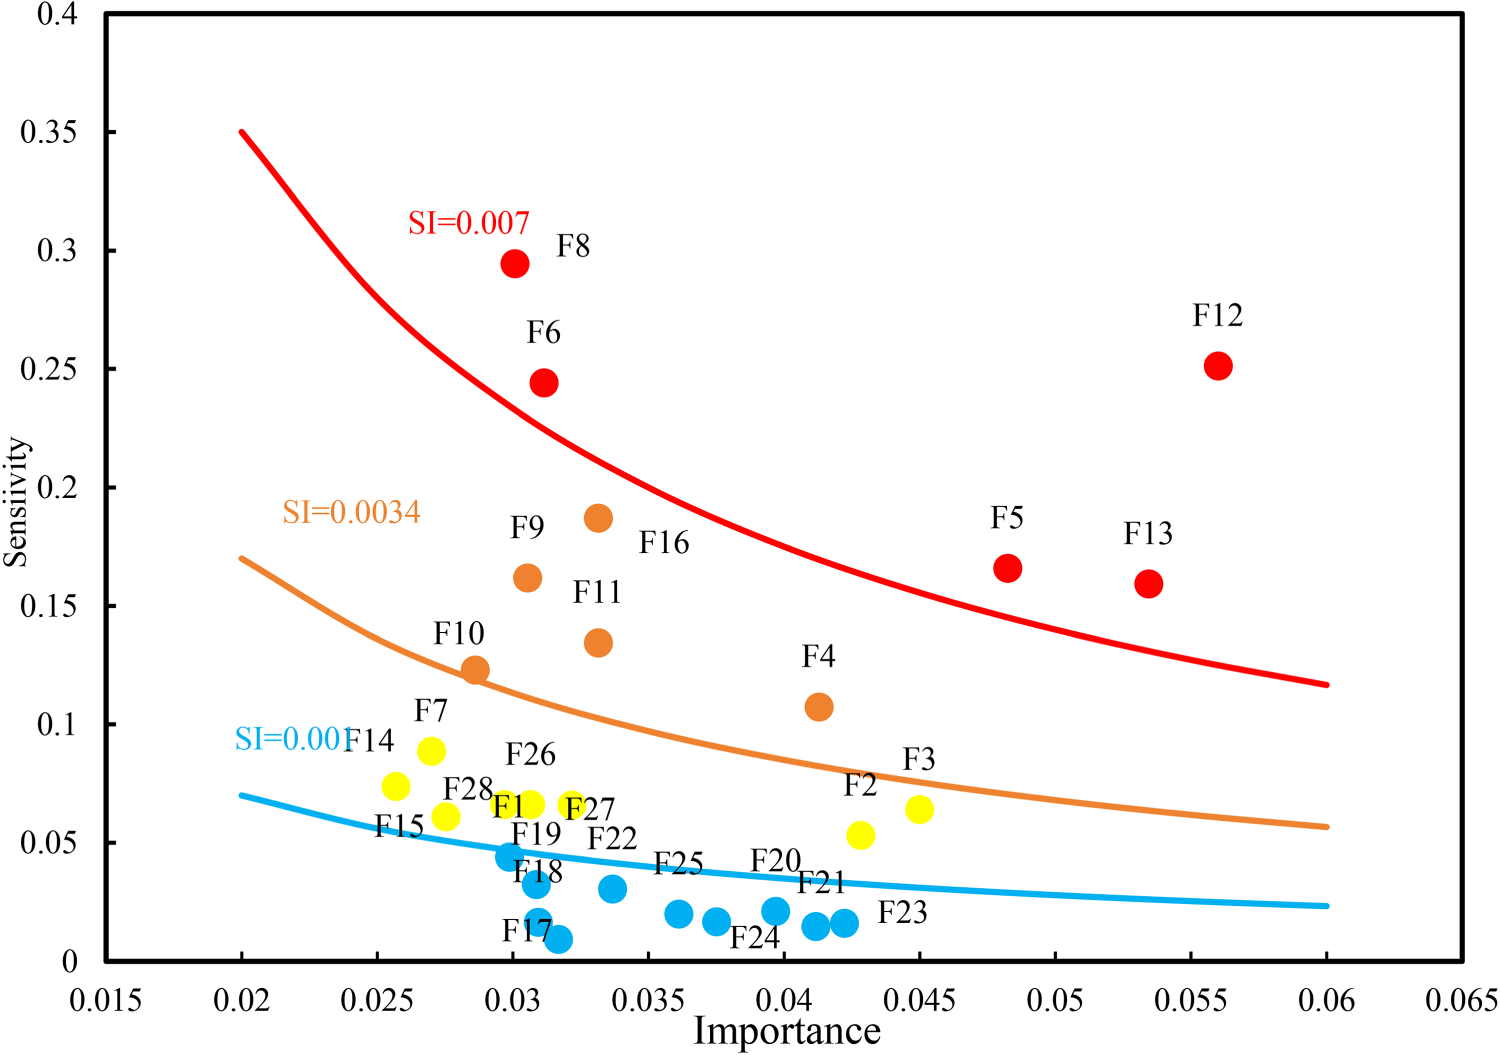
Importance-Sensitivity Matrix.
The results indicate that F12 (high pressure in hydrofinishing reactor R-101) has the highest SI value, indicating its dominant contribution to systemic risk. Factors like F17, F18, and F21 demonstrated the lowest SI values, implying limited influence on risk propagation. The SI matrix provides a quantitative foundation for prioritizing risk control measures. High-SI nodes should be equipped with real-time monitoring and fault-tolerant design elements, including redundant sensors, dynamic alarm thresholds, and periodic simulation testing. This dual-metric approach offers a more robust decision-making basis than relying solely on structural centrality or expert intuition.
This study developed an integrated DEMATEL–ISM–CN–BN framework to analyze the coupling mechanisms and dynamic evolution of fire and explosion risks in hydrogenation processes. By combining causal structure modeling, hierarchical decomposition, network topology analysis, and probabilistic inference, the framework effectively identified key risk factors such as reactor pressure anomalies and feed pump flow reversals. A composite weighting system and sensitivity–importance (SI) analysis enabled the prioritization of critical nodes, providing a quantitative basis for targeted risk control. The Bayesian model accurately reproduced a historical accident scenario, demonstrating strong predictive validity. The Sensitivity–Importance (SI) matrix provided a quantitative basis for prioritizing control strategies. Factors with Hydro-finishing Reactor R-101 High Pressure (F12), Hydro-finishing reactor R-101 differential pressure high (F13)—were identified as critical control targets requiring enhanced monitoring and fail-safe designs. This approach addresses limitations in conventional static assessments and offers practical guidance for optimizing safety strategies in complex chemical systems.
The proposed DEMATEL–ISM–CN–BN framework offers a structured approach to risk governance in hydrogenation systems. By identifying causally critical, hierarchically dominant, and topologically central nodes, the model enables targeted management of high-risk components such as reactor pressure and compressor failures. The SI matrix supports the prioritization of safety interventions, guiding the optimization of alarm thresholds and maintenance strategies. The Bayesian inference mechanism further enhances scenario simulation and emergency planning through probabilistic reasoning, aiding both pre-incident decision-making and post-incident analysis. Future work will focus on improving computational efficiency and automation to enhance the framework's industrial scalability.
Footnotes
Abbreviations
Acknowledgements
This work was supported by the TaiShan Scholar Youth Expert (tsqn202306132), Ministry of Education China University of Petroleum (East China) Independent Innovation Research Program Platform Project (24CX02022A).

Funding
The authors disclosed receipt of the following financial support for the research, authorship, and/or publication of this article: This work was supported by the Independent Innovation Research Program Platform Project, TaiShan Scholar Youth Expert, (grant number 24CX02022A, tsqn202306132).
Declaration of Conflicting Interests
The authors declared no potential conflicts of interest with respect to the research, authorship, and/or publication of this article.