
Abstract
Background
Bradykinesia, a hallmark motor symptom of Parkinson's disease, is difficult to quantify accurately using clinical scales due to coarse nature of the scales and their limited sensitivity to change. VisionMD is an open-source platform for video-based quantification of bradykinesia that complements clinical scale evaluations.
Objectives
To evaluate whether VisionMD video-based digital measures derived from short Finger Tapping videos can detect longitudinal changes in bradykinesia.
Methods
We analyzed Finger Tapping task videos from 36 individuals with Parkinson's disease at two times points, separated by an average of 1.6 years. Motor function was assessed using the Finger Tapping clinical score and video-based digital measures provided by VisionMD which capture movement speed and timing. Longitudinal changes were assessed using ordinal linear models for clinical scores and linear mixed-effects models for digital measures. Correlations between clinical scores and digital measures were also examined.
Results
Digital measures were significantly correlated to Finger Tapping clinical scores. While overall motor function worsened over time, these changes were not reflected by the Finger Tapping score. In contrast, digital measures derived from Finger Tapping videos detected longitudinal declines in movement speed, revealing longitudinal changes in bradykinesia. When stratified by baseline severity, distinct patterns emerged, highlighting heterogeneity in bradykinesia progression in PD.
Conclusion
VisionMD's video-based digital measures captured subtle, domain-specific progression of bradykinesia not detected by clinical scores. VisionMD provides an objective tool to monitor PD progression and disentangle the multidimensional components of bradykinesia. Future studies should focus on validating these findings in larger cohorts and from home-based recordings.
Plain language summary
Using simple videos to track changes in hand movement in Parkinson's disease over time
People with Parkinson's disease often experience “bradykinesia,” which means their movements become slower and less controlled. Doctors usually rate bradykinesia by watching patients perform simple tasks, such as tapping their fingers. These ratings use a small 0–4 scale, which can miss small but important changes, especially early in the disease. Better tools are needed to track how symptoms change over time.
In this study, we tested whether short videos of finger tapping could help detect subtle changes in movement. We analyzed videos from 36 people with Parkinson's disease recorded at two time points, separated by an average of about 1.6 years. Each video was processed using VisionMD, an open-source computer program that measures how fast and how consistently a person taps their fingers.
We examined how the video-derived measurements related to the clinical finger tapping score and how both changed over time. While overall Parkinson's motor symptoms worsened, the clinical finger tapping score did not show meaningful change. In contrast, the video-based measures detected slower tapping speed and changes in tapping rhythm, revealing subtle progression that was not reflected in the clinical score.
We also examined whether changes differed depending on how impaired someone was at the beginning. We found that people who started with no visible finger tapping problems showed the clearest decline in their video-based measures. Those who began with more noticeable symptoms showed different patterns, highlighting that progression can look different across individuals.
Our results suggest that simple videos, processed with accessible tools like VisionMD, may offer a complementary and objective way to track changes in bradykinesia. This approach could help doctors and researchers monitor Parkinson's disease more accurately and may support future use of video-based assessments at home.
Keywords
Introduction
Bradykinesia, a hallmark motor symptom of Parkinson's disease (PD), is defined as slowness of movement often accompanied by a progressive reduction in speed and amplitude during repetitive movements. Detecting bradykinesia and quantifying its severity plays a critical role in diagnosis and disease progression monitoring.1–3 Clinical assessment of bradykinesia typically relies on visual ratings by a neurologist who evaluates patients using standardized clinical scales such as the Movement Disorder Society-Sponsored Unified Parkinson's Disease Rating Scale (MDS-UPDRS). 1 During clinical assessment of bradykinesia, clinicians observe patients performing standardized motor tasks consisting of simple, repetitive movements (e.g., finger tapping, hand opening and closing, hand pronation-supination, toe tapping) and assign a score from 0 to 4, with 0 indicating normal function, based on the MDS-UPDRS criteria.
The MDS-UPDRS and similar scales suffer from important limitations. For instance, assessments are influenced by the rater's experience and interpretation, resulting in low to moderate inter-rater reliability, indicating that different clinicians may assign a different score to the same patient.4–6 Moreover, bradykinesia is increasingly recognized as a multifaceted motor disorder, referred to as the “bradykinesia complex,” encompassing motor aspects such as slowness of movement, hypokinesia, the sequence effect (i.e., amplitude and/or speed reduction during repetitive movements), hesitations, and akinesia. 7 These motor aspects vary across disease stages, respond differently to therapies, and might be important indicators of disease severity.7,8 Yet, these motor aspects cannot be adequately captured by the coarse 0–4 score employed in clinical evaluations. 7 Finally, the MDS-UPDRS-III may not be sensitive enough to detect subtle longitudinal changes in disease severity. 9
Digital health technologies (DHTs), including wearable sensors and video-based systems, offer new opportunities to quantify and track bradykinesia addressing some of the limitations encountered in clinical scales. 10 DHTs offer higher sensitivity to subtle changes in motor function and temporal resolution than clinical scales.11–15 However, most existing DHTs solutions rely on wearable sensors, which might face barriers related to scalability, costs, implementation in clinical or home setting, and interpretability. These challenges make wearable systems less feasible for widespread adoption both in clinic and home environments.
Video-based systems have emerged as a feasible alternative to wearable sensors for assessment of bradykinesia in PD.16,17 Video assessments address some of the limitations of wearables: they require commonly available devices for data acquisition (including standard smartphone cameras without specialized hardware) and use a single device to capture the movement of multiple body segments.18–20 Yet, despite the potential of video-based systems to support the assessment and monitoring of bradykinesia in PD, no study to date has employed this technology to measure longitudinal changes in bradykinesia in PD, leaving a critical gap in the development of scalable tools for disease progression monitoring.
This study aims to fill this gap by introducing a pipeline to monitor the longitudinal progression of bradykinesia in PD from videos. Using VisionMD, an open-source software platform for video-based kinematic analysis, 21 we analyzed videos of 36 people with PD performing one MDS-UPDRS motor task used to quantify upper limb bradykinesia: Finger Tapping (FT, item 3.4 of the MDS-UPDRS III) at two time points: baseline and after one or two years. Our objectives were to examine the relationship between video-based digital measures and clinical scores, evaluate their ability to detect changes in bradykinesia over time, and to examine whether the digital measures provided by VisionMD vary as a function of baseline motor severity, as has been suggested in previous cross-sectional studies. 22
Methods
Participants
This study retrospectively analyzed data collected as part of two NIH-sponsored studies23,24 Diagnosis was confirmed by a movement disorders specialist using the MDS clinical diagnostic criteria. 3 Participants were recruited from the Norman Fixel Institute for Neurological Diseases at the University of Florida. Subjects with PD were eligible to participate if their disease duration was ≤ 5 years and demonstrated a Hoehn & Yahr stage ≤ 2 at the baseline visit. Participants were ineligible if they had prior history of stroke or brain tumor, had an implanted deep brain stimulation device or aneurysm clip, or were pregnant or nursing.
Participants were video recorded performing the MDS-UPDRS-III at two time-points: baseline (T0) and during a follow-up visit at either one (N = 16) or two years (N = 20) later (T1). Participants were recorded after an overnight withdrawal of dopaminergic medication. A trained clinician guided participants through the motor tasks and assessed their motor symptoms using the MDS-UPDRS-III criteria. Videos were recorded with a standard video camera at a resolution of 1920 × 1080 and a frame rate of 30 or 60 fps. Video segments corresponding to the FT task for the left and right hands were manually parsed. For this task, participants were instructed to tap their index finger and thumb as fast and as widely as possible for 10 taps, following MDS-UPDRS-III guidelines.
All recordings were conducted at the University of Florida (Gainesville, Florida, USA). The study procedures were approved by the local Institutional Review Board. Written informed consent was obtained from all patients before participating in the study in accordance with the Declaration of Helsinki.
Motor performance outcomes
For each video recording of the FT task, we quantified motor performance using two primary outcomes: FT clinical score and video-derived digital measures.
FT clinical score
Finger tapping was scored as part of the standard in-person MDS-UPDRS-III examination by an MDS-UPDRS-certified rater at the study visit. Two additional MDS-UPDRS-certified raters independently scored the parsed finger-tapping video clips offline. Offline raters were blinded to visit timepoint and to other raters’ scores.
The final FT clinical score used in analyses was based on the majority consensus across the three raters. In instances where all three raters provided different scores, the median score was used. The baseline FT clinical score (i.e., at T0) was used to stratify participants into three severity groups: PD0 (baseline score = 0), PD1 (baseline score = 1), and PD2 (baseline score = 2). Only three videos had baseline score of 3 and were not used for stratification. No videos with a baseline FT clinical score of 4 were observed.
Digital measures
To extract kinematic information from each FT video, we used VisionMD, an open-source software platform for semi-automated video-based analysis of MDS-UPDRS motor tasks. 21 VisionMD uses machine learning algorithms to estimate hand and body pose and compute kinematic features from videos. Specifically for the FT task videos, VisionMD localized the position of the tips of the index finger and the thumb. The Euclidean distance between the index and thumb fingers was then estimated at each frame, and the per-frame distance was converted into a kinematic time series representing the movement dynamics. The time series was normalized by the size of the index finger, defined as the maximum Euclidean distance between the index fingertip and metacarpal when the finger is fully extended. A custom peak detection algorithm was used to identify movement cycles (opening and closing phases). Afterwards, VisionMD computed a set of digital measures representing movement amplitude, speed, timing, and variability. Some of these measures have been shown to reflect disease severity and treatment effects in Parkinson's disease.21,22,25,26
In this study, we focused on six digital measures that were found to be the responsive to levodopa replacement therapy. 25 These measures quantify movement speed (Mean Speed, Mean Opening Speed, and Mean Closing Speed) and movement timing (Frequency, Standard Deviation and Range of Cycle Duration). A full description of these digital measures and the underlying algorithms can be found in our previous work.21,25
Statistical analysis
Participants’ motor function, measured by the MDS-UPDRS-III score, bradykinesia subscore (sum of items 3.4–3.8 and 3.14 of the MDS-UPDRS-III), and Hoehn & Yahr stage, was compared between baseline (T0) and follow-up (T1) using paired t-test for normally distributed data and Wilcoxon signed-rank test for non-normally distributed data. Effect sizes were also estimated as Cohen's d or rank-biserial correlations for normally and non-normally distributed data respectively. Normality of distributions was assessed using the Shapiro–Wilk test. Statistical significance was set at p < 0.05.
To evaluate whether VisionMD digital measures reflect disease severity, we performed a non-parametric Spearman correlation between each digital measure and clinical ratings, including the FT clinical score, the bradykinesia subscore, and the total MDS-UPDRS-III score. To control for multiple comparisons, the Benjamini–Hochberg procedure was applied to reduce False Discovery Rate (FDR), and both uncorrected and FDR-adjusted p-values were reported.
Longitudinal changes in FT performance were evaluated separately for FT clinical scores and digital measures.
FT clinical scores
Longitudinal progression was analyzed using ordinal regression models with Time (in years from baseline) as the primary fixed effect, and age, sex, most affected side status (MAS; coded 1 if the hand corresponded to the participant's most affected side at baseline, 0 otherwise), and baseline disease duration included as covariates. Models were repeated within each baseline PD group (PD0, PD1, or PD2). The Time coefficient and associated p-value represent the estimated longitudinal change in FT scores.
Digital measures
Longitudinal progression was evaluated using linear mixed-effects models. Each hand was treated as an independent sample with repeated measures at T0 and T1 (the independence of digital measures for the left and right hands was verified using Spearman correlation), and hand-specific random intercepts and slopes were included to account for baseline differences and hand-specific variation in longitudinal change. The primary fixed effect was Time (in years from baseline), with additional covariates including sex, age at baseline, MAS, and baseline disease duration. Digital measures with a Time coefficient significantly different from zero were interpreted as demonstrating longitudinal change. To control for multiple comparisons, the Benjamini–Hochberg procedure was applied to reduce False Discovery Rate (FDR), and both uncorrected and FDR-adjusted p-values were reported. To assess whether progression-sensitive measures varied by baseline finger tapping severity, we repeated this analysis separately for each baseline PD group (PD0, PD1, or PD2).
In addition, we conducted an exploratory analysis comparing longitudinal changes between the most affected side (MAS) and least affected side (LAS) across the full cohort using the same linear mixed-effects modeling framework.
To quantify the longitudinal effect in practical terms, we calculated the percentage change in each digital measure across visits using the following formula:
25

We additionally conducted an exploratory analysis to assess the association between changes in mean cycle duration and changes in its variability (SD) from baseline to follow-up using Pearson correlation.
Data sharing
The data that support the findings of this study are available from the corresponding author upon reasonable request. VisionMD is publicly available at www.VisionMD.ai.
Results
Participant demographics
Table 1 summarizes the clinical and demographic data. Between T0 and T1, motor symptom severity worsened significantly, as reflected by a significant increase in the MDS-UPDRS-III total score (25.2 ± 12.2 vs. 32.4 ± 10.5, p < 0.001). In contrast, neither the Bradykinesia subscore (12.6 ± 7.0 vs. 13.8 ± 6.2, p = 0.258) nor the FT clinical score (median [range]: 2.0 [0.0, 3.0] vs. 2.0 [0.0, 3.0], p = 0.123) changed significantly between visits, indicating that these scores did not drive the overall increase in disease severity captured by the broader MDS-UPDRS-III score.
Participants demographics and statistics.
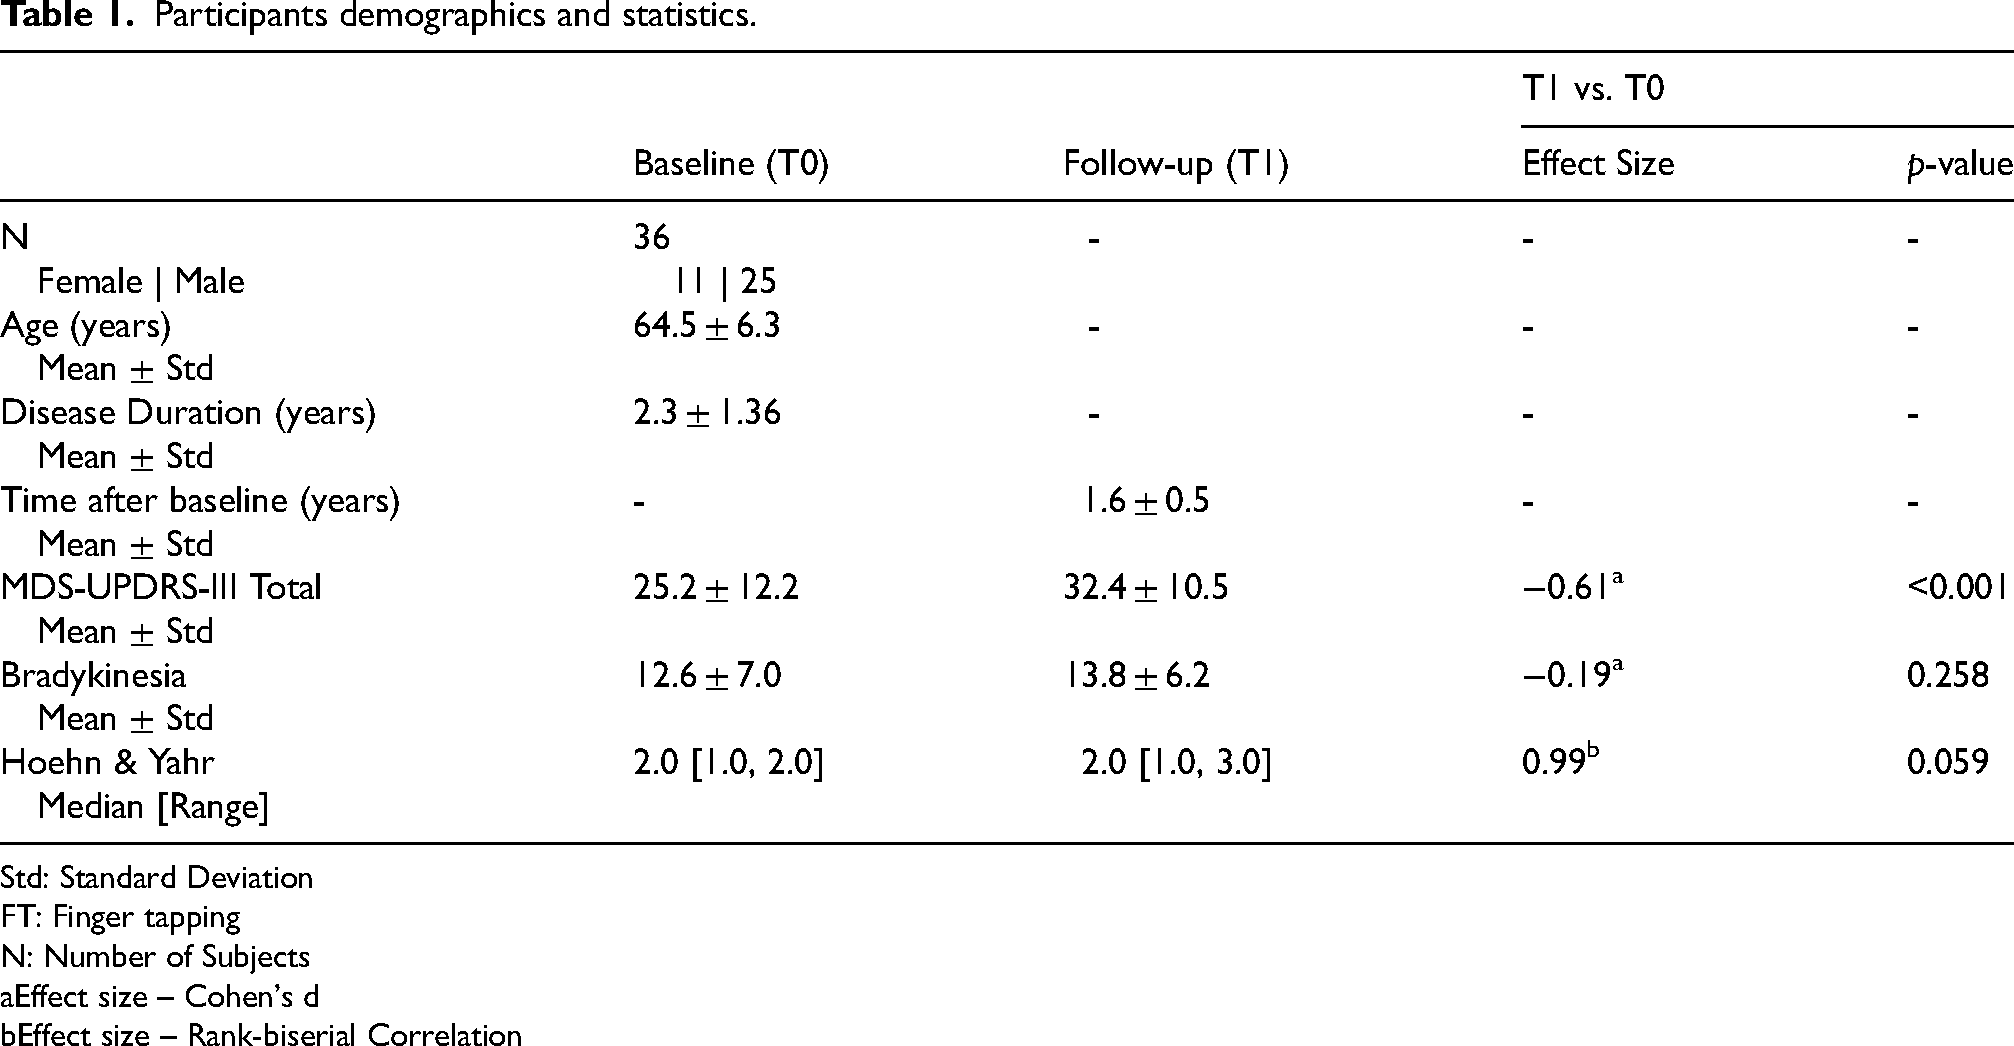
Std: Standard Deviation
FT: Finger tapping
N: Number of Subjects
Effect size – Cohen's d
Effect size – Rank-biserial Correlation
Digital measures reflect clinical performance
Each participant provided four FT videos (left and right hands at baseline and follow-up), resulting in a total of 144 videos. Baseline left-right correlations for digital measures and the FT clinical scores were nonsignificant (Supplementary Table 1), supporting the treatment of each hand as an independent sample. Videos were processed using VisionMD to extract digital measures of movement speed and timing. Supplementary Table 2 shows the mean ± standard deviations for each measure provided by VisionMD at baseline (T0) and follow-up (T1).
Figure 1 presents scatter plots with smoothed monotonic trend lines illustrating the relationship between digital measures and FT clinical scores. There were significant negative correlations between FT clinical scores and speed-related measures, including Mean Speed (ρ = −0.364, p-adjusted < 0.001), Mean Opening Speed (ρ = −0.299, p-adjusted < 0.001), and Mean Closing Speed (ρ = −0.389, p-adjusted < 0.001). In addition, timing variability measures showed stronger positive correlations, including Std Cycle Duration (ρ = 0.434, p-adjusted < 0.001) and Range Cycle Duration (ρ = 0.408, p-adjusted < 0.001). No significant correlations were observed between FT clinical scores and frequency measures.
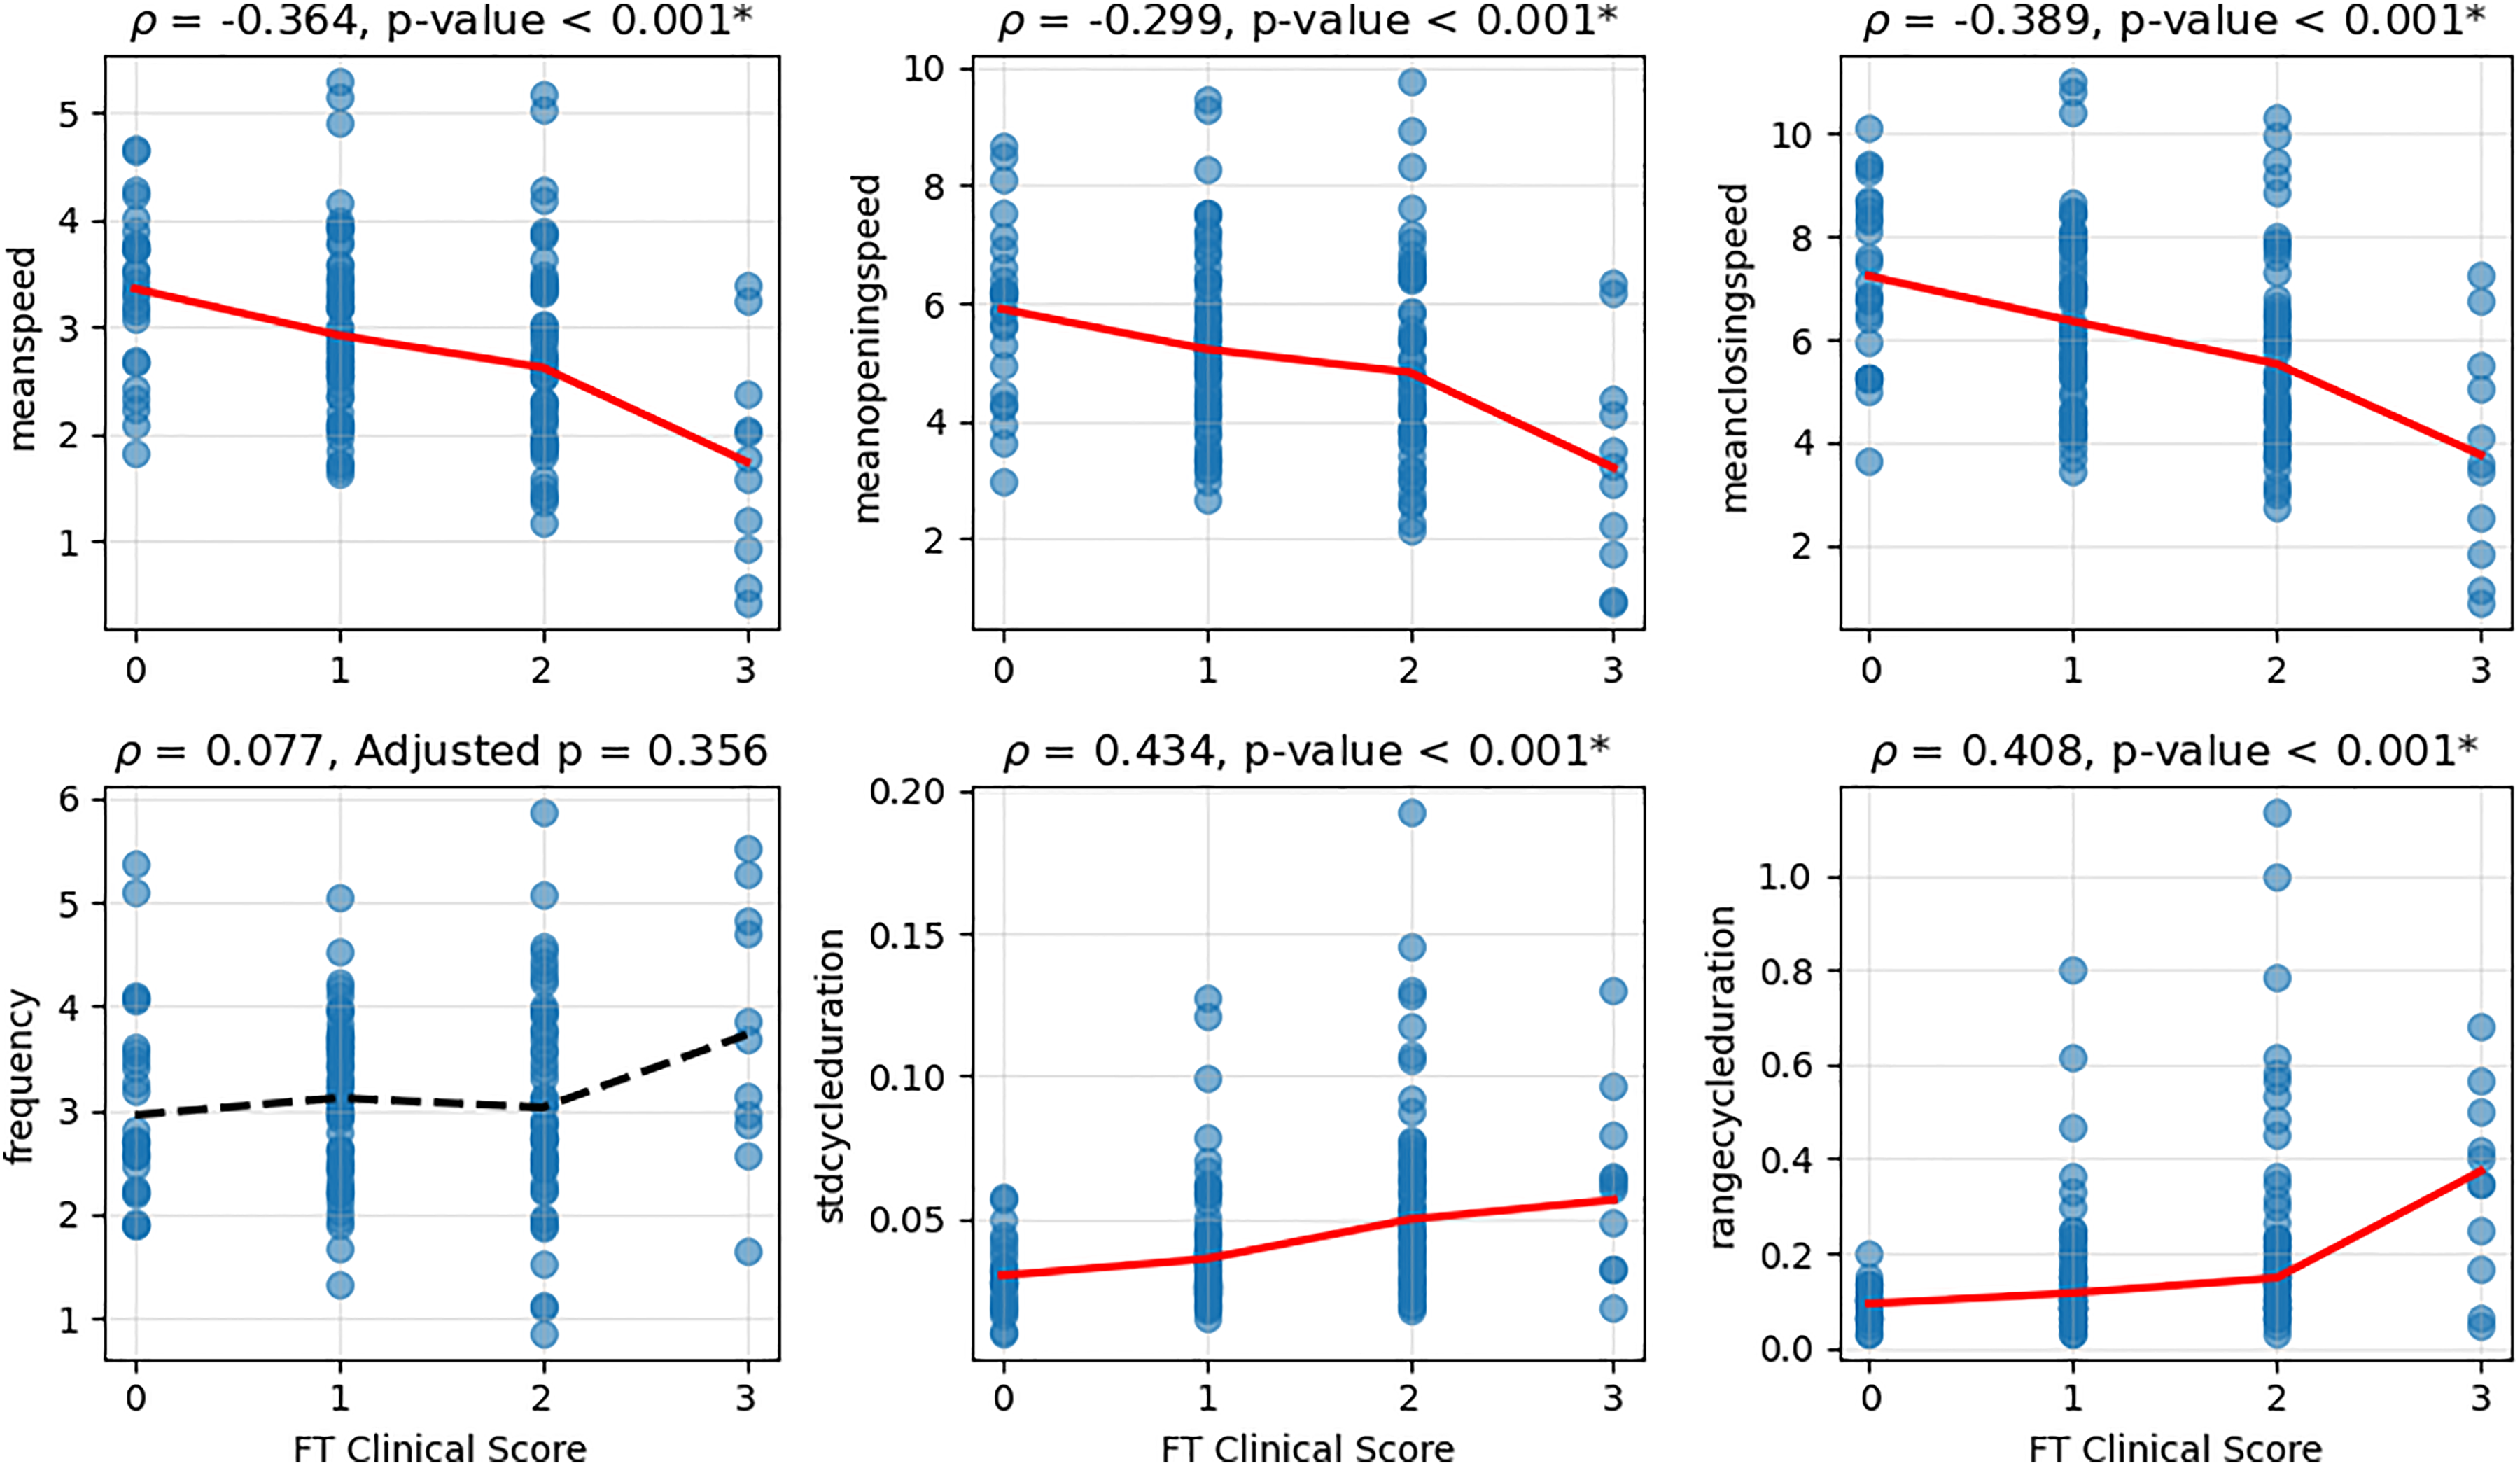
In addition, speed-related measures were also significantly negatively correlated with both the MDS-UPDRS-III and the bradykinesia subscore, indicating that these digital measures may capture broader motor severity beyond task-specific FT performance. In contrast, timing digital measures were not related to the bradykinesia subscore or the total MDS-UPDRS-III scores. Supplementary Table 3 presents the correlation analysis results for all clinical ratings.
For subsequent analyses, we focused only on the digital measures that showed significant correlations with the FT clinical scores.
Digital measures detect longitudinal decline missed by clinical scores
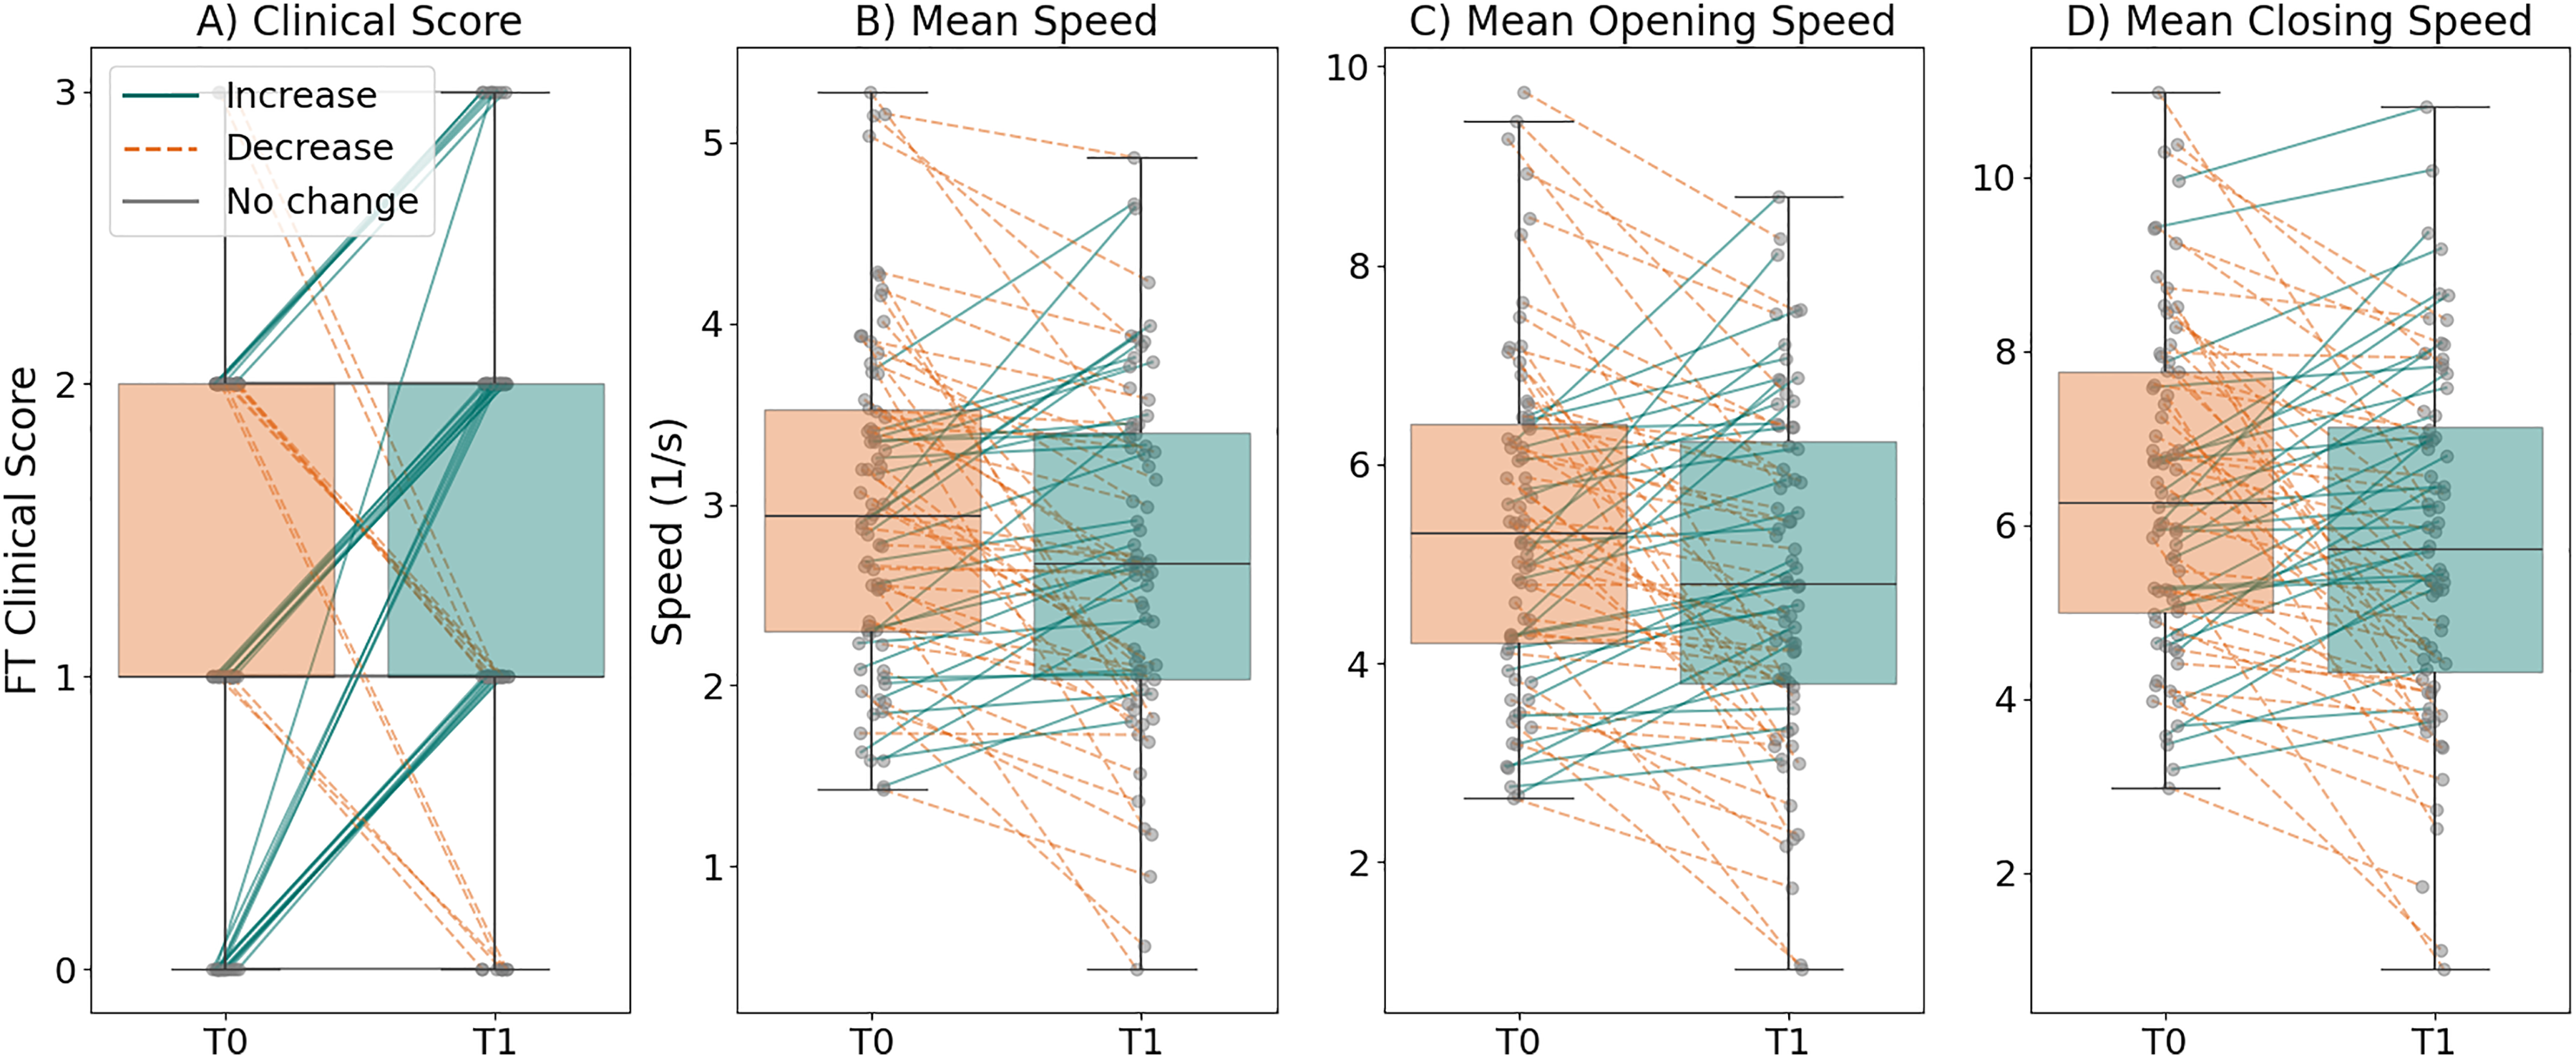
Table 2 summarizes the longitudinal analysis results for the FT clinical score and digital measures. FT clinical score did not show a significant change over time (p = 0.123). In contrast, digital measures revealed significant annual decrements in movement speed. Specifically, Mean Speed decreased by 6% per year (p-adjusted = 0.017), Mean Opening Speed decreased by 6% per year (p-adjusted = 0.017), and Mean Closing Speed decreased by 6% (p-adjusted = 0.017). Figure 2 shows paired changes over time in clinical FT clinical scores (Figure 2A), and digital measures (Figure 2B–C). For FT clinical scores, individual trajectories are clustered along a few discrete lines, reflecting the limited range of clinical score changes. In contrast, digital measures exhibit a wider, more continuous distribution of within-subject changes.
Longitudinal statistical analyses results.
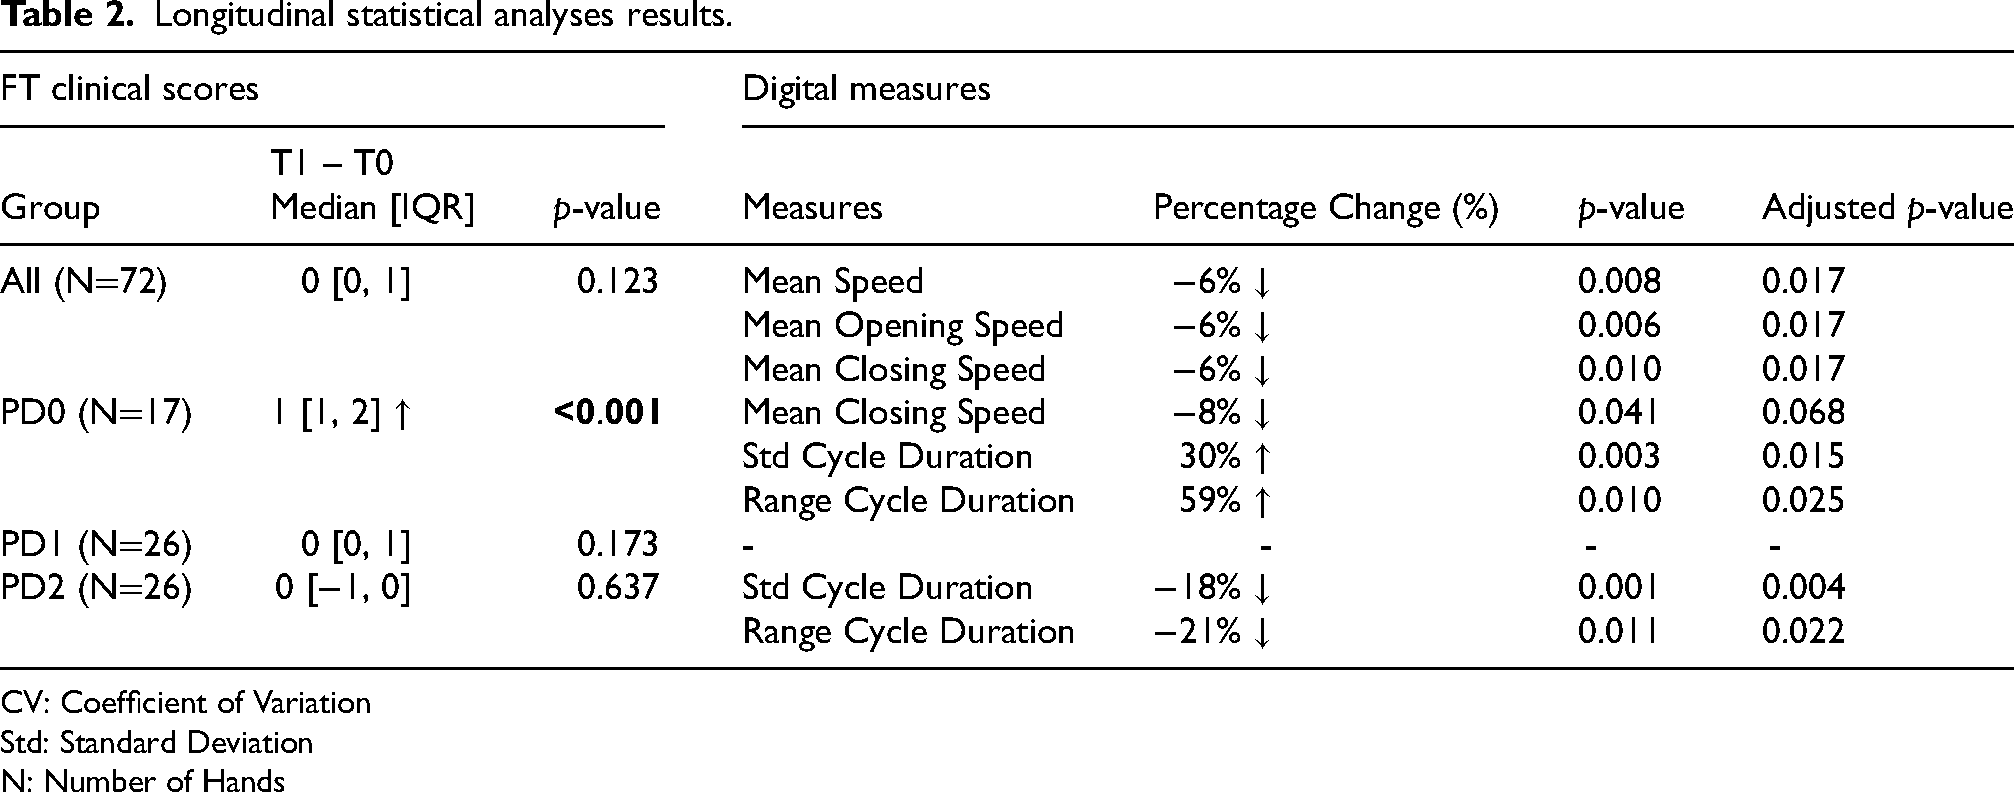
CV: Coefficient of Variation
Std: Standard Deviation
N: Number of Hands
An exploratory comparison between the most affected side (MAS) and least affected side (LAS) across the full cohort revealed differential longitudinal patterns. Neither side demonstrated significant change in FT clinical scores across time. However, the MAS showed a 16% annual decrease in the Standard Deviation of Cycle Duration (p-adjusted = 0.030), whereas the LAS exhibited 6% to 8% annual decline in speed-related measures. Detailed results are provided in Supplementary Tables 4 and 5.
Digital measures reveal distinct progression patterns across severity subgroups
Participants were stratified into three severity groups based on the baseline FT clinical score: 17 videos were classified as PD0 (FT clinical score = 0), 26 as PD1 (FT clinical score = 1), and 26 as PD2 (FT clinical score = 2). Three hands with scores greater than 2 were excluded from this analysis. Table 2 summarizes the longitudinal analysis results for each severity group.
For the PD0 group, the FT clinical score increased significantly over time (median difference = 1, p < 0.001). In terms of digital measures, speed-related metrics showed a tendency to decline between visits, including Mean Closing Speed (percentage change = −8%, p = 0.041), but this effect was not significant after adjustment for multiple comparisons (p-adjusted = 0.068). Measures of timing variability showed significant annual increases: the Standard Deviation of Cycle Duration increased by 30% per year (p-adjusted = 0.015) and Range of Cycle Duration increased by 59% per year (p-adjusted = 0.025).
For the PD1 group, there were no significant changes in the FT clinical score (median difference = 0, p = 0.173) or digital measures (all adjusted p-values>0.05).
For the PD2 group, FT clinical scores remained unchanged over time (median difference = 0, p = 0.637). However, digital measures revealed an improvement in timing variability, the Standard Deviation of Cycle Duration decreased by 18% per year (p-adjusted = 0.004) and the Range of Cycle Duration decreased by 21% (p-adjusted = 0.025).
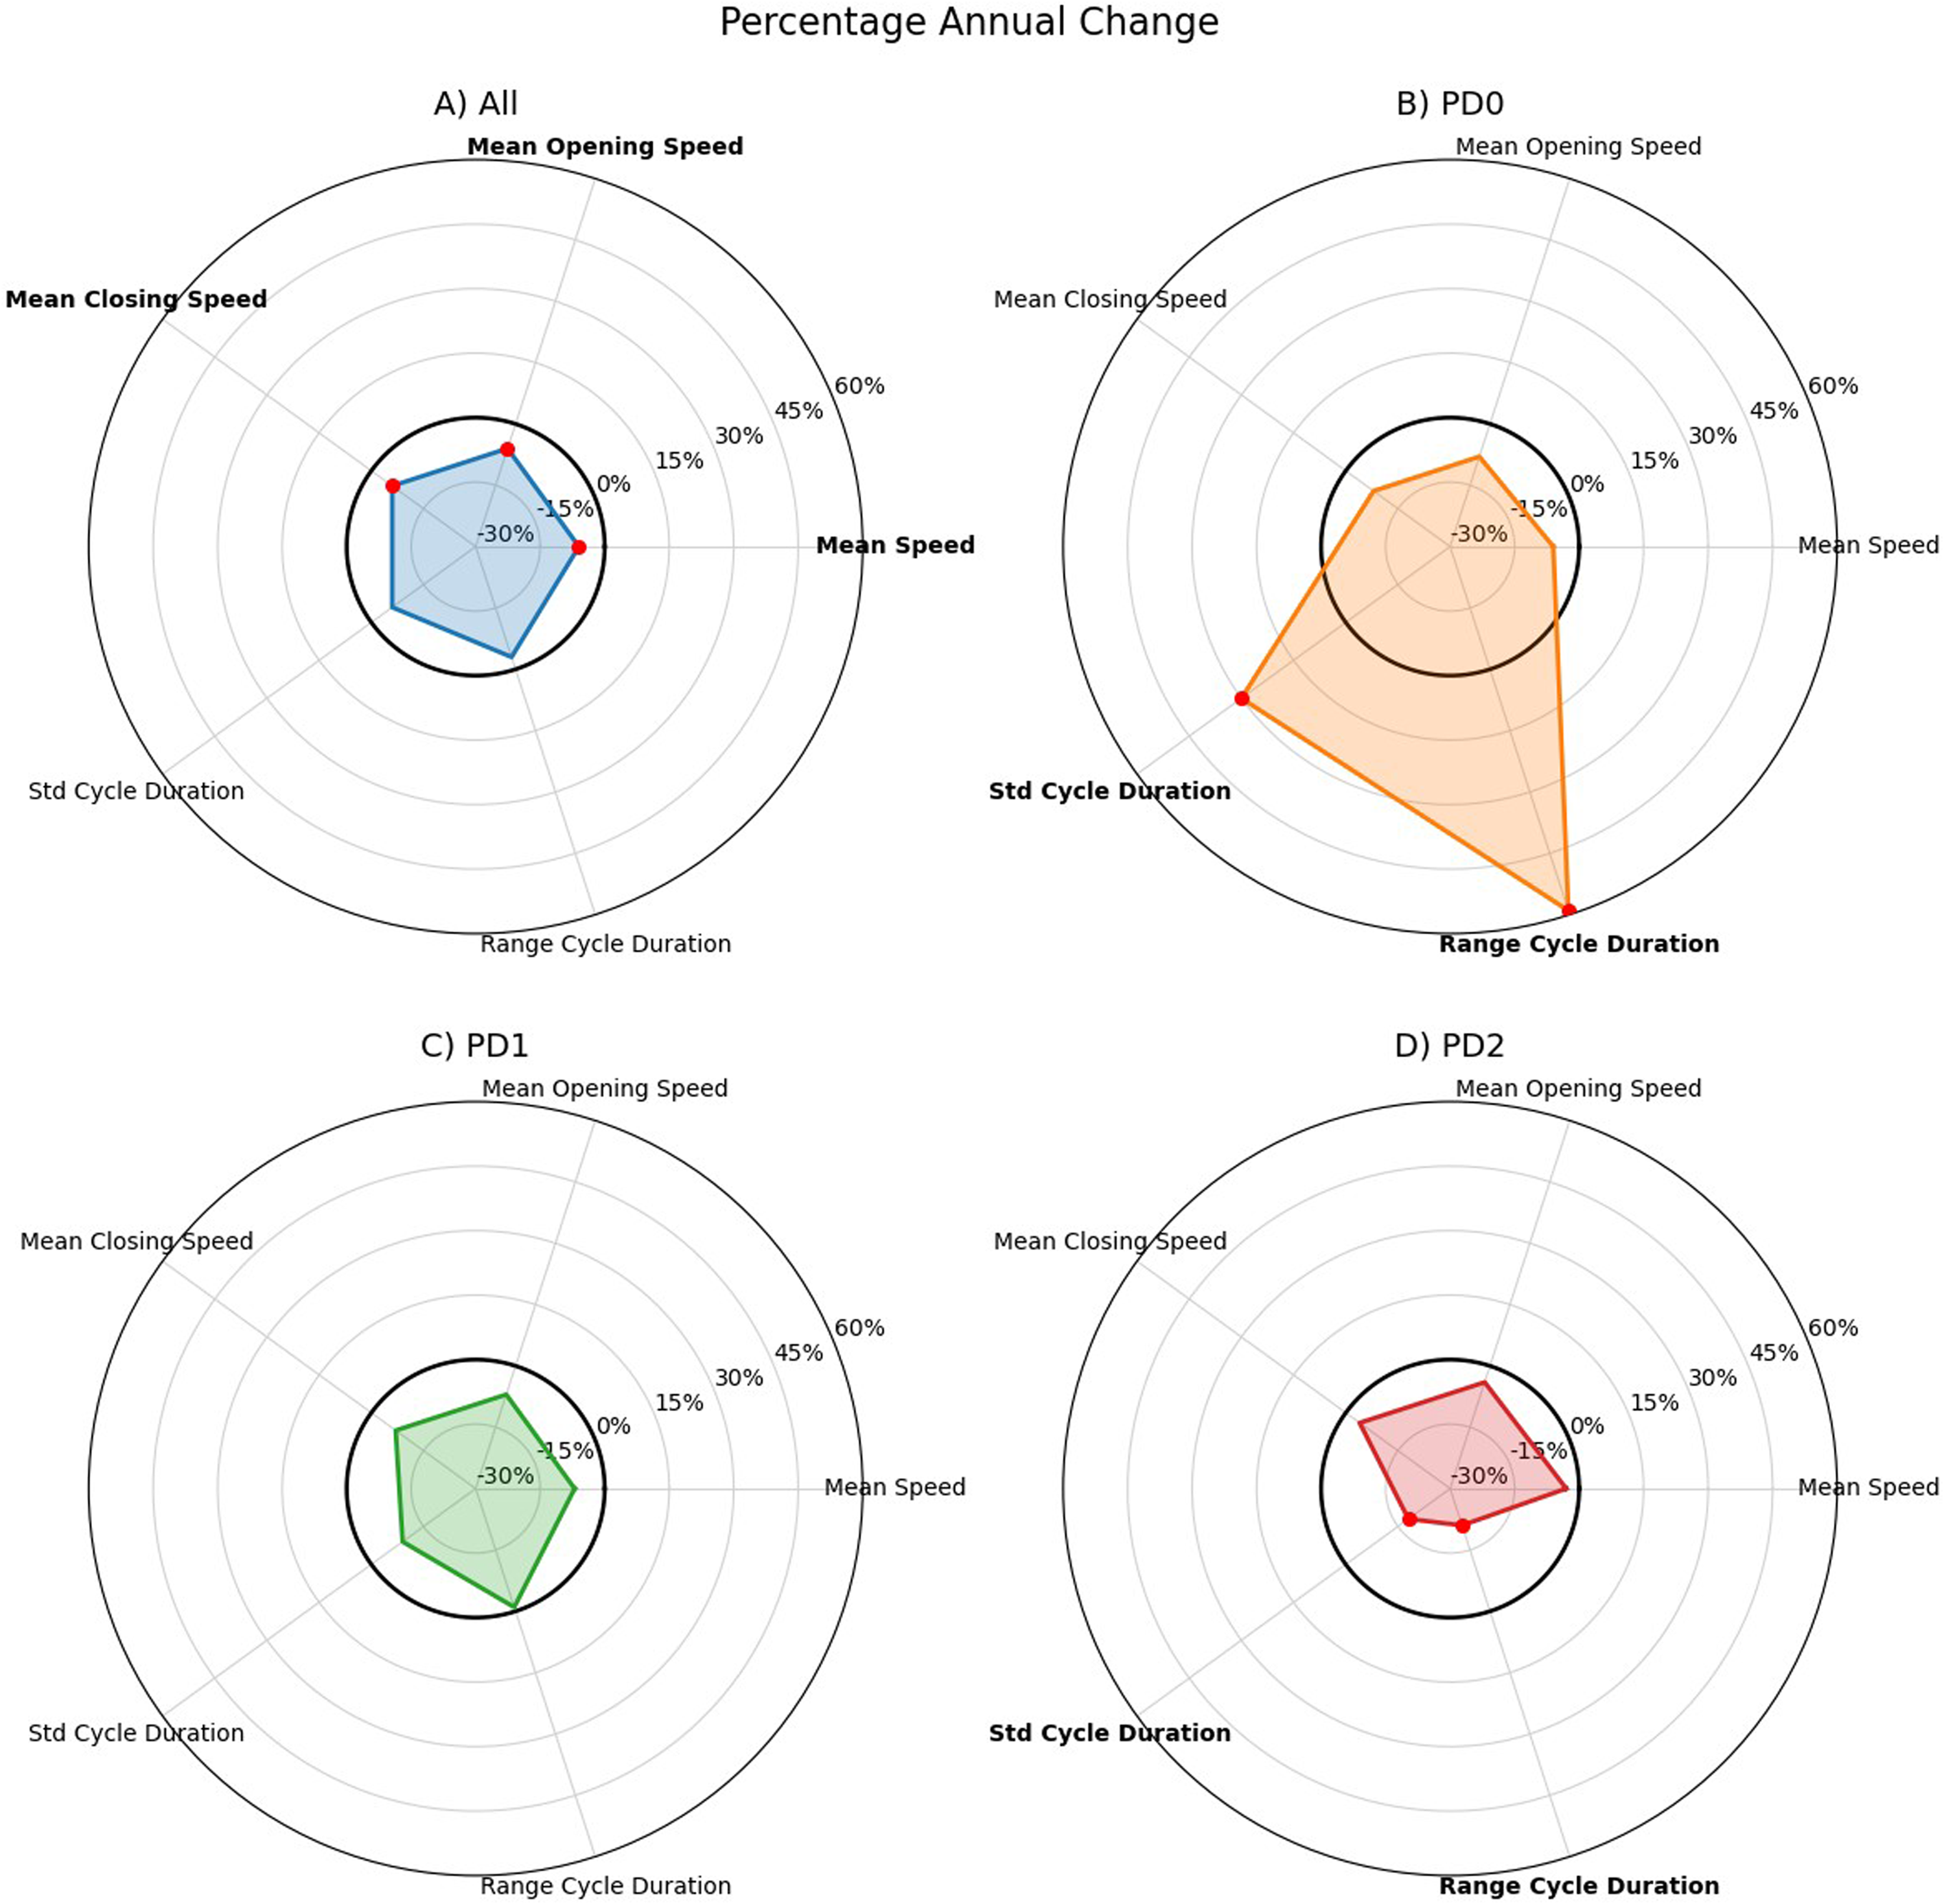
Figure 3 illustrates the percentage annual change from baseline for each digital measure across all participants and within each severity subgroup. The radar plots show that, while across the full cohort there was a decline in speed-related measures, PD0 participants exhibited worsening in timing variability and PD2 displayed improvements in timing variability. This visualization highlights the heterogeneity of the longitudinal changes in the ‘bradykinesia complex’ and the ability of digital measures to capture these patient-specific, multidimensional patterns.
Discussion
This study introduced a new methodology for quantifying longitudinal changes in upper limb bradykinesia using short Finger Tapping task videos and VisionMD, an open-source software platform for video-based movement analysis. Our findings suggest that VisionMD's digital measures may capture longitudinal changes in upper limb bradykinesia that are not readily detectable with clinical scores alone. By capturing subtle, domain-specific motor alterations that remain invisible to standard scales, VisionMD can provide a valuable complement to standard clinical evaluations for monitoring disease progression. Unlike the FT clinical scores, which require an expert for correct estimation and whose longitudinal changes were largely clustered along a few discrete lines due to their ordinal nature, the digital measures provided by VisionMD can be obtained automatically from a short video and demonstrated a wider distribution of values, reflecting their capacity to capture more nuanced and continuous changes in motor performance over time.
Moreover, the observed relationships between digital measures and FT clinical scores suggest that these metrics capture clinically meaningful aspects of bradykinesia, with slower movements and increased timing variability reflecting larger clinical scores.
A key finding of this study is the discrepancy between global motor progression and task-specific clinical ratings. Although patients demonstrated a worsening of overall motor symptoms, as reflected by the increase in MDS-UPDRS-III total score, the FT clinical score remained largely unchanged over time. In contrast, our digital measures extracted from FT videos with VisionMD successfully captured progression in bradykinesia-related metrics. These digital measures revealed an overall reduction in movement speed over time, providing objective evidence of disease progression that was not reflected in the FT clinical scores.
When stratifying the videos by their baseline FT clinical scores, an interesting trend emerged: participants with a baseline score of 0 (PD0) showed a significant worsening in their FT clinical score; in contrast, FT clinical scores remained stable over time for participants with a baseline score of 1 (PD1) or 2 (PD2). This is not an uncommon observation, as motor symptoms in PD typically begin gradually, progress slowly over many years, and can remain relatively stable for significant periods before worsening again.
Stratification by baseline severity also revealed distinct progression patterns in terms of digital measures. Participants with baseline score 0 (PD0) exhibited significant increases in movement timing variability. Speed measures showed a trend toward decline, but these changes were not significant after correction for multiple comparisons. These findings align well with prior results showing that digital measures of variability are important indicators of disease progression.10,27
Participants in the PD2 group demonstrated a reduction in timing variability over time. As shown in Supplementary Tables 2 and 6, this reduction was accompanied by a significant decrease in mean cycle duration and changes in additional variability-related measures. Importantly, at baseline, the PD2 group exhibited the lowest movement amplitude and speed and the highest variability measures compared to the other severity groups. Thus, movements in this subgroup were smaller, slower, and more variable relative to PD0 and PD1. At follow-up, amplitude and speed decreased further (although these changes did not reach statistical significance), while variability measures declined compared to baseline. Notably, even after this reduction, variability values in PD2 remained higher than those observed in the less severe groups. This observation likely indicates that in the more severe group, disease progression resulted in smaller and slower movements that appear more stereotyped despite overall worsening motor impairment. These findings should be interpreted cautiously given the relatively small sample size of the PD2 group.
Consistent with this pattern, exploratory side-specific analyses revealed similar trends in the most affected hand, which exhibited slower and smaller baseline performance and greater variability compared to the less affected hand, along with reductions in variability over time. These parallel patterns across severity stratification and side-specific analyses further support the possibility that increasing motor severity may be associated with smaller and slower movements that appear more stereotyped.
To further investigate the relationship between movement duration and variability, we examined the association between longitudinal changes in mean cycle duration and its variability (standard deviation). Reductions in variability were significantly associated with shorter cycle durations, indicating that decreases in variability occurred concurrently with shorter cycles (Supplementary Figure 1). This finding supports the interpretation that the reduction in variability observed in more severe participants may be partially explained by shorter movement durations, consistent with a more constrained motor output in advanced stages of disease.
These observations are consistent with the possibility of heterogeneous expression of the different components of the bradykinesia complex at different stages of disease. Whereas increased variability may characterize milder impairment, more advanced stages may be increasingly driven by hypokinetic features such as reduced amplitude. However, given the limited subgroup size and the nonsignificant decrease in amplitude, these interpretations remain exploratory and require further investigation in larger cohorts.
Overall, these findings highlight the heterogeneous trajectories of the ‘bradykinesia complex’ progression and suggest that different digital measures may be maximally sensitive at different stages of disease. While traditional clinical scores (0–4) capture overall severity, they cannot reveal which specific components of the bradykinesia complex drive the final score. This underscores the value of video-based analysis for detecting subtle temporal irregularities that may escape clinical observation and highlights the potential utility of this technology for monitoring disease progression in PD. 28
To our knowledge, this is the first study to automatically quantify longitudinal changes in PD motor symptoms from marker-free videos of a standardized MDS-UPDRS-III motor task. Previous studies employing DHTs for longitudinal assessment of motor symptoms were based on wearable sensors, and while a direct comparison with wearable sensor studies is not possible due to methodological differences, our findings show important agreements between the two approaches. Sotirakis et al. reported that multi-sensor wearable data could detect statistically significant motor progression within 15 months that was not captured by clinical ratings. 27 They also identified that timing variability as a key feature to tracking motor symptom progression in PD. 27 These results agree with our observation that digital measures captured subtle changes in motor symptoms, reflected by changes in movement speed and variability that are not captured by clinical scores. Additionally, Czech et al., demonstrated that a composite bradykinesia score derived from wearable sensors showed greater sensitivity to change than standard clinical assessments over a 12-month period. 11 Collectively, these converging patterns support the utility of digital measures, whether derived from video or wearable sensors, for detecting meaningful motor changes that may go unnoticed with traditional clinical scoring.
Together, these findings suggest that digital measures may offer a complementary, more fine-grained characterization of bradykinesia progression than clinical scales, which rely on discrete scores and visual observations. By capturing distinct features of bradykinesia, VisionMD revealed unexpected patterns, such as reduced timing variability in those with higher baseline severity, indicating that digital measures may uncover aspects of disease progression missed by clinical ratings.
There are important limitations to consider. The limited sample size may have reduced our ability to detect group-level differences. Additionally, some statistically significant findings did not remain significant after correction for multiple comparisons, which may reflect the limited statistical power of our study and highlights the need for validation in larger cohorts. Moreover, our analysis focused on a single upper limb task, which restricts generalizability to broader aspects of motor function. In addition, the digital measures examined in this study did not capture all relevant dimensions of bradykinesia, such as hesitations and halts, which may provide complementary information about motor impairment. Lastly, clinical FT ratings were derived from both in-person assessments and standardized video recordings, which may introduce inter-modality variability. That said, previous studies have demonstrated good agreement between video-based and in-person MDS-UPDRS-III ratings. 29
Despite these limitations, our findings provide initial evidence that video-based digital measures can detect significant changes in bradykinesia among people with PD over time. Future studies should seek to validate these findings in larger cohorts, evaluate progression over different time intervals, and expand video-based assessment to include additional bradykinetic tasks to obtain a more comprehensive characterization of motor impairment
Supplemental Material
sj-docx-1-pkn-10.1177_1877718X261448385 - Supplemental material for Tracking the longitudinal progression of Bradykinesia in Parkinson's disease from videos using VisionMD
Supplemental material, sj-docx-1-pkn-10.1177_1877718X261448385 for Tracking the longitudinal progression of Bradykinesia in Parkinson's disease from videos using VisionMD by Gabriela Acevedo, Florian Lange, Joshua K Wong, David E Vaillancourt and Diego L Guarin in Journal of Parkinson's Disease
Footnotes
Author contributions
(1) Research project: A. Conception, B. Organization, C. Execution; (2) Statistical Analysis: A. Design, B. Execution, C. Review and Critique; 3. Manuscript: A. Writing of the first draft, B. Review and Critique.
GA: 1A, 1B, 1C, 2A, 2B, 3A
FL: 2C, 2B
JW: 2C, 3B
DV: 1C, 2A, 2C, 3B
DG: 1A, 1B, 1C, 2C, 3A, 3B
Funding
GA is supported by the Department of Applied Physiology and Kinesiology, University of Florida.
FL is supported by the Deutsche Forschungsgemeinschaft (DFG, German Research Foundation; Project-ID 424778381, TRR 295) and the Interdisciplinary Center for Clinical Research (IZKF Würzburg; Project-ID Z-3BC/19).
JKW is funded by NIH 1R01DC020450, R01NS131342, 1R21AG088600.
DV is funded by NIH R01NS058487, U01NS119562.
DLG is funded by the Norman Fixel Institute for Neurological Diseases and the University of Florida Intelligent Clinical Care Center.
Declaration of conflicting interests
The authors declared no potential conflicts of interest with respect to the research, authorship, and/or publication of this article.
Supplemental material
Supplemental material for this article is available online.
References
Supplementary Material
Please find the following supplemental material available below.
For Open Access articles published under a Creative Commons License, all supplemental material carries the same license as the article it is associated with.
For non-Open Access articles published, all supplemental material carries a non-exclusive license, and permission requests for re-use of supplemental material or any part of supplemental material shall be sent directly to the copyright owner as specified in the copyright notice associated with the article.