
Abstract
Timing and management after harvest are optimized when the maturity stage is known. This paper provides an in-depth review of common destructive and nondestructive methods used for evaluating berry maturity. Destructive methods such as total soluble solids (TSS), acidity, firmness, phenolic compounds, amino acids, aromatic compounds, sensory characteristics, and molecular profiling offer precise measurements. Nonetheless, these methods require sample preparation, which damages the fruit and is often impractical for large-scale monitoring. Conversely, we explore advanced nondestructive methods such as near-infrared spectroscopy (NIRS), hyperspectral imaging (HSI), red-green-blue (RGB) color imaging, and multispectral imaging (MSI), which enable rapid evaluation without compromising fruit integrity. Most of these methods are investigated in strawberries, raspberries, blueberries, gooseberries, and blackberries. However, emerging haskap berries remain unexplored despite their growing commercial importance, for which an overview and current maturity indicators have been discussed to enhance their assessment efficiency.
Keywords
Introduction
Fruits are an important source of essential nutrients, including dietary fibers, vitamins, and minerals. In addition, they contain bioactive compounds such as polyphenols, carotenoids, phytosterols, terpenoids, and alkaloids, which offer many health benefits.1–4 Regular consumption of fruits has been associated with multiple health benefits, including antimicrobial activities, antioxidants, 5 anti-inflammatory, 6 cardioprotective effect 7 and improved gut microbiota. 8 The harvesting of fruits at the ideal stage of maturation has a direct impact on the nutritional content, flavor, and shelf life.
Maturity is generally considered a developmental stage of the plant or its parts when it has reached growth and physiological development that makes it suitable for harvesting, in relation to consumer/producer requirements. This stage does not always indicate that the product is ready for use right away. 9 Physiological maturity refers to the development stage at which the fruit has completed its natural growth processes and can continue ripening after harvest. Many fruits are harvested at their physiological maturity but require further ripening before marketing or consumption. Whereas commercial maturity denotes the stage at which the commodity is suitable for harvest based on market requirements, including firmness, size, handling tolerance, and predicted shelf life. 10 Commercial maturity is a crucial factor in determining quality, marketability, and consumer satisfaction, as under- or over-mature fruits fall short of customer requirements and are more likely to deteriorate during storage and transportation. Therefore, maturity indices are consequently crucial tools for producers, packaging professionals, and merchants to optimize precise harvest timing and reduce postharvest losses. 11
Accurate maturity evaluation in small berries such as blueberries, strawberries, blackberries, grapes, and raspberries is important to have optimal marketability, quality, and consumer satisfaction. Most of the berries are extremely perishable and sensitive to harvest timing. 12 Premature harvesting results in low sugar content, unpleasant flavor, and an undesirable texture, whereas delayed harvesting often leads to excessive softening, decomposition, and a shorter shelf life. Destructive methods of maturity assessment involve physically altering or destroying the fruit to analyze its internal traits. These techniques usually include penetration, tissue removal, chemical analysis, or application of external compression or shear force to evaluate its rheology. These methods provide measures of maturity indicators such as sugar content, acidity, and firmness by interacting with the berry's internal structure. Destructive methods are most frequently used in the assessment of maturity because of their precision and consistency, even though they result in sample loss. 13
Advanced non-destructive technologies for maturity assessment, such as hyperspectral imaging (HSI), multispectral imaging (MSI), and near-infrared spectroscopy (NIRS), and other machine learning-based systems, are gradually replacing traditional approaches that rely on visual examination and labor-intensive manual testing. 14 These advanced techniques enhance precision and promote sustainable farming practices by lowering postharvest losses and boosting supply chain effectiveness. Reliable and scalable maturity evaluation methods are becoming increasingly important as the demand for high-quality food rises. Red-green-blue (RGB) imaging, firmness sensors, and portable NIRS sensors are examples of non-destructive methods that are being utilized increasingly to precisely assess the berry maturity. By adopting these methods, farmers can bring down the postharvest losses, maintain consistent quality all over the supply chain, and match precise harvest timing with consumers’ expectations.15–18
The berries have been an essential part of the world's horticultural production due to their growing consumption, economic significance, and nutritional significance. According to latest Food and Agriculture Organization data (Figure 1) states that strawberries account for largest share of global berry production at 73% (10.48 million tonnes) followed by blueberries and other Vaccinium species at 14% (2.26 million tonnes), raspberries at 7% (0.94 million tonnes), cranberries at 4% (0.54 million tonnes), and gooseberries at <1% (0.10 million tonnes). 19 Strawberries are produced extensively throughout Asia, the Americas, and Europe, indicating their resilience and adaptability to temperate and subtropical climates. While blueberries and cranberries predominate in the Americas region because they favor colder conditions. Although some berries exhibit smaller shares of global production, they are equally relevant for maturity research due to their distinct physiological characteristics, diverse ripening patterns, and potential nutritional value.
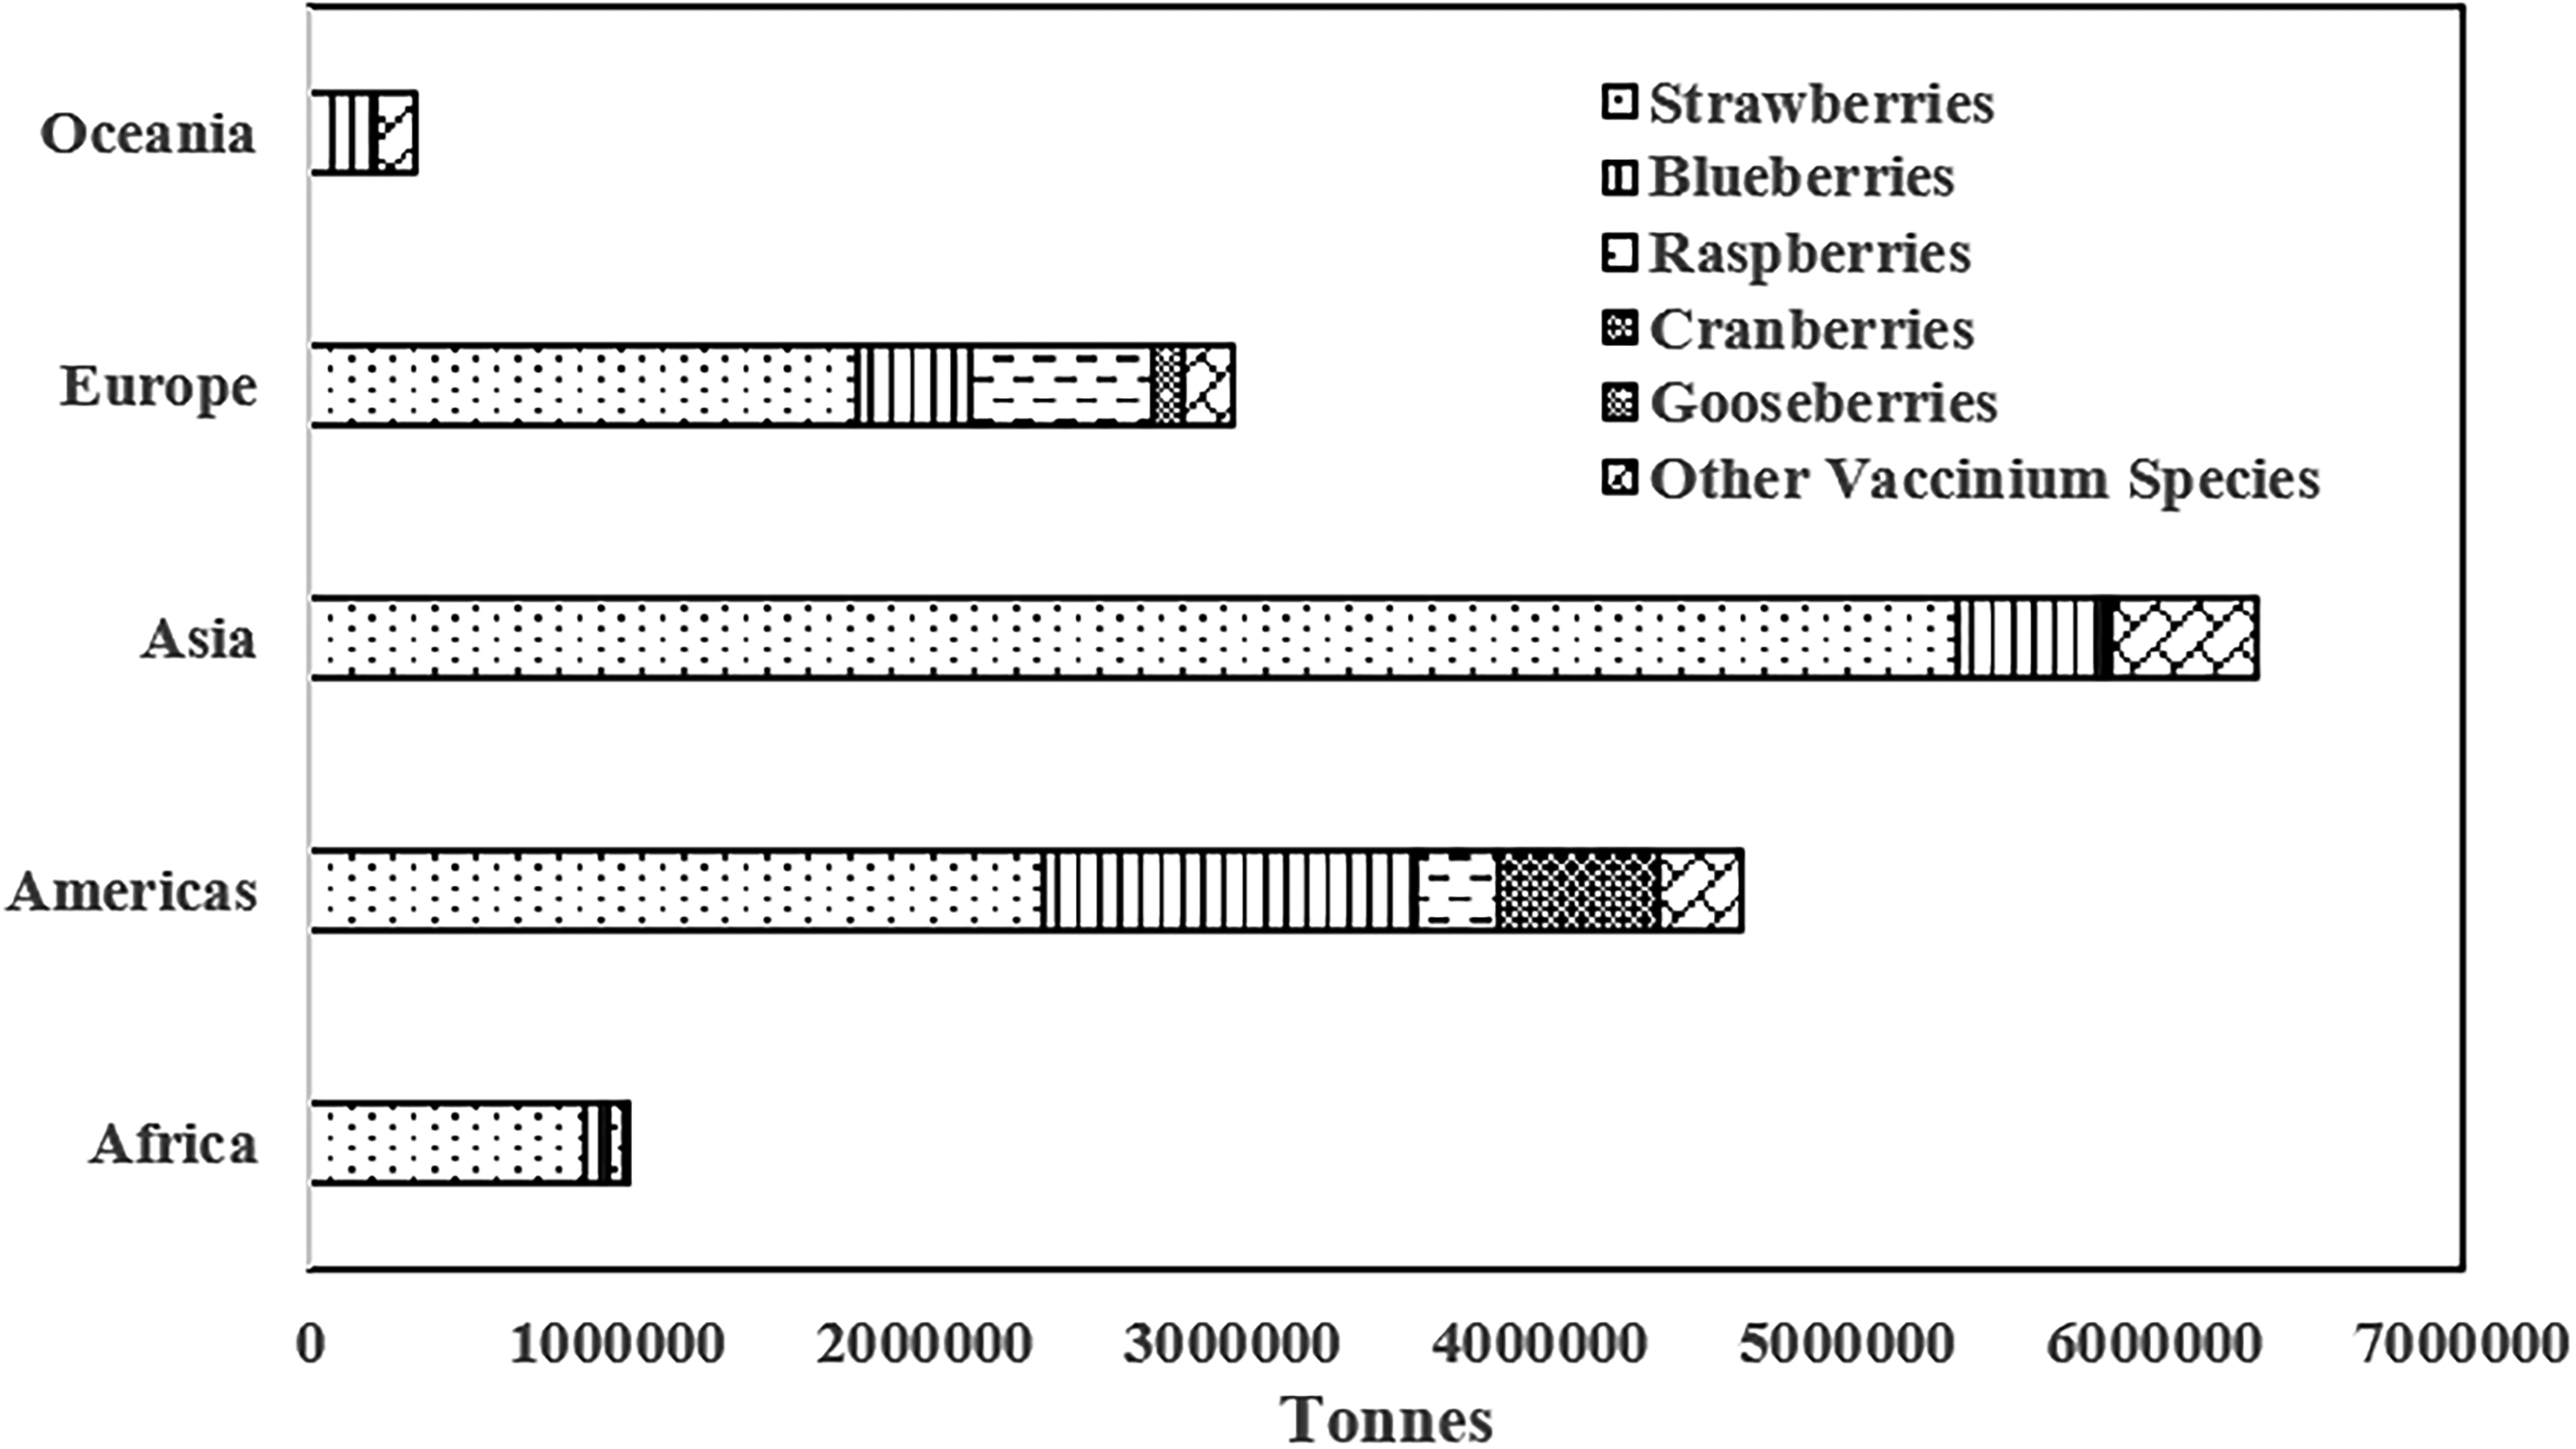
Regional distribution of berry production in 2023 (tonnes). 19
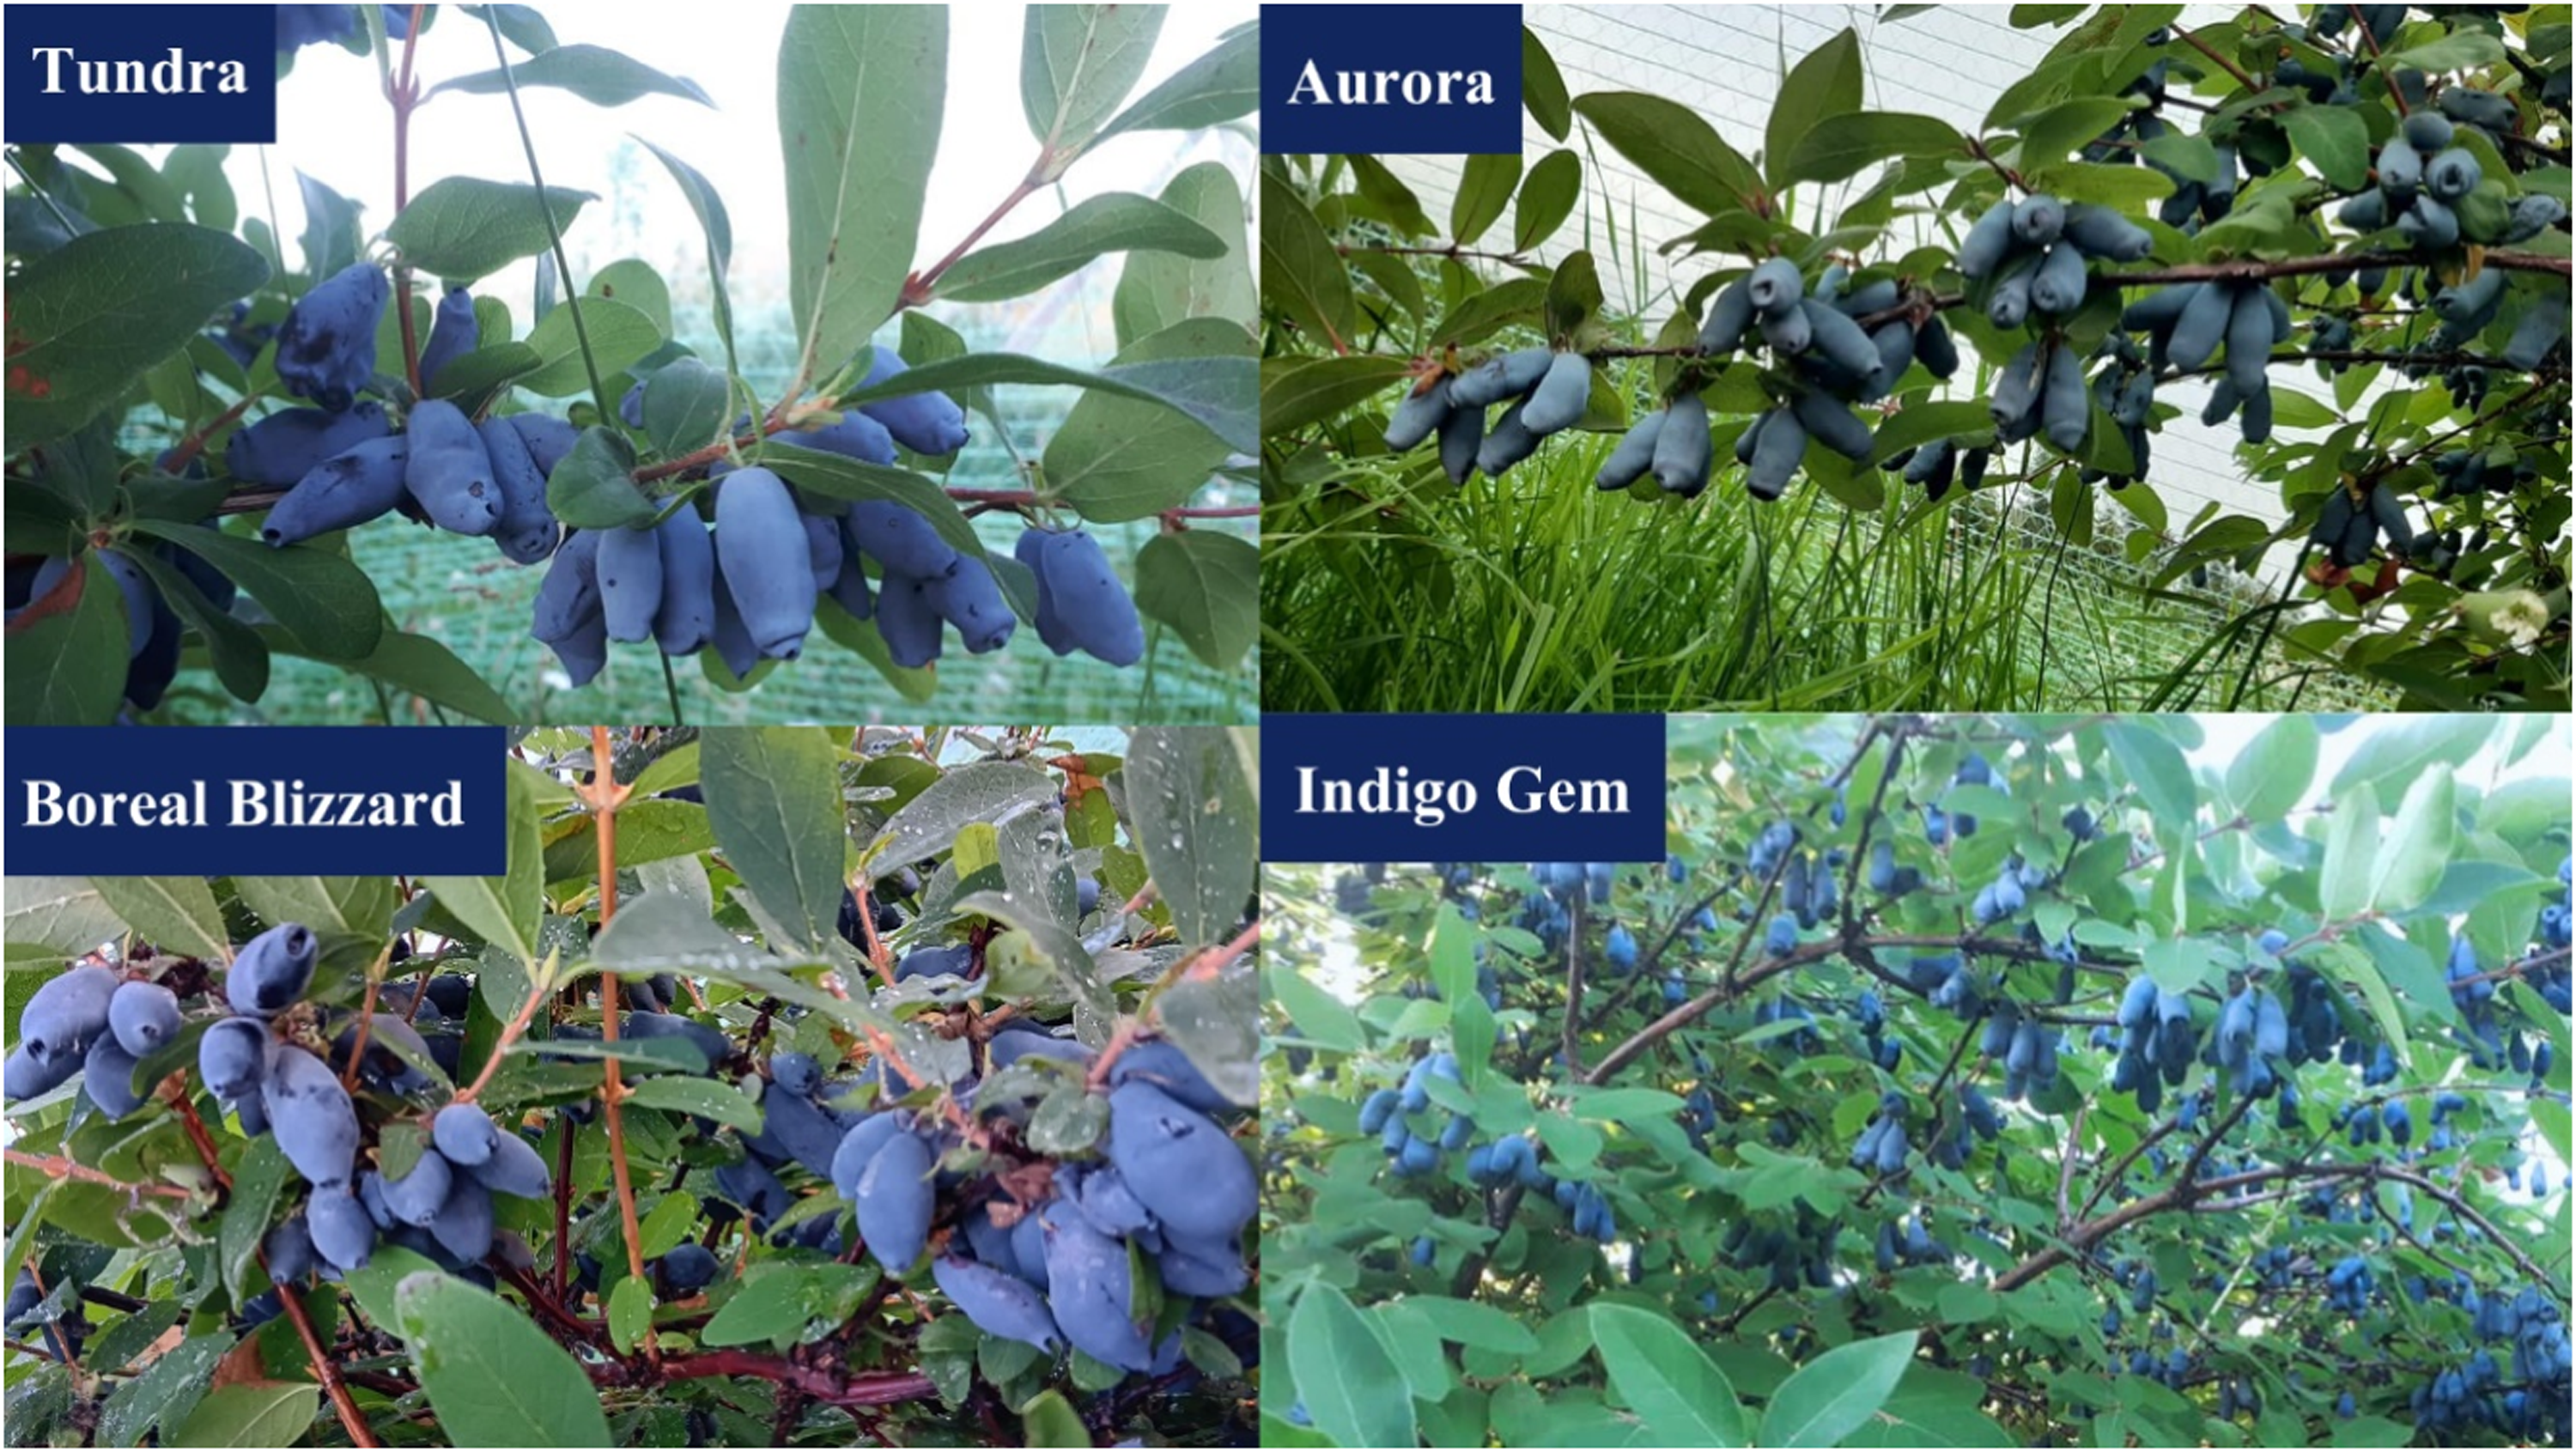
Representative images of some of the haskap (Lonicera caerulea) cultivars.
Haskap berries (Figure 2) are gaining attention as a nutrient-dense crop that thrives in extremely cold regions, especially in Canada and northern regions.20–22 Despite their increasing commercial potential, haskap berries pose distinctive challenges that call for attentive research. One of the significant challenges is inadequate knowledge of its ripening physiology, specifically regarding ethylene production and respiration patterns across the maturity stages. Moreover, cultivar diversity and limited understanding of harvest timing are affecting the postharvest quality of haskap berries. 23 Additionally, the fruit is very delicate, making it susceptible to mechanical damage during harvesting and handling. This fragility also restricts marketability and storage life.24,25 Haskap remains an underexplored berry crop in the scientific literature regarding harvest timing, maturity indices, and postharvest quality attributes compared with conventional berry species. Therefore, haskap berries are represented separately in this review to justify their relevance clearly and to highlight the need for targeted research. This review emphasizes the importance of maturity and advancement in assessment techniques and developments in non-destructive techniques for small berries while highlighting the critical knowledge gaps in haskap and future directions in the agri-food industry.
General methods for assessing fruit maturity
Destructive methods
Mechanical assessment
Accurate measurement of berry maturity is essential for optimizing harvest timing, maintaining postharvest quality traits, and ensuring consumer satisfaction. These methods typically measure firmness and structural integrity associated with maturity stages. Mechanical assessment is associated with changes in the shape and size of the berry sample when external mechanical force is applied. Firmer berries often indicate earlier maturity phases, while softer berries represent more advanced development stages driven by cell wall disassembly, including pectin solubilization, depolymerization of hemicellulose, and loss of middle lamella integrity. 26 The environment also influences firmness characteristics and varies among cultivars. For example, Sriti, Sargent 27 conducted a study on three thornless blackberry cultivars across two harvesting seasons and reported that certain cultivars are better harvested and marketed based on firmness rather than the sweetness of blueberries. They stated that increased fruit temperatures during harvest, typically exceeding 23 °C, have been consistently associated with a higher incidence of leakiness and severity of red drupelet reversion.
Hand feel touch is the most common method used in the berry industry, particularly for small berries like blueberries 28 to evaluate individual fruit firmness as a proxy of maturity and marketability. The subjective nature of hand touch assessment is a limitation that highlights the demand for objective instrumental procedures. Compression test, penetration testing, and texture profile analysis are the most widely used methods. In the compression test, the berry sample is deformed under controlled force with the help of a texture analyzer. Force-deformation curves are usually used to acquire parameters that disclose the berry's resistance to mechanical stress, including maximal force, chord stiffness, and modulus of elasticity.17,28–32 However, testing small berries can introduce variability due to inconsistent contact and orientation, limiting their reliability in bulk measurements, particularly for delicate berries like blueberries 17 and haskap. 24
Penetration testing, also known as puncture testing, quantifies the force needed to break and penetrate the berry skin and has been applied for the maturity assessment of blueberries, strawberries, and blackberries. 33 Quispe-Sanchez, Mena-Chacon 33 found that firmness declined steadily across the defined maturity stages in different berries such as blackberries, blueberries, and strawberries, reflecting the expected softening that accompanies physiological maturity.
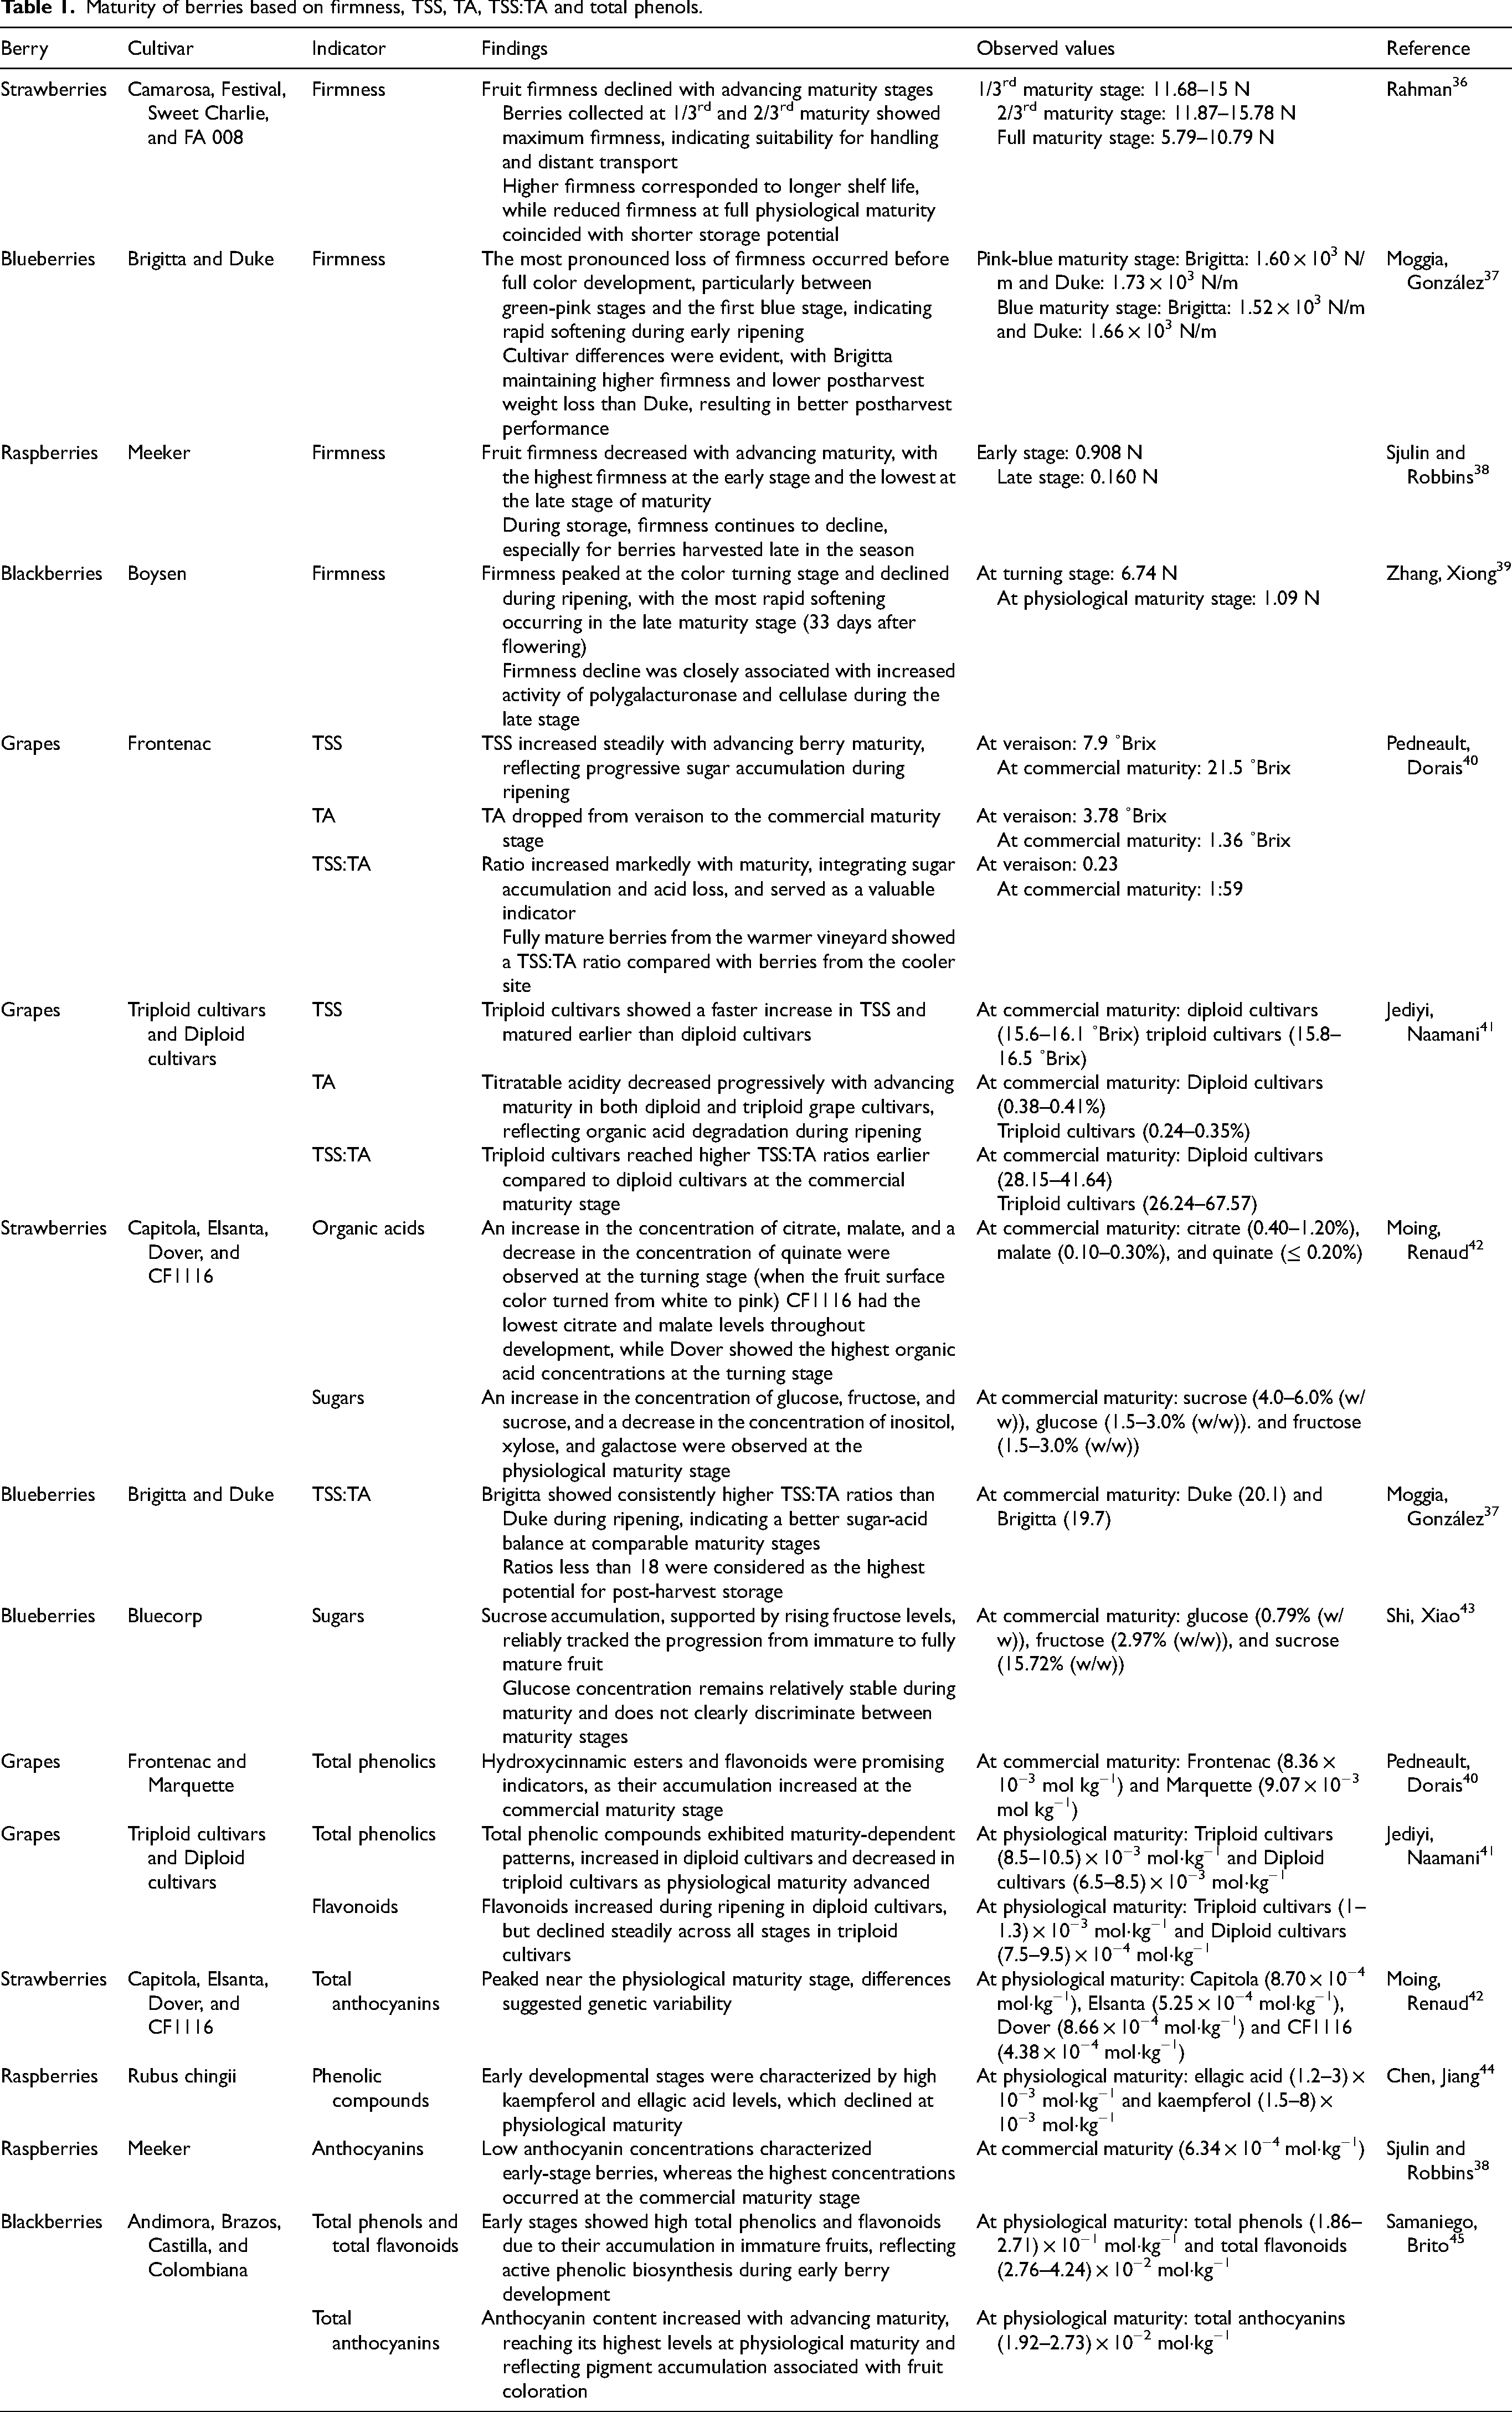
Textural profile analysis is usually a replication of the chewing process. It exhibits characteristics including chewiness, cohesion, hardness, and springiness, which are associated with sensory qualities and customer preferences. This technique involves two successive compressions of a fruit sample using flat and rigid plates with a textural analyzer device.34,35 Although these mechanical methods provide reliable data for evaluating maturity, their destructive nature restricts their repeated measurements and ability to scale them in commercial contexts. Furthermore, careful calibration of testing conditions is required to account for species-specific variations in berry dimensions and tissue chemistry. Some examples of firmness as maturity indicators in different types of berries across maturity stages are cited in Table 1.
Maturity of berries based on firmness, TSS, TA, TSS:TA and total phenols.
Chemical analyses
Chemical indicators play a significant role in determining fruit maturity as they offer insights into fruit chemistry, flavor development, nutritional quality, and harvest readiness. Total soluble solids (TSS) is one of the frequently used measures to estimate the sweetness, and it includes soluble pectins, organic acids, amino acids, and other trace compounds. 46 TSS values differ significantly within the same fruit during the distinct stages of development. 47 Titratable acidity is another factor that contributes to maturity assessment and provides insights into the berry's sourness. The ratio of sugar-to-acid is particularly valuable, as it integrates both sweetness and acidity to represent overall taste quality and maturity stage better. A low ratio usually indicates early stages of maturity, showing that the fruit contains high levels of organic acids compared to sugars. Usually, as the fruit matures, due to metabolic processes, sugar accumulation increases while organic acids progressively break down. Cvetković, Kočić48,49 found that sugar-acidity was one of the significant measures to find the optimal harvest times for different cultivars of blueberries and strawberries. Numerous other case studies have employed sugar and acidity measurements as maturity indicators, as summarized in Table 1, where the sugar- acidity ratio was used as a maturity indicator in small berries.
Maturation in berries can also be related to the type and concentration of certain phenolic compounds (e.g., phenolic acids, anthocyanins, flavonoids), which contribute to both nutritional value and sensory quality. In most small berries, when it ripens its anthocyanin biosynthesis is directly associated with an increase in pigmentation capacity and biosynthesis. 50 The Folin- Ciocalteu test is used to determine the total phenolic content in berries, which relies on the complexation with AlCl3. In contrast to earlier techniques, the pH differential method is most often used for the determination of anthocyanin content in the berries. Environmental conditions substantially influence the phenolic compounds of berries grown under different altitude levels. For example, Teixeira, Eiras-Dias 51 emphasizes that phenolic groups in grapes, such as flavanols, stilbenes, anthocyanins, and proanthocyanidins, were influenced by environmental conditions such as temperature, light exposure, and water status across maturity stages. Similarly, raspberries grown at high altitude accumulated substantially higher phenolic levels than those grown at lower altitude. 52 They found that at the commercial maturity stage, raspberries exhibited major upregulation among flavonoids and phenolic acids, nearly representing nearly 50% of all elevated metabolites. Some examples of research studies on changes in phenolic compounds across the maturity stages are quoted in Table 1.
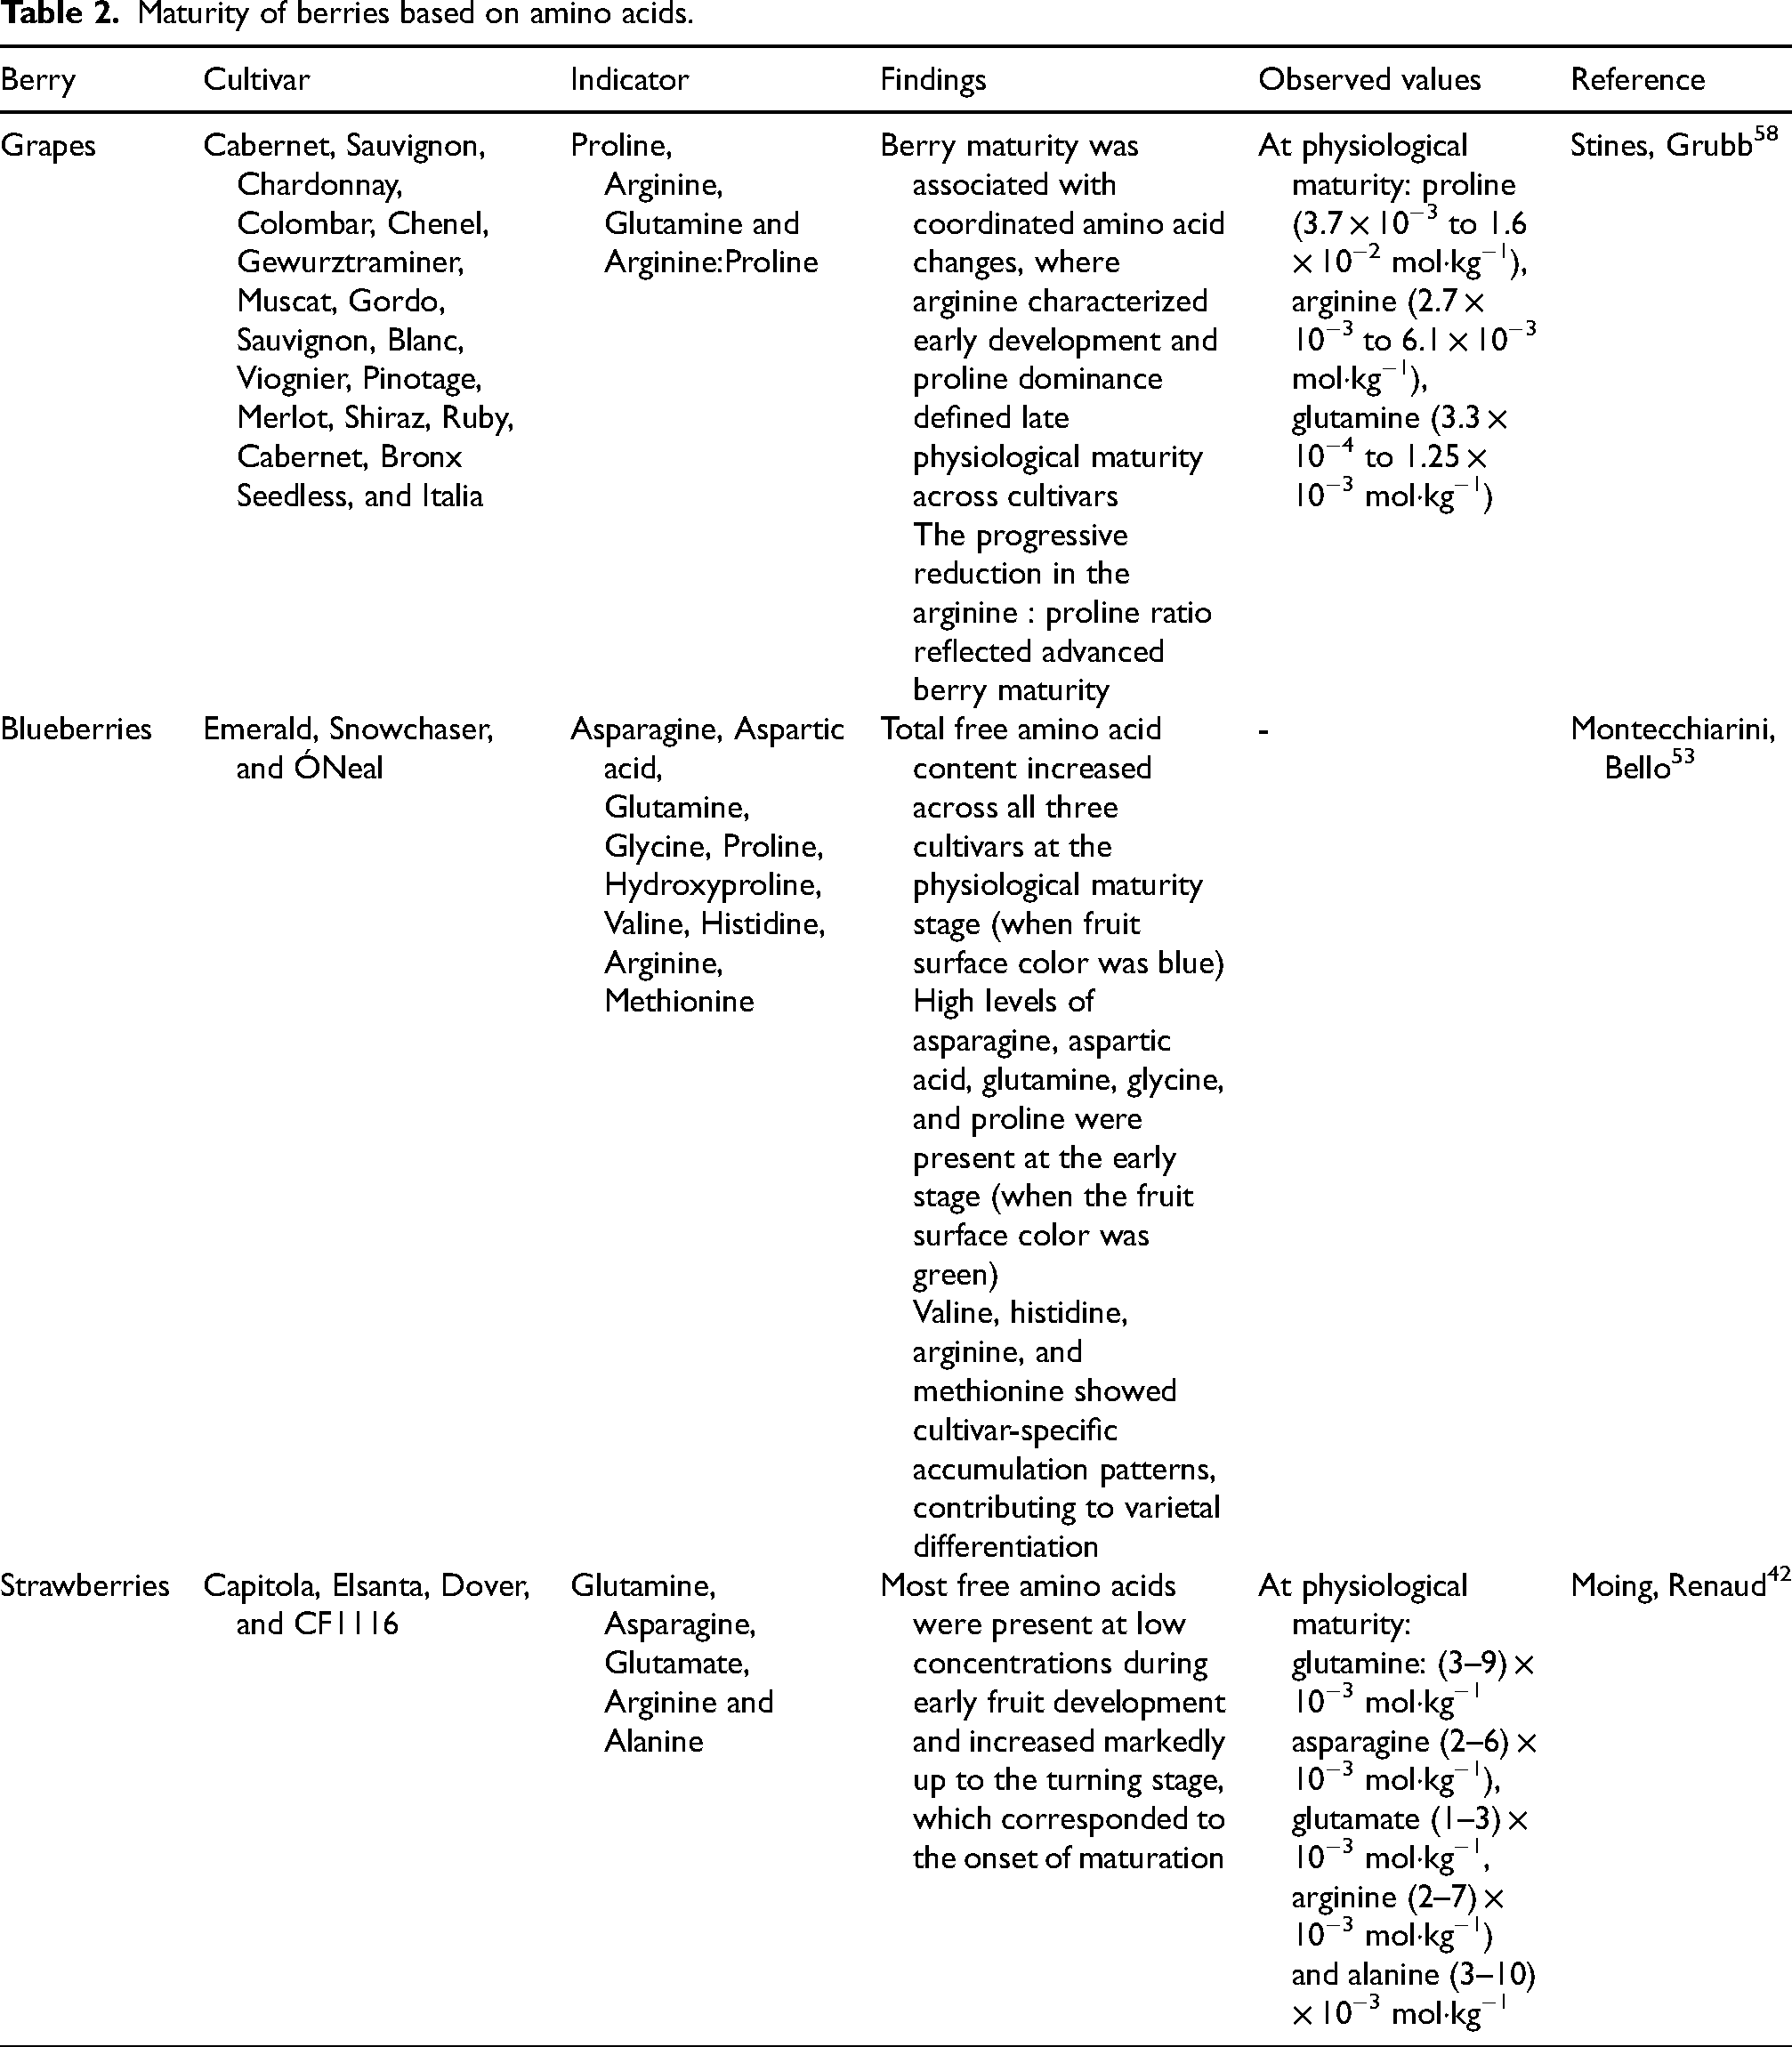
Maturity can also be related to the concentration of amino acids present in fruit tissue, and changes occur as the fruit develops and matures. Usually, in berries, the composition of amino acids is measured using the HPLC method and the Bradford protein assay method.42,53,54 These variations in amino acid concentrations reflect the biochemical processes, such as transport of nutrients, metabolism, protein synthesis, and degradation, throughout the maturity stages.55,56 Usually, as the ripening progresses, amino acids are integrated into sugars, structural proteins, and secondary metabolites. 57 The composition and concentration of amino acids are influenced by genotype and environmental conditions. For example, plateau-grown raspberries demonstrate the extreme sensitivity of berries’ amino acid metabolism to environmental fluctuation. 52 Specifically, high altitude berries exhibited 24 unique amino acid-related metabolites and significantly higher levels of L-lysine and L-glutamine. The accompanying Table 2 presents the case studies where amino acids were used as one of the maturity indicators. These amino acids exhibit characteristic changes in concentrations that reflect metabolic processes such as protein hydrolysis and nitrogen redistribution. 57
Maturity of berries based on amino acids.
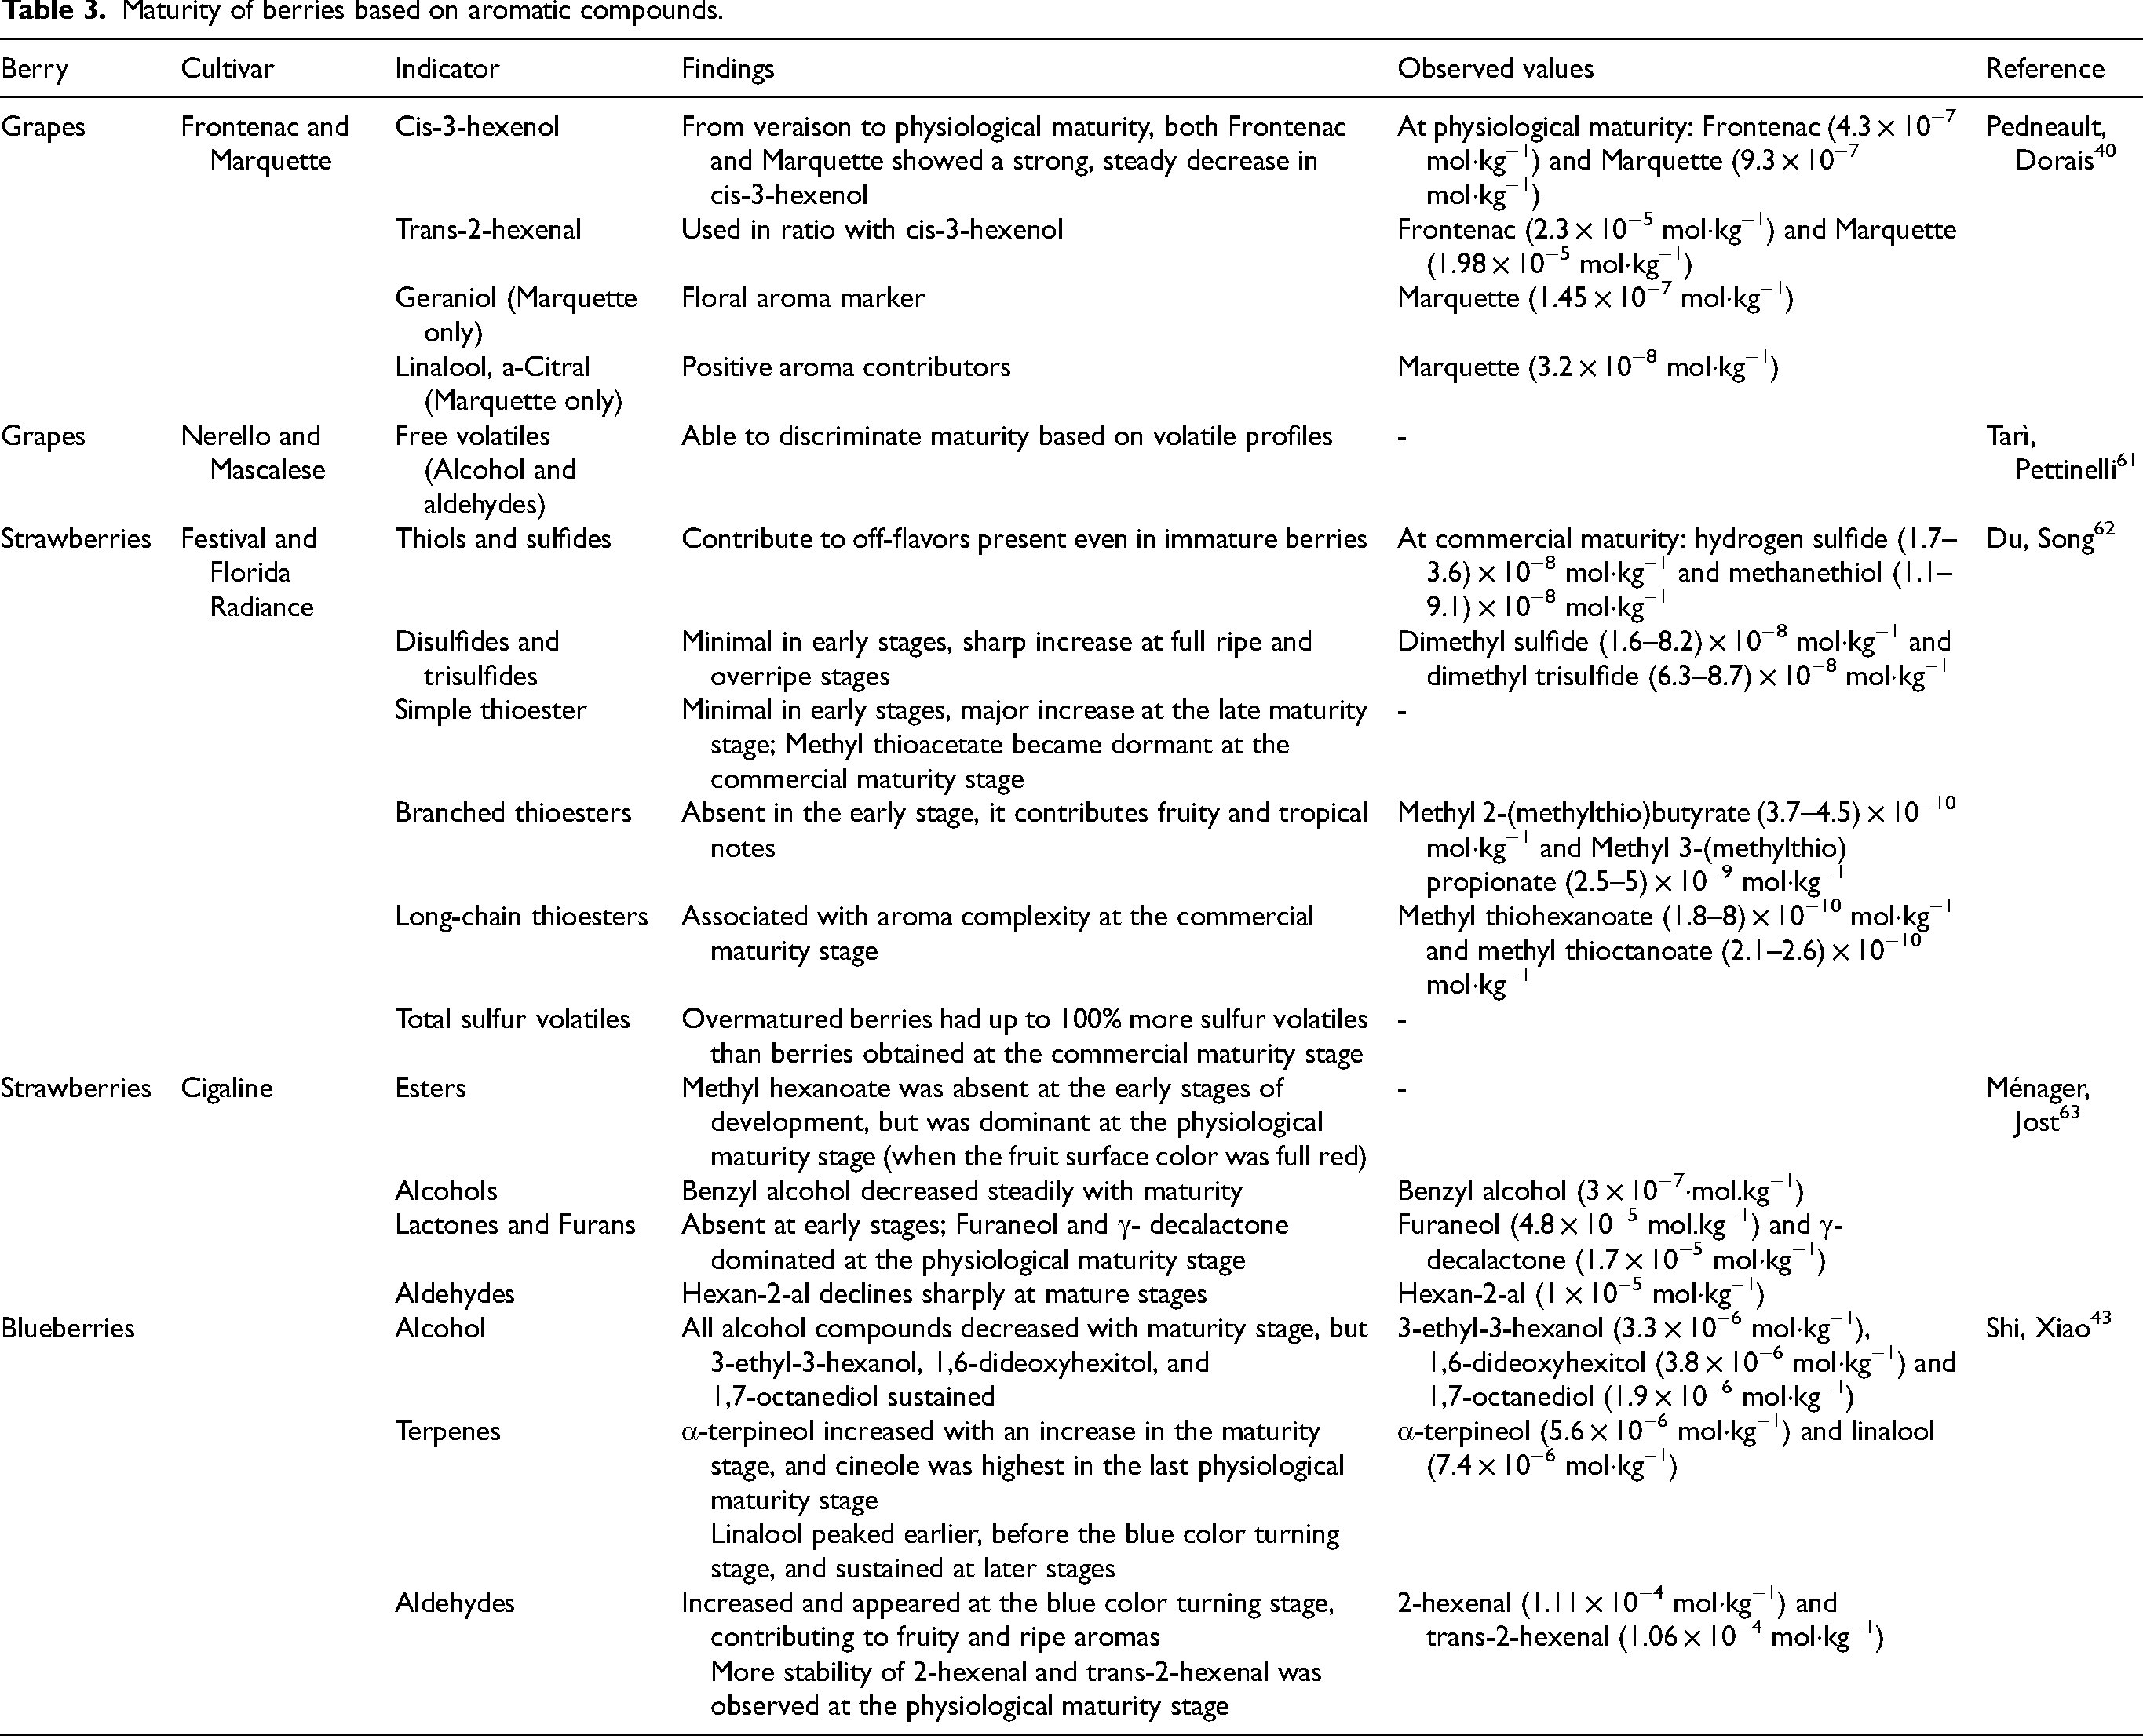
Aromatic maturity refers to the optimal development and transformation of volatile aroma compounds in berries that define the sensory quality and market value of the fruit. These compounds include alcohols, aldehydes, ketones, terpenoids, esters, lactones, apocarotenoids, and sulphur- containing volatiles which evolve during ripening in response to environmental conditions and enzymatic activity. 59 Numerous aroma compounds are found in glycosidically bound forms that are released at the onset of fruit ripening. Upon enzymatic hydrolysis, these bound volatiles, which are frequently more prevalent than free volatiles, make a substantial contribution to the aroma of fruits. 60 Table 3 summarizes the examples of aromatic compounds used as indicators of berry maturity.
Maturity of berries based on aromatic compounds.
Sensory evaluation
Sensory evaluation remains a cornerstone in evaluating the maturity and quality of small berries, which provides information on characteristics that have a direct influence on consumer approval. Usually, experienced assessors make up sensory panels, which employ standardized processes to evaluate specific characteristics, including appearance, overall flavor balance, taste, and texture. These panels frequently use check-all-that-apply (CATA), quantitative descriptive analysis (QDA), or descriptive analysis techniques to produce objective and predictable data. 64 To validate sensory perception, gas chromatography-olfactory is often combined with panel evaluations to correlate volatile profiles such as esters, aldehydes, terpenoids, alcohols, and lactones, which are crucial to the perceived flavor of small berries like blueberries, blackberries, strawberries, raspberries, and grapes.33,40,65–67
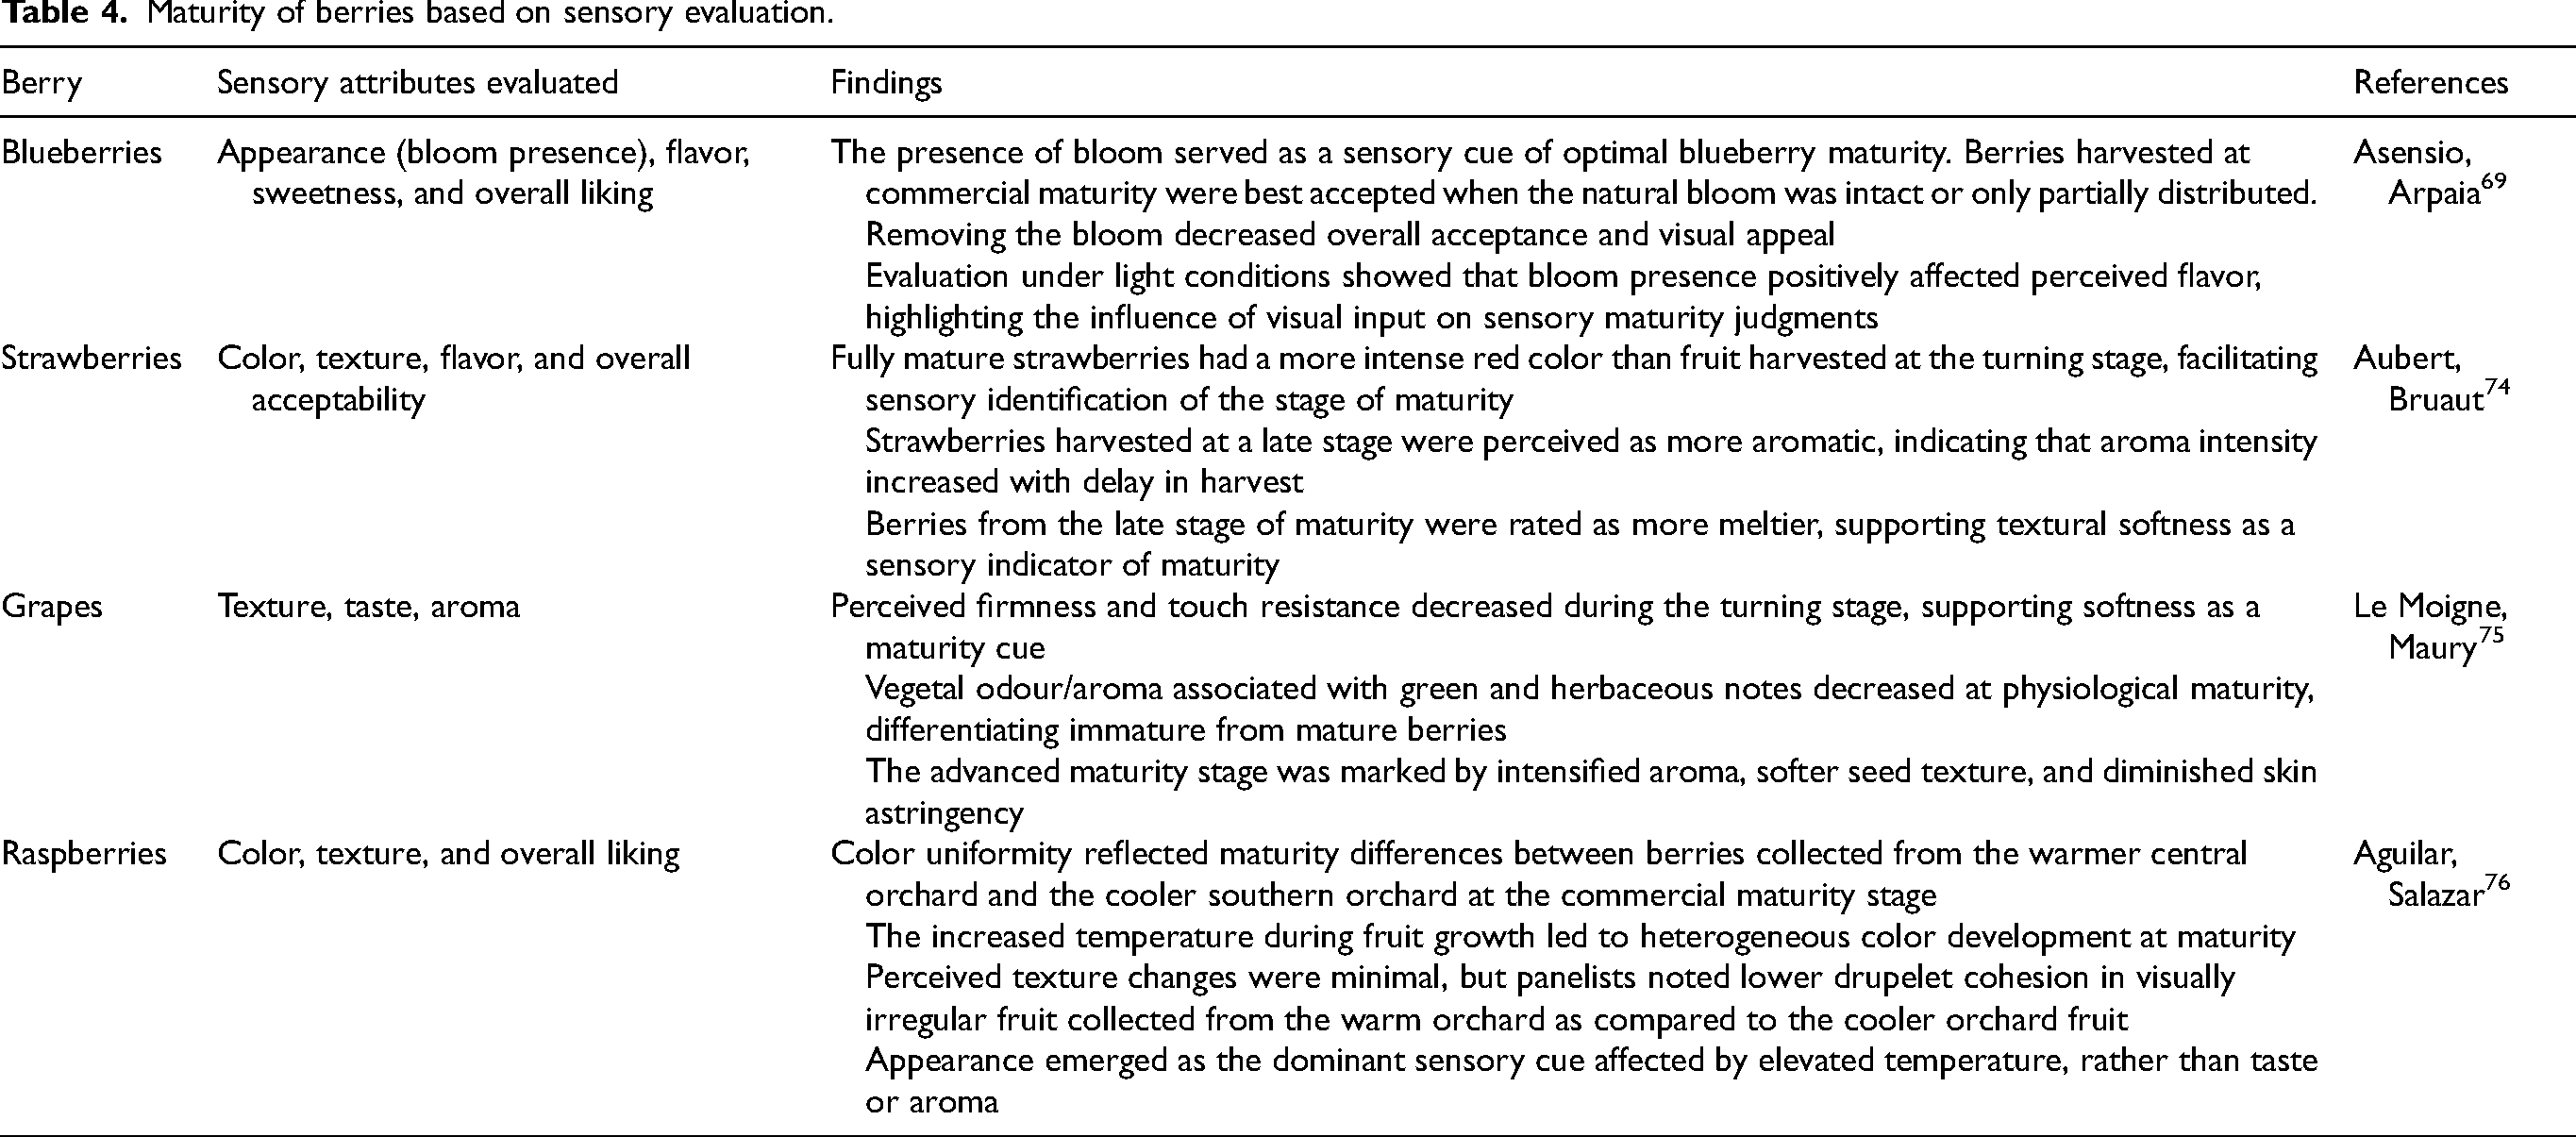
Consumer acceptance tests involve untrained panelists who are representative of the target market. These assessments provide consumer preferences and emotional reactions, concentrating on tests like hedonic ratings, ranking, and paired reference tests. 68 Many research studies have indicated a high correlation between consumer preferences and aroma maturity in blueberries, 69 grapes, 70 strawberries, 71 raspberries 72 and blackberries. 73 For example, a comparative study was conducted by Quispe-Sanchez, Mena-Chacon 33 to examine the sensory properties at different maturity stages of strawberries, goldenberries, blackberries, and blueberries. They found that maturity stages 5 and 6 were optimal for harvest. Strawberries and blueberries exhibited the highest scores for flavor and overall acceptability at these maturity stages. Goldenberries also received high scores in flavor and color, with a stable texture in comparison. Whereas blackberries recorded the lowest scores in flavor and overall acceptability. They concluded that a sugar acidity ratio less than 18 was considered the highest potential for post-harvest storage. Breeders and producers can optimize berry cultivars for quality and marketability by combining data from sensory panels, chemical profiling, and customer input. Some examples of maturity assessment based on sensory evaluation are summarized in the accompanying Table 4.
Maturity of berries based on sensory evaluation.
Molecular methods
Molecular approaches of maturity assessment, such as gene expression and targeted biochemical analyses, have emerged as a powerful tool that offers precision beyond traditional maturity indicators. By identifying genes that are upregulated or downregulated throughout various maturity phases, gene expression analysis sheds light on the physiological changes taking place in the fruit. In addition to gene expression data, biochemical profiling reveals the chemical makeup linked to berry development and ripening through the quantification of metabolites, sugars, acids, flavonoids, and anthocyanins, etc.
Wang, Liu 77 identified candidate genes GAST1, APX2, ATHB-12, AOS1, and NPF6.4 were associated with early maturity in grapes. These genes were expressed differently and together accelerated berry softening, color change, and sugar accumulation in the early-ripening cultivars Zaoxiaxiang, Chunxiangwuhe, and Sanbenti, where their higher expression during the physiological maturity stage contributed to faster maturation compared to the Summer Black cultivar. Shi, Xiao 43 profiled highbush blueberries physiologically and biochemically at four different maturity stages and revealed that blueberry maturity is marked by a decrease in firmness, acidity, and energy-related metabolites (e.g., ATP, ADP, AMP), alongside increased anthocyanin content, sugar content, and antioxidant enzyme activity. In strawberries, Xu, Chen 78 integrated physiological, metabolomic, and transcriptomic approaches and observed that genes involved in sucrose and citric acid metabolism were upregulated during ripening, while flavonoid biosynthesis was downregulated. They also identified the key regulatory role of abscisic acid and methyl jasmonate and transcription factors such as MYB (Myeloblastosis) and bHLH (Basic helix-loop-helix), in regulating ripening. Deluc, Grimplet 79 conducted a transcriptome investigation of raspberries across three maturity stages and identified 2363 differentially expressed genes reflecting the biochemical changes linked to fruit development. These genes were mostly involved in the degradation of aromatic compounds, cell wall alterations, plant hormone signal transmission, and flavonoid biosynthesis, all of which are essential for determining fruit maturity. Table 5 provides some other examples that highlight the importance of incorporating molecular data into frameworks for evaluating berry maturity.
Maturity of berries based on molecular methods.
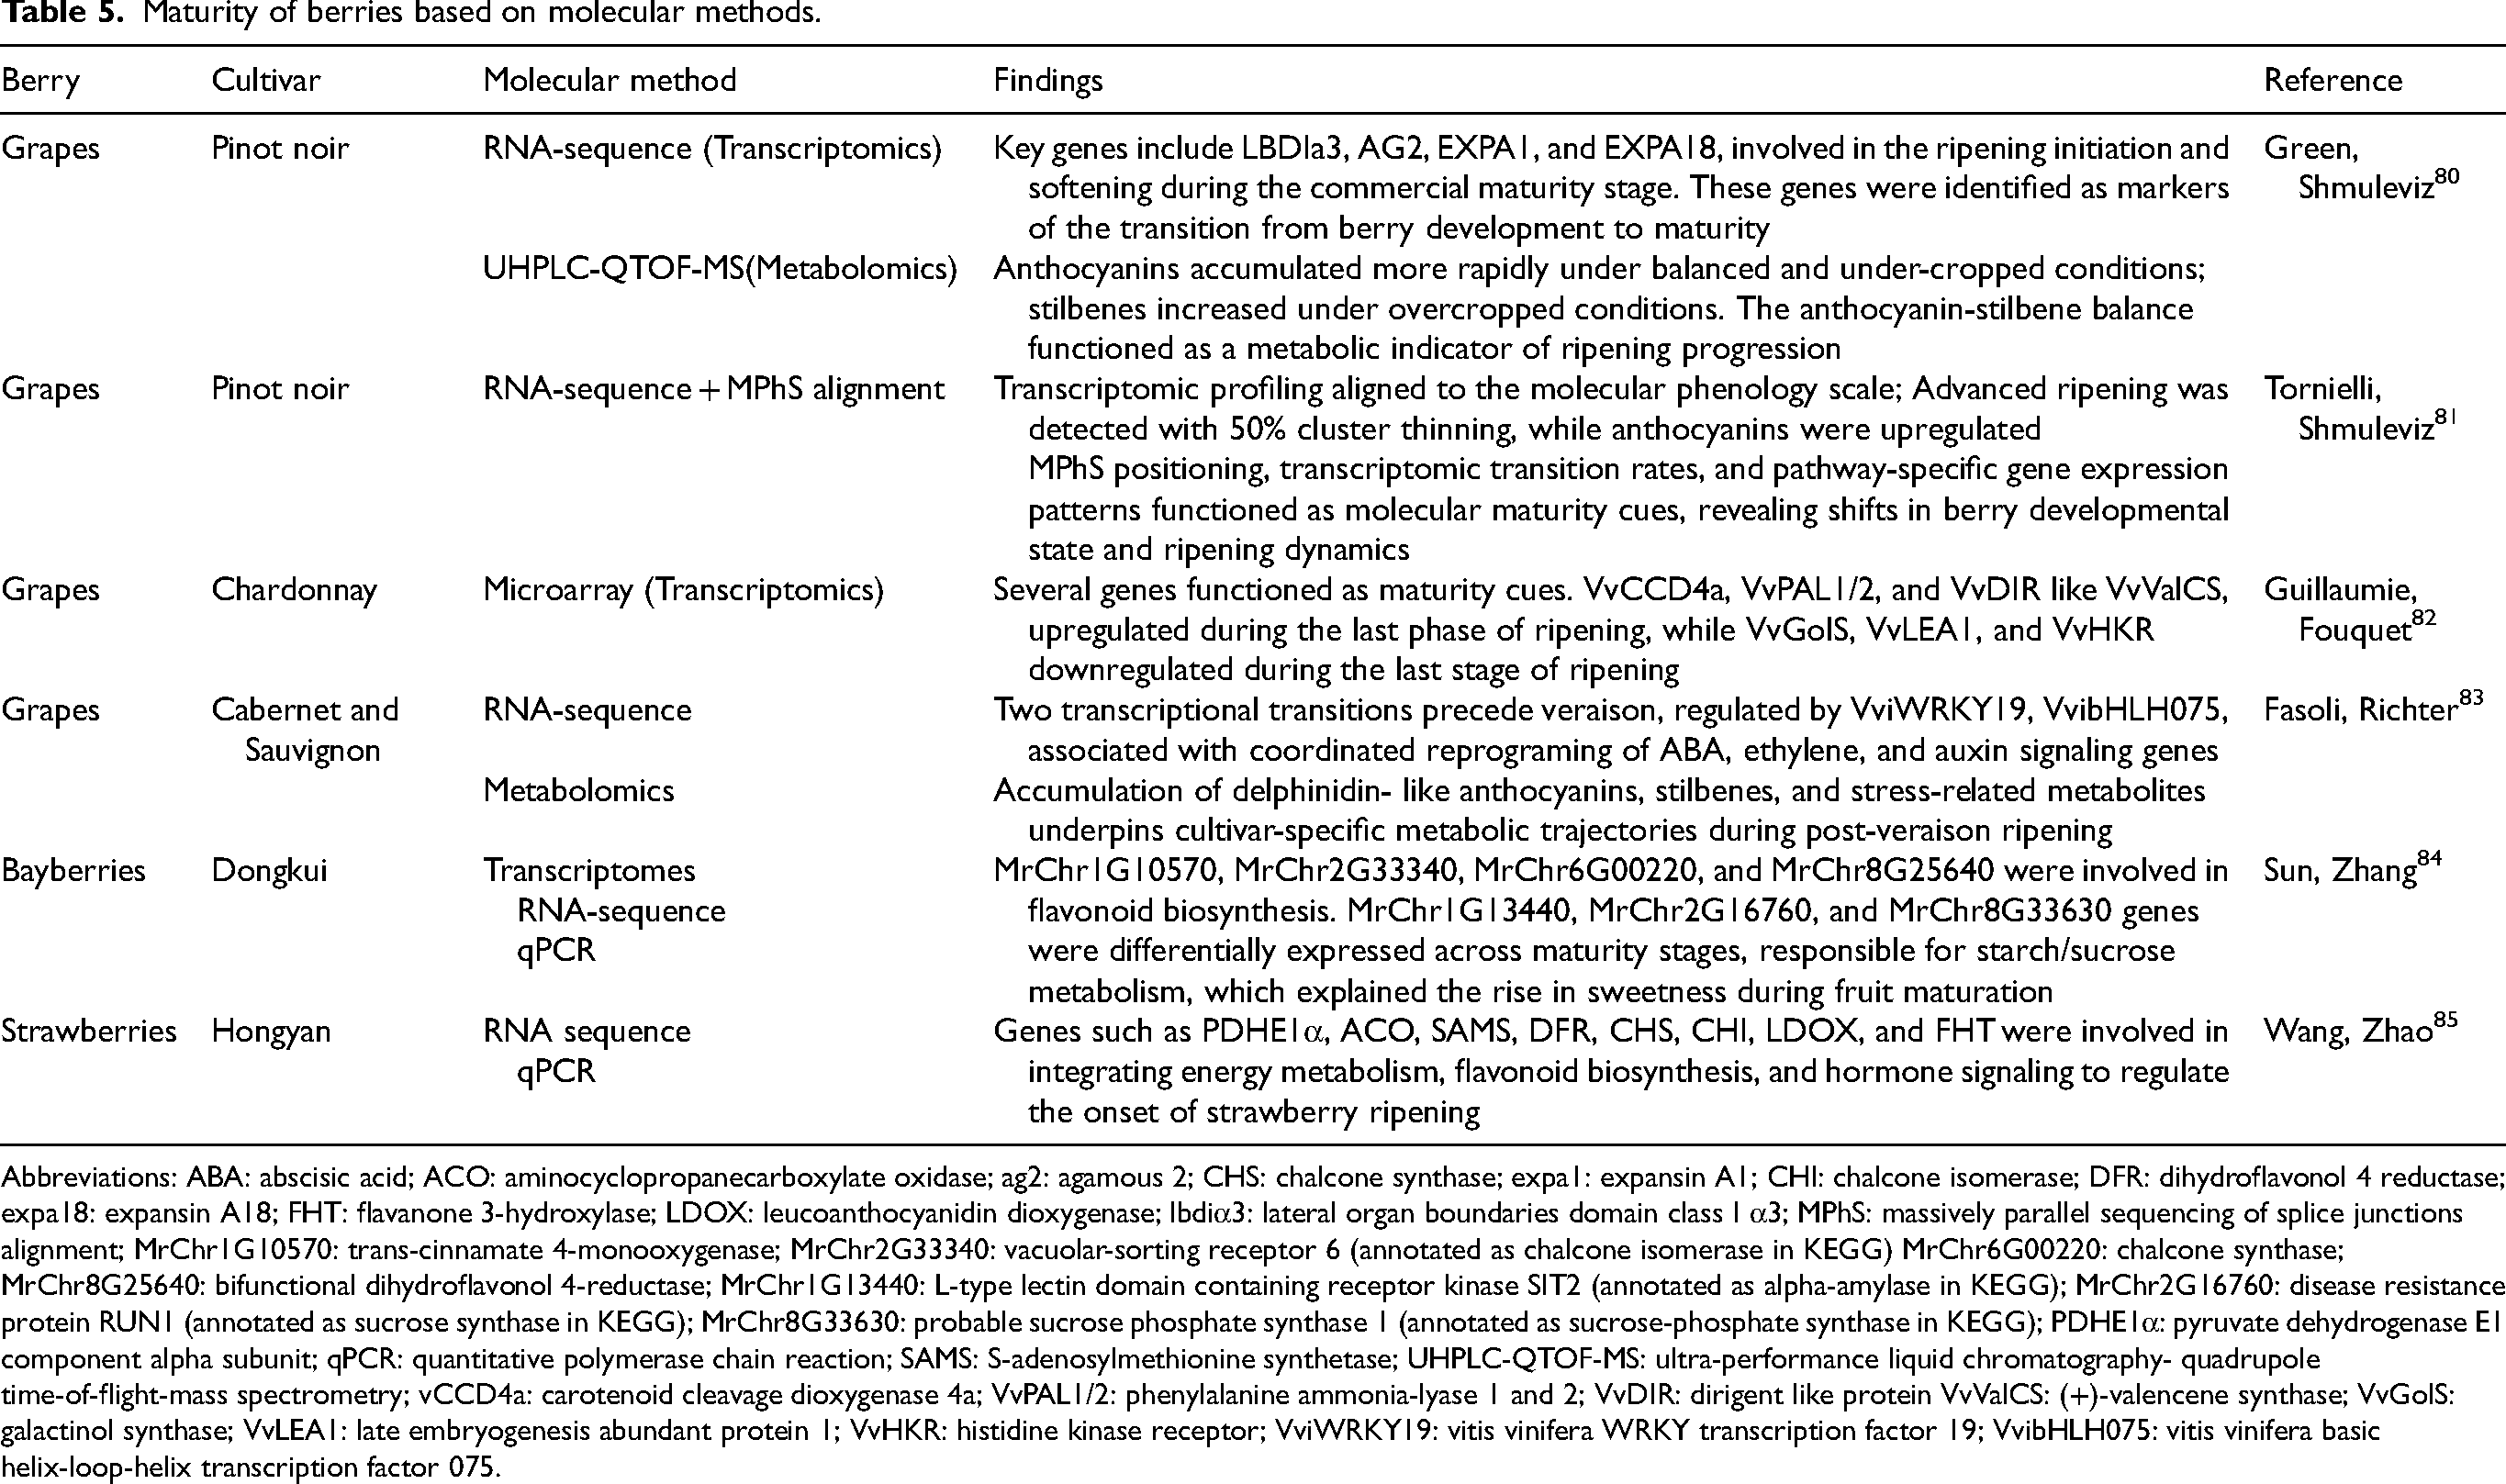
Abbreviations: ABA: abscisic acid; ACO: aminocyclopropanecarboxylate oxidase; ag2: agamous 2; CHS: chalcone synthase; expa1: expansin A1; CHI: chalcone isomerase; DFR: dihydroflavonol 4 reductase; expa18: expansin A18; FHT: flavanone 3-hydroxylase; LDOX: leucoanthocyanidin dioxygenase; lbdiα3: lateral organ boundaries domain class I α3; MPhS: massively parallel sequencing of splice junctions alignment; MrChr1G10570: trans-cinnamate 4-monooxygenase; MrChr2G33340: vacuolar-sorting receptor 6 (annotated as chalcone isomerase in KEGG) MrChr6G00220: chalcone synthase; MrChr8G25640: bifunctional dihydroflavonol 4-reductase; MrChr1G13440: L-type lectin domain containing receptor kinase SIT2 (annotated as alpha-amylase in KEGG); MrChr2G16760: disease resistance protein RUN1 (annotated as sucrose synthase in KEGG); MrChr8G33630: probable sucrose phosphate synthase 1 (annotated as sucrose-phosphate synthase in KEGG); PDHE1α: pyruvate dehydrogenase E1 component alpha subunit; qPCR: quantitative polymerase chain reaction; SAMS: S-adenosylmethionine synthetase; UHPLC-QTOF-MS: ultra-performance liquid chromatography- quadrupole time-of-flight-mass spectrometry; vCCD4a: carotenoid cleavage dioxygenase 4a; VvPAL1/2: phenylalanine ammonia-lyase 1 and 2; VvDIR: dirigent like protein VvValCS: (+)-valencene synthase; VvGolS: galactinol synthase; VvLEA1: late embryogenesis abundant protein 1; VvHKR: histidine kinase receptor; VviWRKY19: vitis vinifera WRKY transcription factor 19; VvibHLH075: vitis vinifera basic helix-loop-helix transcription factor 075.
Non-destructive methods
Non-destructive methods of maturity assessment play a significant role in modern farming and postharvest management since they are rapid tests without damaging the samples. These methods are based on cutting-edge technologies, which involve the detection of physical, chemical, and structural characteristics of fruits, such as firmness, color, anthocyanin content, Vitamin C, sugar, and moisture content.86–89 Common methods that are designed to evaluate the quality of agricultural and processed products include colorimetry, visible-RGB color imaging, visible-infrared spectroscopy NIRS, MSI, and HSI.32,89 These techniques yield encouraging results in different food quality assessments. The multivariate data obtained from these techniques can be used to develop either a quantitative model to determine the chemical composition or a qualitative model for classification. There are several multivariate methods for modeling, but the most common ones include neural networks, random forests, partial least squares, support vector machines, and general regression. These techniques provide important information for characterizing materials, but weak signals, environmental noise, experimental artifacts, sample contaminants, and scattering phenomena can easily alter them. Preprocessing steps such as noise smoothing, intensity scaling, and scatter correction are often used to reduce undesired variability and provide cleaner inputs that support more reliable modeling across these techniques. The performance of the prediction model of quantitative models is analyzed based on the coefficient of determination (R2), Root mean square error (RMSE), and bias. whereas metrics such as accuracy, precision, recall, and F1-score evaluate the model's ability to discriminate between classes in classification tasks.90,91
VNIR and NIR spectroscopy
Visible-near-infrared (VNIR) and NIRS are non-destructive analytical techniques being employed extensively in fundamental research to gain a better understanding of complicated biochemical processes. VNIR spectroscopy (400–1100 nm) records both visible and near-infrared wavelengths, making it possible to analyse changes in internal chemical composition and surface color. Whereas NIRS (780–2500 nm) penetrates deeper into fruit tissue, a few mm in depth. The fundamental working principle of these spectroscopy techniques is energy absorption by the material across a broad near-infrared (NIR) spectral range and recorded by the detector. When a sample interacts with visible light and near-infrared radiation, molecules absorb the incident radiation and vibrate at distinct frequencies due to the chemical makeup of the substance. NIRS spectra can provide specifics about the chemical bonds of organic compounds, mostly C-H, N-H, and O-H bonds. The absorption is associated with overtones and mixtures of vibrations that occur in molecules.89,92 A single-detector system is usually used in portable devices instead of an array detector, reducing the cost of the device. Fabry-Perot filters based on MEMS (Micro-Electro-Mechanical Systems) are used in these devices to filter out defined wavelengths from incident spectra. In a handheld NIRS device, usually the window is directly placed in contact with the sample, and spectra are captured. 93 Numerous research studies have confirmed the accuracy and adaptability of NIRS for maturity-related indicators in evaluating small berries, enabling rapid, non-destructive assessment of quality traits. Table 6 highlights the collection of case studies that demonstrate NIRS prediction ability across a variety of maturity characteristics.
Prediction models based on VNIR and NIRS spectral ranges linked to maturity indices in small berries.
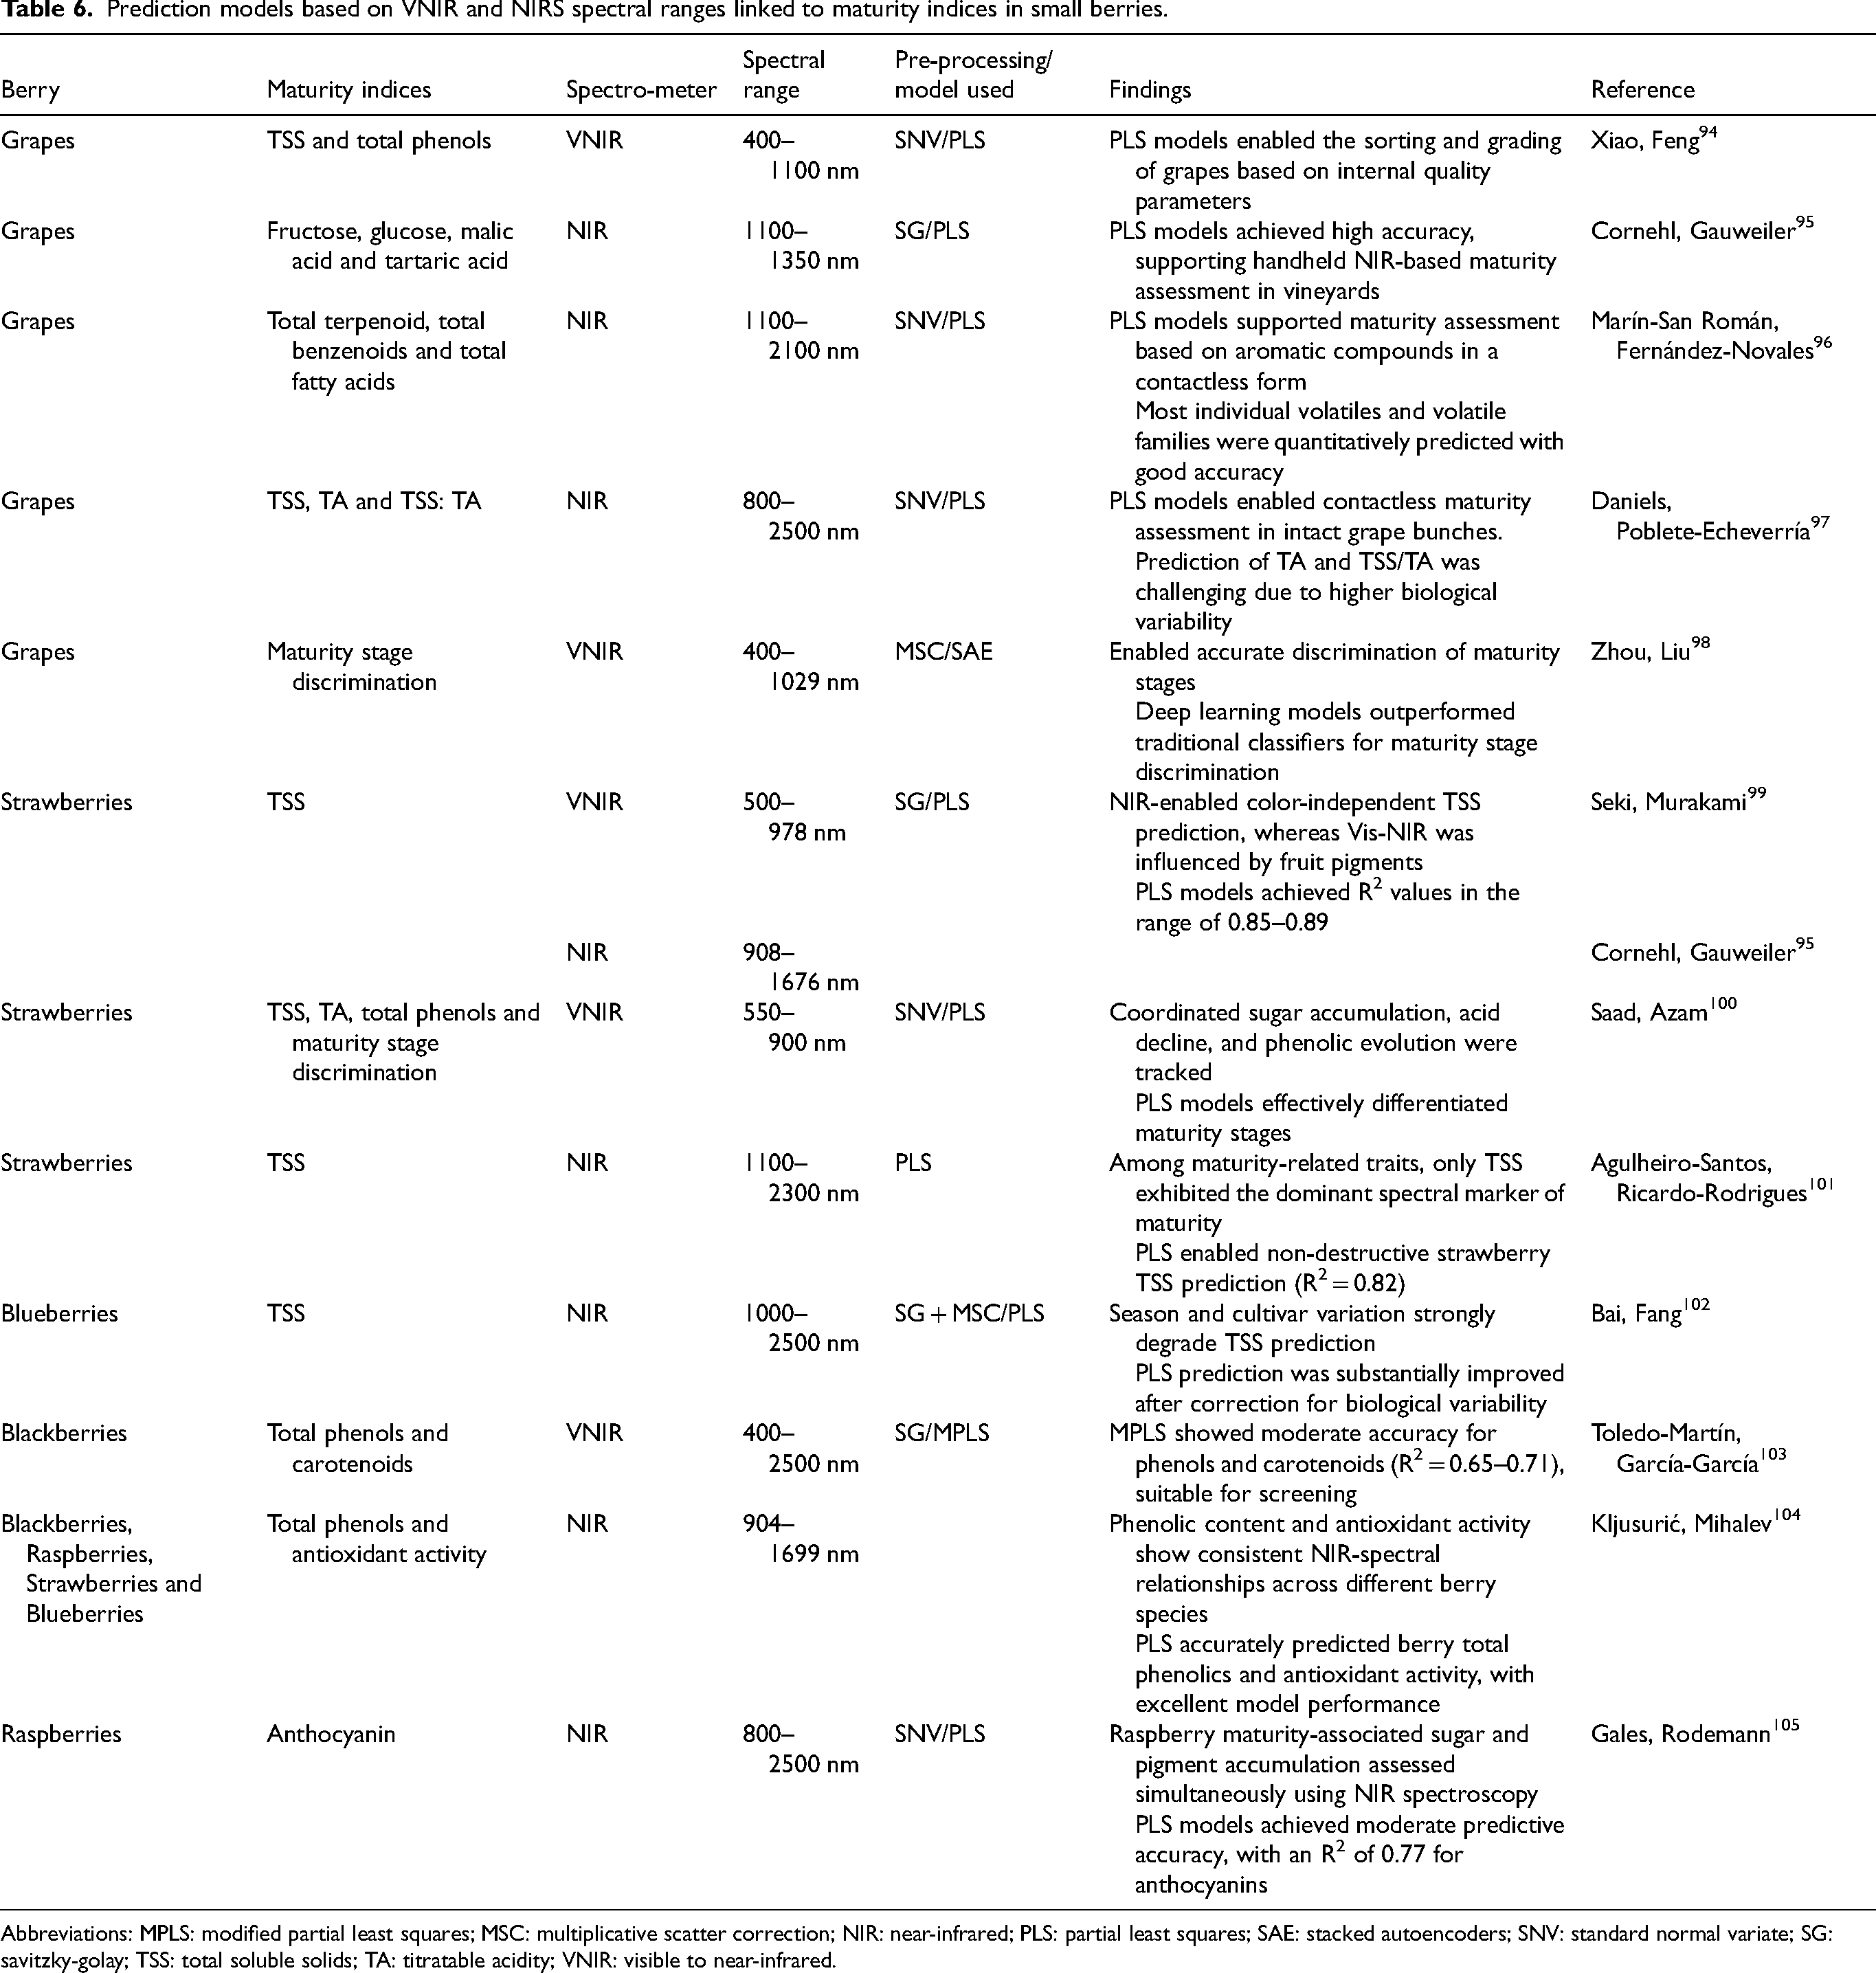
Abbreviations: MPLS: modified partial least squares; MSC: multiplicative scatter correction; NIR: near-infrared; PLS: partial least squares; SAE: stacked autoencoders; SNV: standard normal variate; SG: savitzky-golay; TSS: total soluble solids; TA: titratable acidity; VNIR: visible to near-infrared.
Imaging techniques
Hyperspectral imaging
HSI combines digital imaging with spectroscopy (e.g., Raman, fluorescence, and infrared spectroscopy). The key components of every HSI system are a light illumination source, a wavelength element, and an area detector. The main image acquisition approaches employed in HSI are line scanning, point scanning, area scanning, snapshot mode, and sensing mode by utilizing scattering, reflectance, transmittance, and fluorescence, based on the sample application requirements. 106
Hyperspectral data is stored in the form of a three-dimensional hypercube consisting of two-dimensional (2-D) pictures in digital format (X*Y) associated with the third-dimensional spectral information (λ). 107 This pixel-wise spectral information allows materials to be characterized based on their unique spectral signatures along with the spatial coordinates, enabling detailed analysis of compositional and structural properties. It is feasible to investigate the interactions of objects with many more bands, from 250 nm to 15,000 nm, with the help of hyperspectral imagery.108,109 The various steps involved in the hyperspectral processing are image analysis, data preprocessing, spectral analysis, prediction models development, and performance analysis.
In the context of maturity assessment, the fundamental goal of HSI is to develop a prediction model, either a regression-based or classification-based model, for characterization. Based on the identification task, the multivariate data should be used to develop either a quantitative model to determine the chemical composition or a qualitative model to detect bruises and diseases of agricultural produce. 110 For example, Huang, Wang 111 created a model for early fungal disease detection in blueberries. Similarly, Wu, Fang 112 and Zhang, Ou 113 made models for gray mold and anthracnose early disease detection models in strawberry leaves. The foundation of these hyperspectral models involves learning from the provided data; distinct datasets are usually required for training, validation, and testing. The complexity and high dimensionality of hyperspectral data make it difficult to analyze and extract useful information using conventional statistical techniques. Whereas machine learning enables the interpretation of data precisely by recognizing patterns and relationships in high-dimensional data. There are several multivariate methods for quantitative modeling, but the most common ones include neural networks, random forests, partial least squares, support vector machines, and general regression. 109 Table 7 offers an overview of research efforts employing HSI to predict maturity indicators in small berries. These studies demonstrate the application of HSI for modeling key maturity indicators such as pigment dynamics, sugar accumulation, and firmness evolution across different berry types. This highlights HSI in expanding importance in data-driven maturity evaluation and offers a clear benchmark for assessing the predictive ability and applicability of HSI in precision horticulture.
HSI for maturity assessment of small berries.
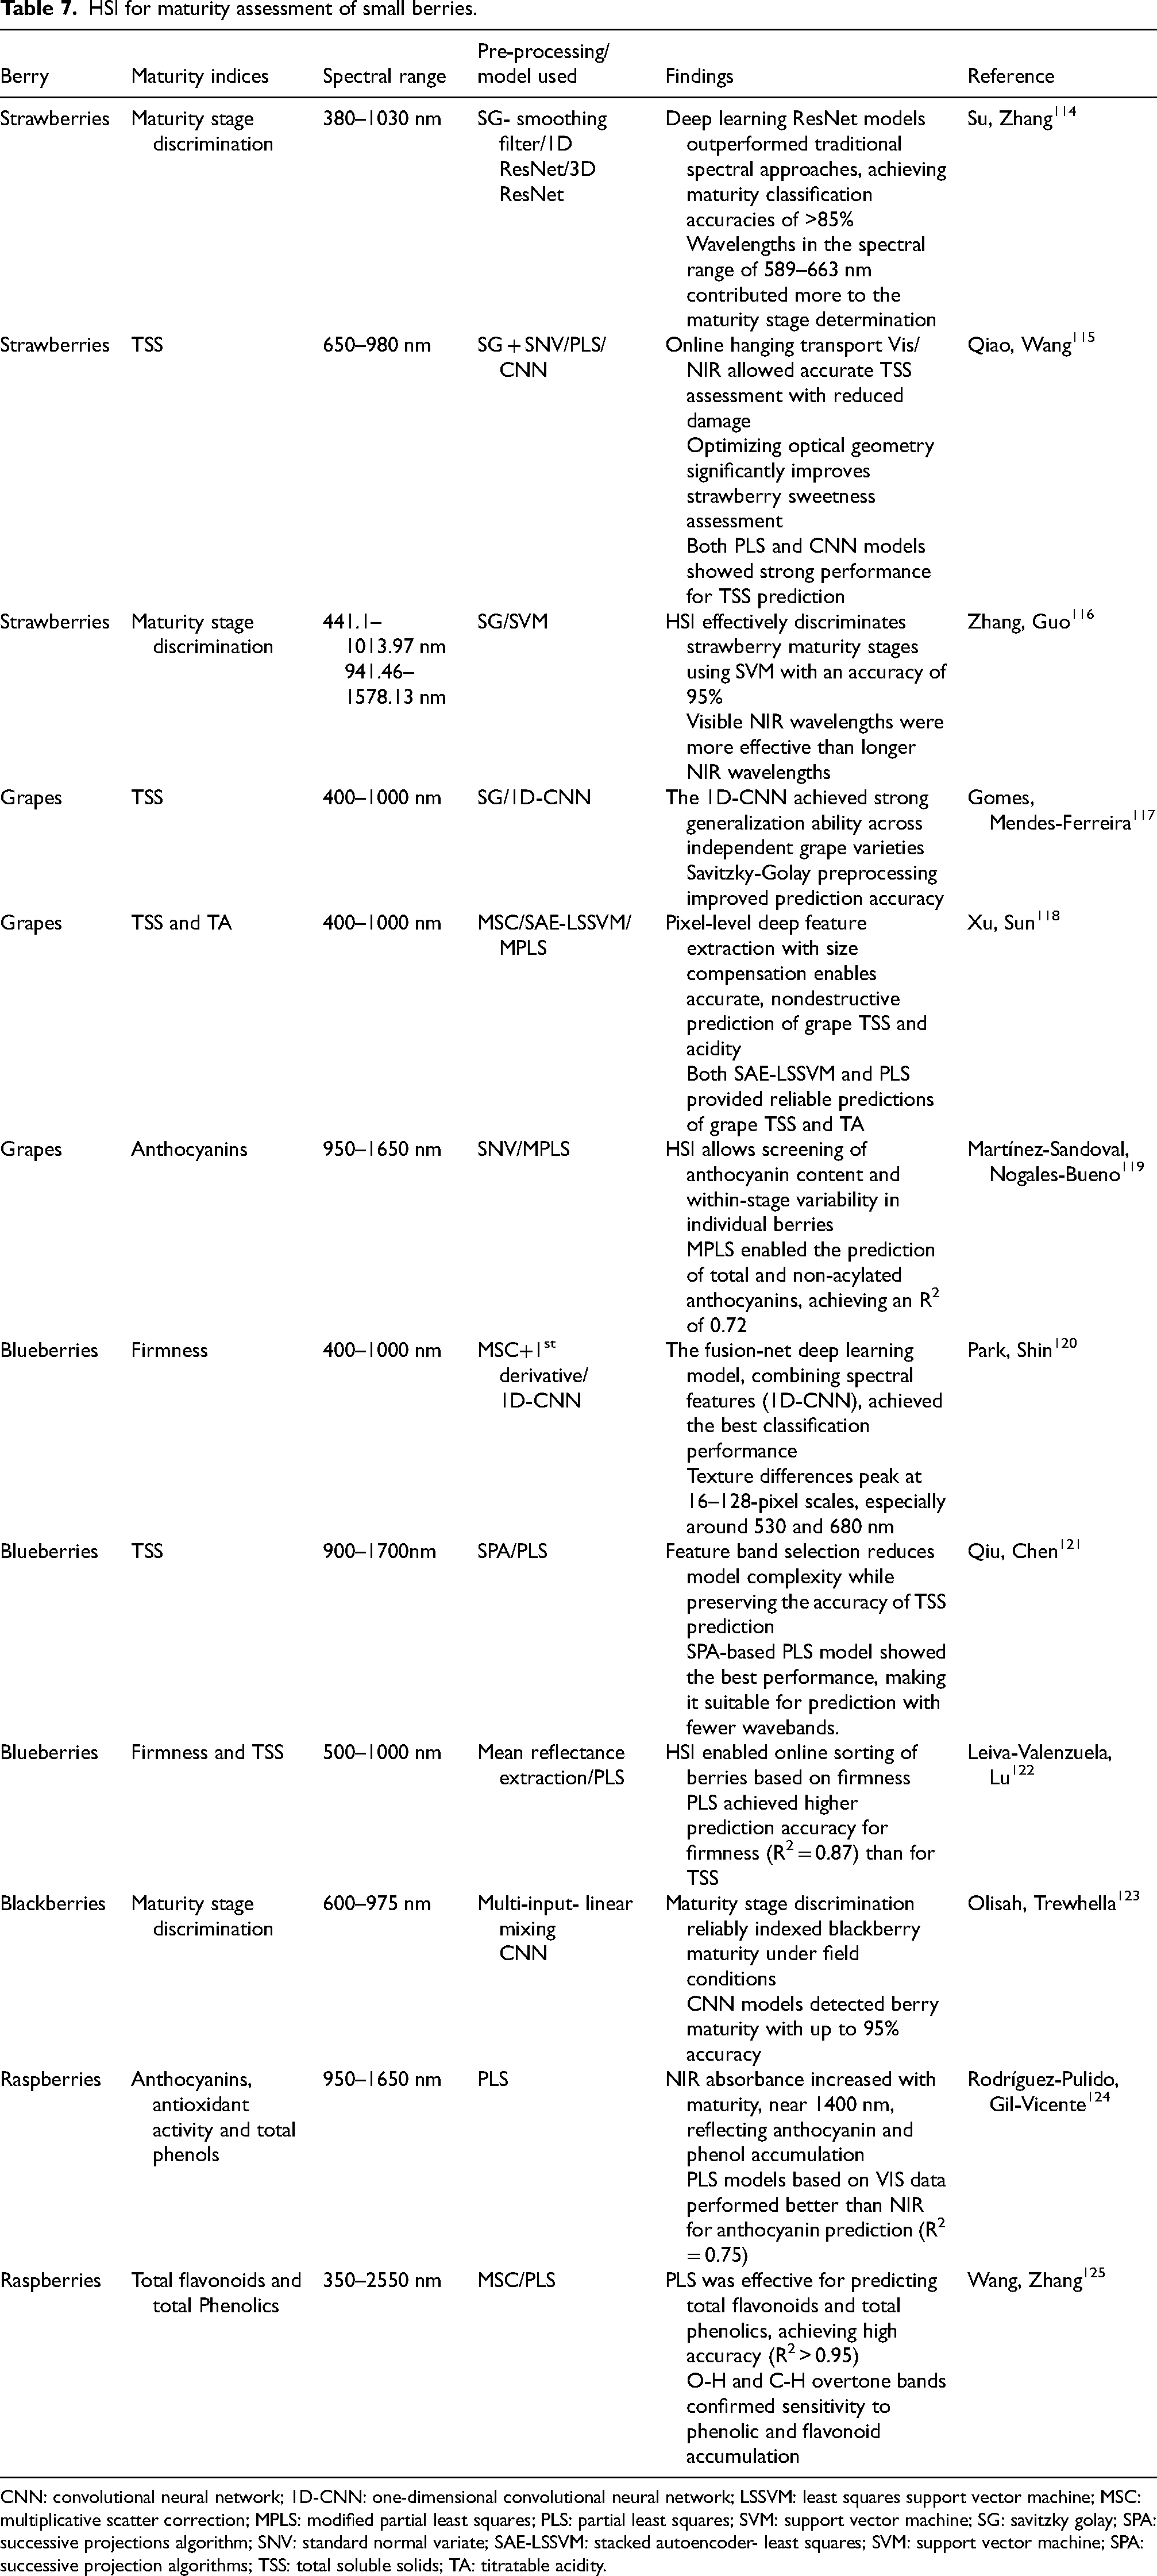
CNN: convolutional neural network; 1D-CNN: one-dimensional convolutional neural network; LSSVM: least squares support vector machine; MSC: multiplicative scatter correction; MPLS: modified partial least squares; PLS: partial least squares; SVM: support vector machine; SG: savitzky golay; SPA: successive projections algorithm; SNV: standard normal variate; SAE-LSSVM: stacked autoencoder- least squares; SVM: support vector machine; SPA: successive projection algorithms; TSS: total soluble solids; TA: titratable acidity.
Multispectral imaging
MSI is an advanced optical sensing technique used for non-destructive assessment of maturity. Like HSI, MSI shares a common goal of extracting spectral information, but they differ significantly in spectral resolution and data complexity. MSI captures images at a limited wavelength band, usually 3–10, while HSI can capture 100's of contiguous spectral bands, providing a much more detailed spectral fingerprint of the target. These bands are deliberately chosen to focus on characteristics or chemical attributes. MSI is ideal for maturity assessment since they are simpler, quicker, and more affordable.126,127 The primary advantage of MSI is its nondestructive nature, which permits repeated measurement without causing sample damage or alteration. This is especially beneficial for infield monitoring, supply chain efficiency, and optimizing harvesting time.128,129
In the context of small berries (Table 8) such as strawberries, blueberries, grapes, raspberries, and blackberries, MSI has demonstrated high potential for maturity prediction, prediction of physiochemical attributes, as well as sorting and grading of fruits. To identify significant trends and create prediction models, captured images are then analysed using machine learning algorithms, including support vector machines (SVM), partial least squares regression (PLSR), and neural networks. 130 This technique offers a more efficient and flexible option for commercial applications in berry production systems since it simplifies data, speeds up processing, and minimizes hardware costs. Table 8 demonstrates the research on berry maturity indicators based on MSI, and it can be concluded that research on berry maturity has delivered reliable results.
Maturity assessment by multispectral imaging in small berries.
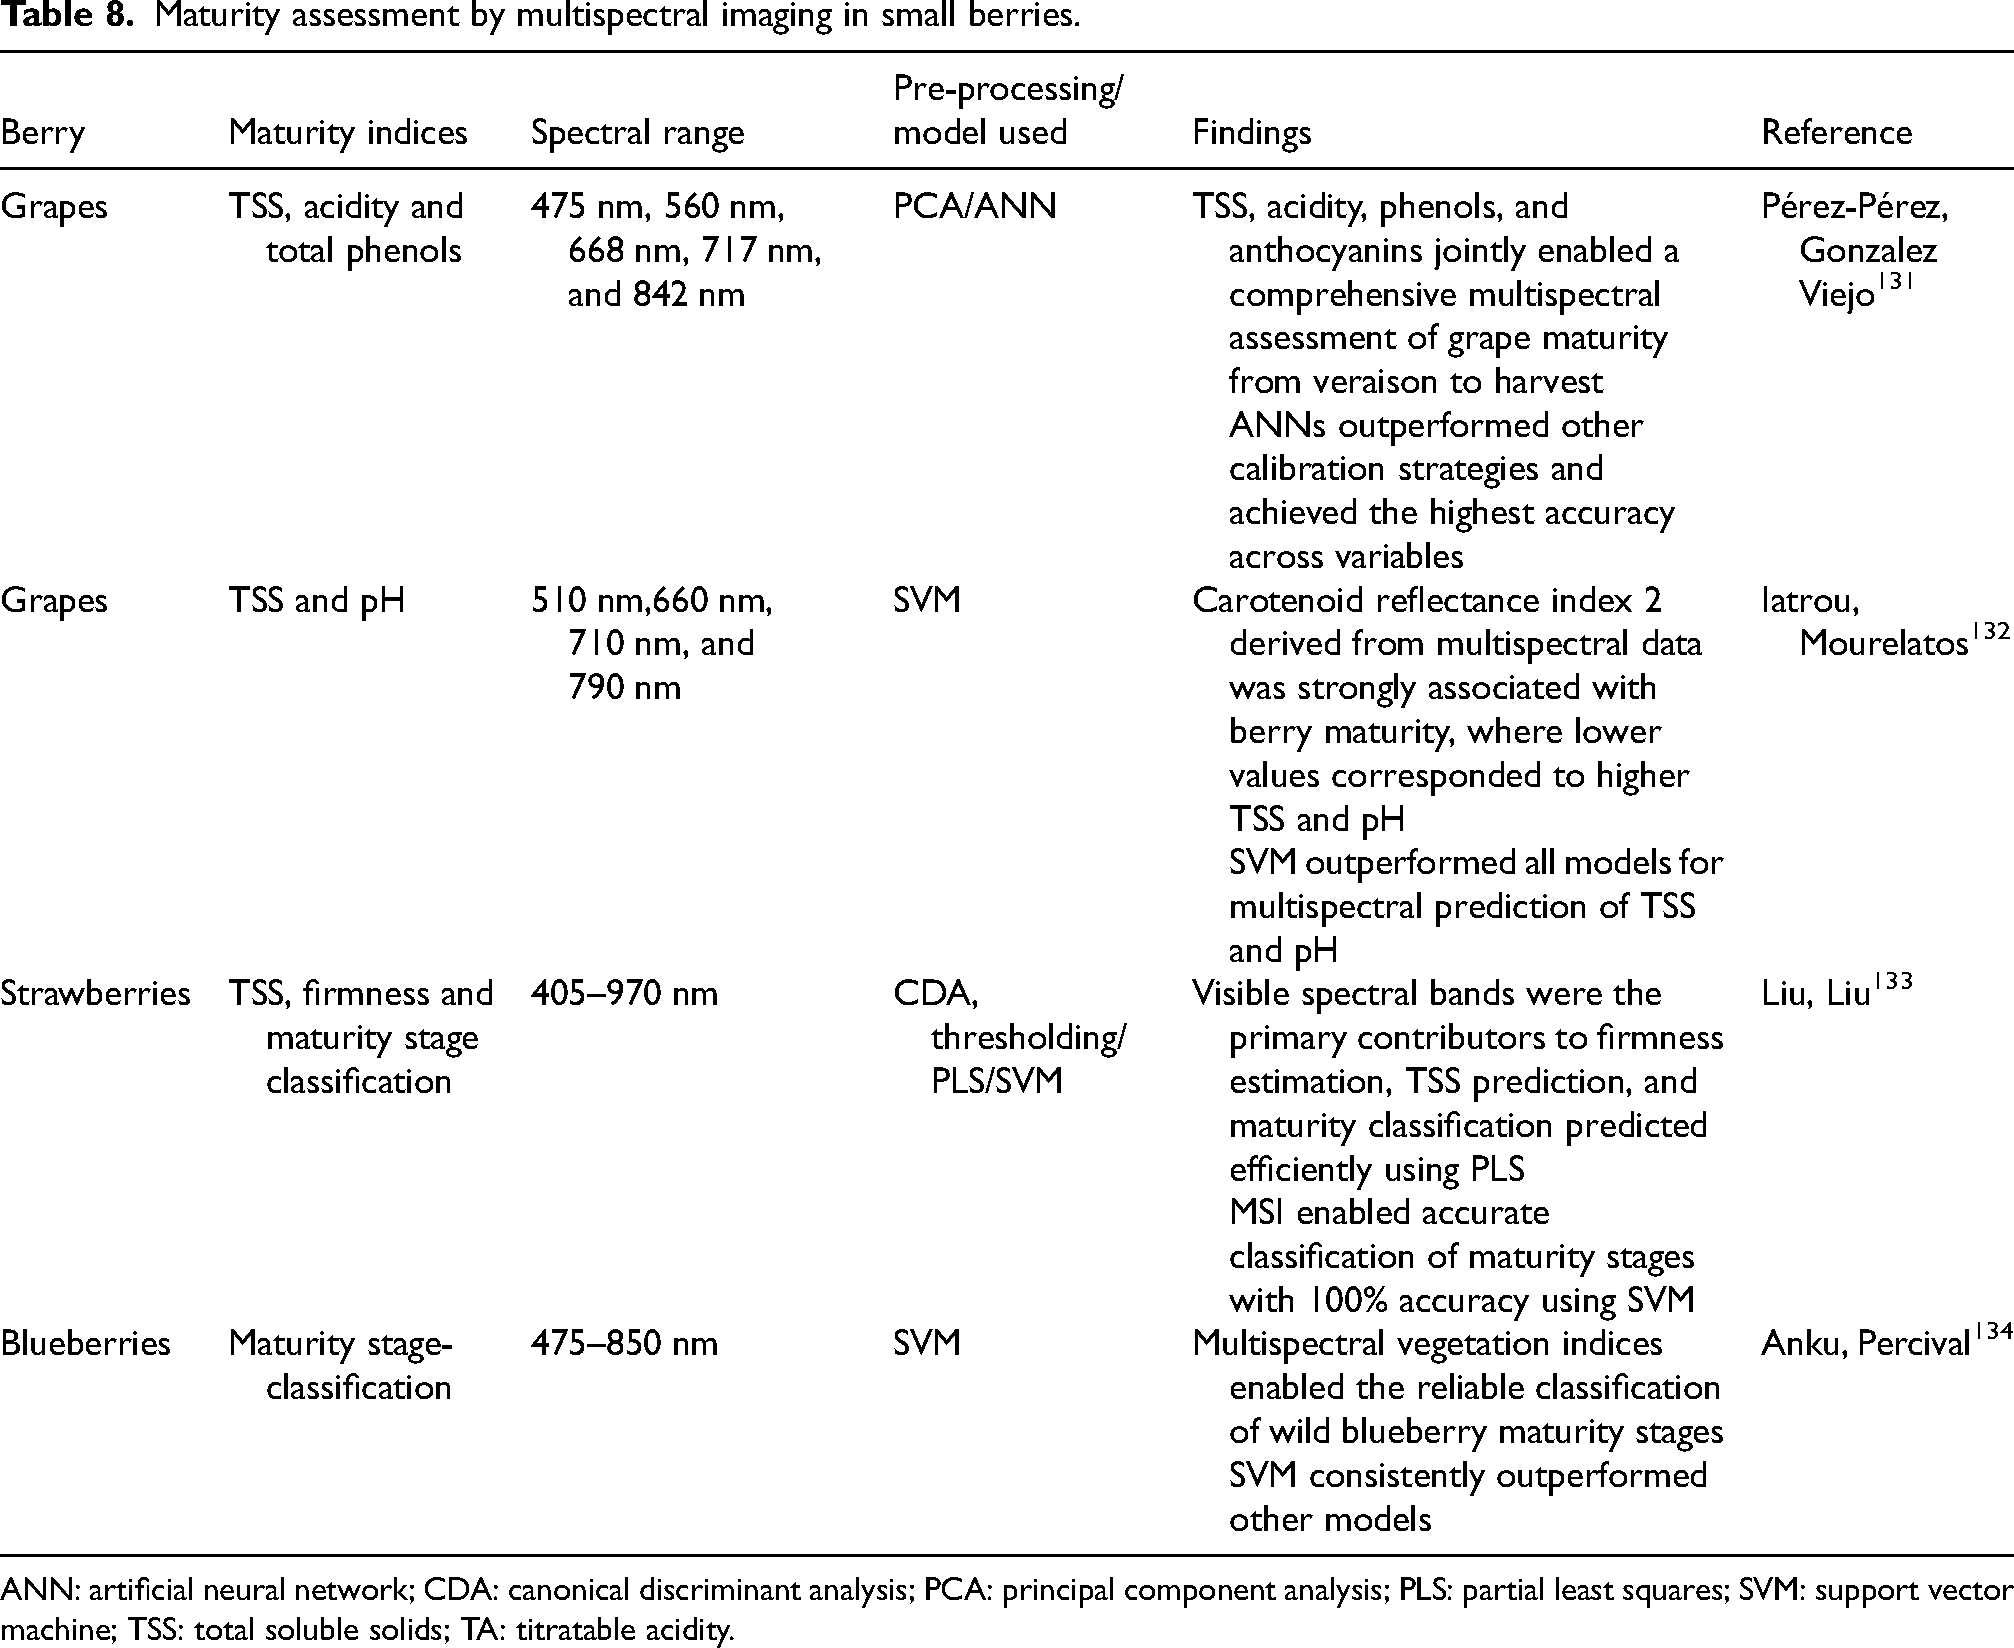
ANN: artificial neural network; CDA: canonical discriminant analysis; PCA: principal component analysis; PLS: partial least squares; SVM: support vector machine; TSS: total soluble solids; TA: titratable acidity.
RGB imaging
The limitations of traditional laboratory techniques have been addressed by recent developments in non-destructive fruit maturity assessment, which have made use of RGB color imaging in association with machine learning approaches. RGB images can be captured diversely with low requirements of environmental conditions. 135 Barbosa Júnior, Santos 15 have recently presented a framework for evaluating blueberry quality, specifically firmness and total soluble solids, using RGB images captured using a mobile camera (Apple iPhone 15 Pro Max) and three other rear cameras. Images were captured under regulated lighting conditions and further processed to extract the spectral data (e.g., red, green, and blue), which were then correlated with laboratory-analysed quality characteristics. Machine learning integration significantly improved the performance of detection. RGB bands displayed substantial internal correlation and a moderate correlation with firmness (r ≤ 0.41) and TSS (r ≤ −0.39). High accuracy was accomplished by eight machine learning methods, including multiple linear regression (MLR), SVM, and artificial neural network (ANN) (R2 up to 0.98, RMSE as low as 0.004), predominantly when trained on simulated datasets formed using Bayesian generalized linear models. This research shows that image-based methods may successfully record and analyse even minute color changes in mature fruits that are invisible to the human eye.
Similarly, Yue, Shang 136 proposed a solution for assessing strawberry maturity with a smartphone equipped with optical filters at 535 nm (anthocyanin-sensitive) and 670 nm (chlorophyll-sensitive), established based on images captured at three maturity stages: mature, nearly-mature, and immature. Each image region of interest was used to determine the absorbance values, and three classification models, SoftMax regression, MLR, and multiple non-linear regression (MNLR) were developed. With a cross-validation accuracy of 97.78% in laboratory conditions and 94.44% in greenhouse field tests, the MNR model outperformed the others. Wei, Wu 137 predicted the maturity of greenhouse grapes using RGB imaging associated with the back-propagation neural network algorithm. Prediction accuracies of 76%, 81.3%, and 88% were attained by the two-factor models, Red-green color channels for drunk incense, HI (Hue intensity components) for Muscat Hamburg, and Xiang Yue cultivars, respectively. These research studies exhibited that the maturity assessment based on assorted color channels is an affordable and efficient non-destructive technique that can be used for the maturity detection of small berries.
Comparative analysis of destructive vs. non-destructive methods
Both destructive and non-destructive methods offer distinct advantages and limitations across accuracy, practical implementation, and economic feasibility. Since destructive methods use physical testing to determine material qualities directly, they are renowned for their precision as well as sensitivity. But they need sample destruction, specific tools, and skilled workers, which restricts their use in the field and raises operating expenses. While non-destructive methods offer in-field applicability, they are rapid, easy to adapt, but require training of the model. Many non-destructive methods are particularly useful for regular inspections and real-time monitoring because of their portability and capacity to maintain sample integrity, provided they are standardized against reference data obtained from selected destructive analyses. Over time, non-destructive methods, even though their initial investment cost on instrument is high, but its capacity to reuse, and savings from not incurring higher costs due to consumables and labor charges lead to significant savings, especially in businesses that require frequent testing.
The maturity markers of small berries still primarily rely on major destructive indices such as TSS, TA, TSS:TA, and firmness. Because they accurately reflect the changes that define flavor, quality, harvest readiness, and shelf life potential. Non-destructive techniques have various advantages over destructive techniques, although various challenges have prevented these techniques from performing at their higher capability. Conventional NIRS systems are well known for their capacity to quickly estimate chemical properties; their operational versatility has usually been constrained by their reliance on benchtop spectrometers. These limitations have accelerated interest in portable NIRS devices, which do not yet match the spatial richness of HSI systems. Although HSI offers a wide range of applications and great spectral-spatial resolution, its operational efficiency is limited by benchtop configurations, sensor variability, and calibration specifications. Meanwhile, RGB imaging provides a low-cost, highly scalable, and operationally viable sensing method. But RGB sensors are extremely sensitive to variations in light, shadows, occlusion, and background interference since they only use visible-spectrum color signals. 138 While maturity assessment by MSI has significant drawbacks, it has benefits over RGB imaging. A multispectral camera can record a small number of broad spectral bands; it is unable to detect subtle changes that call for better spectral resolution. Because of this limitation, MSI is less sensitive than HSI and NIRS in identifying subtle differences linked to maturity. The imaging techniques generally demand extensive computing effort because extracting meaningful features from images is time-consuming. The reliability to determine the maturity is influenced by numerous elements such as lightning conditions, the chosen preprocessing techniques, the calibration strategy applied, variable environment factors, and the accuracy of sample presentation. 14 Research interest in this topic is anticipated to increase as detection algorithms and data processing techniques continue to advance, and as non-destructive technologies become more practical for direct field usage.
Based on our literature review, we find that the partial least squares (PLS) algorithm remains the most employed algorithm for spectral data due to its capability of handling multicollinearity effectively and extracting meaningful information from high-dimensional signals. Likewise, neural networks are extensively used for imaging techniques due to their potential for learning complex patterns and delivering high-accuracy results. Despite their success, neural network models inherently operate as black box systems that offer limited transparency into how decisions are made. This lack of interpretation has a significant limitation in applications that require clear reasoning and traceability. As artificial intelligence (AI) has become increasingly integrated into computer vision systems, traditional feature methods have largely been superseded by deep learning-based approaches. These deep learning approaches have demonstrated a high degree of efficacy in identifying maturity stages in challenging conditions.
A crucial drawback of models trained with non-destructive data is their reliance on cultivar- specific characteristics. The transferability of models among cultivars is limited by differences in chemical composition and internal structure, which lowers their general applicability. The reliability of any prediction model is closely linked to the size and diversity of training datasets. When the training set lacks sufficient diversity, the model becomes unduly specialized and performs exceptionally well on known samples but fails to generalize to untested datasets. Likewise, another challenge in determining commercial maturity is especially troublesome because models that are usually trained on small or homogeneous datasets often lose accuracy when faced with fruit from multiple cultivars, orchards, seasons, or environmental conditions. The development of berries is greatly influenced by environmental factors like temperature, humidity, and light exposure levels. However, it's crucial to take these predictions into account when determining the best time to harvest.
Composite maturity index
In fruit and berry production, maturity indicators are used to both anticipate postharvest behavior and determine optimal harvest time. TSS, TA, TSS:TA ratio, parameters, fruit size, and dry matter content are examples of characteristics that track maturity progress and are generally used to determine when to harvest. Postharvest quality prediction relies more on indicators of metabolic activity and structural indicators during storage, including ethylene accumulation, respiration rate, firmness, weight loss, and biochemical components such as anthocyanins and phenolics. Recent research emphasizes composite maturity indices that incorporate several maturity indicators together because individual indicators only capture a part of the maturity process. To the best of our knowledge composite maturity index is still not widely explored in the case of berries, but it has been used in other fruit crops. For instance, Shafaei-Cherush, Arzani 139 constructed a composite framework for pears that correlates different variables such as peel color, nutraceutical content (e.g., phenolics, flavonoids, and anthocyanins), and dry matter with harvest index by using partial least squares path modeling. This approach allowed the researchers to find the relationship between direct and indirect variables. Likewise, Kumar, Singh 140 constructed a composite maturity index for the Ber crop by normalizing six quality parameters (firmness, total soluble solids, carotenoid content, phenolic content, flavonoid content, and antioxidant capacity) at multiple developmental stages into a single index. According to this integrative approach, they found that most cultivars reached their ideal quality for harvest at 154 days after full bloom, whereas ZG-2 reached maturity earlier at 140 days, which simplified complex data into a farmer-friendly recommendation.
Commercial maturity assessment in haskap berries
Overview and importance of haskap commercialization
Haskap (Lonicera caerulea L.), also known as camerise (in French), honeyberry, swamp fly honeysuckle, or blue honeysuckle, exhibits a very short life cycle, high cold tolerance, and is prominently adapted to the extreme northern hemisphere climate up to −47 °C. 141 Haskap can be spotted in moist areas or high-elevation zones of mountains in Europe, Asia, and North America. Japan's Hokkaido Island is known for consuming the haskap for decades. Some of the native wild varieties of haskap are grown in the northern island of Hokkaido and the regions of Tochigi, Akita, and Shizuoka. 141 In the middle of the twentieth century, Siberian horticulturists eventually led to the gathering of wild samples of haskap and began cultivation initiatives throughout the former USSR (Union of Soviet Socialist Republics). 21 Haskap flourishes in much of Canada and the northern half of the USA. Haskap's exceptionally rapid phenology, cold resilience, and fruit's substantial amount of nutraceutical attributes, distinct flavor profiles and odors, and range of different geometrical shape patterns constitute several of its key characteristics. 22 Similarly, the University of Saskatchewan ramped up its development activities at the end of the nineties, yielding 8000 distinct haskap hybrid types. Agricultural cultivation in the provinces of Canada was made possible by this development project. Currently, there are more than 40 varieties of haskap cultivars in North America. Over two thousand seedlings from Japan and one thousand from parents from Russia and the Kuril Islands were sown in Canada in 2005. With no signs of pests, nearly 95% of the plants made it through winter.142,143 Numerous varieties, such as Indigo Gem, Tundra, Aurora, Borealis, Boreal Beauty, Boreal Beast, and Berry Blue, were introduced to Canada in the early 2000's.
The other constraint is the limited understanding of postharvest physiology. At present, farmers rely on three basic maturity indicators, which are often used individually: a) the number of days preceding flowering, b) the berry's interior and surface color, and c) the amount of total soluble solids. 25 Moreover, genetic variability also plays a significant role, allowing some varieties to be harvested at varying intervals of the season and even exhibit unique sensory characteristics that increase consumer acceptance. Also, knowing a specific cultivar's maturity characteristics may not always apply to an alternate cultivar's quality specifications for deciding when to harvest it. Therefore, harvest and post-harvest management of haskap still needs a lot of work, despite established guidelines for their production.
Haskap maturity and physiology
Despite the growing interest in the haskap as an emerging crop in North America, there is limited research on its postharvest behavior and maturity physiology. According to the report of the Agricultural and Agri-Food Canada, 144 the earliest stage of haskap fruit development follows a sequence that begins with bud swelling, and bud burst occurs in the early spring in Canada at 82–104 growing degree-days (GDD). Depending on the cultivar, the onset of the flowering stage usually occurs between 187 and 228 GDD. The plant attains full bloom as flowering advances, which takes place between 267 and 316 GDD between mid-April and early May. After pollination and fertilization, the plants reach the fruit-set stage, during which small developing berries become visible. During the early fruit development stage, these berries grow in size while staying firm and green, indicating the green-fruit set stage. Berries transform from green to mottled blue during ripening, which usually starts when plants reach 636–751 GDD, typically in early June. As berries get closer to full size, this transition quickens, resulting in evenly blue fruit around 665–790 GDD. Cultivar-specific maturation occurs around 772–994 GDD, corresponding to mid-June into late-July, at which berries acquire their distinctive deep blue-black color and softer texture.
Leisso, Jarrett 23 examined how maturation stages affected respiration and ethylene production in two cultivars, namely Aurora and Tana. Their findings showed that from early development to softening stages, soluble solid content (SSC) gradually increased while firmness decreased. As ripening progressed, ethylene production increased and peaked when the berry color turned dark blue, indicating its role in maturation. However, they concluded that despite ethylene playing a part, the lack of a corresponding rise in respiration (CO2 evolution) suggests that haskap does not adhere to the climacteric ripening model. Furthermore, their study emphasizes the need for more investigation into the physiology of haskap, specifically regarding internal ethylene dynamics, ripening molecular pathways, and cultivar-specific reactions. However, the role of ethylene's involvement in haskap remains unresolved. This gap emphasizes the need to determine whether haskap follows an ethylene-regulated ripening pathway or serves only as a secondary signal. Research on numerous berry studies exhibits that ethylene influences pigmentation, firmness loss, sugar accumulation, and other ripening processes through hormonal crosstalk involving auxins, jasmonate, and abscisic acid.145–148 Nevertheless, haskap's ethylene response pathways and ability to respond to treatments such as 1-methylcyclopropene (1-MCP) and aminoethoxyvinylglycine (AVG), which are used to postpone ripening, are still mostly unknown. The haskap industry lacks sufficient evidence on cultivar-specific respiration and ethylene behavior under varied conditions, which supports the possibility of preserving firmness and preventing shrivel and overall quality.
One of the key knowledge gaps in haskap studies is the unclear link between maturity stage and postharvest susceptibility to damage, which has significant consequences for storage performance. Leisso, Jarrett 149 exhibited that neither early nor completely mature phases provide strong handling tolerance since berries collected at the earlier half blue maturity stage had lower fresh weight and inferior quality, while more mature, softening-stage berries show greater postharvest fragility due to a drop in flesh firmness. Leisso, Jarrett 23 demonstrated that the storage life of haskap berries is limited only up to 7–10 days, largely due to shrivel identified as the principal factor responsible for this restriction. Notably, they observed visible shriveling in some cultivars at the time of harvest, highlighting the need to further refine cultivar-specific harvest indices to minimize the early onset of fragility and to improve the postharvest performance.
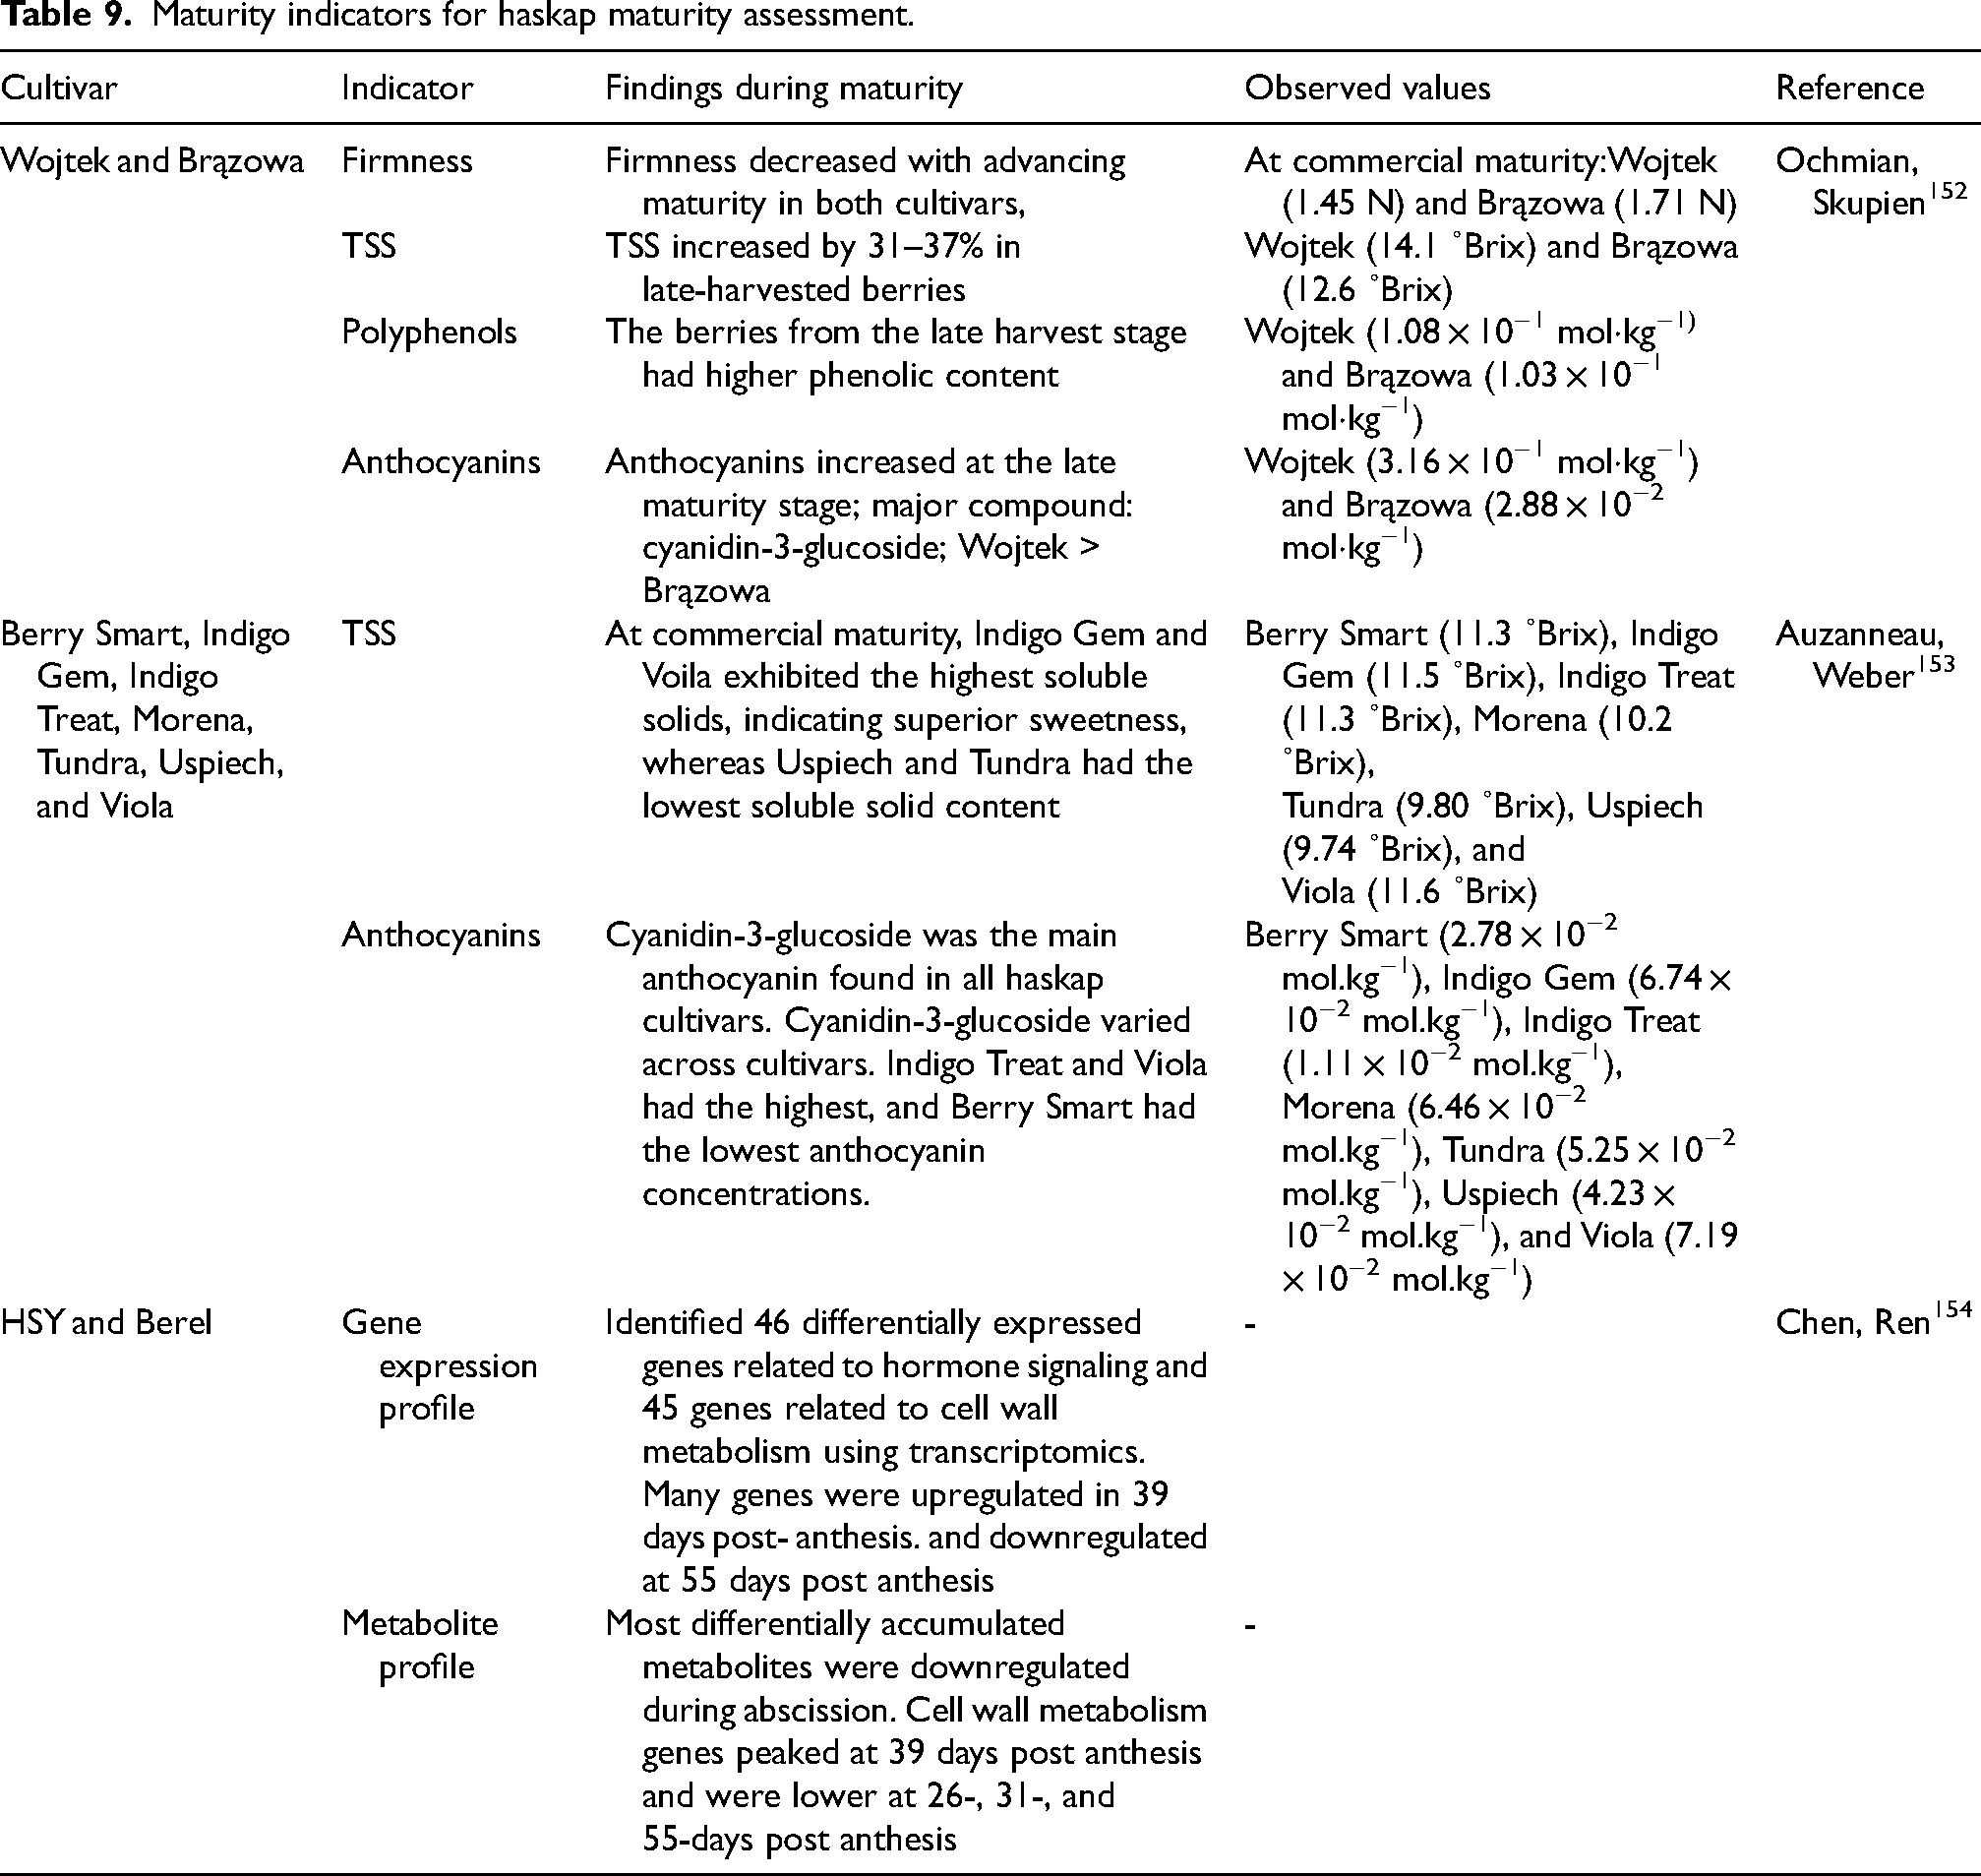
There is strong evidence from the study of De Silva and Rupasinghe 150 that the polyphenol composition of haskap berries, especially the anthocyanin concentration, is highly influenced by their maturation stage. Anthocyanin content gradually rose with fruit ripening in several cultivars, most conspicuously Larissa, throughout the course of five harvesting dates. The most common anthocyanin, cyanidin-3-O-glucoside (C3G), made up between 79–92% of all anthocyanins, and its content peaked at the last harvest stages. Researchers also used the fluorescence-based method using the multiplex detector to evaluate berry maturity and anthocyanin accumulation and concluded that significant correlation with standard laboratory techniques (R2 = 68.3% with UPLC-ESI-MS, R2 = 65.9% with pH difference). Similarly, a research study was conducted by Fujita, Hayasaka 151 determined that cyanidin-3-O-glucoside (C3G) was the dominant compound in haskap berries. Table 9 included the research studies explored for the maturity assessment of haskap.
Maturity indicators for haskap maturity assessment.
Cultivar-specific and environmental influences
Haskap berry maturity process is extremely diverse and impacted by both environmental and genetic variables. The Aurora cultivar was investigated by De Silva and Rupasinghe 155 in a geographically diverse study in five different Canadian regions (British Columbia, Saskatchewan, Yukon, and two sites in Nova Scotia) to determine how harvest timing and latitude impact important maturity indicators like antioxidant capacity, phenolic concentration, and anthocyanin content. Despite the study being conducted with emphasis on the Aurora cultivar, notable intra-cultivar heterogeneity was noted throughout the early, mid, and late harvest stages. Designating that harvest timing is a key factor in defining berry quality, late-stage harvests continuously produced higher values for soluble solids (˚Brix), total anthocyanins (TAC), cyanidin-3-O-glucoside (C3G), and antioxidant capacity (FRAP). These outcomes highlight the requirement of standardizing maturity indices according to cultivars because biochemical profiles change significantly with phenological development.
Furthermore, researchers concluded that anthocyanin accumulation and antioxidant capacity are strongly influenced by latitude and related environmental factors (such as temperature and photoperiod). The uppermost C3G concentrations (up to 197 mg/100 g FW) were found in berries taken from higher latitudes, specifically Yukon. This advocates that polyphenolic production may be boosted by cooler climes and extended daylight exposure. The implication of environmental variation was further supported by the fact that total phenolic content varied by location, even though it was less sensitive to harvest stage. The authors support localized standards for evaluating haskap berry maturity and quality because of the pragmatic diversity between locations and harvest stages. They also recommended that it might not be conceivable to completely capture the complex possessions of geography and cultivar-specific responses using a single set of universal maturity indicators and further advised to provide reliable, geographically appropriate quality criteria. The study recommends multi-year, multi-cultivar research that includes a broader range of environmental parameters. Only a few studies have been conducted on the haskap maturity, as represented in Table 9, indicating a need for further research in this area.
Conclusion
Approaches to determining fruit maturity range from destructive to non-destructive techniques, developed over time for multiple practical purposes. This review synthesizes these methods and current knowledge on maturity assessment in major berry crops and highlights the multi-dimensional nature of maturity assessment. The maturity of small berries cannot always be reliably characterized by one parameter alone. The evidence synthesized in this review demonstrates that mechanical assessment through firmness, chemical analyses including TSS, TA, and TSS: TA, aromatic maturity, and amino acid composition each capture distinct and complementary aspects of fruit maturity, especially for small berries. This is especially relevant for emerging crops such as haskap berries, which remain underexplored in the research literature. In addition, sensory evaluation and molecular-level studies provide further resolution of maturity-related changes that are not fully explained by conventional physicochemical measurements alone. This review highlights the need for composite maturity indices that integrate multiple maturity indicators into a single measurable metric, as such indices have the potential to enhance objectivity and facilitate the practical implementation of maturity assessment across berry species. The review analyzed widely used machine learning models for fruit maturity prediction and assessed their effectiveness across multiple application contexts. Compared to other techniques, PLS and neural network models were widely implemented due to their simplicity and effectiveness in handling spectral information. Non-destructive methods such as NIRS, HSI, MSI, and RGB imaging have shown promising results in berry crops and are still unexplored in haskap berries. The reviewed technologies enable scalable commercial applications through rapid, real-time, and non-destructive assessment of fruit maturity. However, the development of maturity indicators for small berries such as haskap is challenging due to variation in chemical and physical characteristics among cultivars. At present, information specific to maturity assessment in haskap is scarce. Therefore, further research is recommended to support the development of appropriate maturity indicators for haskap.
Footnotes
Acknowledgements
The author gratefully acknowledges the valuable support and collaboration from Mr Manuel Gosselin and Ms. Erica from Les Petits Fruits du Clocher, Denis Carrier from Camerises St-Philippe Inc, Christian Lacroix from MAPAQ, and Ms. Carole McKinnon from Agriculture and Agri-Food Canada, whose insights and professional input have contributed meaningfully to this review.
Ethical approval
This article does not contain any studies with human or animal participants.
Informed consent
Not applicable.
Author contributions
Funding
This work was supported by the Ministère de l'Agriculture, des Pêcheries et de l'Alimentation du Québec (MAPAQ) [Project number- T-08839].
Declaration of conflicting interests
The authors declared no potential conflicts of interest with respect to the research, authorship, and/or publication of this article.
Data availability statement
Not applicable.