



Abstract
The 2011 Trends in International Mathematics and Science Study shows average mathematics scores of U.S. fourth graders are lower than children in many Asian countries. There are questions about differences in mathematics skills at younger ages. This study examines differences in score growth for High-, Average-, and Low-performing children in two U.S. states and one city in China. The samples are not representative of site populations and are different in socioeconomic status (SES). Test of Early Mathematics Ability–3 (TEMA-3; Ginsburg & Baroody, 2003) scores were obtained at four time points from the longitudinal samples. Children in Shanghai had higher scores than children in Kentucky and Nebraska; the majority of children in Shanghai scored in the High group, whereas most children in Kentucky and Nebraska were in the Average group. The best fitting growth models were nonlinear and the growth patterns varied across samples. More research is needed to understand how classroom instruction, home environments, parenting, and SES impact growth of TEMA-3 scores.
Two studies report low mathematics scores of U.S. children in fourth grade. The National Assessment of Educational Progress (NAEP; 2011) reports 66% of U.S. children performed at or below the basic level. The 2011 Trends in International Mathematics and Science Study (TIMSS; 2011) reports that average mathematics scores of U.S. fourth graders are lower than those of children in many countries, with children in East Asian countries at the top of the list. These recent reports of low mathematics performance by U.S. fourth graders are consistent with previous reports from these sources. Wang and Lin (2009) published a meta-analysis with evidence that differences in mathematics scores of children in the United States and in East Asian countries begin earlier than fourth grade. In their review, findings from studies published between 1985 and 2007 were based on mathematics scores of Chinese children from “Taiwan and Hong Kong . . . Mainland China, and Macao” (p. 181) and scores of U.S. children from different states. The 17 reviewed studies included pre-kindergarten-age participants and participants in kindergarten through high school grades. Scores were higher for East Asian than U.S. samples, with an average effect size of .35. Smaller and nonsignificant mean effect sizes were found for prekindergarten through first grade (.05), but the mean effect size increased across grades up to .46 at high school. The mean effect sizes of score differences at older grades were significant. Wang and Lin report that mean effect sizes from studies published in 2000 and earlier were smaller (.25) than those published from 2001 to 2007 (.42). These results provide more details on differences in mathematics scores of U.S. and East Asian children and show that differences are variable across grades and time.
Although the effect sizes reflecting differences between U.S. and Chinese children in prekindergarten through first grade are small, a review of the studies cited by Wang and Lin (2009), as well as other published studies that compare East Asian, Chinese American, and other U.S. children, reveals reliable differences in mathematics scores (Geary, Bow-Thomas, Fan, & Siegler, 1993; Ho & Fuson, 1998; Miller, Smith, Zhu, & Zhang, 1995; Miller & Stigler, 1987). A few examples are highlighted here. Huntsinger, Jose, Liaw, and Ching (1997) studied Chinese American and Euro-American U.S. children in Chicago and children in Taipei, Taiwan. Children were enrolled in prekindergarten, kindergarten, and (in Taiwan) weekend schools. The TEMA-2 (Ginsburg & Baroody, 1990) was used to assess general mathematics skills (TEMA-2 raw scores) and scores for informal and formal mathematics items. As defined by Ginsburg and Baroody (2003), informal TEMA items are thought to tap “notions and procedures acquired outside of the context of schooling” (p. 2) and reflect “implicit understanding” (p. 3). Formal TEMA items are thought to tap “arithmetic skills and concepts the child learns in school” (p. 2) and reflect “explicit understanding” (p. 3). Euro-American U.S. children had significantly lower TEMA-2 scores than Chinese American and Taiwan Chinese children and also had lower informal and formal mathematics scores. The Chinese American children in this study had higher scores than the Taiwan Chinese children only on informal mathematics items. The authors attributed these differences to cultural differences in parenting practices and beliefs around mathematics.
Z. Zhou, Cheng, Mottram, & Rosenblum (1999) also used the TEMA-2 to examine the mathematical skills of prekindergarten, kindergarten, and first-grade children in China (Beijing) compared with Chinese American children in the United States (New York City) as well as to examine differences between children from lower and middle socioeconomic status (SES) homes. At prekindergarten, children from lower SES homes in China showed higher informal mathematics knowledge than did Chinese American children from comparable SES homes, while both Chinese and Chinese American children from middle SES homes performed equivalently. At kindergarten, children from lower and middle SES homes in China scored higher than Chinese American children on informal but not formal mathematics. At first grade, differences in formal mathematics scores were found, such that children from China scored higher than Chinese American children regardless of SES. The early association between SES and mathematics scores of prekindergarten and kindergarten children across study sites was not found later in first-grade scores.
Stevenson, Lee, and Stigler (1986) examined mathematics skills in Taiwan Chinese (Taipei), Japanese (Sendai), and U.S. children (Minneapolis) in kindergarten, first, and fifth grades. Rather than using a standardized assessment, they created an assessment from the mathematics textbooks used in the Taiwan, Japan, and U.S. study sites. Poorer mathematics scores were found for the U.S. children in kindergarten compared with the Japanese children, but no differences were found when U.S. children in the study were compared with the Taiwan Chinese children. However, at first and fifth grades, scores of the U.S. children were consistently lower than those of children in the other countries. This publication was followed by a second study (Stevenson et al., 1990) comparing mathematics scores of first- and fifth-grade children in China (Beijing) and the United States (Minneapolis). In that study, a similar approach to the assessment of mathematics skills was taken. The mathematics assessment was created using items from textbook content and input from mathematics educators in the two countries. The Minneapolis children’s scores were significantly lower compared with Beijing children in all skill areas at first grade and lower in all but two skill areas in fifth grade (visualization of graphs and tables). The mathematics scores of the U.S. children were examined for differences due to ethnicity on computation skills in first grade and fifth grade and on geometry skills at fifth grade. In these comparisons, the Asian American children in the U.S. sample consistently and significantly outperformed the other three groups (White, Black, and Hispanic) within the U.S. sample.
Together, the results of these studies show significant differences in the mathematics scores of East Asian children in Taiwan (Taipei), Japanese (Sendai), and China (Beijing) compared with children at different locations in the United States, with higher mathematics scores for East Asian children compared with the U.S. children. Even within U.S. samples, there is evidence of higher mathematics scores for Asian American children than non–Asian American children. These differences are apparent in the scores obtained even at prekindergarten ages. Reports of low mathematics scores of U.S. children have influenced the discussions among U.S. educators about the changes in mathematical teaching and learning that are needed before kindergarten entry if U.S. children’s mathematics skills are to improve and children are to be better prepared to be mathematically literate citizens and professionals. Furthermore, there is a growing understanding that changes in mathematics instruction must move from being unfocused, repetitive, and unchallenging practices to practices that identify key concepts and focus on learning trajectories, enabling a more intentional, integrated approach to learning mathematics (Clements & Sarama, 2008; Cogan & Schmidt, 1999).
Important changes in mathematics education in prekindergarten through first grade have occurred that may be influencing young children’s mathematics scores over time. The Principles and Standards for School Mathematics (National Council of Teachers of Mathematics, 2000) included prekindergarten standards for the first time. A conference titled “Standards for Pre-Kindergarten and Kindergarten Mathematics Education” was held in 2000, and the major themes and recommendations for prekindergarten to second-grade mathematics standards from that conference were published (Clements, Sarama, & DiBiase, 2004). The National Association for the Education of Young Children and National Council of Teachers of Mathematics in 2002 released a joint policy statement that identified the importance of research-based, high-quality, and challenging mathematics instruction beginning in prekindergarten. In 2006, the National Council of Teachers of Mathematics published the Curriculum Focal Points, a key document for prekindergarten standards.
As a result, between 2002 and 2010, states have adopted or revised their standards for prekindergarten children to include mathematics as a critical component of early learning standards (Brenneman, Stevenson-Boyd, & Frede, 2009; Scott-Little, Kagan, & Frelow, 2005; Scott-Little, Lesko, Martella, & Milburn, 2007). According to the U.S. Department of Health and Human Services Administration for Children and Families, Office of Child Care website, 33 states and three territories implement Early Learning Guidelines for infants, toddlers, and young children (National Infant & Toddler Child Care Initiative, 2011). Kentucky and Nebraska are included in the list of 20 states that have specific guidelines for preschool children. The early learning guidelines for preschool children identify the content and performance expectations around mathematical content areas for instruction of children beginning in prekindergarten. Many states have comprehensive professional development approaches recommended for preservice and practicing early childhood teachers and personnel who interact with the children that focus on implementation of the early learning guidelines for mathematics (Burchinal, Hyson, & Zaslow, 2008).
These documents reflect changes in policies and standards around mathematics instruction in early childhood education (ECE; prekindergarten to third grade) and reflect expectations for professional development to support changes for mathematics instruction in the ECE classrooms in the United States. These changes occurred at the same time as or after the publication dates of the studies cited by Wang and Lin (2009) and may now be influencing the prekindergarten educational climate around mathematics in the United States. One purpose of the present study is to examine the mathematics scores of prekindergarten to first-grade children in two U.S. samples (Kentucky and Nebraska) and in one sample in China (Shanghai). These data were gathered between 2007 and 2012. The scores were examined to determine if an achievement gap is still present between the samples in the United States and China. The second purpose is to examine differences in growth of mathematics scores in these children. The studies cited above are based on cross-sectional samples of children and, although age differences can be explored in studies with these designs, age changes cannot. The present study examines age changes in mathematical scores using longitudinal data from samples of children from Kentucky, Nebraska, and Shanghai, China.
The Kentucky and Nebraska samples differ in SES. The Kentucky sample is comprised of children attending ECE programs targeting low SES families, while the children in the Nebraska sample represent a wider range of SES levels, with approximately 40% eligible for free or reduced lunch (a proxy for poverty status). The children in the sample from Shanghai also represent a range of SES homes. It is important to note that researchers in China do not often use the concept of SES. Instead, geographic or area specification is used (e.g., the east coast is more economically developed than the middle or western parts of China; urban areas are more economically developed than rural areas). Children in Shanghai generally go to the nearby ECE program or the program in the same district that their homes are located. In Shanghai, the government financially supports 70% of ECE programs, and attendance fees are affordable for most families. In the Shanghai sample, the children represented a variety of family backgrounds.
These sample differences in SES could be important as SES has a known association with children’s cognitive development. Decades of research document links between the impacts of low income, low parent education, less stimulating home environments, and children’s cognitive development (Bradley & Corwyn, 2002). Although many studies of SES and children’s cognitive development have been conducted with U.S. children, it is clear from the findings reported by Z. Zhou et al. (1999) that differences in mathematics performance related to SES are also seen in samples of children from China (Beijing). Bowman, Donovan, and Burns (2001) note high-quality prekindergarten programs can be particularly important for enhancing kindergarten readiness of children from low-income and educationally disadvantaged families, with proficiencies in mathematics skills at kindergarten entry strongly correlated with higher skill levels in mathematics at the end of kindergarten and in first grade (Denton & West, 2002). Therefore, although the sample from Kentucky in particular may evidence poorer mathematics skills due to the predominance of children with low SES backgrounds compared with the other two samples, recent advances both at the national and state levels through the creation and adoption of policies and early learning guidelines designed to strengthen the mathematics standards for ECE may result in better mathematics scores by these children.
The present study also examined children’s mathematics scores to determine if differences in score levels are present within and between samples and if growth of mathematics is different for each group. In this examination, the criteria given by Ginsburg and Baroody (2003) for TEMA-3 scores to identify High-, Average-, and Low-scoring children were used to categorize children, and the growth of TEMA-3 scores within each group was examined to explore differences in rate of growth between study samples. The purpose was to determine if mathematics scores grow differentially across time for different mathematics ability levels.
Three hypotheses were explored in this comparative study:
Method
Participants
Data were obtained from three longitudinal studies exploring the roles of teacher training and classroom activities on children’s mathematics skills from prekindergarten to first grade. Samples from Kentucky, Nebraska, and Shanghai, China are included in the data sets, with the Kentucky sample followed from fall of prekindergarten to spring of first grade, the Nebraska sample followed from fall of kindergarten to spring of first grade, and the Shanghai sample followed from fall of prekindergarten at 3 years of age to the spring of kindergarten.
In Kentucky, participants were recruited from state-funded and Head Start prekindergarten classrooms providing comprehensive early education services to ethnically diverse, low-income families. Classrooms were located in schools distributed across five counties and included half-day programs for 4 days per week and full-day programs for 4 days or for 5 days per week. Prekindergarten teachers with scheduled professional development activities related to the district curriculum participated in those sites, and children in their classroom who met eligibility criteria as typically developing and speaking English as their primary language were included in the study. In the first testing point (fall of prekindergarten, 2007), there were 389 children (182 males) with an average age of 53.46 months (range = 47-59 months, SD = 3.47). Some study children assessed in the fall of the prekindergarten year were not assessed at follow-up due to attrition (n = 29), based on not meeting eligibility for kindergarten enrollment (n = 2), random exclusion of one twin from a twin pair (n = 1), or study children moving to nonstudy classrooms or moving out of the region (n = 26).
In Nebraska, participants were drawn from a pool of longitudinal data from classrooms of kindergarten and first-grade teachers who were engaged in voluntary professional development in mathematics and from classrooms of matched control teachers. Children were attending kindergarten in 16 different elementary schools across two school districts. Eight of the 16 schools were designated Title I and accounted for 47% of the children in this sample. At the school level, the percentage of children receiving free or reduced lunch (a proxy for poverty status) ranged from 4.9% to 93.1%, with an overall percentage of children in poverty in the sample of 39.9%. At the first testing point (fall of kindergarten, 2009), there were 127 children (67 males) with the mean age 66.67 months (range = 58-77 months, SD = 4.17). At some time points, the number of participants varied because participants were absent due to sickness or had moved out of the region.
In Shanghai, China, participants were drawn from a longitudinal study aimed to improve teachers’ skill in observing and assessing children by using narrative methods. The children were from nine classrooms in six ECEs serving children from a variety of family backgrounds with a varied range of SES. All children spoke Mandarin. The government financially supports early childhood programs and the quality of the early childhood centers in this study was ranked as higher than the average. Classrooms were located in child care centers distributed across four different districts in Shanghai. All centers were full-day programs and children came to school 5 days a week. At the first testing point (fall of prekindergarten, 2009), there were 105 children (53 males) with a mean age of 42.21 months (range = 38-45 months, SD = 2.09). At later time points, the number of participants varied because some participants were not available at testing times due to sickness, other school absences, or moving out of the region. In spring of 2011, there are fewer numbers of children with data due to an error by testers who thought only the target children needed to be tested.
The sample sizes, gender distributions, attrition rates, and descriptive statistics of the children’s ages at each assessment point for the three samples are in Table 1.
Descriptive Statistics for Three Samples.

Assessment Time Points
The time points of assessment for the three samples needed to be aligned in terms of age in months to be fairly compared. U.S. terms for grade levels are used to create groups of prekindergarten age 3 (Pre-K3) to first grade and time of measurement was identified numerically. These are represented in Table 2. For example, in the fall of prekindergarten age 3 (Fall, Pre-K3, Time 1), children in the sample ranged in age from 36 months to 50 months of age. In all, eight assessment time points are identified. Even though ages in months vary between samples and the time of TEMA-3 assessment, the mathematics ability scores (MASs) are still comparable because MAS is a standard score based on a child’s age in months (Ginsburg & Baroody, 2003).
Ages at Assessments by Grade and Season.

Based on the definition of terms for grade levels, means and standard deviations of age in the three samples are summarized in Table 3. When comparing 95% confidence intervals (within two standard deviations), there are overlapping ages. However, when considered within time points, the ranges are fairly consistent.
Means and Standard Deviations of Age in Months for Three Samples.

Measure
The measure of mathematics concept, process, and knowledge skills was the Test of Early Mathematics Ability–3 (TEMA-3: Ginsburg & Baroody, 2003), a standardized assessment composed of 72 items designed to assess conceptual understanding and skills for children aged 3 years 0 months to 8 years 11 months. The assessor uses a picture book and tokens to administer the TEMA-3 to individual children. A Mandarin language version of the TEMA-3 was used to assess children in Shanghai. Assessments were administered following TEMA-3 administration rules using age-based item entry points and establishing basal and ceiling levels for each child. Each child’s binary responses (pass/fail) were recorded on a form. The TEMA-3 requires approximately 45 min to administer. According to the examiner’s manual (Ginsburg & Baroody, 2003), the 2-week test–retest reliability of the TEMA-3 is .82 and the Cronbach’s alpha values for 3- and 4-year-old participants are .92 and .93, respectively.
Statistical Analysis
To identify growth patterns for the three samples, a linear mixed model (LMM; Laird & Ware, 1982) was used to fit data in each data set. Each longitudinal data set includes four time points and represents linear and nonlinear mean changes (Figure 1). The differences in the mean change scores for the samples show that the Nebraska sample does not have constant growth, whereas both Shanghai and Kentucky samples show positive growth over time. For the Nebraska sample, fall scores are lower than those of the spring scores. This pattern is not evident in mean scores for the Kentucky and Shanghai samples because the fall assessment scores were only recorded 1 year.
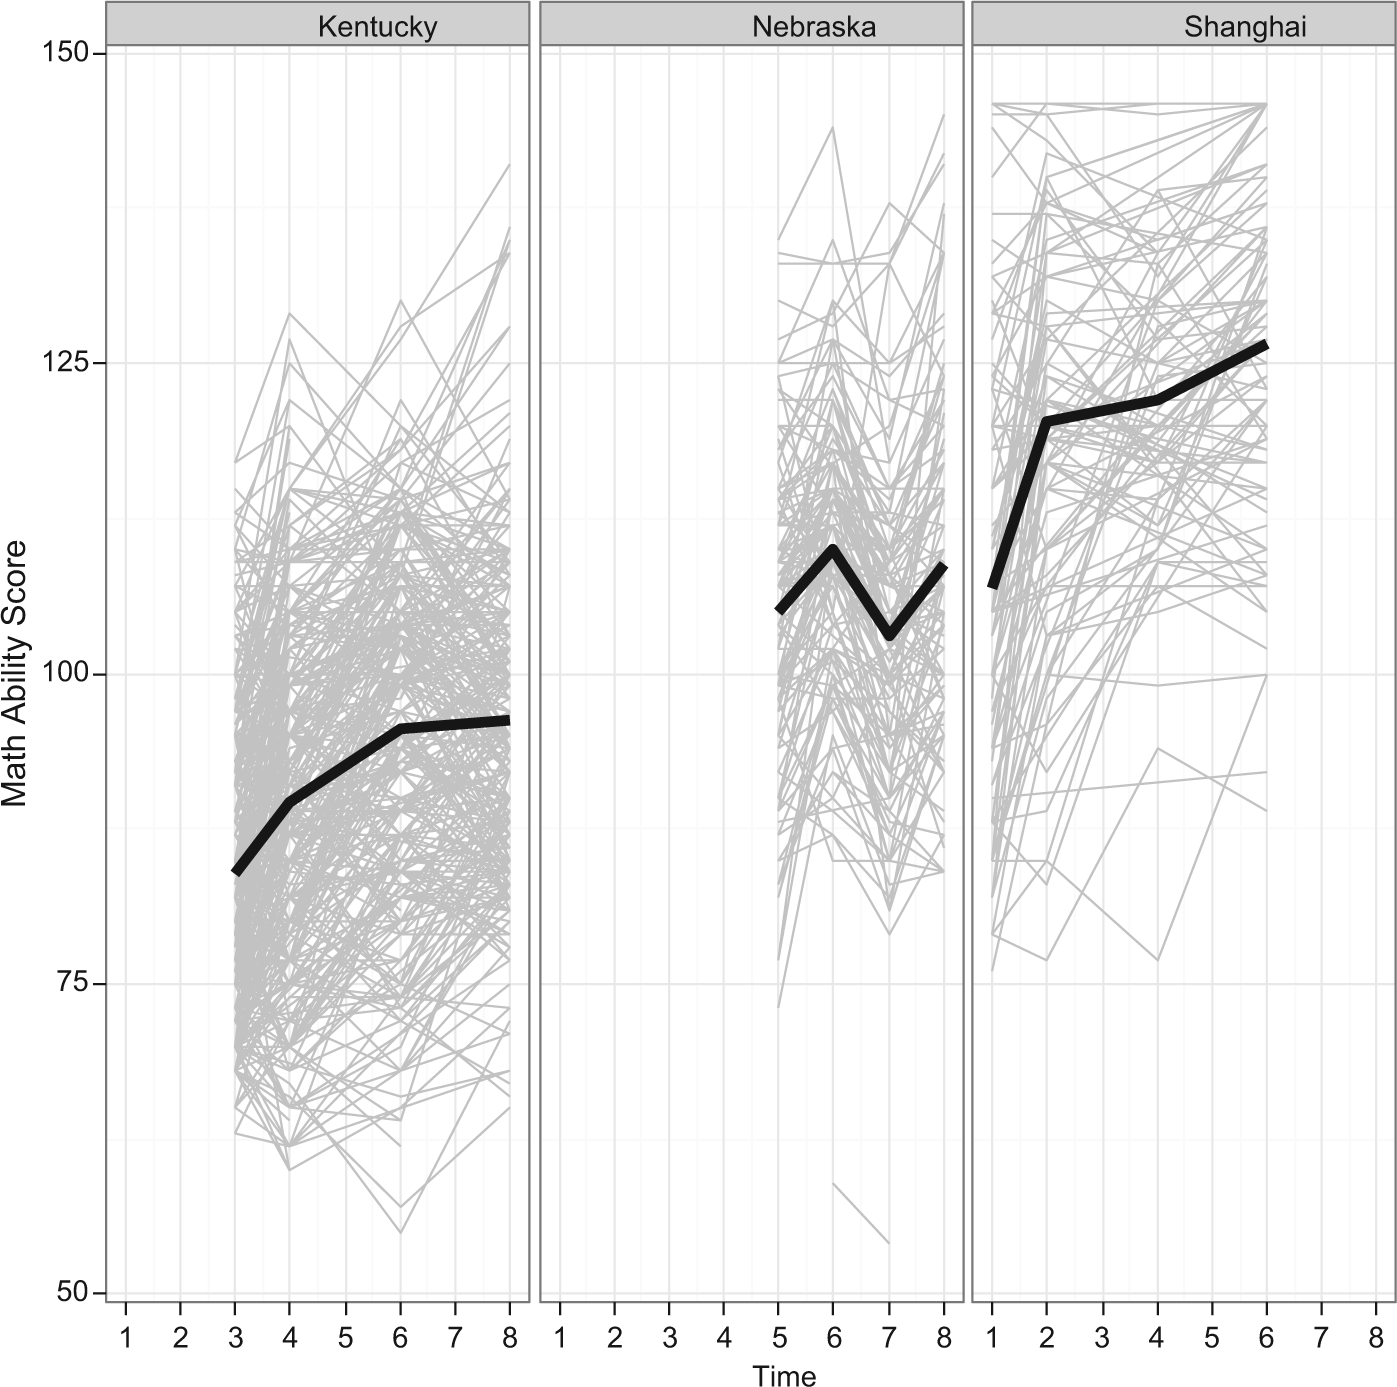
Individual MAS curves superimposed with mean changes over time for each sample.
To understand the growth, functional forms that are more flexible than linear growth were required. Fractional polynomials were considered to best fit the nonlinear growth pattern (Long & Ryoo, 2010). In addition to the growth pattern, the within-subject variability was considered by adding random effects in the LMM. When selecting the best fitting model, the random effects were considered after fitting fixed effects of the LMM (Ryoo, 2011). As criteria for selecting the best fitting model, the adjusted Akaike information criterion–corrected (AICc; Burnham & Anderson, 2002; Hurvich & Tsai, 1989) and the parametric bootstrap likelihood ratio test (PBLRT; Pinheiro & Bates, 2000) were used. The former was used for comparing nonnested models among fractional polynomials and the latter was used for testing the effects of gender between two nested models.
The first-order fractional polynomial for LMM is defined as

The power value, a, of the time variable was considered as one of the elements in the set
The best fitting LMM in each site was used to test the effect of gender in the growth. Applying the PBLRT of significance, 0.05, the following models were compared


Furthermore, we examined the growth patterns across different Math Ability Groups (i.e., High, Average, and Low). Groupings were created based on TEMA-3 cut scores as described in the TEMA-3 manual (Ginsburg & Baroody, 2003). Effects due to gender also were tested within each sample and ability group.
Results
Descriptive Statistics
Based on the classification of age in months, the means and standard deviations of TEMA-3 MAS for the three samples are summarized in Table 4. The only time when all three groups were administered the TEMA-3 was the spring of kindergarten (Time6). We used this time point to classify the performance levels of the children. At Time6, the mean TEMA-3 score of the Nebraska group was 14.47 points higher than that of the Kentucky group but 16.58 points lower than that of the Shanghai sample.
Means and Standard Deviations of TEMA-3 Math Ability Scores.

Note. TEMA-3 = Test of Early Mathematics Ability–3.
Based on the TEMA-3 criteria (Ginsburg & Baroody, 2003), seven Math Ability groups in our sample were identified: the High group consists of “Very Superior” (upper 2.34%) and “Superior” (6.87%); the Average group consists of “Above Average” (16.12%), “Average” (49.51%), and “Below Average” (16.1%); and the Low group consists of “Poor” (6.87%) and “Very Poor” (2.34%). These criteria are based on the assumption of a normal distribution with mean 100 and standard deviation 15. This assumed distribution by category (High = 9.21%, Average = 81.73%, and Low = 9.17%) is slightly different from our overall sample: High = 16.54%, Average = 75.48%, and Low = 7.98%. These data are in Table 5. The Kentucky sample is distributed across the “Superior” to “Very Poor” criteria, with 99% of participants in the “Above Average” to “Very Poor” range. The Nebraska and Shanghai samples are distributed across “Very Superior” to “Below Average” except one participant in the Nebraska group (“Very Poor”). In the Shanghai sample, about 65% of participants were in the range of “Superior” or above, compared with 15% of the Nebraska sample.
Sample Distribution and Cut Scores of TEMA-3 Ability Groups.

Note. TEMA-3 = Test of Early Mathematics Ability–3; MAS = mathematics ability score.
ANOVA was used to compare the TEMA-3 means of the children in the Nebraska and Shanghai samples in the High group, and all three samples in the Average group. The difference between the average MAS scores of the children in the High group in Shanghai sample (M = 135.03, SD = 5.46) compared with Nebraska sample (M = 127.42, SD = 8.15) was significant, F(1, 81) = 14.57, p < .001. There also were significant differences between average MAS scores of children in the Average group; F(2, 394) = 42.31, p < .001. Post hoc analyses of the Average group showed no significant score differences between the Nebraska (M = 107.38, SD = 8.54) and Shanghai samples (M = 110.91, SD = 7.81) scores (p = .208), but there were differences between those two samples and those of the Kentucky sample (M = 98.92, SD = 10.48; p < .001).
Best Fitting LMM
By comparing nine first-order fractional polynomials according to the power, a, we obtained the best fitting LMMs across different samples as follows (Table 6):


Result of Model Selection Among the First-Order Fractional Polynomial Models Using the Adjusted AICc.

Note. Bold indicates the lowest adjusted AIC of the best fitting model. AICc = Akaike information criterion–corrected.
In Kentucky and Shanghai, the best fitting LMMs indicated an increase with concave-downward at the beginning and flatness at the later times. In Nebraska, the best fitting model was almost flat over time. The best fitting models with individual fitted values are shown in Figure 2. None of the three samples showed significant gender effects (all p values > .05; see Figure 3 for graphical representation).

Best fitting linear mixed model with fitted values over time.
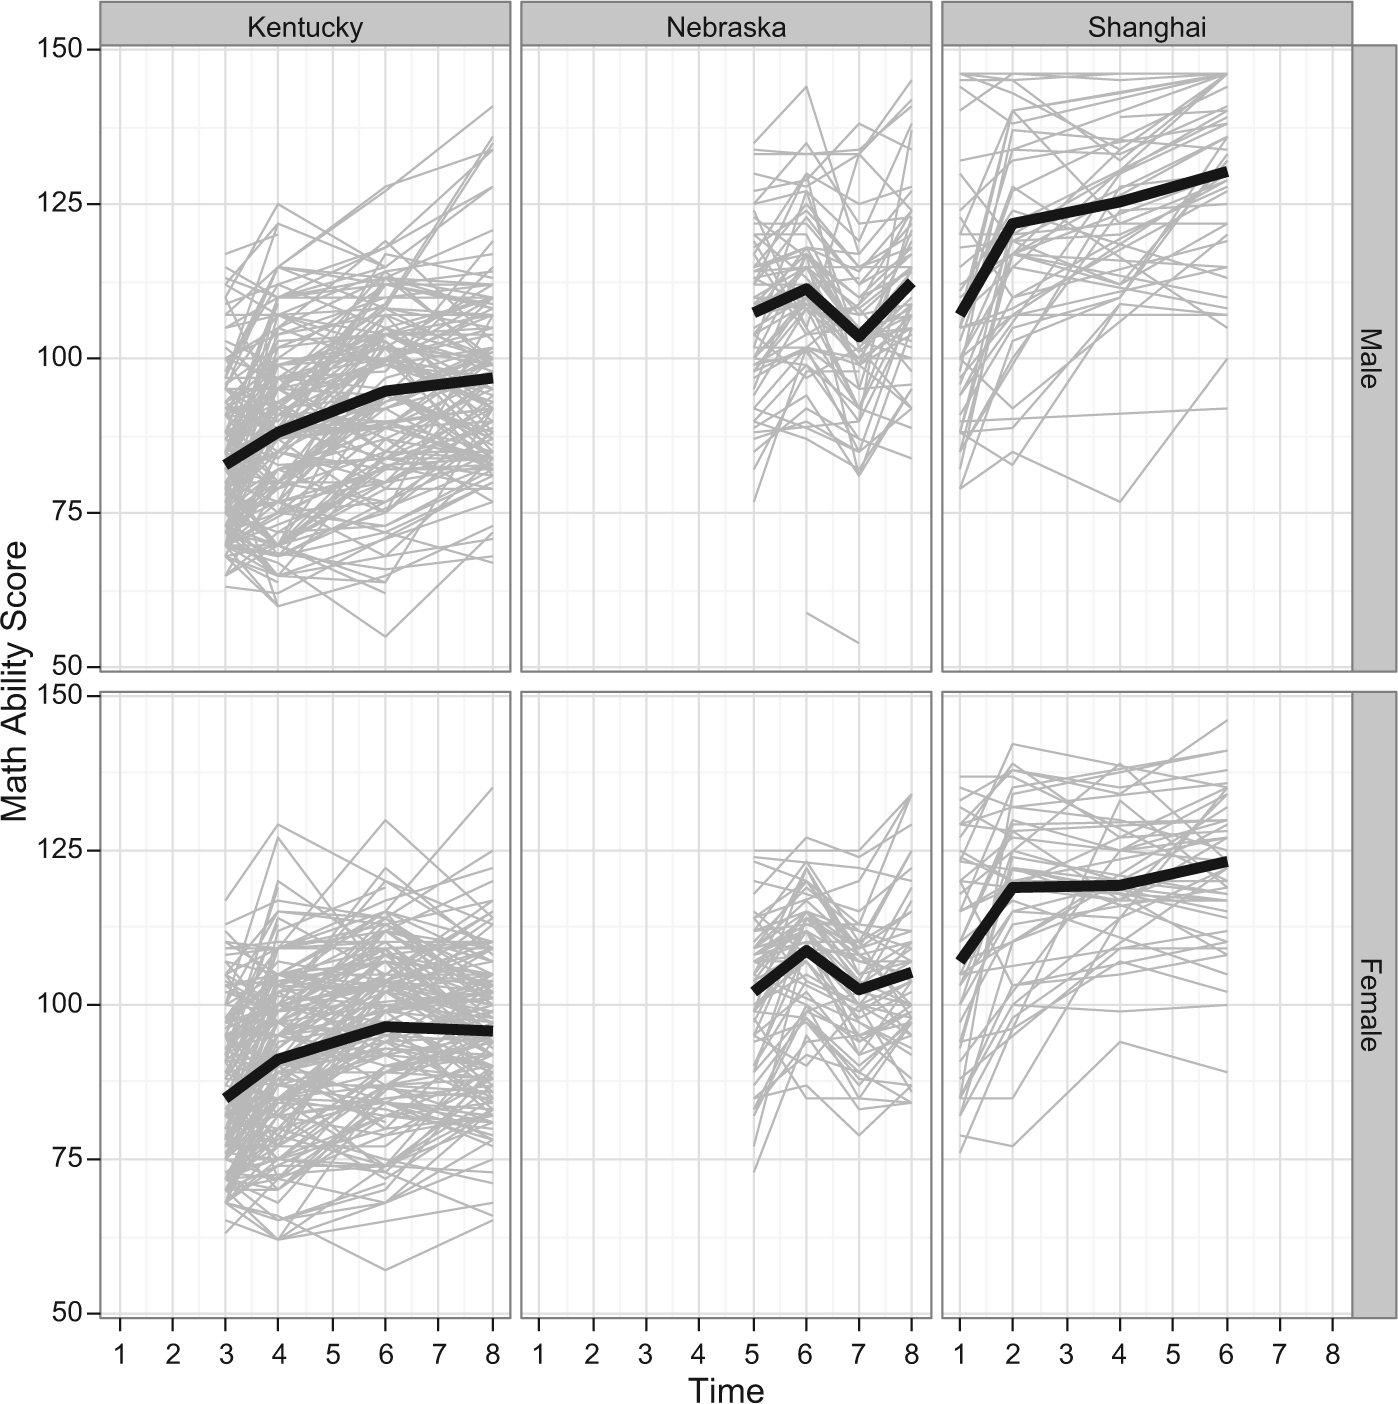
Individual MAS curves superimposed with mean changes over time conditioned on sample and gender.
LMMs Conditioned on Math Ability Levels
The growth patterns of the Math Ability groups (High, Average, and Low) were explored for each sample. The distribution of the sample in terms of both different samples and Math Ability Groups was summarized in Table 5. Among the three possible groups (High, Average, and Low), we excluded the High group in Kentucky and the Low group in Nebraska due to small sample sizes, 4 and 1, respectively, and the Low group in Shanghai due to no data. Thus, the remaining groups include the Average and Low groups in Kentucky, High and Average groups in Nebraska, and High and Average groups in Shanghai. As seen in the Figure 4, the overall growth for the three Average groups do not show change across time while the High group does show growth over time. The Low group (which is only present in the Kentucky sample) shows increased growth in scores by first grade.
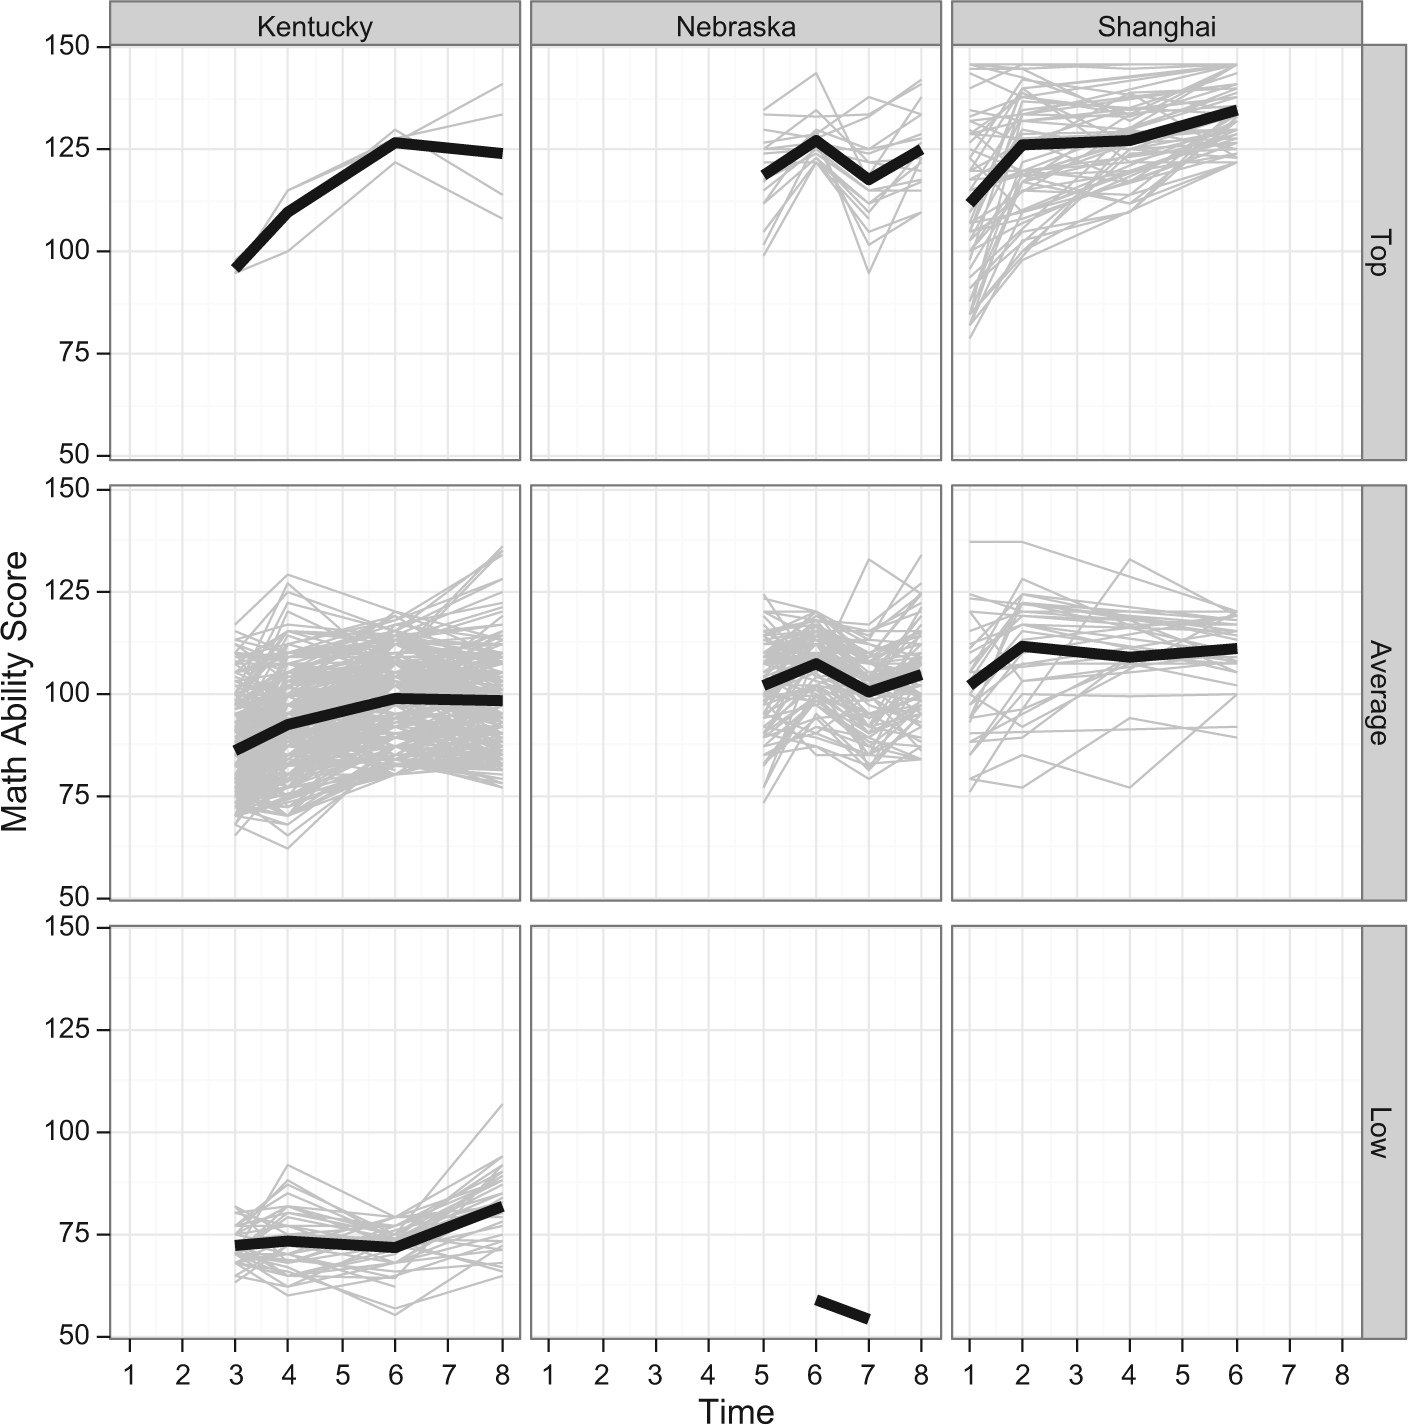
Individual MAS curves superimposed with mean changes over time conditioned on sample and score levels.
Using fractional polynomial models for each subgroup, we obtained the best fitting LMMs as follows (Table 7):


Results of Model Selection Among the First-Order Fractional Polynomial Models Using the Adjusted AICc Conditioned on the Performance Level.

Note. Bold indicates the lowest adjusted AIC of the best fitting model. AICc = Akaike information criterion–corrected.
In the High groups (Nebraska and Shanghai), there is increasing growth over time and the rates of growth were higher than for Average groups within each sample. For example, in the models for Nebraska, the absolute value of
Parameter Estimates of LMMs for the high and average groups in Nebraska.

Note. LMM = linear mixed model.
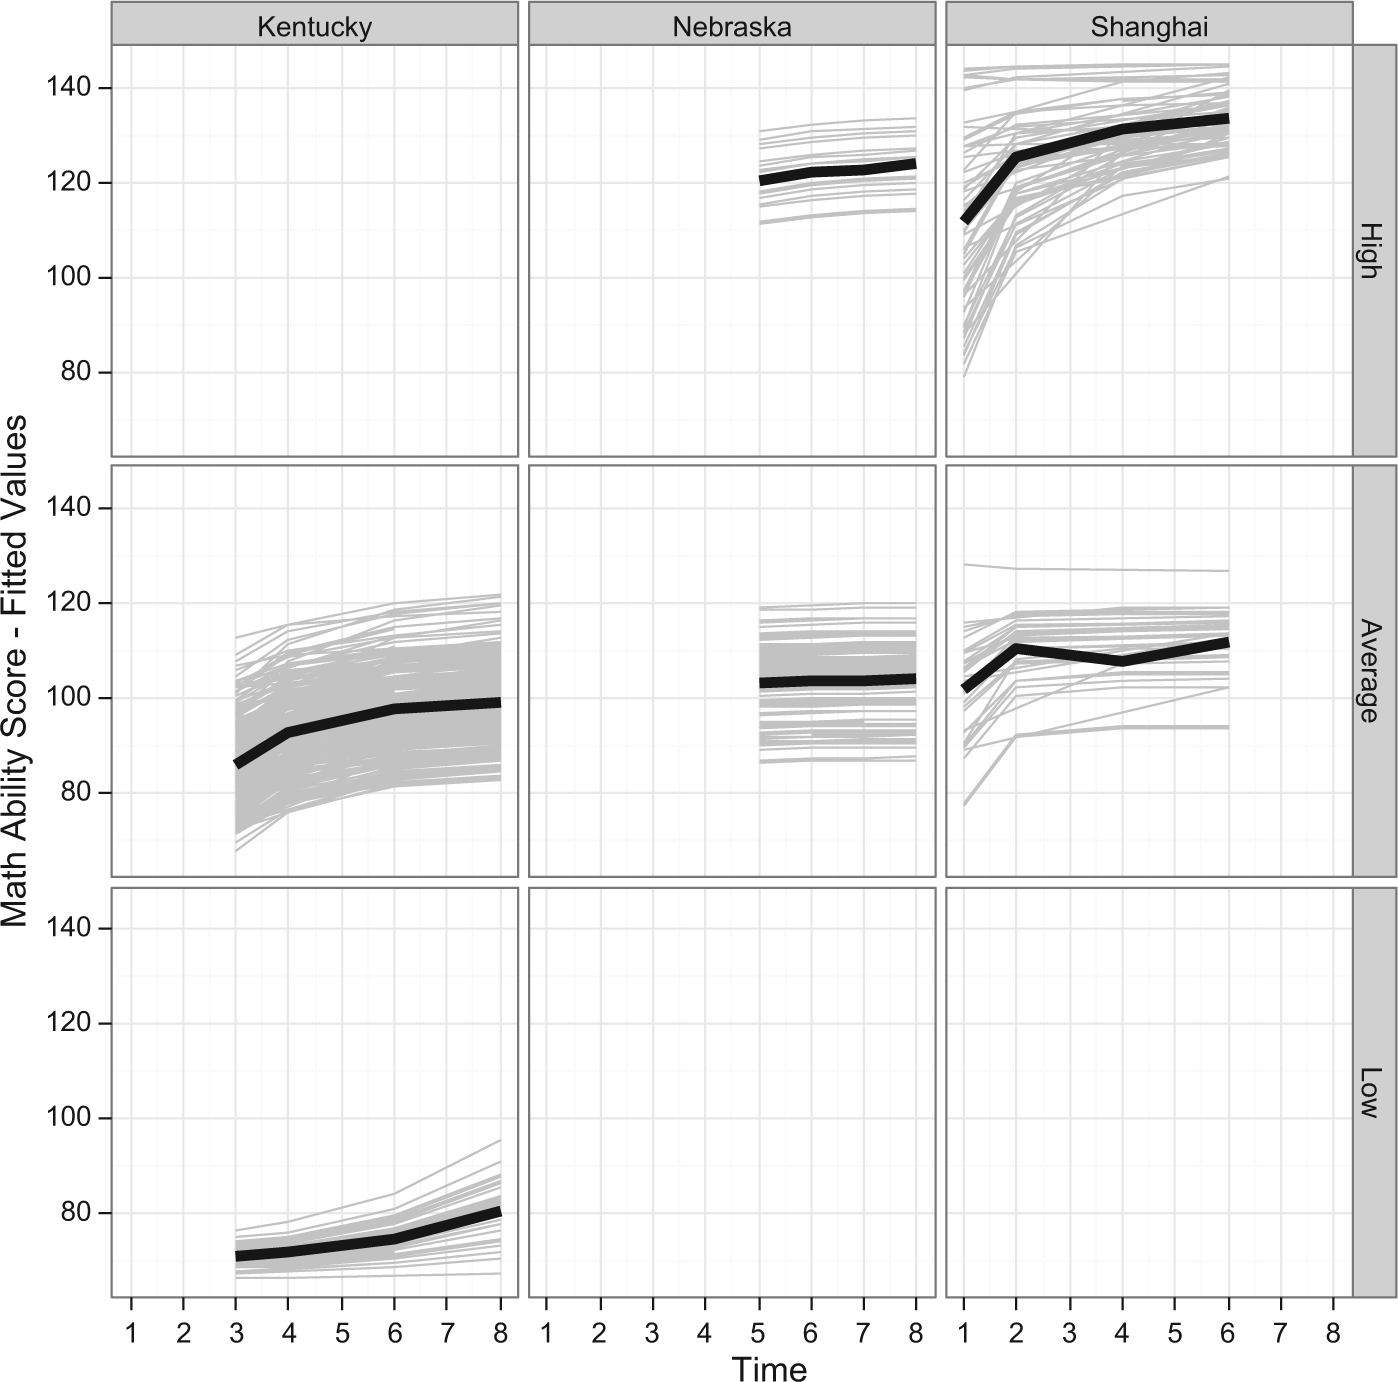
Best fitting linear mixed model with fitted values over time conditioned on sample and score levels.
Gender effects were found only when the samples were divided into Math Ability Groups, but for only one group. The High group in the Shanghai sample showed a significant gender effect (p = .03). As seen in the Figure 6, the patterns are similar for both groups, but the female group started at a lower mean but ended at a higher mean.
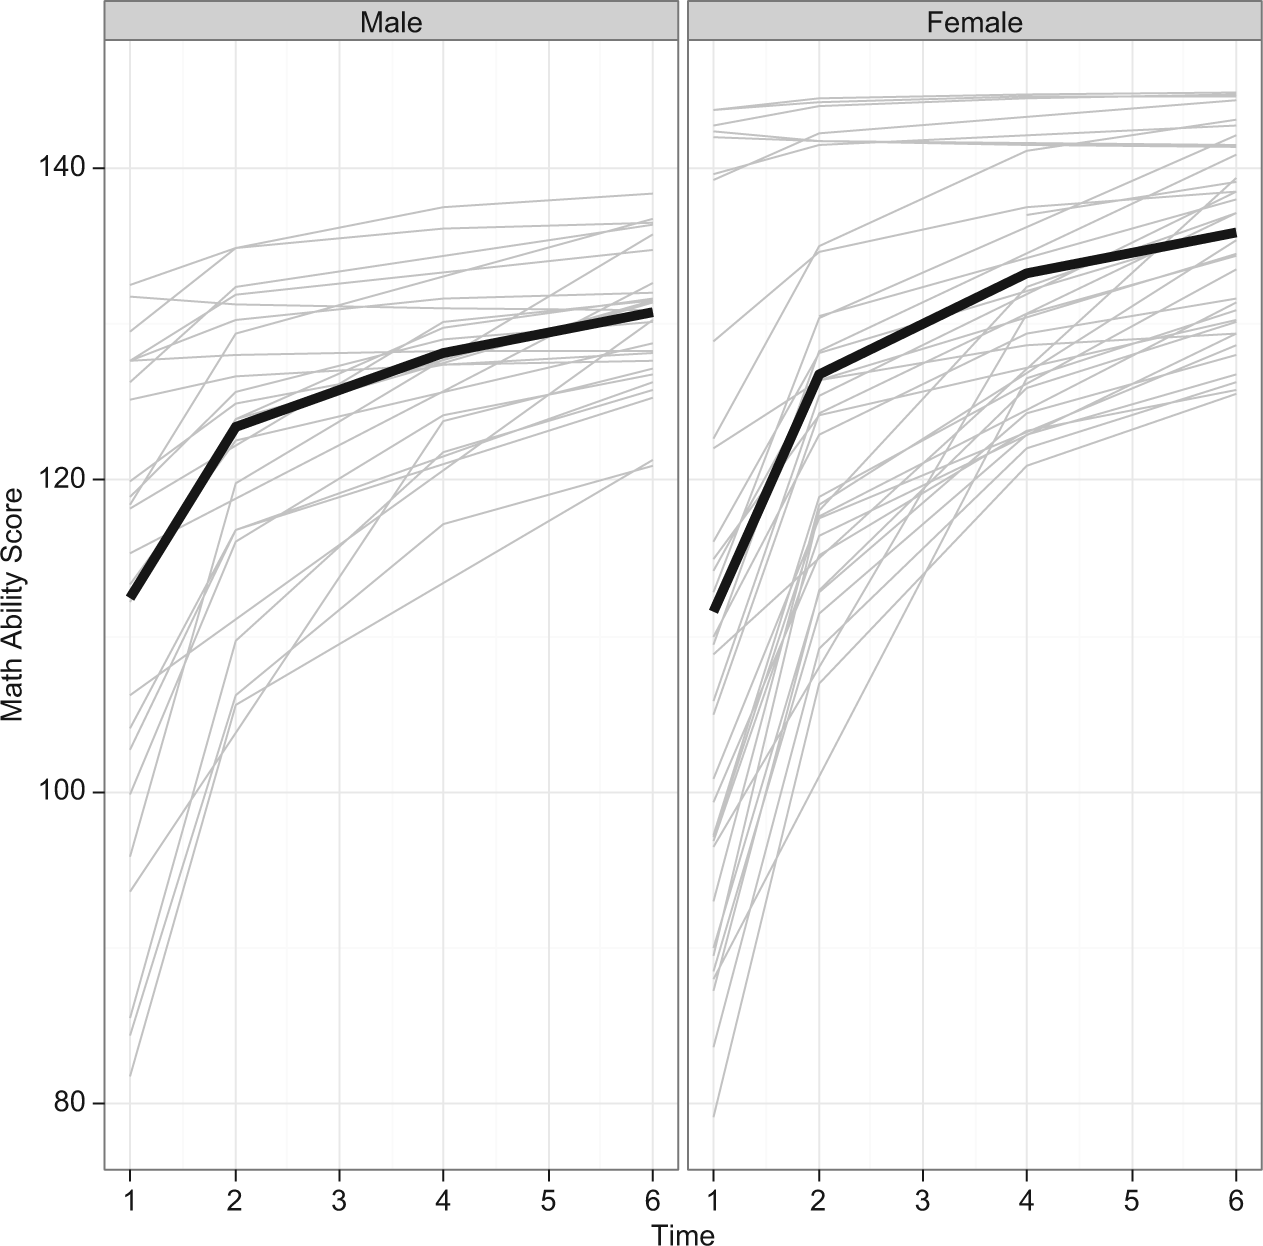
Individual MAS curves superimposed with mean changes conditioned on the high ability of the Shanghai sample.
Discussion
There are clear and interesting findings from this study. First, young children in the Shanghai sample have higher TEMA-3 scores than do children at the two study sites in the United States, Kentucky and Nebraska. These differences in TEMA-3 scores are evident from the average scores and in the growth curves. The 3-year-old children in the Shanghai sample score at about the same level as the kindergarten children in Nebraska and above the level achieved by the children in Kentucky, even at first grade. That there are differences between Shanghai and the Kentucky and Nebraska samples are interesting in light of findings from previous research. The Wang and Lin (2009) meta-analysis of articles published between 1986 and 2006 was a harbinger of the findings from this study although we hoped that the increased emphasis in the United States on mathematics in standards for early childhood mathematics education and in the early learning guidelines adopted in Kentucky and Nebraska might have resulted in fewer differences in performance. This hope was not supported. However, the findings of this study do provide reasons for optimism.
This study explored differences in the Math Ability groups (High, Average, and Low) of the children, categorizing their performance based on scores in the spring of kindergarten, the common data collection time point shared by the three samples. The majority of children in the Shanghai sample (65%) are categorized in the High group while the majority of children in the Kentucky (85%) and Nebraska (84%) samples are in the Average group. It is encouraging that so many Kentucky and Nebraska children are scoring at least in the average range. These average scores are particularly encouraging for the sample of children from Kentucky, all of whom are from low SES homes, based on their recruitment from Head Start and public prekindergarten programs that use income as the main basis for enrollment. The National Research Council (2009) has noted that less attention is given to mathematics compared with literacy in many prekindergarten classrooms and Clements and Sarama (2008) note that the lack of mathematics exposure is more evident in prekindergarten programs for low SES families compared with programs for middle SES families. We believe that the high distribution of scores from the Kentucky sample into the average group reflects the efforts by district and teachers to provide literacy and mathematics foundational experiences that will develop big ideas for future learning.
There is further reason for optimism in considering the performance of the children in the High group. Although only 15% of the children in the Nebraska sample scored in the High group, and their scores were significantly lower than those of children in the Shanghai sample, both groups of children showed high rates of growth and increasing growth across time points. Thus, at least for the top-performing children, mathematics learning was maintained at a high level from prekindergarten to first grade, which supports findings reported in the literature that early learning has a strong affect on later school success. As Krajewski and Schneider (2009) found, there is a relation between numerical knowledge acquired prior to first grade and mathematics achievement in later grades.
The growth curves provide additional insights into these findings. The scores of the children in both the Kentucky and the Shanghai samples showed increasing growth over time although the trajectory of growth by first grade decreased in both samples. The decreasing growth of the children in the Shanghai sample could reflect ceiling effects. The TEMA-3 is designed for children 3 years to 8 years 11 months; a mathematics assessment with a greater range may be needed to capture growth in mathematics performance for the Shanghai sample. This explanation does not hold true for the overall lower but increasing growth rate in the scores of the children in the Kentucky sample, or for the children in the Nebraska sample whose growth rate across time was nearly flat. These findings of decreasing or flat growth rate could suggest the need for the children to experience more challenging or stimulating mathematics opportunities to facilitate growth.
There are several avenues to explore to better understand differences between the samples and ways to support and enhance mathematics learning of children at all performance levels. Mathematics learning, as with all learning, relies on the quality of the teaching (Wenglinsky, 2002), particularly the teachers’ mathematical knowledge for teaching (Ball, Thames, & Phelps, 2008), as well as the quality of the classroom environment—including both structure and process elements. Structural elements, such as the physical space, routines, materials, program, and teacher characteristics, are well known to early childhood educators. However, it is the instructional process elements that may be more important for learning. Process elements are “the ways teachers implement activities and lessons, the nature and qualities of interactions between adults and children . . . and the availability of certain types of activities” (Pianta, Barnett, Burchinal, & Thornburg, 2009, p. 66). Mashburn et al. (2008) demonstrated the importance of instructional processes in a multistate U.S. study involving 40 prekindergarten sites and more than 2,400 prekindergarten children. In that study, the influence of instructional processes on mathematics scores was stronger than were structural elements. The Mashburn et al. study compared process quality based on the Classroom Assessment Scoring System (CLASS; Pianta, La Paro, & Hamre, 2007) that is used to observe and evaluate instructional processes in the classroom, and structural quality based on the Early Childhood Environment Rating Scale–Revised (ECERS-R).
We have used two CLASS dimensions (Concept Development and Instructional Learning Formats) to evaluate observations of mathematics activities in prekindergarten classrooms with the Kentucky sample (Jacobi-Vessels, Brown, Molfese, & Do, 2014). Concept Development focuses on how teachers use instructional activities to engage children in higher level thinking skills, such as analyzing, reasoning, and making connections to the real world. Instructional Learning Formats focuses on how teachers structure learning opportunities for children by utilizing a variety of modalities and materials, repeated opportunities for active student participation, and clearly stated learning objectives. Our observations revealed that many prekindergarten teachers incorporated mathematics content in daily activities and routines during circle time and center times, but the levels of engagement reflecting elements of Concept Development and Instructional Learning Formats were low. Indeed, many of the observed classroom events, such as reciting numbers or performing rote activities (e.g., calendar activities involving counting days of the month, or identifying by number the day before or day after the current day) are not actually considered mathematics activities by the National Research Council (2009). These activities should not take time away from engaging children in concepts involving mathematics skills, such as one-to-one correspondences, cardinality, or problem-solving activities. Few observations reflected interactions between teachers and children that involved back and forth questioning, use of reasoning skills to solve problems, or occasions to make connections between mathematics concepts and activities. Changes in teacher–child interactions around mathematics and the use of scaffolding strategies to challenge children’s thinking could help to enhance the development of children’s mathematical thinking skills and to enable teachers to explore the depth of children’s mathematical skills. Although we cannot link classroom practices directly to the mathematics scores of the children in this study, these recommendations should be examined in future studies.
It is also important to consider the expectations held by parents and teachers for their children’s mathematics learning and the home learning environment. Stevenson et al. (1990) related their findings of poor performance by first- and fifth-grade children in their Chicago sample compared with children in the Beijing sample to the attitudes of children, parents, and teachers toward mathematics. Children in Chicago said they liked mathematics (75%) and few thought mathematics was hard or very hard (8%). Children in the Beijing sample also liked mathematics (85%), but more children thought mathematics was hard or very hard (20%). Parents’ responses also reflected differences in attitudes. Chicago parents (35%) thought their children were performing very well in mathematics compared with parents of children in Beijing (13%). Furthermore, less than 10% of teachers in the Chicago sample listed mathematics as the “most important of all the subjects” taught compared with 34% of teachers in Beijing. Teachers in the Chicago sample most preferred to teach language (46%) rather than mathematics (32%). Stevenson et al. (1990) speculated that lower expectations and lower standards for performance in mathematics in the Chicago sample reflected in the parents’ and teachers’ responses and the children’s overestimation of their mathematics skills may be working against more optimal mathematics performance. “Children’s motivation to work hard in school is influenced by the attitudes and evaluations of their parents and teachers” (Stevenson et al., 1990, p. 1066). The role of parents’ and teachers’ expectations and children’s attitudes toward mathematics should be examined in future studies to better understand how expectations and attitudes impact children’s mathematical scores.
There is the question of why the mathematics scores of the children in Shanghai at age 3 years are so high. Findings from two previous studies also show that very young children in Shanghai have overall, high mathematical skills, as well as significant individual variability (X. Zhou, 2006; X. Zhou, Huang, Zhao, & Yang, 2009). For example, while some 3-year-olds might not understand the meaning of “give me one button,” other children confidently count out buttons from a container according to the instruction. These differences most likely reflect the early impacts of the home learning environment as only about 20% of children in Shanghai go to infant and toddler programs. Studies have reported that many parents in Shanghai spend time interacting with their children in mathematical activities at home before they go to preschool (Gao, 2010). These interactions include activities such as talking about numbers, modeling counting words and counting procedures, and playing board games. X. Zhou (2006) and X. Zhou et al. (2009) report that parent–child interactions may be the primary developmental mechanism in promoting children’s number understanding in the early years because such interactions focus children’s attention to number, model basic number skills, and help children to practice and apply new number skills. Furthermore, these interactions take place in an immediately responsive language setting. Children with higher scores on number concept had higher frequencies of parent–child interaction in mathematics at home (Gao, 2010). Huntsinger et al. (1997) reported similar effects of the home learning environment with 5-year-old children in their sample of Taiwan Chinese children and Chicago samples of Chinese American and Euro-American children. Chinese American parents reported more encouragement of mathematics and more direct mathematics instruction with their children compared with the other two groups of parents; the Chinese American children had higher TEMA scores than the Euro-American children. This early mathematical learning is important because children’s mathematics skills at age 3 years significantly predicted mathematics skills at age 6 years (X. Zhou et al., 2009), and children’s mathematics skills at age 5 years significantly predicted their mathematics skills at 10 or 11years of age (Geary, Hoard, Nugent, & Bailey, 2012; Jordan, Kaplan, Ramineni, & Locuniak, 2009; Melhuish et al., 2008). However, it is not clear to what extent the better start in mathematics of children in Shanghai sample at 3 years of age impacted children’s high growth rate in this study.
Limitations
The databases from the three sites came from longitudinal studies in which teachers had opportunities to engage in scheduled professional development activities. In addition, data were included for children regardless of whether their teachers engaged in the professional development or not. Both of these elements may have impacted the findings. However, it is a reality of the educational environment across the school year and in different school years that schools, districts, and states schedule teacher professional development opportunities, make changes to current curricula or adoption of different curricula, design workshops for only some teachers, and include children in different instructional activities. These changes have the potential to not only impact longitudinal designs but also to create “time of measurement” effects (or changes in the environment or context that may relate to measured changes in the participants) for cross-sectional designs. There is little that researchers can do to control the influence of events occurring in the educational environment and we believe that having access to three data sets from three different sites was a good opportunity to study mathematic skill development in young children, in spite of the imperfections of the data sets.
In this study, the examination of gender differences was not a main focus and, with the exception of one significant finding (children in the High group in the Shanghai sample evidenced some gender differences) there were no other significant gender effects. Gender differences in young children have been reported to be small and to vary by the type of mathematics assessment (Halpern et al., 2007). However, the acknowledgment by Halpern et al. (2007) that gender differences may vary by type of assessment makes it important to investigate possible gender differences using assessments of specific mathematics skills, rather than a broad-based assessment such as the TEMA-3.
There were interesting differences in the growth curves found for the Nebraska sample. Unlike the other two samples, the Nebraska data set contained TEMA-3 data from the fall as well as spring of kindergarten and first grade. These growth curves show dramatic score drops between the spring of kindergarten and the fall of first grade. Cooper, Nye, Charlton, Lindsay, and Greathouse (1996) have described such drops in their meta-analysis study and reported effect size declines of −0.14 between fall and spring mathematics scores. Rambo-Hernandez (2011) reported changes in mathematics scores across three time points (initial, school year, and summer) in a longitudinal sample of gifted children from third to sixth grades. She also reported a drop in growth of mathematics scores over the summer. These studies, however, did not include children in the prekindergarten to first-grade age range as studied here. Although information on children’s summer activities was not gathered for this study, further research is needed to understand the role of summer activities (or lack thereof) on young children’s academic performance and whether drops in mathematics performance, such as those found in the present study, might be due to “summer loss.” Furthermore, although information on summer literacy activities is often provided by teachers and is available on websites for parents, more information is needed on comparable information regarding engaging children in mathematics activities during the summer.
Finally, it is tempting to discuss the results of this study of young children in Kentucky, Nebraska, and Shanghai in the context of the changes occurring in ECE around mathematics. The time period following the data collection from the samples in this study are associated in the United States with changes in policy, classroom teaching practices, and performance expectations around mathematics education for young children. The changes in China are similar. Since 2001, mathematics education has been purposely downplayed in the national curriculum guidelines and teachers are generally not well prepared for the understanding of young children’s math learning and teaching. The Shanghai study was initiated to help teachers with mathematics education. Following the end of data collection from the participants in the Shanghai sample in this study, the Ministry of Education in Shanghai published the Early Learning and Development Guideline for Children Age 3-6 that specifies teaching strategies and the expectation for children’s learning of mathematics. However, we have no data on the impacts of the educational environment around mathematics on the mathematics scores of the children in any of the samples in this study. It is important that such data be collected so that changes in education policy, practices, and performance expectations can be linked to assessments of young children’s mathematics skills.
Conclusion
Despite the inclusion of samples that are not representative of site populations and differ in SES, the findings of this study provide evidence of differences between the TEMA-3 scores of children in the three study sites—Kentucky, Nebraska, and Shanghai, China—and differences between three Math Ability groups—High, Average, and Low. More research is needed to understand the instructional processes in the prekindergarten and early elementary classrooms that may be related to these differences. Such research should include observations of classroom teaching practices to better understand specific teaching practices that afford opportunities for growth in mathematics. Although there are no direct data, by inference, these differences in mathematics performance between the three sites may well start before age 3 years. Further study is needed to examine differences between sites in home learning activities, parenting practices around mathematics, and SES that might set the stage for these early differences. It is also critical to understand the growth of TEMA-3 scores in the High compared with Average and Low groups across sites. It is not clear if the growth differences were impacted by the early childhood program or by the mathematics skills of the children at school entry, or both. Further study could provide valuable information for ECE practice in the United States and China.
Footnotes
Declaration of Conflicting Interests
The authors declared no potential conflicts of interest with respect to the research, authorship, and/or publication of this article.
Funding
The authors disclosed receipt of the following financial support for the research, authorship, and/or publication of this article: This work was supported in part by a grant (R305K05186: P. Starkey (PI), University of California-Berkeley, Sub-Award V. Molfese (PI), University of Louisville) from the U.S Department of Education, by the University of Louisville and University of Nebraska - Lincoln; and in part by a grant (DUE 0831835: James Lewis (PI) and Ruth Heaton (Co-PI), University of Nebraska-Lincoln) and by the University of Nebraska-Lincoln. Xin Zhou’s project titled “Early Childhood Performance Assessment” received financial support from the School of Early Childhood and Special Education, East China Normal University.