
Abstract
The Reading and Me Survey (R&MS) measures reading self-perceptions and enjoyment of reading of intermediate elementary students and parallels the Math & Me Survey (M&MS). We examined its psychometric properties through content validation, exploratory factor analysis (EFA), confirmatory factor analysis (CFA), and reliability and external validity analyses. Validity evidence was collected from 777 third through fifth graders from two rural and two urban school districts. Scores on the scales (Reading Self-Perceptions, 13 items; Enjoyment of Reading, nine items) exhibited strong internal consistency, and model fit was good. Using hierarchical linear modeling (HLM), we examined the relations among reading self-perceptions, and enjoyment, mathematics self-perceptions and enjoyment, and teacher ratings of reading and mathematics ability levels, with results demonstrating patterns of discriminant and, convergent validity. Because of its developmentally appropriate vocabulary, its applicability across contexts, its brevity, its parallel format to the M&MS, and its established psychometric properties, the R&MS has potential to be a useful tool for researchers and educators.
For young students, learning to read is a key aspect of the early educational process. Because the ability to read is essential for nearly all academic work, early success in reading is crucial for students (Schiefele, Schaffner, Möller, & Wigfield, 2012). Studies show a connection between reading ability and overall academic performance (Espin & Deno, 1993) and specific content areas such as science (Cromley, 2009) and mathematics (Vilenius-Tuohimaa, Aunola, & Nurmi, 2008). One of the key components in helping a child to become a competent reader is the child’s attitudes toward reading (Guthrie, Wigfield, & VonSecker, 2000; McKenna, Conradi, Lawrence, Jang, & Meyer, 2012; Mol & Bus, 2011; Morgan & Fuchs, 2007; Park, 2011; Wigfield & Guthrie, 1997). Students who have a positive self-belief system toward reading are more willing to persist in learning the essential skills necessary to become an adept reader (Schiefele et al., 2012), and students who enjoy reading are more likely to devote time and energy to improve their reading ability (Marinak, 2013). This is due to the fact that motivation affects the amount and breadth of students’ reading (Mol & Bus, 2011; Wigfield & Guthrie, 1997). Because early success in reading is so critical for future academic achievement, it is essential to examine attitudes of young readers.
The purpose of this study was to develop a survey to measure intermediate (Grades 3-5) students’ reading self-perceptions and enjoyment of reading and to collect validity and reliability evidence for the measure. Our goal was to develop a survey that was parallel to the Math and Me Survey (M&MS; Adelson, 2006; Adelson & McCoach, 2011) but that reflected how these constructs are manifested in reading rather than in mathematics. The resulting instrument, the Reading and Me Survey (R&MS; Adelson & Sherretz, 2013), can be used with students in Grades 3 through 5. We sought to measure two constructs: reading self-perceptions and enjoyment of reading. We based our conceptual definition of reading self-perceptions and enjoyment of reading on the M&MS definitions of mathematical self-perceptions (which used Bandura’s (1994, 1997) definition of perceived self-efficacy and Fennema and Sherman’s (1976, 1978) definition of confidence in learning in mathematics) and enjoyment of mathematics. We defined reading self-perceptions as a person’s perceptions of self as a reading learner, including beliefs about his or her ability to learn to read and to read well. We defined enjoyment of reading as the degree to which a person takes pleasure in reading and learning to read.
Background
Reading Self-Perceptions
From the time that students start learning to read, they begin to develop their own perceptions about their reading ability. In fact, research has shown that as early as first grade, students are able to assess their reading self-perceptions reliably (Eccles, Wigfield, Harold, & Blumenfeld, 1993). These perceptions formed by students include both their reading self-efficacy and their reading self-concept. Academic self-efficacy is a student’s perceived ability to learn and master academic concepts (Pastorelli et al., 2001). From this, we define reading self-efficacy as the perception one has about one’s own ability to master the skills necessary to learn to read with fluency (Solheim, 2011). On the contrary, reading self-concept relates more to a student’s emotions or feelings of self-worth in relation to their reading ability and often is formed from information gained from others (Marsh, Smith, & Barnes, 1983). Although distinctions are made in the definitions of self-efficacy and self-concept, many inventories measure the two together because they are inherently interconnected (Schiefele et al., 2012), and past research has shown a strong correlation between the two constructs (Skaalvik & Skaalvik, 2006). In fact, “empirical efforts to distinguish between self-concept, self-esteem, and self-efficacy beliefs have met with only limited success” (Valentine, DuBois, & Cooper, 2004, p. 112). For the purpose of developing this instrument, we chose to measure reading self-perceptions as the combination of both self-efficacy and self-concept.
It is important to note that the R&MS specifically measures reading self-perceptions. Just as individuals may have high achievement in one subject area and not in another (“tilt”), having high self-efficacy in one domain does not necessarily transfer to other domains as self-efficacy is a domain-specific construct (Bandura, 1982). In fact, Pastorelli et al. (2001) noted that “scales of perceived self-efficacy must be tailored to the particular domain of functioning that is the object of interest” (p. 88). The notion that self-efficacy is not a global trait holds for self-concept as well (Marsh, Barnes, Cairns, & Tidman, 1984; Marsh, Relich, & Smith, 1983; Marsh, Smith, & Barnes, 1983; Marsh, Smith, Barnes, & Butler, 1983; Shavelson & Bolus, 1982), with reading and mathematical self-concept having little or no correlation (Marsh, Relich, & Smith, 1983). In fact, children’s differing levels of self-perceptions in different domains occur “quite early, even before children have had a lot of experience within the school domain” (Eccles et al., 1993, p. 838). Thus, it is critical that at third grade measures of self-perceptions address specific domains rather than global self-perceptions.
The study of reading self-perceptions has important correlates to the study of academic achievement. Reading self-perceptions have been found to be a strong predictor in reading comprehension and reading achievement (Schiefele et al., 2012). In fact, reading self-perceptions have been found to be a stronger predictor of reading comprehension scores than question type or text type for fifth graders (Solheim, 2011). In looking at special populations of elementary students, self-beliefs have been found to be a particularly strong correlate of reading ability among students at risk of failure in reading and even more so for at-risk girls (Fives et al., 2014).
Many researchers have attempted to place meaning behind this link between reading self-perceptions and reading achievement (Marsh, Craven, & Debus, 1991). One oft-studied theory is that students with higher self-perceptions have stronger motivation toward persistence in a task and, therefore, practice that task more often (Bandura, 1977; Schiefele et al., 2012). This motivation for reading is what activates students to engage in reading and commit to greater comprehension of text than students with less motivation for reading (Guthrie & Wigfield, 2000). Butkowsky and Willows (1980) found that fifth graders who had stronger self-beliefs about their abilities persisted 40% longer in reading a difficult passage than did their peers who had weaker self-beliefs. Another more recent study of sixth graders found that those who self-identified as strong readers were more likely to employ a variety of different strategies toward reading a text than peers who self-identified as weak readers, regardless of actual reading ability (Hall, 2012). Thus, studying reading self-perceptions can lead to a better understanding of how students achieve in literacy. This is particularly important as intermediate-grade students’ motivational beliefs tend to decrease over time (Guthrie & Wigfield, 2000).
In addition to the strong relationships found with reading achievement, reading self-perceptions also influence other affective traits of reading students. Past research has found that there is a strong link between student self-perceptions and the extent to which they engage in reading. Reading engagement, defined as the extent to which a student enters into activities involving reading skills or reading development, has been found to be a predictor of achievement in reading (Ponitz, Rimm-Kaufman, Grimm, & Curby, 2009). In a study of intermediate students, those students who had a higher level of self-perceived ability in reading were more likely to choose to spend time reading than those students of lower self-perceived ability (Henk & Melnick, 1995). In addition, the students who reported a higher confidence in reading remained on task significantly longer than those students who felt less able in reading (Henk & Melnick, 1995). A recent study of middle school students found that reading self-efficacy was a positive moderator of the relationship between reading engagement and reading achievement (Guthrie, Klauda, & Ho, 2013). Thus, the further study of reading self-perceptions might help to understand student increases in both reading engagement and reading achievement.
Enjoyment of Reading
A second facet of reading attitudes is the enjoyment of reading, which also is associated with both reading achievement and engagement. Quite simply, we define reading enjoyment as the extent to which a student finds pleasure in engaging in activities involving reading. Students have offered a variety of reasons for enjoying reading, including interest in a particular subject, desiring excitement, or looking for an escape (Schiefele et al., 2012). A survey of sixth grade students found that nearly half of students reported that their interest in the specific reading materials was a contributing factor in their motivation to read (Ivey & Broaddus, 2001). Reading enjoyment is posited to be one of the main intrinsic motivational factors leading students to engage in literary activities (C. Clark & de Zoysa, 2011).
Reading enjoyment has been found to have a positive relationship with reading comprehension (Schiefele et al., 2012). This correlation may be due to a number of factors. Most commonly, the correlation between enjoyment and achievement has been linked to the idea that students in third through fifth grade who are better readers will find reading more enjoyable (Cox & Guthrie, 2001). However, it has been noted that some students with high levels of literary attainment find reading less enjoyable due to the added amount of stress placed on the need to excel (Goetz, Hall, Frenzel, & Pekrun, 2006). Even so, after controlling for several other factors, enjoyment of reading remained a strong predictor of academic success in high school students in the Program for International Student Assessment (PISA) dataset (L. A. Clark & de Zoysa, 2011).
Reading enjoyment also has been found to be a positive predictor of persistence in reading. In particular, the level to which a student enjoys reading serves as a moderator of the relationship between a student’s self-efficacy and the amount of time that they spend reading (L. A. Clark & de Zoysa, 2011). In a study of struggling adolescent readers, Neugebauer (2014) found that fifth-grade students who claimed to enjoy reading or who claimed to at least enjoy the topics which they were reading were more likely to spend time engaged in that activity.
Similar Instruments
As demonstrated by the literature cited above, reading attitudes are important and have educational consequences for all learners and, thus, warrant more extensive study. However, many of the current scales focus on adolescent readers, with few scales measuring reading attitudes in the intermediate school years. Using scales developed for older students does not work well for younger students as the format of the questions is typically not familiar nor is the wording or vocabulary appropriate for the knowledge base of young readers, which leads to biased or inaccurate measurement of the constructs (Kazelskis et al., 2005). Although not always advisable, some studies of Grades 3 to 5 students have had to adapt scales developed for older students to obtain information about reading attitudes.
One of the most popular instruments that has been developed for younger students is the Elementary Reading Attitudes Scale (ERAS). The ERAS (McKenna & Kear, 1990) uses a 4-point Likert-type scale with pictorial representations to measure reading attitudes of students in Grades 1 to 6. The scale measures two aspects of reading attitudes: recreational reading and academic reading (McKenna & Kear, 1990). Although the ERAS is one of the most widely used scales, there are few publicly available estimates of reliability or validity measures for the instrument, and those that are available have brought to light some psychometric problems with the instrument. In the article describing its development and validation (McKenna & Kear, 1990), there are some issues with the factor structure of the instrument. Although McKenna and Kear recommended the instrument be used as two subscales, the factor analysis did not clearly support two subscales. In addition, a somewhat recent study with a sample of 718 students found that, although the instrument scores exhibited good reliability for students in Grades 1 to 3, score reliability dropped below the commonly acceptable level of α = .80 (C. Clark & Watson, 1995; Urbina, 2004) for students in the intermediate school grades (Kazelskis et al., 2005). In other words, the ERAS scores are not as reliable for older students as they are for younger students. In addition, information gained from the ERAS is very general. All 20 items on the scale relate to a student’s particular feelings toward different types of readings (McKenna & Kear, 1990). Although this provides interesting information regarding a student’s emotions toward reading, it does not measure a sense of self-perceptions or a measure of general enjoyment of reading.
Another commonly cited scale is Marsh’s Self-Description Questionnaire (SDQ). The SDQ measures self-concept in seven different components, one of which is reading. Early analysis of the SDQ found that it measured well for older students (i.e., sixth grade and beyond) but that the instrument measured less well for younger students (Marsh & O’Neill, 1984). Although some writers asserted that the measurement of self-concept could not be conducted in preadolescents due to difficulty with students being able to conceptualize their own thoughts on their ability to learn, Marsh (1990) continued to examine the study of self-concept in very young children. Further study of the SDQ with those in the younger age groups determined that self-concept can be measured in young children but that adjustments could be made to improve the measurement. In particular, Marsh (1990) concluded that simplification of some items and the reading aloud of the survey aided in measuring self-concept in young children. Thus, work with the SDQ has shown that it is possible to measure self-concept in young children. However, the SDQ’s broad focus on a variety of components of self-concept does not allow for a detailed analysis of reading self-perceptions.
The Motivation to Read Profile–Revised (Malloy, Marinak, Gambrell, & Mazzoni, 2013) is based on the original Motivation to Read Profile (Gambrell, Palmer, Codling, & Mazzoni, 1996), which were both designed for use with children in Grades 2 to 6. This instrument includes two components. First, the Reading Survey includes 10 items measuring children’s value of reading as well as 10 items measuring their self-concept of their reading ability. Each of these is measured on a 4-point scale. These items were updated in the revised version to be consistent with cultural and linguistic changes since the original instrument’s development. In a study of the revised measure with children in Grades 3 to 5, alphas for the reading self-concept subscale and value of reading subscales were equal to .81 and .85, respectively (Malloy et al., 2013). However, the reported root mean square error of approximation (RMSEA) value for the revised measure was equal to .09 (Malloy et al., 2013), which is greater than the recommended .06 to indicate good fit (Hu & Bentler, 1999). In addition, the instrument also includes a Conversational Interview that is administered individually with the child. The Conversational Interview gathers additional information about the content children enjoy reading and where they obtain reading materials (Gambrell et al., 1996; Malloy et al., 2013). Finally, results from an investigation of a math attitudes instrument found that a 5-point Likert-type scale functioned better, resulting in better psychometric properties, than a 4-point Likert-type scale like the one used on this study (Adelson & McCoach, 2010).
The Motivations for Reading Questionnaire (MRQ), developed by Wigfield and Guthrie (1995), is a scale that has been validated for students as early as Grade 4. This inventory examines reading self-efficacy as well as several different intrinsic and extrinsic motivational factors. Since its development, Guthrie and colleagues have used multiple versions of it, resulting in a range of psychometric evidence. They used a 3-item version of the reading efficacy scale that exhibited poor internal consistency, with alpha of .63. Neither reading motivation nor reading self-efficacy predicted reading comprehension or conceptual learning, after controlling for reading amount, past achievement, and prior knowledge (Guthrie, Wigfield, Mestsala, & Cox, 1999). They used a 31-item version of their overall scale (including the 3-item reading efficacy scale) with students in Grades 3 and 5 with better psychometric properties than their original scale, including alpha of .85 for the overall scale (Guthrie et al., 1999), although scores from overall scales do tend to have greater internal consistencies due to the increase in items. In a subsequent study, they did not use that version and instead used an 18-item version with Grade 4 students with an overall alpha of .75 and found that students’ motivation scores on the MRQ were not significantly related to growth in their reading comprehension over 12 weeks (Guthrie et al., 2007).
Other instruments have been developed to measure aspects of reading attitudes; though, many are not intended for use with intermediate elementary children or do not encompass a variety of attitudinal beliefs. For instance, the Me and My Reading Profile (Marinak, Malloy, Gambrell, & Mazzoni, 2015) is an even more recent iteration of the Motivation to Read Profile–Revised, intended to be used with children from Grades K-12, and Henk and Melnick (1995) developed a scale that attempts to tap into student enjoyment and relational aspects of self-perceptions but is intended for an older audience.
In conclusion, although there are existing scales that examine different facets of reading attitudes, there are a number of issues with those instruments. First, many of them are not intended for or validated with intermediate elementary grades. Second, many of them are not measures specifically of reading self-perceptions or of general enjoyment of reading. Finally, some of the similar instruments reviewed have exhibited psychometric issues in regard to validity or reliability, such as factor analyses not supporting the subscales, poor internal consistency, poor model fit, or the use of a 4-point Likert-type scale.
Rationale for Intermediate Elementary Grades
Why our focus is on the intermediate elementary grades? Early assessment and intervention are critical because if students disengage from learning early, “there is a risk of this trend becoming firmly embedded and thus difficult to change” (Archambault, Eccles, & Vida, 2010, p. 812). Moreover, if students disengage, they are less likely to acquire necessary reading skills to succeed not only in reading but also in other subjects, which may lead to school disengagement (Janosz, Archambault, Morizot, & Pagani, 2008). Archambault et al. (2010) found that students have different patterns and pathways across schooling in their reading attitudes and that nearly one third of students reported low self-beliefs by the end of elementary school. Thus, they note that “it is important to identify how the practices used by elementary school teachers can influence these patterns. This knowledge could help researchers and professionals in the development of effective strategies promoting children’s self-concept of ability and value of literacy” (p. 813). Thus, we propose that by developing a scale with strong psychometric properties, specifically for the intermediate elementary grades, we provide researchers and educators with a tool to measure and to monitor student beliefs at a critical time in their reading development, prior to their transition to middle school.
The Present Study
Our development of a new scale attempts to fill a void for use with intermediate students and offers the ability to measure both reading self-perceptions and enjoyment with a single instrument. We focused our development of the items on using developmentally appropriate vocabulary, on allowing the instrument to be used across contexts, and on maintaining brevity with its domain-specific focus on these two constructs. We also used a developmentally appropriate and psychometrically strong Likert-type scale (see Adelson & McCoach, 2010). In addition, this instrument parallels the M&MS (Adelson, 2006; Adelson & McCoach, 2011), and thus researchers and educators can use the scales in tandem for examining self-perceptions in and enjoyment of both mathematics and reading. To examine the psychometric properties of the instrument we developed, we specifically asked the following questions:
For the final research question, we generated hypotheses related to discriminant and convergent validity evidence. We hypothesized that reading self-perceptions would be most strongly related to reading enjoyment and to mathematical self-perceptions because they share content area and psychological construct, respectively (convergent validity), and would have lower correlations with enjoyment of mathematics given the different content area and psychological construct (discriminant validity). Similarly, we hypothesized that enjoyment of reading would be most strongly related to reading self-perceptions and to mathematical enjoyment because they share content area and psychological construct, respectively (convergent validity), and would have lower correlations with mathematics self-perceptions given the different content area and psychological construct (discriminant validity). We anticipated that the scores on the two reading scales would be related to teacher ratings of reading ability (convergent validity) and not related to teacher ratings of mathematics ability (discriminant validity).
To investigate these research questions, we followed an instrument development process similar to what is recommended by McCoach, Gable, and Madura (2013) for developing and validating instruments in the affect domain and that addresses Standards for Educational and Psychological Testing (American Educational Research Association, American Psychological Association, & National Council on Measurement in Education, 2014). After defining our constructs and generating items, this process included content validation in which we generated items and sought the expertise of content validators. Once we narrowed down and refined our items based on the content validation process, we administered the survey to more than 700 students, randomly split the data set into two groups, and conducted exploratory and confirmatory factor analyses (EFA and CFA) as well as reliability analyses to examine the psychometric properties of the instrument. Finally, we analyzed the students’ responses to the items with a larger data set to examine external and discriminant validity.
Content Validation
Item Generation and Content Validation Process
After reviewing the literature on self-perceptions and enjoyment in relation to reading, we carefully reviewed instruments that measure similar constructs and the M&MS. We also consulted with a researcher who works with intermediate-grade students and with both preservice and practicing teachers to help us determine how these constructs manifest in reading as compared with mathematics.
To establish the content validity of the R&MS, we developed an online content validity questionnaire inviting experts in the field to serve as jurors in validating the instrument. The experts worked in education, and they all had demonstrated knowledge and skills in reading. Of the eight validators, three were current professors and five were currently working in a school district. The validators working in the school district had a range of positions including teacher, literacy coach, professional development school teacher, and Title I specialist.
The content validation questionnaire provided the conceptual definitions of reading self-perceptions and enjoyment of reading. For each of the 34 generated item stems, the validators indicated the category that it best fit (the two constructs of interest or “other”), how certain they were of the placement of the statement in the construct (not very sure, pretty sure, very sure), and the relevance of the item to the category (low/no relevance, mostly relevant, highly relevant). After completing these three tasks for each item stem, validators provided open-ended feedback on the definitions of the constructs, the range of content covered, the wording of the items, and suggestions for items.
Results of the Content Validity Investigation
For each of the item stems in the content validity investigation, we calculated the percentage of validators choosing each category, with our first priority being consensus in the factor each item was measuring. In all cases, the category that was indicated the majority of times was the hypothesized category. Next, we used only validators who chose that majority category and calculated the average certainty rating and the average relevance rating. There were six items that 75% or less of validators chose the same category, so we eliminated those items. The remaining items each had at least 87.5% of validators place it in the hypothesized category, with a certainty range of 2.43 to 2.86 (out of 3) and a relevance range of 2.43 to 2.88 (out of 3).
We considered both the quantitative results and comments about individual items when making final decisions about which items to retain for the pilot instrument. As noted above, our first priority was that at least 80% of content validators chose the same conceptual category (McCoach et al., 2013). We also only retained items with certainty and relevance ratings of at least 2.50. When items were noted as being redundant, we used the certainty and relevance ratings to choose the more relevant item to retain. Based on the content validation results, we retained 13 of the initial 17 items for the self-perceptions scale and 10 of the initial 17 items for the enjoyment scale. Items were then randomly ordered and matched with a 5-point Likert-type scale labeled “strongly disagree,” “disagree,” “neither agree nor disagree,” “agree,” and “strongly agree.” We chose a 5-point Likert-type scale to be parallel to the M&MS and based on psychometric evidence that the 5-point Likert-type scale resulted in better psychometric properties than a 4-point Likert-type scale for the M&MS (Adelson & McCoach, 2010).
EFA and CFA and Reliability Analyses
Sample
Third through fifth graders in nine schools were invited to complete several surveys, including the R&MS, as part of a larger research collaboration. Because the administration of this instrument was part of a larger research collaboration taking place in only elementary schools, the sample was limited to third through fifth grade, unlike the M&MS, which has been validated with third through sixth grade. The schools were from four school districts: two urban and two rural. We administered the surveys in November, March, April, and May, depending on when schools agreed to participate and teachers had availability for us to administer the surveys.
A total of 777 students had parent permission and chose to participate. Members of the research team read the directions and all items to the students. More females (n = 443, 57%) than males participated in the study. The three grade levels were nearly evenly represented (third grade: n = 276, 35.5%; fourth grade: n = 250, 32.2%; fifth grade: n = 250, 32.2%). We had students self-identify their race/ethnicity. While administering the surveys, many students had questions about what they were, and we tried to help and have teachers help the best we could. We still had more students identify as one either White or Black and Native American than the total number of students officially categorized as Native American in the school. As such, if a student identified as another ethnicity and Native American, we coded them in the non-Native American category. Just over half the students (n = 437, 56.2%) self-identified as White, with about a quarter of the students (n = 209, 26.9%) identifying as Black. Sixty eight students (8.8%) self-identified as Hispanic, and 35 students (4.5%) self-identified as Asian or Pacific Islander. The remaining students (28 students, 3.6%) self-identified as multiracial, Native American, or other. We randomly split the data set into two groups, one for the EFA and one for the CFA.
EFA
We used EFA to determine the factor structure of the R&MS (Preacher & MacCullum, 2003). We chose to conduct the EFA using principal axis factoring (PAF) as it is the classical method for decision-making in identifying unobservable latent factors (Pett, Lackey, & Sullivan, 2003). We also ran the analyses using maximum likelihood and had similar results. As reading self-perceptions and reading enjoyment are likely related, we used direct oblimin rotation, which allows for the correlation of the factors. For the EFA sample, Bartlett’s test of sphericity (χ2 = 4,434, df = 253, p < .001) and the Kaiser–Meyer–Olkin (KMO) measure (.93) both suggested that these data were suitable for use in factor analysis (Pett et al., 2003).
In determining the number of factors to extract, we used multiple criteria. The Kaiser criterion, which suggests the retention of those factors that have eigenvalues greater than 1.0 (Stevens, 2012), suggested a four-factor structure. However, it has been noted in the literature that this method tends to overfactor (Russell, 2002). We also examined the elbow of the scree plot, which suggested that a two-factor structure would be appropriate for the data. Parallel analysis (PA) increasingly is considered the preferred method for determining the number of factors to retain (Hayton, Allen, & Scarpello, 2004). Through PA, we checked both the mean criterion and the 95th percentile criterion, both of which suggested a two-factor structure. We decided to extract two factors based on agreement of the results of the PAs and the interpretation of the scree plot.
Table 1 shows the standardized pattern coefficients, structure coefficients, and communalities of the PAF with direct oblimin rotation. We used the following criteria to determine which factors to retain: (a) pattern coefficient was at least .4 as described by Thompson (2004), (b) the pattern coefficient for the other factor was less than .3, and (c) the pattern coefficient for the other factor was at least .2 less than the pattern coefficient for the main factor. Item 22 (“I like when my teacher reads books out loud to me”) was the only item that did not meet all three of these criteria. The pattern coefficient for Item 22 was only .215, and it had a communality of only .037. Because of its low pattern coefficient and communality, we eliminated this item and did not include it in further analysis. All 22 remaining items loaded on the hypothesized factors, with 13 items loading on and operationally defining Reading Self-Perceptions and nine items loading on and operationally defining Enjoyment of Reading. As with the M&MS, the proportion of variance in the items explained by the factors (h2) was stronger for items loading on the Enjoyment of Reading factor than the Reading Self-Perceptions factor. The two factors explained 47.15% of the common variance. The correlation between the two factors (r = .46) was a moderately strong positive correlation, indicating that as reading self-perception increases, reading enjoyment increases.
The Original Reading and Me Survey Items, Their Structure Coefficients, Pattern Coefficients, and Communalities.
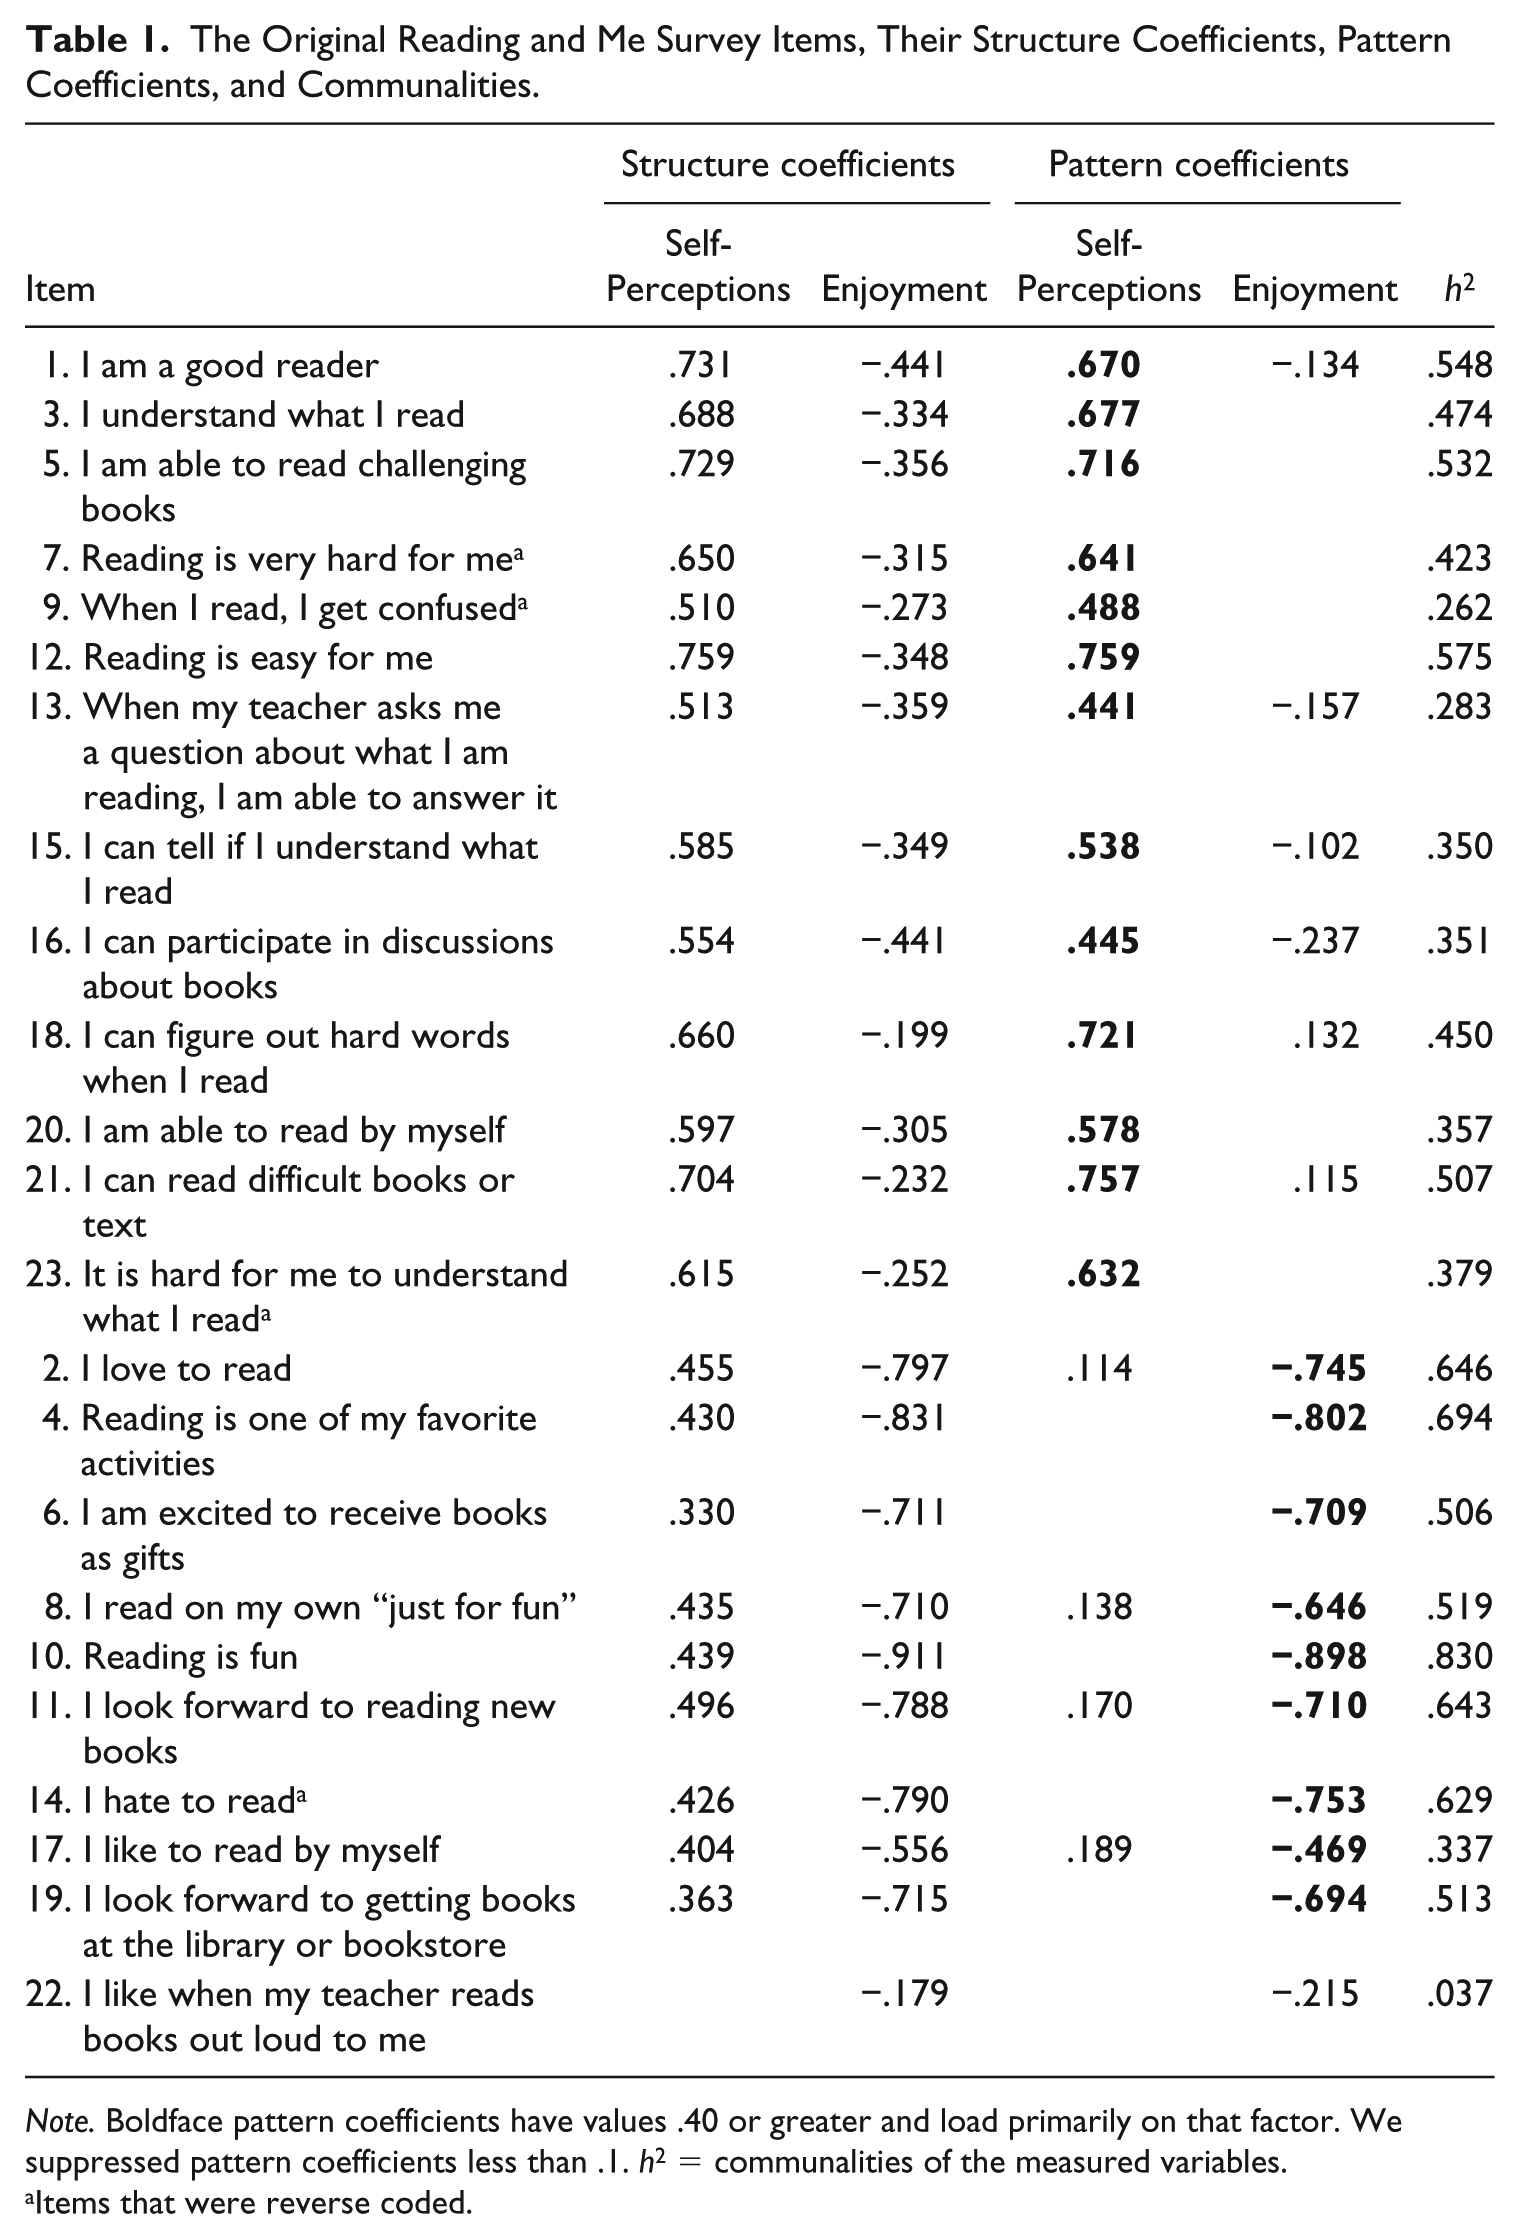
Note. Boldface pattern coefficients have values .40 or greater and load primarily on that factor. We suppressed pattern coefficients less than .1. h2 = communalities of the measured variables.
Items that were reverse coded.
Internal Consistency Reliability Analysis for EFA Sample
We examined the internal consistency of the items within each of the two scales. Cronbach’s alpha served as the reliability measure for the scales, representing the proportion of variability in the scale that is attributable to the true score on that factor (Pett et al., 2003). Urbina (2004) recommends an alpha of .80 or higher for acceptable internal consistency. Tables of the interitem correlations, means, and standard deviations for the original items of the Reading Self-Perceptions scale and the Enjoyment of Reading scale are available upon request.
Reading Self-Perceptions scale
Reliability analysis for the 13-item Reading Self-Perceptions scale resulted in a Cronbach’s alpha of .90 (confidence interval [CI]95 = [.88, .91]). Interitem correlations ranged between .20 and .60 with a mean of 0.40 and standard deviation of 0.09, suggesting that the correlations are fairly homogeneous. Based on these statistics, we chose to retain all 13 of the items.
Enjoyment of Reading scale
Reliability analysis for the 9-item Enjoyment of Reading scale resulted in a Cronbach’s alpha of .92 (CI95 = [.91, .93]). The mean of the interitem correlations was 0.57, with correlations ranging from .34 to .78. The standard deviation of interitem correlations was 0.10, showing relatively little variability among the correlations. Results of the internal consistency analysis suggested that we retain all nine of the remaining items.
CFA
Based on the results from the EFA, we tested a model with two latent factors, Reading Self-Perceptions and Enjoyment of Reading, which we allowed to be correlated with each other. We chose to run the CFA with weighted least squares (WLSMV) using Mplus (Muthén & Muthén, 2010), which allows for missing data. Mplus also treats the Likert-type scale values, which are ordinal, as categorical variables rather than continuous variables. Prior to conducting the full analyses, we examined the missingness in the data to determine the extent of missing data. No item had more than 2% missing responses. The model included the 22 items retained from the EFA as the observed, ordered categorical indicators of the two latent factors. Although there were small cross-loadings on the two factors in the EFA, we estimated a CFA with no cross-loadings to examine whether the model with correlated factors and no cross-loadings exhibited adequate fit.
All regression weights (or path coefficients) were statistically significant (p < .001). In addition, as shown in Table 2, analysis of the standard regression weights revealed that all the items had a regression weight between .3 and .9 except for E5 (“Reading is fun” = .945). This actually parallels the CFA of the M&MS, on which all items were within that range except “Math is fun” (regression weight = .939). The correlation between Enjoyment of Reading and Reading Self-Perceptions was .68, which represents a moderately strong correlation between the two factors.
Standardized Regression Weights From Confirmatory Factor Analysis.
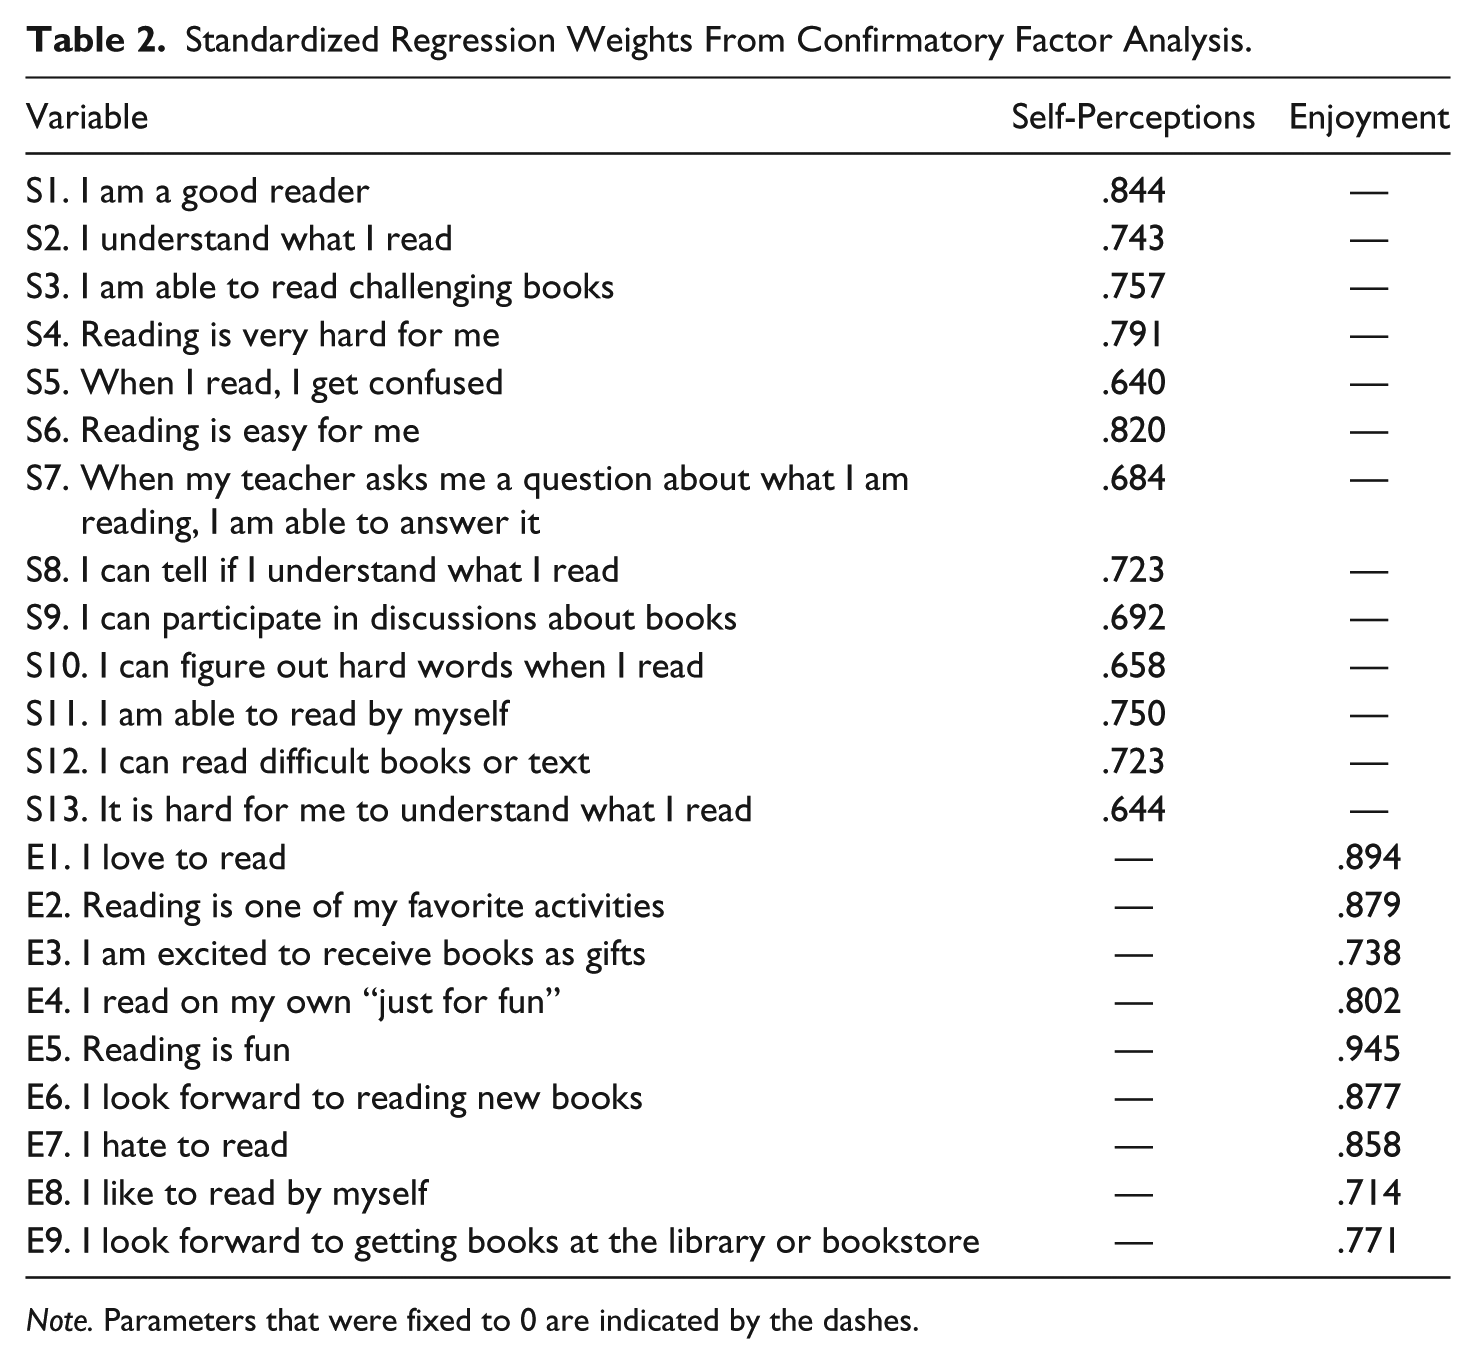
Note. Parameters that were fixed to 0 are indicated by the dashes.
We then considered model fit for the two-factor model. Although the χ2 (742.14 [58], p < .001) did not indicate good model fit, the other measures of model fit indicated very good model fit. This model had a comparative fit index (CFI) (.96) above Hu and Bentler’s (1998) recommended cutoff of .95 and an RMSEA (.06) equal to their cutoff.
Internal Consistency Reliability Analysis for CFA Sample
Finally, we checked the robustness of the reliability estimates from the EFA with the CFA sample. The analysis of the Reading Self-Perceptions scale resulted in a Cronbach’s alpha of .91 (CI95 = [.89, .92]). The analysis of the Enjoyment of Reading scale resulted in a Cronbach’s alpha of .94 (CI95 = [.93, .95]).
Interpretation of Factors and Calculation of Scale Scores
The Reading Self-Perceptions scale measures the degree to which students believe that they have the ability to read and to understand what they have read. This scale includes items that have students respond about their perceptions of themselves as a reader, their perceptions of the difficulty or ease of reading for them, and their understanding of what they read in different contexts (e.g., when they read, when teachers ask them questions about what they read, when discussing what they read). Students who score high on this scale believe they are able to read and to understand and discuss what they read. On the contrary, students who score low on this scale believe that reading is difficult for them and do not believe in their ability to read and to understand what they read.
The Enjoyment of Reading scale measures the degree to which students derive pleasure from reading. This scale includes items that have students respond about their general enjoyment of reading as well as their appreciation of books. Students who score high on this scale find pleasure in reading and in owning and borrowing books. On the contrary, students who score low on this scale do not derive pleasure from reading, do not look forward to reading, and do not enjoy books.
To calculate a scale score, a point value is assigned to each Likert-type response, with strongly disagree = 1 and strongly agree = 5. Negatively worded items are reverse coded. The scores on the items in each scale are averaged to obtain the scale scores, keeping in mind that a 5-point Likert-type scale was used so the lowest possible scale score is 1.0 and the highest possible scale score is 5.0. The R&MS scales are not intended to measure one overarching construct, so items across the two scales should not be combined into one score. The scores on the scales had a correlation of .53 for the EFA sample and a correlation of .61 for the CFA sample.
On the Reading Self-Perceptions scale, the EFA sample had a mean score of 4.14 with a standard deviation of 0.67 (range = 1.00-5.00), and the CFA sample had a mean score of 4.10 with a standard deviation of 0.69 (range = 1.15-5.00). Overall, the students believed they are able to read and to understand what they read, but there was variability in those scores. On the Enjoyment of Reading scale, the EFA sample had a mean score of 3.90 with a standard deviation of 0.98 (range = 1.00-5.00), and the CFA sample had a mean score of 3.85 with a standard deviation of 1.04 (range = 1.00-5.00). Overall, students generally enjoy reading, although there is room for increasing their enjoyment. The scores on both scales indicate that further research on effective ways to increase self-perceptions and on potential subgroup differences is warranted.
External and Discriminant Validity
To provide further validity evidence, we combined the data on the R&MS with other data from the larger data set. In particular, we were interested in how students’ reading self-perceptions and enjoyment of reading relate to their mathematical self-perceptions and enjoyment of mathematics and to teacher ratings of their reading and mathematics ability. By looking at correlations among similar constructs in another subject area, we were examining evidence of discriminant and convergent validity. In addition to the R&MS, students completed the M&MS. Their teachers also rated students’ mathematics and reading ability on a scale of 1 to 5 (1 = 2 or more grades below grade level, 2 = about 1 grade below grade level, 3 = grade level, 4 = about 1 grade above grade level, 5 = 2 or more grades above grade level). Note that we had no other measure of students’ mathematics or reading ability and no way to ensure reliability or validity of these ratings. Thus, we refer to these as teacher ratings of ability rather ability.
We only included students whose responding teacher could rate both their reading and mathematics ability. For these analyses, we had a total of 547 students in 56 classes, with an average of 10 students per teacher (SD = 5.88). The data violate the assumption of independence, with students having classes with and being rated by the same teachers. Therefore, we used hierarchical linear modeling (HLM; Raudenbush & Bryk, 2002) to account for the nested nature of the data. All analyses were run in HLM v7 using restricted maximum likelihood. The outcome variables were student scores on the Reading Self-Perceptions scale (M = 4.09, SD = 0.71) and on the Enjoyment of Reading scale (M = 3.87, SD = 1.02). Predictors included teacher rating of reading ability (M = 3.33, SD = 1.15), teacher rating of mathematics ability (M = 3.29, SD = 1.03), student scores on the Mathematics Self-Perceptions scale (M = 3.70, SD = 0.86), student scores on the Enjoyment of Mathematics scale (M = 3.75, SD = 0.96), and two dummy codes indicating grade level. The student and teacher scores were entered into the model grand-mean centered to provide a meaningful zero. The two grade-level dummy codes were entered uncentered as teacher-level predictors.
For each of the two outcomes (i.e., Reading Self-Perceptions and Enjoyment of Reading), we estimated four models: (a) an unconditional (null) model that included no predictors to calculate the intraclass correlation coefficient (ICC), which is an indicator of the degree of homogeneity of students within teachers (McCoach & Adelson, 2010), and to calculate the average score after accounting for the nonindependence of data; (b) a model with the two grade-level dummy codes to see whether the scores differ across grades; (c) a model with teacher ratings of mathematics and reading ability (controlling for grade level) to see whether the indicator of reading ability is more related to the outcome than the indicator of mathematics ability; and (d) a model with Mathematics Self-Perceptions, Enjoyment of Mathematics, and the other R&MS scale score (controlling for grade level) to examine convergent and discriminant validity in terms of subject and construct. We fixed any random effect that was not statistically significant at p = .05.
Reading Self-Perceptions Results
First, we ran an unconditional (null) model. The ICC was .09, indicating that 9% of the variance was between classes, with 91% of the variability being between students within classes. This was comparable with the ICC for Mathematical Self-Perceptions previously found (.06; Adelson & McCoach, 2011) and found with this sample (.12). The average Reading Self-Perceptions score was 4.07.
Next, we estimated a model examining whether Reading Self-Perceptions differed by grade level. As indicated in Table 3, like with the M&MS (Adelson & McCoach, 2011), we found that grade level was not associated with how students perceived themselves in reading (γ01 = 0.13, p = .19; γ02 = 0.21, p = .05).
Results From Hierarchical Linear Models Examining Relationships Between Reading and Me Survey Scales and Grade Level, Teacher Ratings of Reading and Mathematics Ability, and Math and Me Survey Scales.
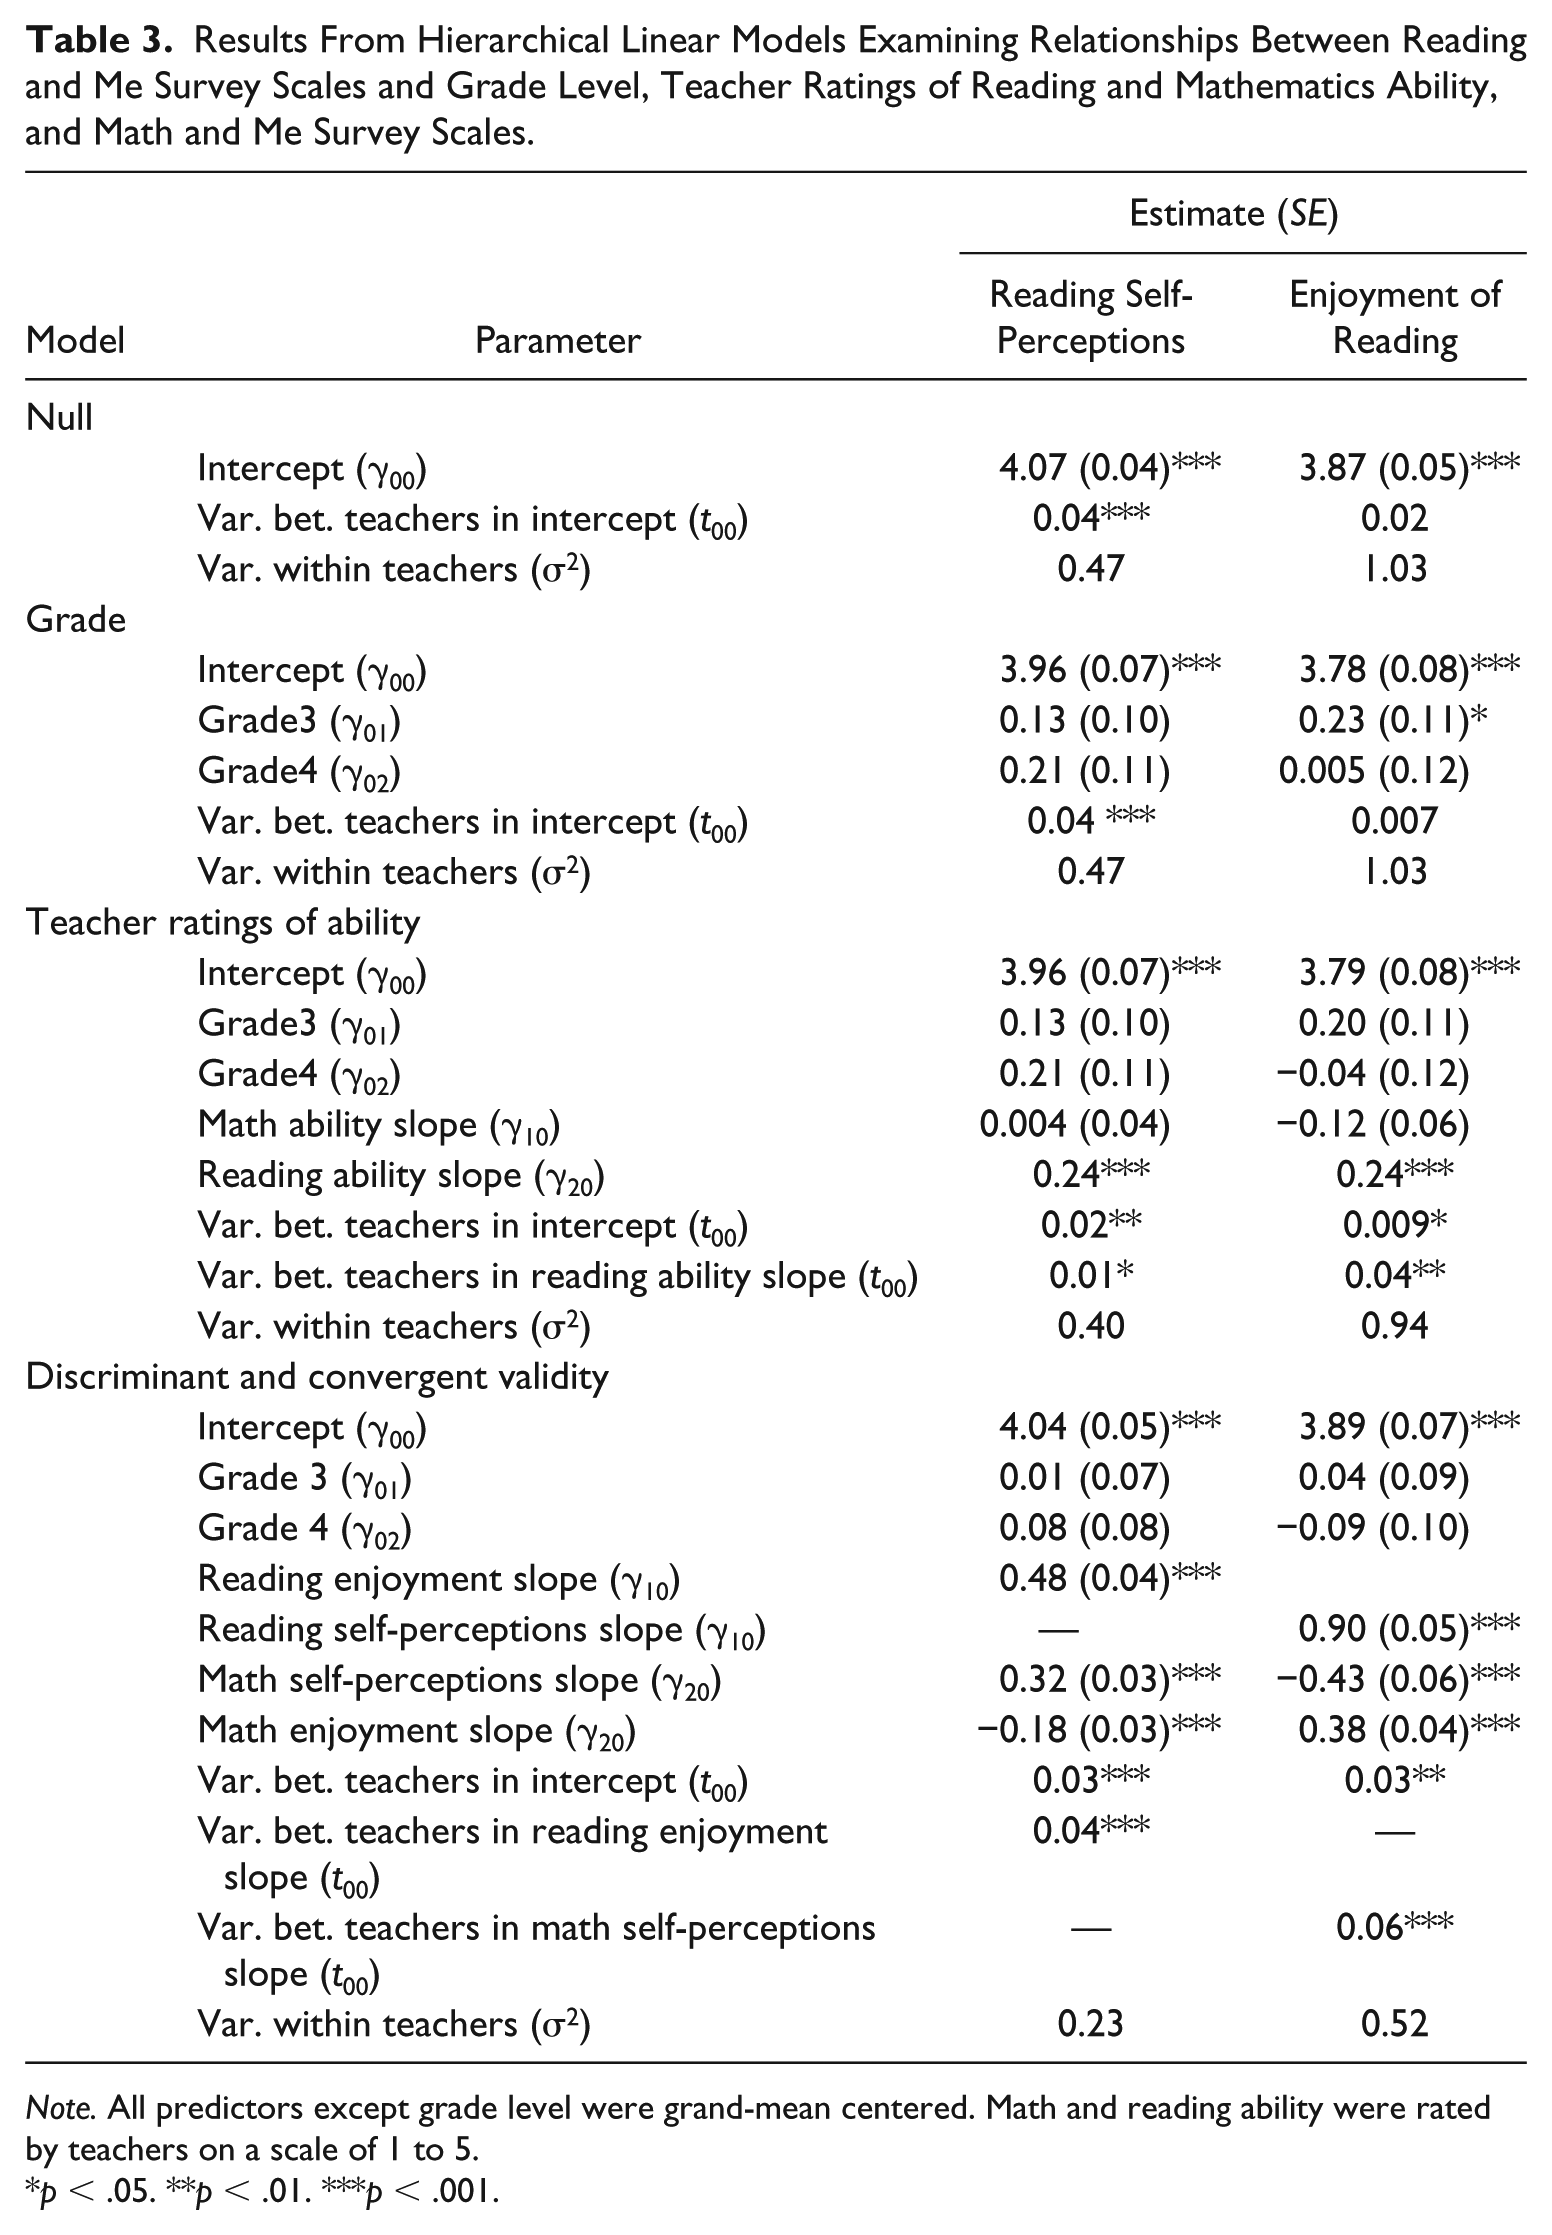
Note. All predictors except grade level were grand-mean centered. Math and reading ability were rated by teachers on a scale of 1 to 5.
p < .05. **p < .01. ***p < .001.
We next estimated a model examining the relationship of teacher-rated ability in mathematics and reading with Reading Self-Perceptions (controlling for grade level). As expected, there was no relationship between teacher rating of mathematics ability and students reading self-perceptions (γ10 = 0.004, p = .92), which is an indication of discriminant validity. On the contrary, there was a relationship between teacher rating of reading ability and students Reading Self-Perceptions (γ20 = 0.21, p < .001). In fact, reading ability (as rated by teachers) explained 21% of the variance between teachers and 8% of the variance between students within teachers in Reading Self-Perceptions, above and beyond grade level and mathematics ability.
Finally, to examine convergent and discriminant validity, we included Enjoyment of Reading, Mathematical Self-Perceptions, and Enjoyment of Mathematics as predictors of Reading Self-Perceptions (controlling for grade level). As expected, given that Enjoyment of Reading is measuring a construct in the same domain, it was most highly related to Reading Self-Perceptions (γ10 = 0.48, p < .001). In fact, Enjoyment of Reading explains 50% of the variability between students in Reading Self-Perceptions, above and beyond grade level, and the Mathematical Self-Perceptions and Enjoyment scores. As expected, given that Mathematical Self-Perceptions also measures academic self-perceptions, it also was positively related to Reading Self-Perceptions (γ20 = 0.32, p < .001). Mathematical Self-Perceptions explains 14% of the variability between students in Reading Self-Perceptions, above and beyond grade level, and enjoyment of reading and mathematics. Finally, as expected, given it measures a different domain and construct, the smallest relationship was with Enjoyment of Mathematics, and in fact, Reading Self-Perceptions and Enjoyment of Mathematics had a small negative relationship (γ30 = −0.18, p < .001), with Enjoyment of Mathematics explaining only 6% of the between-student variability in Reading Self-Perceptions above and beyond grade level, enjoyment of reading, and self-perceptions in mathematics.
Enjoyment of Reading Results
First, we ran an unconditional (null) model. The ICC was .02. This was markedly different than the ICC found for Enjoyment of Mathematics previously (.15; Adelson & McCoach, 2011) as well as with this sample (.12) and less than the ICC for Reading Self-Perceptions with this sample (.09). In fact, enjoyment of reading did not vary between classes. To be consistent with the analyses of Reading Self-Perceptions and to account for the small degree of homogeneity within classes (Roberts, 2007), we continued with a HLM and did not fix the intercept variance. The average Enjoyment of Reading score was 3.87.
Next, we estimated a model examining whether Enjoyment of Reading differed by grade level. As indicated in Table 3, like with the M&MS (Adelson & McCoach, 2011), we found that younger students reported greater enjoyment. Although there was no difference in Enjoyment of Reading scores for fourth and fifth graders (γ02 = 0.005, p = .96), third graders had statistically significantly higher scores (γ01 = 0.23, p = .04). In fact, grade level explained 63% of what little variability there was between classes.
We next estimated a model examining the relationship of teacher-rated ability in mathematics and reading with in Enjoyment of Reading (controlling for grade level). As expected, there was a positive relationship between teacher-rated reading ability and Enjoyment of Reading (γ20 = 0.24, p < .001). In fact, reading ability (as rated by teachers) explained 29% of the variance between teachers and 7% of the variance between students within teachers in Enjoyment of Reading, above and beyond grade level and mathematics ability. On the contrary, we did not find a relationship between Enjoyment of Reading and teacher-rated mathematics ability (γ10 = −0.12, p = .06).
Finally, to examine convergent and discriminant validity, we included Reading Self-Perceptions, Mathematical Self-Perceptions, and Enjoyment of Mathematics as predictors of Enjoyment of Reading (controlling for grade level). As expected, given that Reading Self-Perceptions is measuring a construct in the same domain, it was most highly related to Enjoyment of Reading (γ10 = 0.90, p < .001). In fact, Enjoyment of Reading explains 41% of the variability between students in Enjoyment of Reading, above and beyond grade level, and the mathematical self-perceptions and enjoyment scores. As expected, given that Enjoyment of Mathematics also measures academic enjoyment, it also was positively related to Enjoyment of Reading (γ30 = 0.38, p < .001). Enjoyment of Mathematics explains 32% of the variability between students in Enjoyment of Reading, above and beyond grade level, and self-perceptions in reading and mathematics. Finally, there was a negative relationship between Enjoyment of Reading and Mathematical Self-Perceptions (γ20 = −0.43, p < .001), explaining only 9% of the between-student variability in Enjoyment of Reading above and beyond grade level, self-perceptions in reading, and enjoyment of mathematics.
Implications, Limitations, and Recommendations for Future Research
Researchers in multiple fields, including education, educational psychology, and school counseling, are interested in students’ attitudes toward reading, particularly their reading self-perceptions and their enjoyment of reading. These constructs are particularly important when studying the effects of new curriculum and school reform and in evaluating how and why subgroups differ. Given the relationship between both self-perceptions and enjoyment with academic achievement, having an instrument that assesses these attitudes toward reading is useful to assessing psychosocial aspects of students and may lead to advances in the development or understanding of academic talent. The R&MS is a tool with strong reliability and validity evidence that can contribute to the empirical and theoretical base on reading attitudes in younger students. Because of its developmentally appropriate vocabulary, its applicability across contexts, its brevity, and its parallel format to the M&MS, in addition to its established psychometric properties, it is hoped that R&MS will be a useful tool for researchers studying students in Grades 3 to 5.
The R&MS also may be a useful instrument for educators including teachers, reading specialists, and media specialists as well as school counselors. With only 22 items, the instrument is relatively short and easy to administer with minimal time commitment. Classroom teachers may find it useful to administer R&MS at the beginning of the year as a way to learn more about their students’ self-perceptions in and enjoyment of reading. Throughout the year, teachers might administer the R&MS again to see how their classroom environment and instruction is affecting students. For instance, after implementing book clubs, using a new textbook, or engaging students in a poetry unit, teachers might want to see how student attitudes have changed. School counselors working with students who are underachieving may wish to use the R&MS to identify whether they enjoy reading and whether they think they have the ability to read and to understand what they read as interventions may need to target attitudes, not just achievement, particularly given that among students at risk for failure in reading, particularly for girls, self-beliefs strongly correlate with reading ability (Fives et al., 2014) and among struggling adolescent readers, students who enjoy reading are more likely to spend time engaged in reading (Neugebauer, 2014). For students moving into a more challenging environment, the R&MS might be a tool to look at the Big-Fish–Little-Pond effect (Marsh, 1987) and how student self-perceptions are affected when they are with a different peer group. In addition, the R&MS might be a tool for identifying potential sources for behavioral problems in the classroom, including in other subjects given that reading typically is integrated into all subject areas. Finally, principals and other administrators might choose to use the R&MS as a measure of school climate, particularly as a formative tool at the beginning of the year or as a measure of change when implementing school-wide initiatives.
Although this study did collect data across rural and urban school districts, the sample is limited to those students who returned parental permission to participate in the study. In addition, the current study relied on student self-report for race/ethnicity data. As we administered the surveys, we found out that many students in these grades did not know their race/ethnicity, so future validation of the R&MS should collect another source of race/ethnicity data to ensure the psychometric properties hold across groups. Finally, although the M&MS is validated with third through sixth graders, which allows examination of these constructs across the transition to middle school, this study only validated the R&MS with third through fifth graders, so additional validation with older students should be conducted.
The analyses in this article provided evidence of internally consistent scores and adequate content, construct, and external validity. These studies would benefit from replication with additional samples. Furthermore, although scores on both scales exhibited strong internal consistency, additional types of reliability should be examined, particularly whether scores on these constructs are stable over time. Similarly, although we examined external and discriminant validity, we had limited external variables and no true criterion measures. Future research should include other measures, including other measures of ability and achievement besides teacher ratings, for which we were unable to attain any evidence of reliability or validity. Finally, with the validation data collection to date, we are unable to recommend specific cut points that would identify students as “at risk” in reading attitudes, and future research might provide more insight into how students exhibiting attitudes along the continuum measured by the instrument respond to intervention. To further support the use of R&MS in research and practice, additional validity evidence could be gathered.
Given the strength of the reliability and validity evidence that we presented, the R&MS can be used to research intermediate elementary students’ self-perceptions in and enjoyment of reading. For instance, researchers can use the R&MS to investigate how enjoyment of reading and reading self-perceptions influence later achievement, overall school attitudes and attitudes in other subject areas, underachievement, and more. Given the prevalence of both achievement and excellence gaps, researchers could use the R&MS to examine how these attitudes differ across subgroups, such as gender, ethnicity, socioeconomic status, and exceptionalities, at this early age. As with the M&MS, we made an effort not to focus on comparisons with peers so that the R&MS might be used with homogeneously or heterogeneously ability-grouped students, thus allowing investigation of the Big-Fish–Little-Pond Effect. Finally, the ICCs present some interesting questions, particularly for Enjoyment of Reading. The fact that there is very little homogeneity within classes for Enjoyment of Reading compared with Reading Self-Perceptions, Enjoyment of Mathematics, or Mathematical Self-Perceptions leads to the question of classroom effects as well as to how family environment and student characteristics might affect students’ enjoyment of reading. Research of this nature could contribute not only to classroom practices but also to parenting decisions and might be another point for consideration for school counselors.
Footnotes
Acknowledgements
The authors would like to thank Brittany Crawford for her editorial assistance with this manuscript.
Declaraion of Conflicting Interests
The authors declared no potential conflicts of interest with respect to the research, authorship, and/or publication of this article.
Funding
The authors received no financial support for the research, authorship, and/or publication of this article.