




Abstract
A research team consisting of educators of gifted students, a scientist, and experts in measurement developed a performance-based assessment of life science skills and abilities. Four high schools in the Southwestern United States were the settings for field testing and implementation. Five levels of ratings were given: unknown, maybe, probably, definitely, and wow. The majority of student scores were in the maybe and probably categories. Using six new measures (concept maps in life and physical science, math problem solving, spatial analytical performance assessment, life science performance assessment and physical science performance assessment), 23 students (M2) were selected for participation in science laboratories at an R1 university along with 20 students (M1) selected by conventional means. When the nine attribute scores of the performance-based assessment were compared, no significant difference was found t(41), p > .38, between M1 and M2 students. Performance-based assessments in science, technology, engineering, and mathematics (STEM) will provide an alternative and a complement to standard achievement tests. They have the potential to identify and nurture exceptionally talented high school students across all demographic groups.
Keywords
The complexities and challenges in our world have increased, and creative minds in science, technology, engineering, and mathematics (STEM) are important to solve our world’s problems. “Science education is crucial for boosting a more critical and democratic citizenship able to deal with current complex socio-environmental challenges in responsible ways” (Heras & Ruiz-Mallén, 2017, p. 2482). Problems the earth experiences such as ocean acidification and pollution can be stopped or reversed only by creative problem solvers in different fields. In education, engaging students in science topics, employing higher level thinking skills in science curricula, and preparing students to become creative problem solvers are goals of science education reformers (DeHaan, 2009). However, ways to promote creative problem solving in science are not broadly known or used (DeHaan, 2009).
Scientists in the United States have called for a sustained effort to develop STEM innovators (National Science Board [NSB], 2010). One of their most important recommendations was to identify and nurture a variety of talents across all demographic groups of students. Although improvements have been seen in academic gaps between demographic groups, disparities by race, ethnicity, and gender in test scores, degree attainment, and employment still exist (Gonzalez & Kuenzi, 2012). Researchers agree that these gaps still exist in science achievement (Bacharach et al., 2003; Kohlhaas et al., 2010; Miller, 2004; Plucker et al., 2010; Quinn & Cooc, 2015).
Economic Factors
The differences in culture and ethnicity are not the only factors that have contributed to academic achievement gaps. The variance of socioeconomic status (SES) levels has had a vital role in students’ achievement (Duncan & Murnane, 2014). Parents from high and middle SES levels have tended to spend more money on enrichment activities and educational services than have low SES parents. They also have spent more time on their children’s education than parents of low SES children (Oakes et al., 2013). The decrease in yearly income of low SES families has reduced the probability that their children can participate in extracurricular or other educational activities that cost money. In contrast, the annual income of high and middle SES families has increased since the 1970s (Duncan & Murnane, 2014). For these reasons, development of an assessment appropriate for students from low SES levels is important.
Science educators recognize the limitations of conventional methods. Most researchers measure student abilities by using intelligence tests such as the Scholastic Aptitude Test (SAT) and achievement using state tests, which include mainly items measuring memory and analytical abilities (Sternberg, 2010). Another conventional method is grade point average (GPA). A number of researchers have found that when achievement tests and grades are used for identifying exceptional talent, the diversity of students recognized is limited (Clasen et al., 1994; Ford, 1998, 2006; Ford & Whiting, 2006; McCoach & Siegle, 2003; Van Tassel-Baska, 2002). Students of color often have lower scores than White students on multiple-choice tests (Klein et al., 1997). In addition, researchers have found that on almost every measure of achievement (grades, GPA, class rank, National Assessment of Educational Progress [NAEP], nationally standardized achievement tests, and state achievement tests), African Americans, Hispanics, and American Indians were “severely underrepresented” among the top 1%, 5%, and 10% (Miller, 2004; Plucker et al., 2010).
Important for this discussion is that other assessments provide information that multiple-choice tests do not provide (American Association for the Advancement of Science, 2017), such as information about students’ problem solving and creative thinking (Maker, 2020a). From this perspective, if one examines the types of problems to be solved in multiple-choice tests (Getzels & Csikszentmihalyi, 1967, 1976; Maker & Schiever, 2005, 2010), multiple-choice tests have only closed problem types with no creative problem-solving component. They are typified by clearly defined problems, specified methods, and right answers. Assessments that include semiopen and open-ended problem types will enable the assessment of creativity (Maker & Schiever, 2010), which several researchers have found will increase the possibility of discovering exceptional talent in students of color and low-income students (Guignard et al., 2016; Sarouphim, 2001, 2002; Sarouphim & Maker, 2010; Sternberg, 2010).
Performance-Based Assessments
Woolfolk (2013) defined performance-based assessments as any form of assessment in which students do activities and produce products to evaluate their higher level thinking abilities. Performance-based assessments have been considered a method for narrowing the differences in scores among diverse cultural and economic groups because students can show their understanding of scientific principles and their ability to create solutions during hands-on activities (Klein et al., 1997; Neill & Medina, 1989). This type of assessment enables a holistic evaluation of the performance of an individual student in the life sciences. Therefore, we developed a performance-based assessment to measure the skills and abilities of students in the life sciences.
Methods such as performance-based assessments that include creativity have been used to compare abilities across ethnic and economic groups and have been studied and found to be successful, but are not generally used to identify exceptional talent (Sternberg, 2010). Several educators have found that inclusion of creativity decreases the gap in scores (Guignard et al., 2016; Sarouphim, 2001, 2002; Sarouphim & Maker, 2010; Sternberg, 2010). For example, during the development of the Discovering Intellectual Strengths and Capabilities while Observing Varied Ethnic Responses (DISCOVER) project, no significant differences were found in creative problem solving and the percentage of students identified as gifted among different cultural groups and economic levels at all grade levels, K to 12, when a performance-based assessment that included creative problem solving was used to identify exceptionally talented students (Maker, 2020a; Sarouphim, 2001, 2002; Sarouphim & Maker, 2010). For example, at the high school level, in a study including Hispanic, American Indian, and White students, no significant differences were found in the percentages of females or members of different cultural groups, χ2(2, N = 89) = 2.89, p = .066, identified as gifted. The percentages of identified participants “… were mostly in proportion to their ethnic distribution in the sample” (Sarouphim, 2002, p. 36). Performance-based assessments have been more effective than multiple-choice achievement tests in measuring higher level thinking skills such as applying, evaluating, and synthesizing information to solve complex problems (Dikli, 2003; The National Center for Fair and Open Testing, 2007, 2012; Resnick & Resnick, 1992).
Factors such as motivation, effort, and creativity are not included in traditional methods of assessment (Maker, 1996, 2005, 2020a; Renzulli, 1978). Motivation or task commitment is a focused form of motivation (Renzulli, 1986) and a component of creativity (Amabile, 1996). Although long-term motivation and task commitment cannot be observed during a performance-based assessment (Renzulli, 1978; Sternberg, 1999), task motivation can be. In a performance-based assessment, observers can see indicators of motivation such as involved in task, continuously working, does not want to quit even when others have finished, and verbalizes enjoyment of task (Maker, 2005).
Developing the Life Science Performance-Based Assessment
To develop the new assessments, a research team was created. An education researcher with experience in developing K–12 performance-based assessments; a scientist versed in ecology and problem-based learning (PBL); a K–12 teacher with 35 years’ experience in classrooms, education of exceptionally talented students, and development of performance-based assessments; and a postdoctorate fellow with experience in science teaching and assessment formed the core of the assessment development team. Several graduate students in education of gifted students also were involved in developing the assessment. Two measures of life science abilities were developed by the research team: (a) a life science (performance based) assessment that was a measure of a student’s knowledge from their interactions with their surroundings and their life experiences (first-order knowledge as defined by Gardner, 1992) and (b) a concept map (paper-and-pencil task) assessment that measured what students learn in school (mainly second-order knowledge as defined by Gardner; Maker & Zimmerman, 2020). In this article, we present the development, field testing, implementation, and results of implementing the life science performance-based assessment.
Creative Problem Solving in Life Science
Creativity in a domain such as life science has three components (Amabile, 1983, 1996, 2013), domain-relevant skills and abilities, creativity-relevant processes, and task motivation. Domain-relevant skills and abilities are foundations for performance in a given domain, which has three components: (a) innate cognitive abilities, (b) innate perceptual and motor skills, and (c) formal and informal education. Intellectual and personal characteristics of creative individuals are reflected in creativity-relevant processes. For example, training, experience in idea generation, and personality characteristics are important. Task motivation, the desire to solve a problem or accomplish a task, can be both internal and external (from the environment and the people in it).
The need to include the strengths and creative abilities of students of color has increased because the demographics of the student population in the United States has changed over the years (Carter & Darling-Hammond, 2016). For example, the percentage of students of color has increased from 22% in 1972 to 43% in 2007. By 2050, almost 50% of young people below the age of 18 will be students of color (Carter & Darling-Hammond, 2016). Because of this demographic change, more talented and creative young people will be overlooked if grades and standardized, multiple-choice achievement tests are the only measures used to select exceptionally talented students in STEM.
Conceptual Framework
Problem Solving
Problem solving has been considered one of the basic human cognitive processes (Wang & Chiew, 2010). The importance of learning how to solve any problem comes from the fact that individuals are exposed to a variety of challenges and circumstances about which they need to make decisions. In the school setting, posing problems to solve is a way for teachers to help students apply information they have learned about a specific concept instead of simply recalling information (Elvan et al., 2010). Different explanations of problem solving have been proposed. For example, in the theory of multiple intelligences, Gardner (1983) defined intelligence as the ability to solve problems and the ability to find or create problems. Sternberg (1985, 2005) described problem solving as involving metacomponents, performance components, and knowledge acquisition. In the Prism Model (Maker et al., 2015; Maker & Anuruthwong, 2003), problem solving was seen as the “impetus” or stimulant for general capacities and specific abilities to be expressed.
Creative problem-solving is a key component of the DISCOVER project in which observers document the students’ problem-solving processes in different domains (Maker et al., 2015; Sarouphim & Maker, 2010) and provide profiles and recommendations for developing students’ problem-solving strengths (Pease et al., 2020). By focusing on problem solving in an assessment, the procedures are aligned more closely with the curriculum.
Problem solving was incorporated into a classroom community awareness unit for sixth-grade American Indian students (Reinoso, 2011). Students showed enthusiasm and involvement in developing realistic solutions to a community problem that affected all of them. They gained valuable skills in language arts, science, math, and technology; applied these skills and concepts in an integrated way; and exercised their creative problem-solving abilities to propose innovative solutions to persistent problems. The teacher said, Most importantly, perhaps, they now have a clear understanding of the fact that what they learn in school will be valuable to them now and in the future regardless of the careers they choose or the circumstances of their daily lives. (Reinoso, 2011, p. 299)
Theories
The life science assessments were developed based on the following theories and research: (a) the need for authentic tasks in creativity assessment (Milgram & Hong, 1993), (b) multiple intelligences (Gardner, 1983, 1999), (c) successful intelligence (Sternberg, 1985), (d) the prism of learning (Maker & Anuruthwong, 2003; Maker et al., 2015), and (e) research on the social science of creativity (Amabile, 1996, 2013). The assessments also were developed as an extension of Maker and colleagues’ personal experiences with performance assessments, especially DISCOVER, and research conducted over a period of more than 25 years (Maker, 2005; Nielson, 1994; Sarouphim, 2001, 2002; Sarouphim & Maker, 2010).
Authentic tasks
An important aspect of assessment of creativity within domains is the relationship between the tasks presented to students and the problems solved in real-life contexts (Milgram & Hong, 1993). Scores on tests and indicators of creativity were good predictors of adult creative accomplishments across several domains (Milgram & Hong, 1993). The life science assessment tasks were comparable with what life scientists (ecologists, entomologists, taxonomists, botanists, and other life scientists) do: They examine, classify, and investigate life on earth. The life science assessment was developed to enable observers to see the students’ problem-solving ability, how they made inferences, how they organized natural objects (flowers and insects), and how they presented the interdependencies, interactions, and connections among natural phenomena by making an ecosystem of their own choice. These are the skills and tasks of life scientists when they examine real-world phenomena and relationships among organisms.
Multiple intelligences
One of the eight domains described by Gardner was the naturalist, which is the domain related to life science (Gardner, 1999). The core competencies he identified for the naturalist domain provided important guidance for development of the life science assessment because they are competences of life scientists: (a) observation through the five senses; (b) classifying, identifying, and collecting data in both natural and man-made environments; (c) keen observation; (d) intuitive understanding of, or interest in, the natural world; (e) accurate perception of the character of shapes, forms, and texture; and (f) comparison of the different characteristics of different species (Gardner, 1999).
Theory of successful intelligence
Sternberg’s (1997, 2005) theory includes three types of intelligence: (a) analytical, which allows a person to process information effectively and think abstractly; (b) creative, which allows a person to come up with new ideas; and (c) practical, which allows a person to find feasible solutions to real problems. Sternberg posited that certain core capacities such as memory, metacognition, and reasoning cut across different domains of intelligence, and that many core capacities were specific to the domains. He recommended that all three types be included in any analysis of intelligence. He also defined intelligence as “developing expertise,” emphasizing that intelligence is not fixed, but that it develops over time as an individual learns and incorporates this learning into her or his knowledge structure (Sternberg, 1999).
Social science of creativity
Consistent with Sternberg’s theories is Amabile’s (1996, 2013) work on creativity, in which she has found that three components are necessary for creativity to be expressed: domain-specific skills and abilities, creativity-relevant processes that cut across domains, and task motivation or passion for the task or the problem being solved.
Prism of learning
Maker and Anuruthwong (2003, in Maker et al., 2015) developed the prism of learning, which shows how problem solving and the aspects of learning situations are related to the development and expression of gifts, talents, and creativity through different human abilities. They integrated their previous experiences with the theories and research of Amabile (1996, 2013), Gardner (1983, 1999), and Sternberg (1997, 1999, 2005). Scientific ability in the prism of learning provided the definition for the domain of life science: “Scientific/Naturalistic abilities include observing, identifying, describing, classifying, studying, and explaining natural phenomena” (Maker et al., 2015, p. 92).
Assessing Problem Solving
Although problem solving is a key concept in several theories, an operational definition of problem solving was necessary. When developing the performance-based life science assessment, the research team used the problem continuum proposed by Getzels and Csikszentmihalyi (1967, 1976), modified by Maker and Schiever (2005, 2010), and presented by Maker and Anuruthwong (2003, in Maker et al., 2015) as the framework. In the problem continuum, problems range from closed to open ended, and solvers can create possible solutions to a problem based on information they have. For example, in the closed type, the solver is given only the problem and the method to solve it, so the solver’s only task is to generate the one correct solution to the problem. In open-ended problems, the solver defines or chooses a problem, decides on a method to solve it, and creates a solution. No correct solution is specified or expected. The first type (closed) is designed to assess knowledge and skills through convergent thinking, and the last type (open ended) is designed to assess creativity and productive thinking. The semiopen problems, between the two ends of the continuum, have elements of both types of knowledge and thinking skills, including creative thinking (Maker, 2020a). The initial life science assessment tasks included a closed problem (cut flower exploration), a semiopen problem (classifying flowers or insects), and an open-ended problem (creating an ecosystem).
First- and Second-Order Knowledge
First-order knowledge (knowledge gained from experience) and second-order knowledge (knowledge developed in school; Gardner, 1992) were part of the conceptual framework when developing and implementing all of the new assessments. The life science assessment involved hands-on tasks to measure first-order knowledge that is important in the work of ecologists, botanists, taxonomists, and other life scientists: life science abilities as described by Gardner (1999) as the naturalist, and the scientific abilities in the Prism Model (i.e., description of flower, sorting of flowers or insects, and ecosystem design). Performance-based assessments are appropriate methods to measure first-order knowledge and often are more engaging than paper-and-pencil assessments. More detailed information about the conceptual framework of the assessments can be found in another publication, Maker (2020a).
Development, Field Testing, and Revision
The assessment was developed through an iterative process similar to that described by Ruiz-Primo (2009) that was modified from the assessment square proposed by Ruiz-Primo and colleagues (Ruiz-Primo, 2003, 2007; Shavelson et al., 2002). The assessment square had four components, one at each corner: construct, observation, assessment, and interpretation. Using conceptual, logical, and empirical analysis, the model was used to develop and validate the life science assessment (Ruiz-Primo et al., 2001; Yin, 2005). An in-depth explanation of this process is included in another publication (Maker, 2020a). Each task was designed to (a) be authentic, (b) assess different types of problem solving, (c) include core competencies of the ability being assessed, (d) be engaging and developmentally appropriate, (e) include first-order knowledge, and (f) elicit observable behaviors that demonstrate different levels of ability and task motivation.
Method
The life science assessment was created by the research team as part of the Cultivating Diverse Talent in STEM (CDTIS) project. Our goal was to identify and cultivate exceptional talent in STEM based on a new definition: Exceptional talent in STEM has two essential components: (a) a highly integrated and interconnected knowledge structure and (b) the ability and willingness to solve a variety of types of problems, from well-structured and known to ill-structured and novel, in STEM in the most effective, efficient, original, or economical ways (Maker, 2020a).
The project was a collaboration between (a) faculty members at an R1 University in the Southwestern United States and (b) educators from four schools: two public schools, one charter school, and one Bureau of Indian Affairs grant school. Six assessments were included in the identification of students with exceptional talent in STEM: (a) math problem solving (Bahar & Maker, 2020), (b) spatial analytical performance assessment (Maker, 2020b), (c) physics concept maps (Maker & Zimmerman, 2020), (d) mechanical–technical performance assessment (Alfaiz et al., 2020), (e) life science concept maps (Maker & Zimmerman, 2020), and (f) the life science performance assessment. These six assessments were in three domains, math, physical sciences, and life sciences, and were measures of students’ domain-specific skills and abilities, creativity-relevant processes, and task motivation (Amabile, 2013).
Development
State Science Standards for grades 9 to 12 provided the framework for the development of the life science assessment tasks. Specifically, the research team addressed the concepts and problem-solving activities from the life science and the science in personal and social perspectives strand, “Changes in the Environment” section. This section included scientific thinking appropriate for high school students: (a) analyzing the relationships among various organisms and their environments, (b) evaluating how the processes of natural ecosystems interact, and (c) explaining how natural ecosystems are affected by humans.
Four tasks were designed to assess the scientific abilities defined in the Prism Model: three problem types ranging from closed to semiopen and open, and first-order knowledge. The first task was a 2-min warm-up, using a cut flower, to stimulate memory of life science concepts. Each observer held up a flower and asked the students at his or her table to examine the flower and describe what characteristics of the flower they noticed.
The second task was to examine a cut flower for 10 min. It was a closed problem type to assess keen observation and perception of the character of shapes, forms, and texture. The observers gave the students instructions about how to inspect the flower and note its characteristics. They could dissect the flower to examine its parts. Magnifying glasses were provided for closer examination of the flower. When students completed the task, they were asked “What did you notice?” After they answered this question, they were asked “What else did you notice?” Their responses were audio recorded.
The third task was to group flowers according to the similarity of their characteristics. It was a semiopen problem type to assess competencies of scientists: (a) accurate perception of characteristics of shape and form and (b) comparison of the different characteristics of different species (Gardner, 1999). The flower sort consisted of 18 numbered picture cards. The flowers were native to the local area, the Southwestern United States, and the pictures selected showed the characteristics of the flower and the attributes of the leaves and stems (Figure 1). The observer instructed students to put the cards together in groups based on their similarities, and to record the number on the cards they decided were similar in some way in a circle on a worksheet, starting with Group A (Figure 2). Students made as many groupings as they wanted to and used the cards as many times as needed. Additional worksheets were available. The worksheets had a box above each circle where the students wrote a name or names for each group. When students were finished, they were interviewed individually and asked “How are the flowers in group [A] alike?” The response was audio recorded and written notes were taken. After students described Group A, they continued with the next group. The process was repeated for each of the groups until the student described all the groups. Thirty-five minutes were allotted for this task.

Examples of flower picture cards used in the life science assessment activity.

Worksheet to classify flowers or insects.
The fourth task was an open-ended problem type in which students examined 18 insect pictures. The students organized the insects in a large circle on one piece of paper rather than as in Task 3. Insect pictures were downloaded from the internet, occurred in or were similar to species found in the Southwestern United States, and demonstrated the diversity in morphology and structure of insects (Figure 3). Students examined the characteristics of the insects and described their relationship to other insects by putting similar insects together and then showing the relationship to other groups. The purpose of this task was to assess the following competencies: (a) accurate perception of characteristics of an organism’s shape and form, (b) comparison of the different characteristics of different species, and (c) intuitive understanding of the natural world (Gardner, 1999). Scientific abilities included in the Prism Model (e.g., observing, identifying, describing, classifying, and explaining natural phenomena; Maker et al., 2015) also were assessed with this activity. Thirty-five minutes were allotted for this task.

Examples of insect picture cards used in the life science assessment activity.
Detailed instructions were developed so the observers could follow a stepwise method of implementing the cut flower and flower sort task. A worksheet was developed that had a comprehensive list of student behaviors to observe as they carried out the task: motivation (e.g., involved in task, continuously working, showed enjoyment) and problem solving (e.g., organized materials). The observer also had a list of plant characteristics and important plant structures (e.g., narrow petals, shape and size, toothed leaves) that could be checked during the interview with the students and when listening to the audio recording.
Four observers were involved in the field test. Students, in groups of three to five, sat around a table with one observer. Having small groups of students with one adult was part of the learning environment so the assessment was similar to a classroom situation; students worked individually and explained their results individually to an observer.
Field Testing and Revision
Participants
Field tests were conducted 4 times at four partner high schools over a period of 1 month. Sixty-two high school seniors participated in the assessment. They and their parents signed institutional review board–approved assent and consent forms that included an explanation of the assessment. The number of students in these schools ranged from 94 to 2,245, and more than 71% received free or reduced-price lunches. In School A, the student makeup was 83.4% Hispanic, 5.0% American Indian, 0.7% Asian, 3.7% Black, 7.0% White, and 0.3% Pacific Islander. In Schools B and C, all students were American Indian, and in School D, 97% of the students were American Indian and 3% were White. The schools were located in poverty areas with an unemployment rate that ranged from 7.7% to 45.8%.
Field Test 1
The flower exploration, flower sort, and insect task were included in Field Test 1 (Table 1). The assessment was conducted at School B with 18 seniors. At the beginning of the field test, the observers led the warm-up activity before introducing the flower and insect tasks.
Tasks That Were Changed After Each Field Test of the Life Science Assessment.
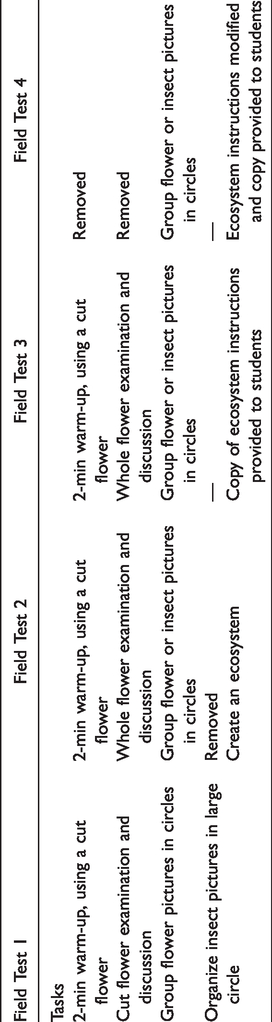
Flower examination task
Each student was given a cut flower and asked to examine its characteristics. They could cut, observe with a magnifying glass, or handle the flowers. They told the observer what they saw.
Flower grouping task
When the flower examination task was completed, students were given flower cards to sort. They were to put them into groups and record the number of the card as well as give a name to the groups.
Insect task
After the flower-sorting task, students were given the insect task, which was to put pictures of insects in a large circle and diagram the relationships among the insects in the circle. When this task was completed, the observers collected all materials.
Ecosystem task
This task was developed to assess the core competency of intuitive understanding of the natural world (Gardner, 1999), and the scientific ability of the Prism Model (Maker et al., 2015; Maker & Anuruthwong, 2003). An essential part of the natural world is interconnectedness and interdependence of living and nonliving things. The ecosystem task, an open-ended problem-solving activity, was a measure of this understanding.
For the ecosystem task, students were instructed to create an ecosystem of their choice by using a diagram, illustration, or model. Materials to construct their ecosystems were placed in the center of the table (e.g., colored pencils, clay, colored markers, pipe cleaners, paper, rocks), and each student was given a cardboard base and drawing paper placed on top of the base to build her or his ecosystem. After students completed this task, the observer took a picture of the ecosystems and asked individual students to tell about their ecosystems. Responses were audio recorded to minimize the effects of proficiency in the use of written language and to enable the observer to ask questions when responses were not clear. Fifty minutes were allowed for this activity.
Changes
The cut flower task was changed to examining a whole flower that included the root system to allow students a more realistic representation of the plant they were to describe. Students were asked “What are the characteristics of this plant and its flower(s)?” and instructed to “Name as many characteristics as you can.” The research team also decided to change the insect task because most of the students had difficulties organizing and illustrating relationships among the insects in the big circle. Also, the insect activity did not seem to measure a student’s intuitive understanding of the natural world adequately, but it did seem to measure the same competencies as the flower sort. Insects became an alternative to flowers in the grouping task; students could choose either flowers or insects to put in groups.
Field Test 2
The flower exploration, the flower and insect sort, and the ecosystem task were included in Field Test 2 (Table 1). It was conducted at School A with 20 seniors. The same procedure was used as in Field Test 1 for the warm-up activity, the whole flower observation, and the flower and insect sort. After these tasks were completed, the new task, ecosystems, was introduced. Materials were put on the table for the students to share, and observers gave instructions for creating ecosystems. After the students completed their ecosystems, the observer took a picture and asked each student to tell about his or her ecosystem. Responses were audio recorded. Fifty minutes were allowed for this activity.
Changes
The ecosystem directions were modified because observers noticed that students needed more instruction. The observers believed students would focus more on the task if they had a copy of the directions. Students were given the following instructions: (a) Create a drawing, diagram, or model of an ecosystem, including your live plant, some of your plant and insect pictures, and other living and nonliving things; (b) show how all the parts of your ecosystem interact; (c) this environment is of your own design; and (d) you can tell me about your ecosystem when you are ready.
Field Test 3
The next version of the assessment was tested at School C with 14 high school seniors. Three team members observed the assessment, one at each table. The procedures for administration of the assessment and rating of students’ products were the same as those for Field Test 2. In addition, a copy of the ecosystem directions was given to each student (Table 1).
Changes
After the third field test, the warm-up activity and the plant/flower exploration were eliminated from the assessment (Table 1). Only the flower/insect sort and ecosystem tasks remained. The reason for eliminating these tasks was that the students had difficulties identifying and classifying the structure and function of the plant and flower parts. They did not have the appropriate vocabulary and could not recognize different characteristics of the plant or flower. Most students were more concerned about the subjective characteristics of the flowers (e.g., they were dead, they were messy) than they were about the objective characteristics (e.g., plant structure and function). The observers noticed that students could demonstrate their life science abilities by sorting the flowers and insects without the warm-up and the flower and plant examination tasks. An assessment without these activities would also be more practical to administer.
The ecosystem directions were modified again to better assist the students. The directions were (a) you will create a representation of an ecosystem by using a diagram, illustration, or model; (b) you must include some of the flowers and insects on your cards and other living and nonliving things; (c) be sure to show interactions, dependent relationships, cycles, and other important aspects of ecosystems; (d) the environment is of your own design; (e) use sticky notes to label the parts of your ecosystem; and (f) I will ask you to tell me about your ecosystem when you are finished.
Field Test 4
This version of the assessment was tested with 10 seniors at School D. Three team members observed the assessment, one at each table. All administration procedures and scoring were the same as described in Field Test 3.
Scoring the Field Test Assessments
Observers used the characteristics of flowers/insects (Figure 4), to guide their scoring of students’ groupings. Each accurate grouping was given a point. The observers also scored (a) the number of groups made (fluency), (b) number of types of groups (flexibility), (c) number of details given about titles (elaboration), and (d) number of unique responses (originality). The total number of each scoring category was summed and an overall rating was given: unknown, maybe, probably, definitely, and wow. More information about this rating system is provided in a different publication (Maker, 2020a). A space for validity notes was added so observers could comment on the scientific accuracy of the groupings. To rate ecosystems, observers used the rubric in Table 2. Final scoring of the students’ performance in the field tests included a review of each student’s audio response to the observer’s questions. A description of the final scoring methods is provided in the “Rating the Assessment” part of the “Implementation” section.

Worksheet for the analysis of life science scoring.
Ecosystem Rubric Criteria for Each Level.

Note. Each higher level includes characteristics of the level below it.
Implementation
Participants
The life science assessment was conducted with students from the four partner schools and those from a variety of types of schools, all of whom were in the year of study prior to their final year in secondary school. Students who were exceptionally talented in STEM were chosen to participate in a special internship program in the laboratories of scientists on the campus of an R1 university.
Partner schools
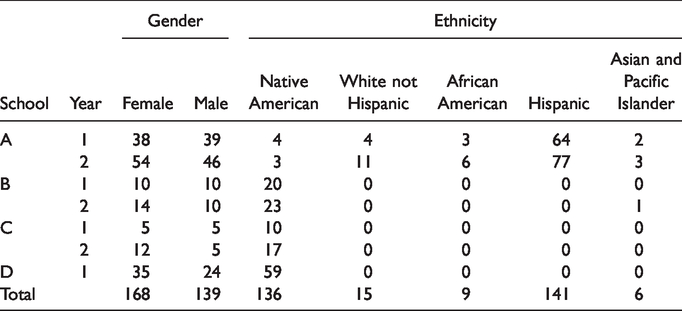
A total of 307 students from partner schools: four schools in Year 1 and three schools in Year 2 completed the life science assessment (Table 3). The distribution of the scoring was divided into two groups, School A, and Schools B, C, and D because the ethnic makeup of the students in Schools B, C, and D was similar, but different from the ethnic makeup of students in School A. Students from School D did not participate in the study in Year 2.
Number of Students From Partner Schools in the Year of Study Prior to Their Final Year in Secondary School Who Participated in the Life Science Assessment by School, Gender, and Ethnicity.
M2 group
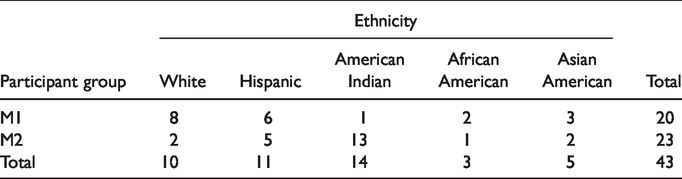
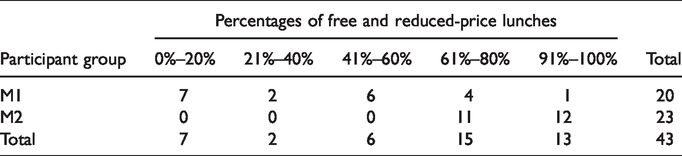
The results of the life science performance assessment were combined with the results of the other five assessments to select students (M2) who would participate in the internship program. Student performance on all assessments was considered. Students who scored definitely or wow on all assessments were selected first, then those with definitely or wow on five of the assessments, then those who scored at these levels on four of the assessments. If other placements were available, students with the highest scores in specific areas or overall were included. Twenty-three students were selected from the partner schools. American Indians students represented 56% (N = 13) and Hispanic students represented 22% (N = 5) of the students selected (Table 4). The economic data for the schools attended by M2 students are included in Table 5. The M2 students were asked whether they received free and reduced-price lunches. Ten students answered the question of which eight said “yes” and two said “no.” This was used along with school-wide data as an index of general economic level of the school communities.
Ethnicity of Students Selected by Existing Methods (M1) and New Assessments (M2).
Percentages of Students Receiving Free and Reduced-Price Lunches at Schools Attended by M1 and M2 Students.
M1 group
M1 participants came from a variety of types of schools, urban and rural, and from varied ethnic and economic backgrounds (Tables 4 and 5). Students were selected by a committee based on conventional measures of achievement: overall GPA, teacher recommendations, and student self-statements. Twenty students were selected to participate in the internship program. The majority of the students were White (N = 8) and Hispanic (N = 6; Table 4). The economic data for the schools attended by M1 students are included in Table 5. The M2 students also were asked whether they received free and reduced-price lunches. Of the nine out of 20 M1 students who provided information about free and reduced-price lunches, three said “yes” and six said “no.” This pattern was consistent with the pattern of economic data on the schools attended by M1 students and suggests that the SES level of M1 school communities was higher than M2 school communities.
Although the M1 students were selected for the summer internship program by conventional methods (overall GPA, teacher recommendations, and student self-statements), to be included in the research, they were required to participate in all six of the assessments used to select the M2 participants. Their participation did not depend on their scores on these assessments.
Description of Assessment
Life science assessment instructions
The final instructions included (a) life science observer instructions, (b) a worksheet to analyze student assessment results (Figure 4), (c) a rubric for scoring the ecosystem task (Table 2), and (d) a key for defining the criteria and a guide to key attributes of flowers and insects (Figure 4). Each is described in detail in the following sections.

Ratings of life science assessments (percent) for the insect/flower sort, ecosystems, and identification for students in partner schools.
Flower and insect sort instructions
Instructions followed a stepwise procedure including an introduction to the assessment, a description of the task, how to fill out the worksheet about flowers or insects, and reminders about how to guide the students during the assessment. Some of the important instructions were the following:
Tell students they can choose whether they would rather sort flowers or insects. Ask “Which of these flowers (or these insects) are alike in some way?” Say “Make as many groups as you can.” Tell the students, your worksheets are organized to create groupings of flowers or insects. Each picture has a number. When a group is made, write the numbers of those pictures in the first circle, Letter A, and give that group a name. Write the name of the group in the box above the circle. Walk around the table to make sure students are on task. Interview each student after completion of the task: Ask “How are the flowers (or insects) in group [A] alike?” Record response. Then, ask the student to describe the next group.
Observers had a worksheet on which they could note student responses and how the students were performing on the task. The worksheet had an observation checklist where they could note behaviors indicating motivation: (a) involved in the task, (b) continuously working, (c) persistent on difficult tasks, (d) showed enjoyment, and (e) other. They also could list problem-solving behaviors in the large open spaces. A note on the worksheet reminded the observers that if the student’s labels were lengthy and rambling, they could ask the student “How can you shorten that?” Twenty-five minutes were given for the flower and insect sort activity.
Ecosystem instructions
After the first year of implementation, observers noted that many students did not understand the ecosystem task. Therefore, before the second year of implementation, an activity that would stimulate the students’ thinking and memory to set the stage for developing ecosystems was developed. Before beginning the assessment, observers asked the students the following: (a) What are some examples of ecosystems you know? (b) What are the characteristics of these ecosystems? (c) What are some of the living and nonliving parts of an ecosystem? and (d) What are the relationships among these parts? The observer instructions included answers to the questions to help facilitate discussion. The discussion lasted 5 min.
The final instructions for the ecosystem included instructions developed after Field Test 3 with the addition of the following: When the first student has completed her or his ecosystem, interview that student. Say “Tell me about your ecosystem.” Then, ask the student “How are these parts of ecosystems related?” Fifty minutes were allotted for the ecosystem task.
Analysis of life science assessment results worksheet
After conducting the life science assessment, observers completed the sorting and ecosystem ratings worksheet for each student (Figure 4). The worksheet included a section for rating the fluency, flexibility, elaboration, and originality for the insect or flower sort. A key for defining the criteria and a guide to key attributes of flowers and insects was included. Important morphological and structural characteristics of each group that are frequently used in life science taxonomic keys for species identification were included in the worksheet to help the observers organize student results and assign student scores.
Rating the Assessment
Each observer listened to the audio recordings of students’ interviews, wrote their responses, completed their notes about each student in the group, and assigned preliminary scores for the flower or insect task and ratings for the ecosystem task. Performance on the assessment was scored using the analysis of life science assessment results worksheet (Figure 4). When all observers completed this process, they met to discuss the students’ performance and make final decisions about students’ ratings. They reached consensus on the rating to assign for each student.
Flower and insect task
The final scores for this task were based on the number of points the students received in the following areas: fluency (number of groups), flexibility (number of different types of groups), elaboration (the amount of explanation given for the similarities of items in a group), and originality (the uniqueness of the explanations or the types of groups). The final rating for each student included all four subscores, and the final ratings across the flower/insect sort were assigned by agreement among all the observers who watched students from the same school. A less subjective originality scoring method was developed and added to the section on originality. The number of times a characteristic of the flowers or insects was used by the participants to sort the flowers and insects was recorded, the frequency of each characteristic calculated, and then, the characteristics that were recorded 10% or less of the time were used as the cutoff for the new originality scores. Within this range, observers made three rankings and assigned points to each characteristic noticed by a student: If 6% to 10% of the students mentioned a certain characteristic, this answer was given 1 point; characteristics mentioned by 2% to less than 6% were given 3 points; and characteristics mentioned by less than 2% of the students were given 5 points.
Five levels of ratings were made: unknown, Maybe, probably, definitely, and wow. Students were given a rating of (a) unknown if they had no flexibility or elaboration or lacked validity in the reasons for groups (b) maybe if they had low flexibility and very few elaboration or originality scores, (c) probably if they had some elaboration and originality scores, (d) definitely if he or she had good elaboration and originality scores, and (e) wow if they had high fluency, flexibility, elaboration, and originality scores. All observers agreed on the ratings to assign.
Ecosystem task
The scoring system for ecosystems was similar to the flower and insect scoring system. However, the criteria to determine the rating levels were different (Table 2). For example, for a maybe rating, the student’s product was a habitat rather than an ecosystem. For a definitely rating, the student’s ecosystem needed to show interrelationships, but they did not need to be unique. For a wow rating, the observers considered the uniqueness in the relationships in the ecosystem. The ecosystem rubric for each level is presented in Table 2. All observers met to assign ratings for all students who were observed that day. Information students provided when they explained their ecosystems to the observers was considered when observers made ratings.
Overall scoring
To assign an overall score for the assessment, the identification ratings for the flower or insect sort and the ecosystem were combined. For instance, if one score was one rating higher than the other, the higher score was given. If the student had maybe (M) on one task and probably (P) on the other, the final score was probably (P). If the student had maybe (M) on one task and definitely (D) on the other, the final score was probably (P), a score between the two ratings. Students at each school were compared with each other, and not with students from other schools.
M1 student scoring
M1 students took the life science assessment and observers scored the results. All scoring was the same except for the method for making the final ratings of unknown, maybe, probably, definitely, and wow. Because the M1 group was small and already selected as exceptional, a different procedure was developed for comparison: Four representative examples of each of the identification ratings for the M2 flower/insect sorts were selected, and used as “markers” for the rating levels for M1 students. The same procedure was used for rating the ecosystems: Four representative ecosystem pictures, combined with interview information, were selected from the M2 records for each of the rating levels. The overall ratings of M1 students’ performance were completed in the same way as the overall ratings of the M2 students: The ratings on both the flower/insect sort and the ecosystems were combined to form a final rating of performance.
Results
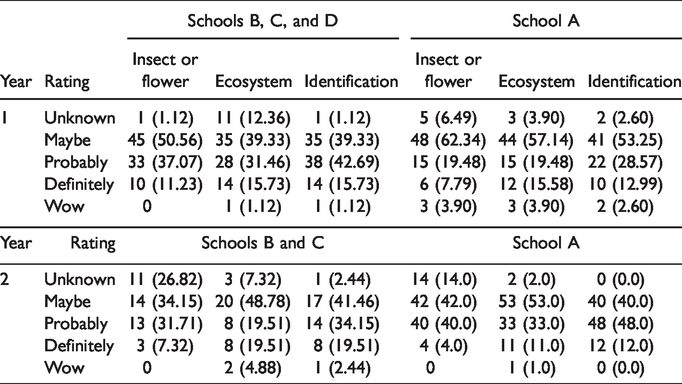
The majority of student scores were in the maybe and probably categories (Table 6). The scores of students at Schools B and C were closer to the probably rating during Year 2, which could have been due to the absence of School D. The student ratings of unknown and wow were lower than the other ratings, except for the insect/flower sort in Year 2 when the number of unknown ratings was higher than the number of definitely ratings. The changes made in Year 2 of the ecosystem activity did not appreciably change the percentages of definitely and wow rankings. They were 7.5% higher at Schools B and C in Year 2 compared with Year 1, and 7.4% lower at School A. Figure 5 shows graphically the ratings of the life science assessments (insect/flower sort, ecosystems, and identification) for students from partner schools.
Ratings of Life Science Assessments (Number and Percent of Total) for the Insect/Flower Sort, Ecosystems, and Identification.
Examples of student ecosystems are presented in Figures 6 to 8. The student’s ecosystem in Figure 6 was rated as unknown because the student presented a minimal description of the parts and did not show any interconnection or interdependence of its components (Table 2). The student’s interview with the observer indicated that the student did not have a full understanding of an ecosystem. The student’s ecosystem in Figure 7 was rated probably because the student presented some elements of the ecosystem, included living and nonliving things, and connected different parts. During the interview, the student demonstrated a basic understanding of an ecosystem. In the wow example (Figure 8), the student presented the ecosystem in a unique way, using models, a picture from the flower/insect sort, and drawings. The written explanation was accurate, and the interview was detailed and showed a full understanding of the complexity of an ecosystem (Table 2).
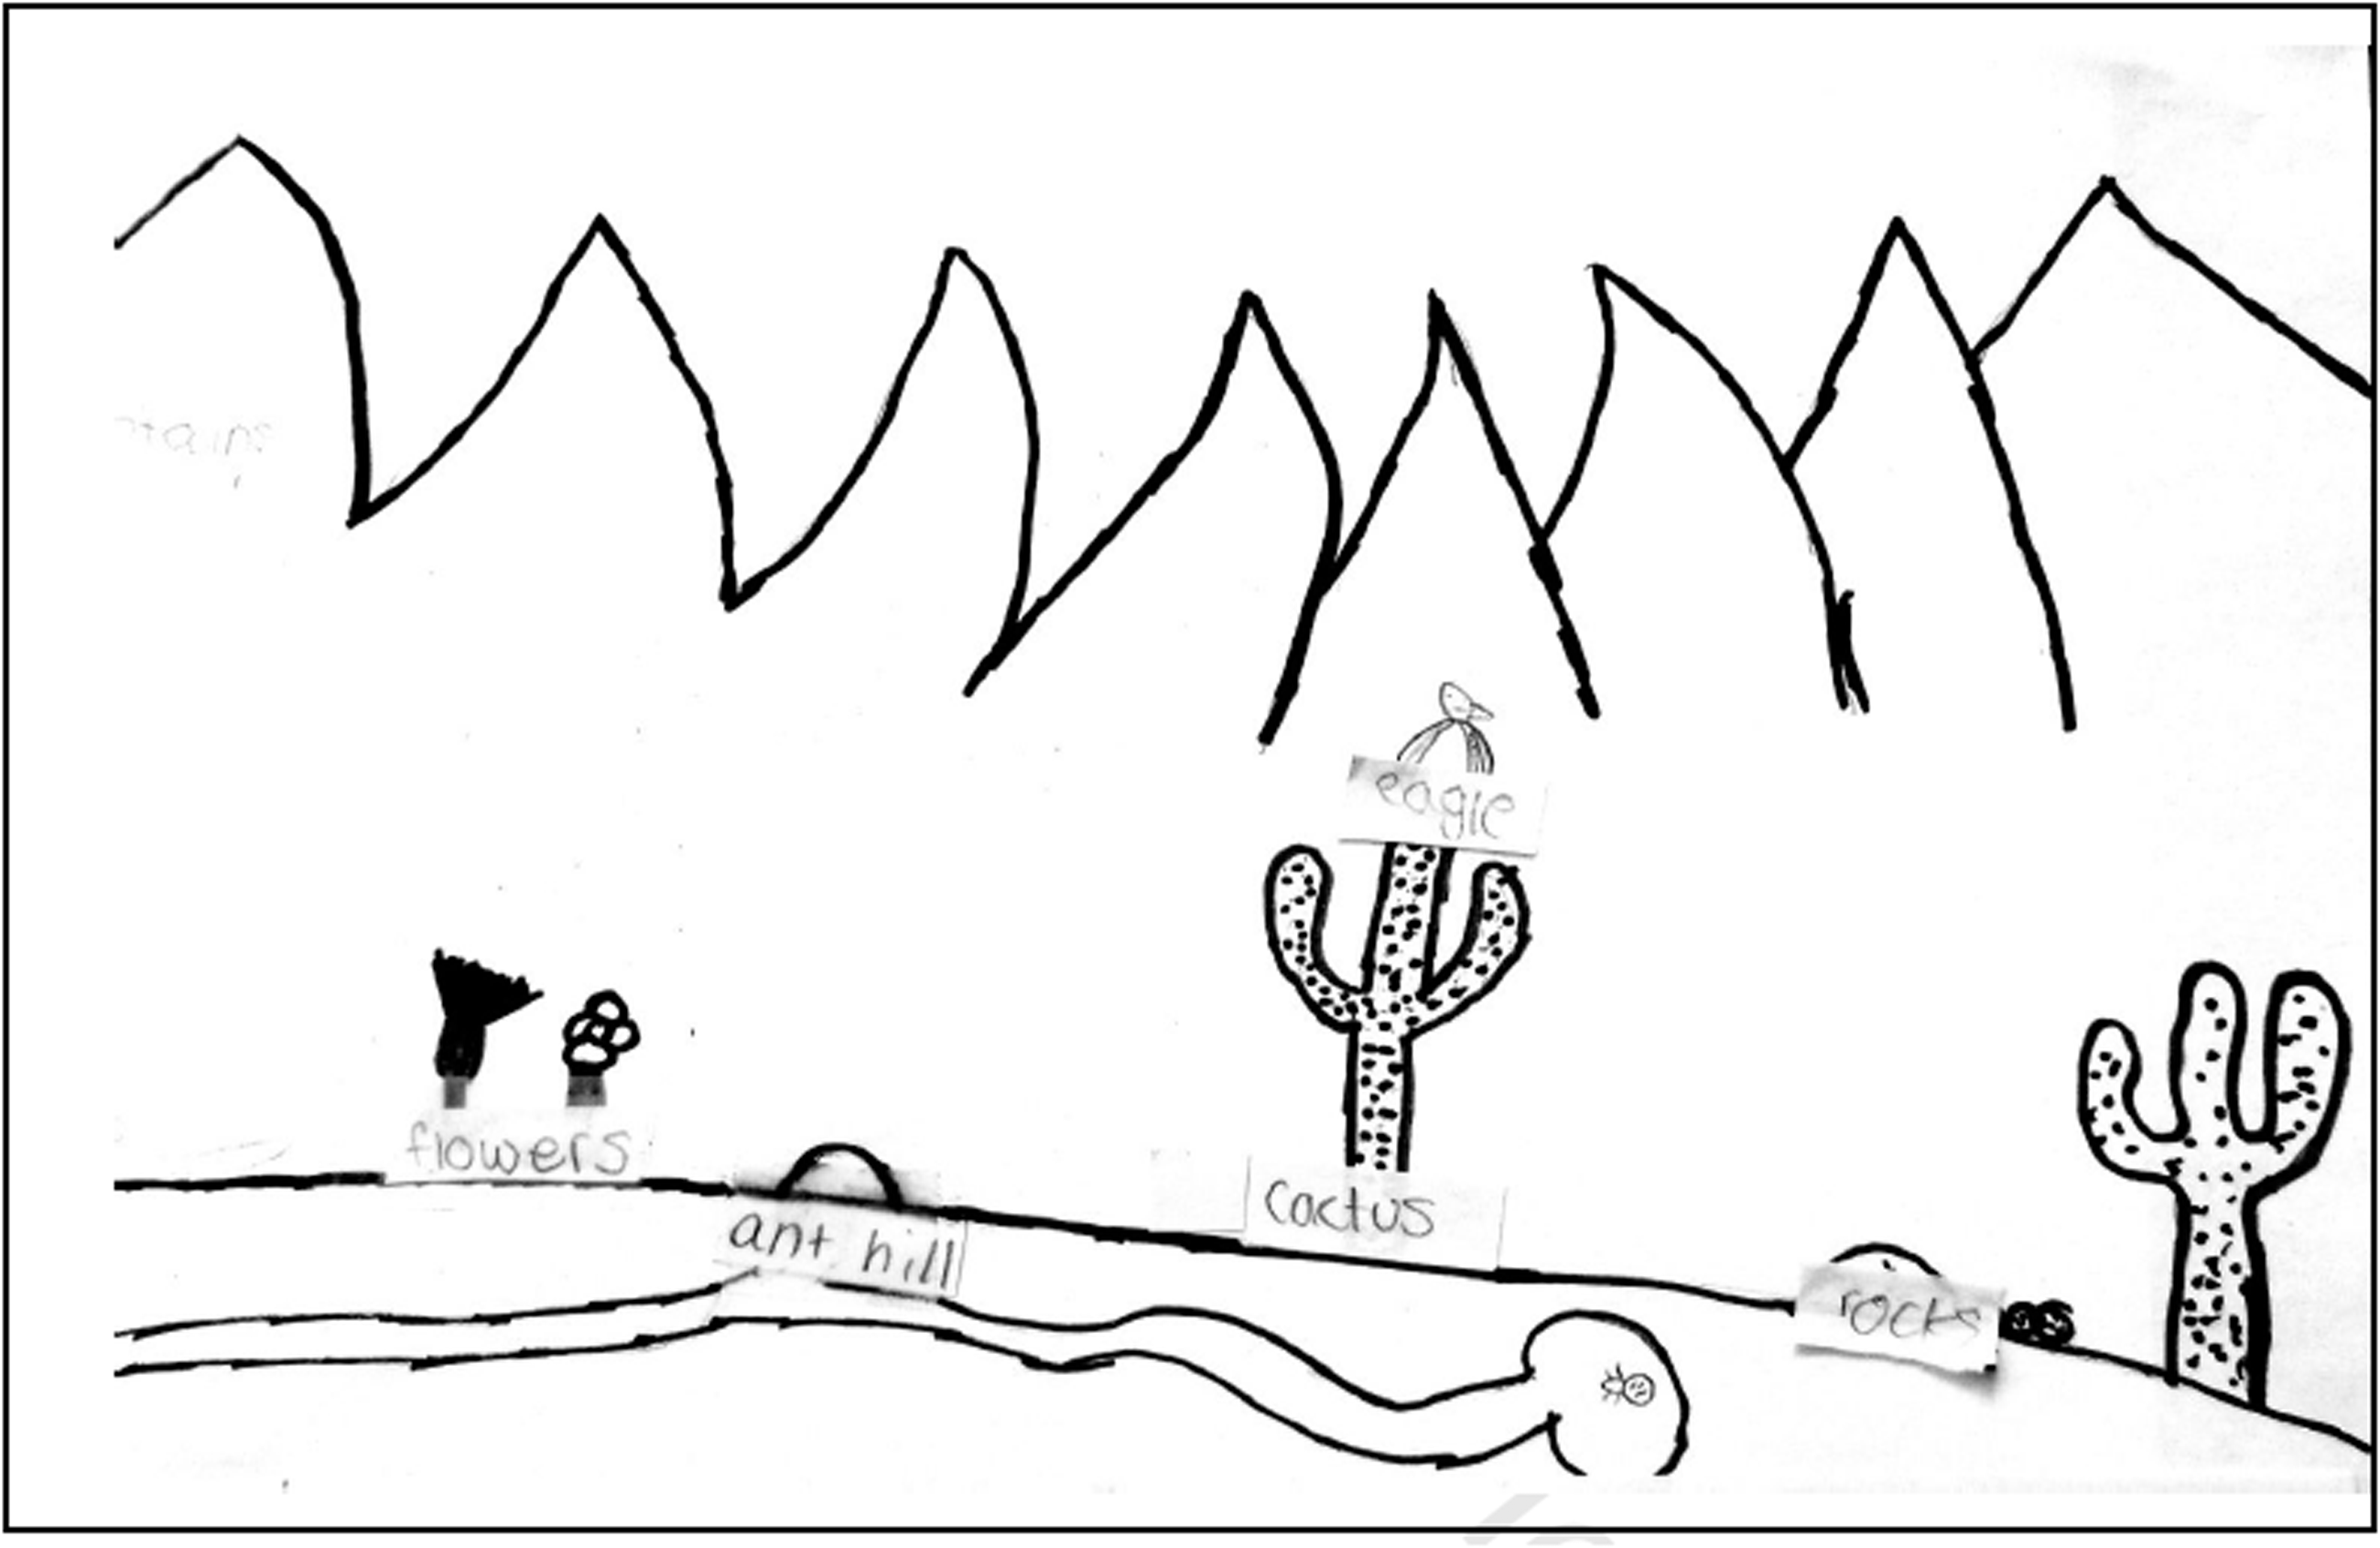
An example of an ecosystem with the final rating of “Unknown.”
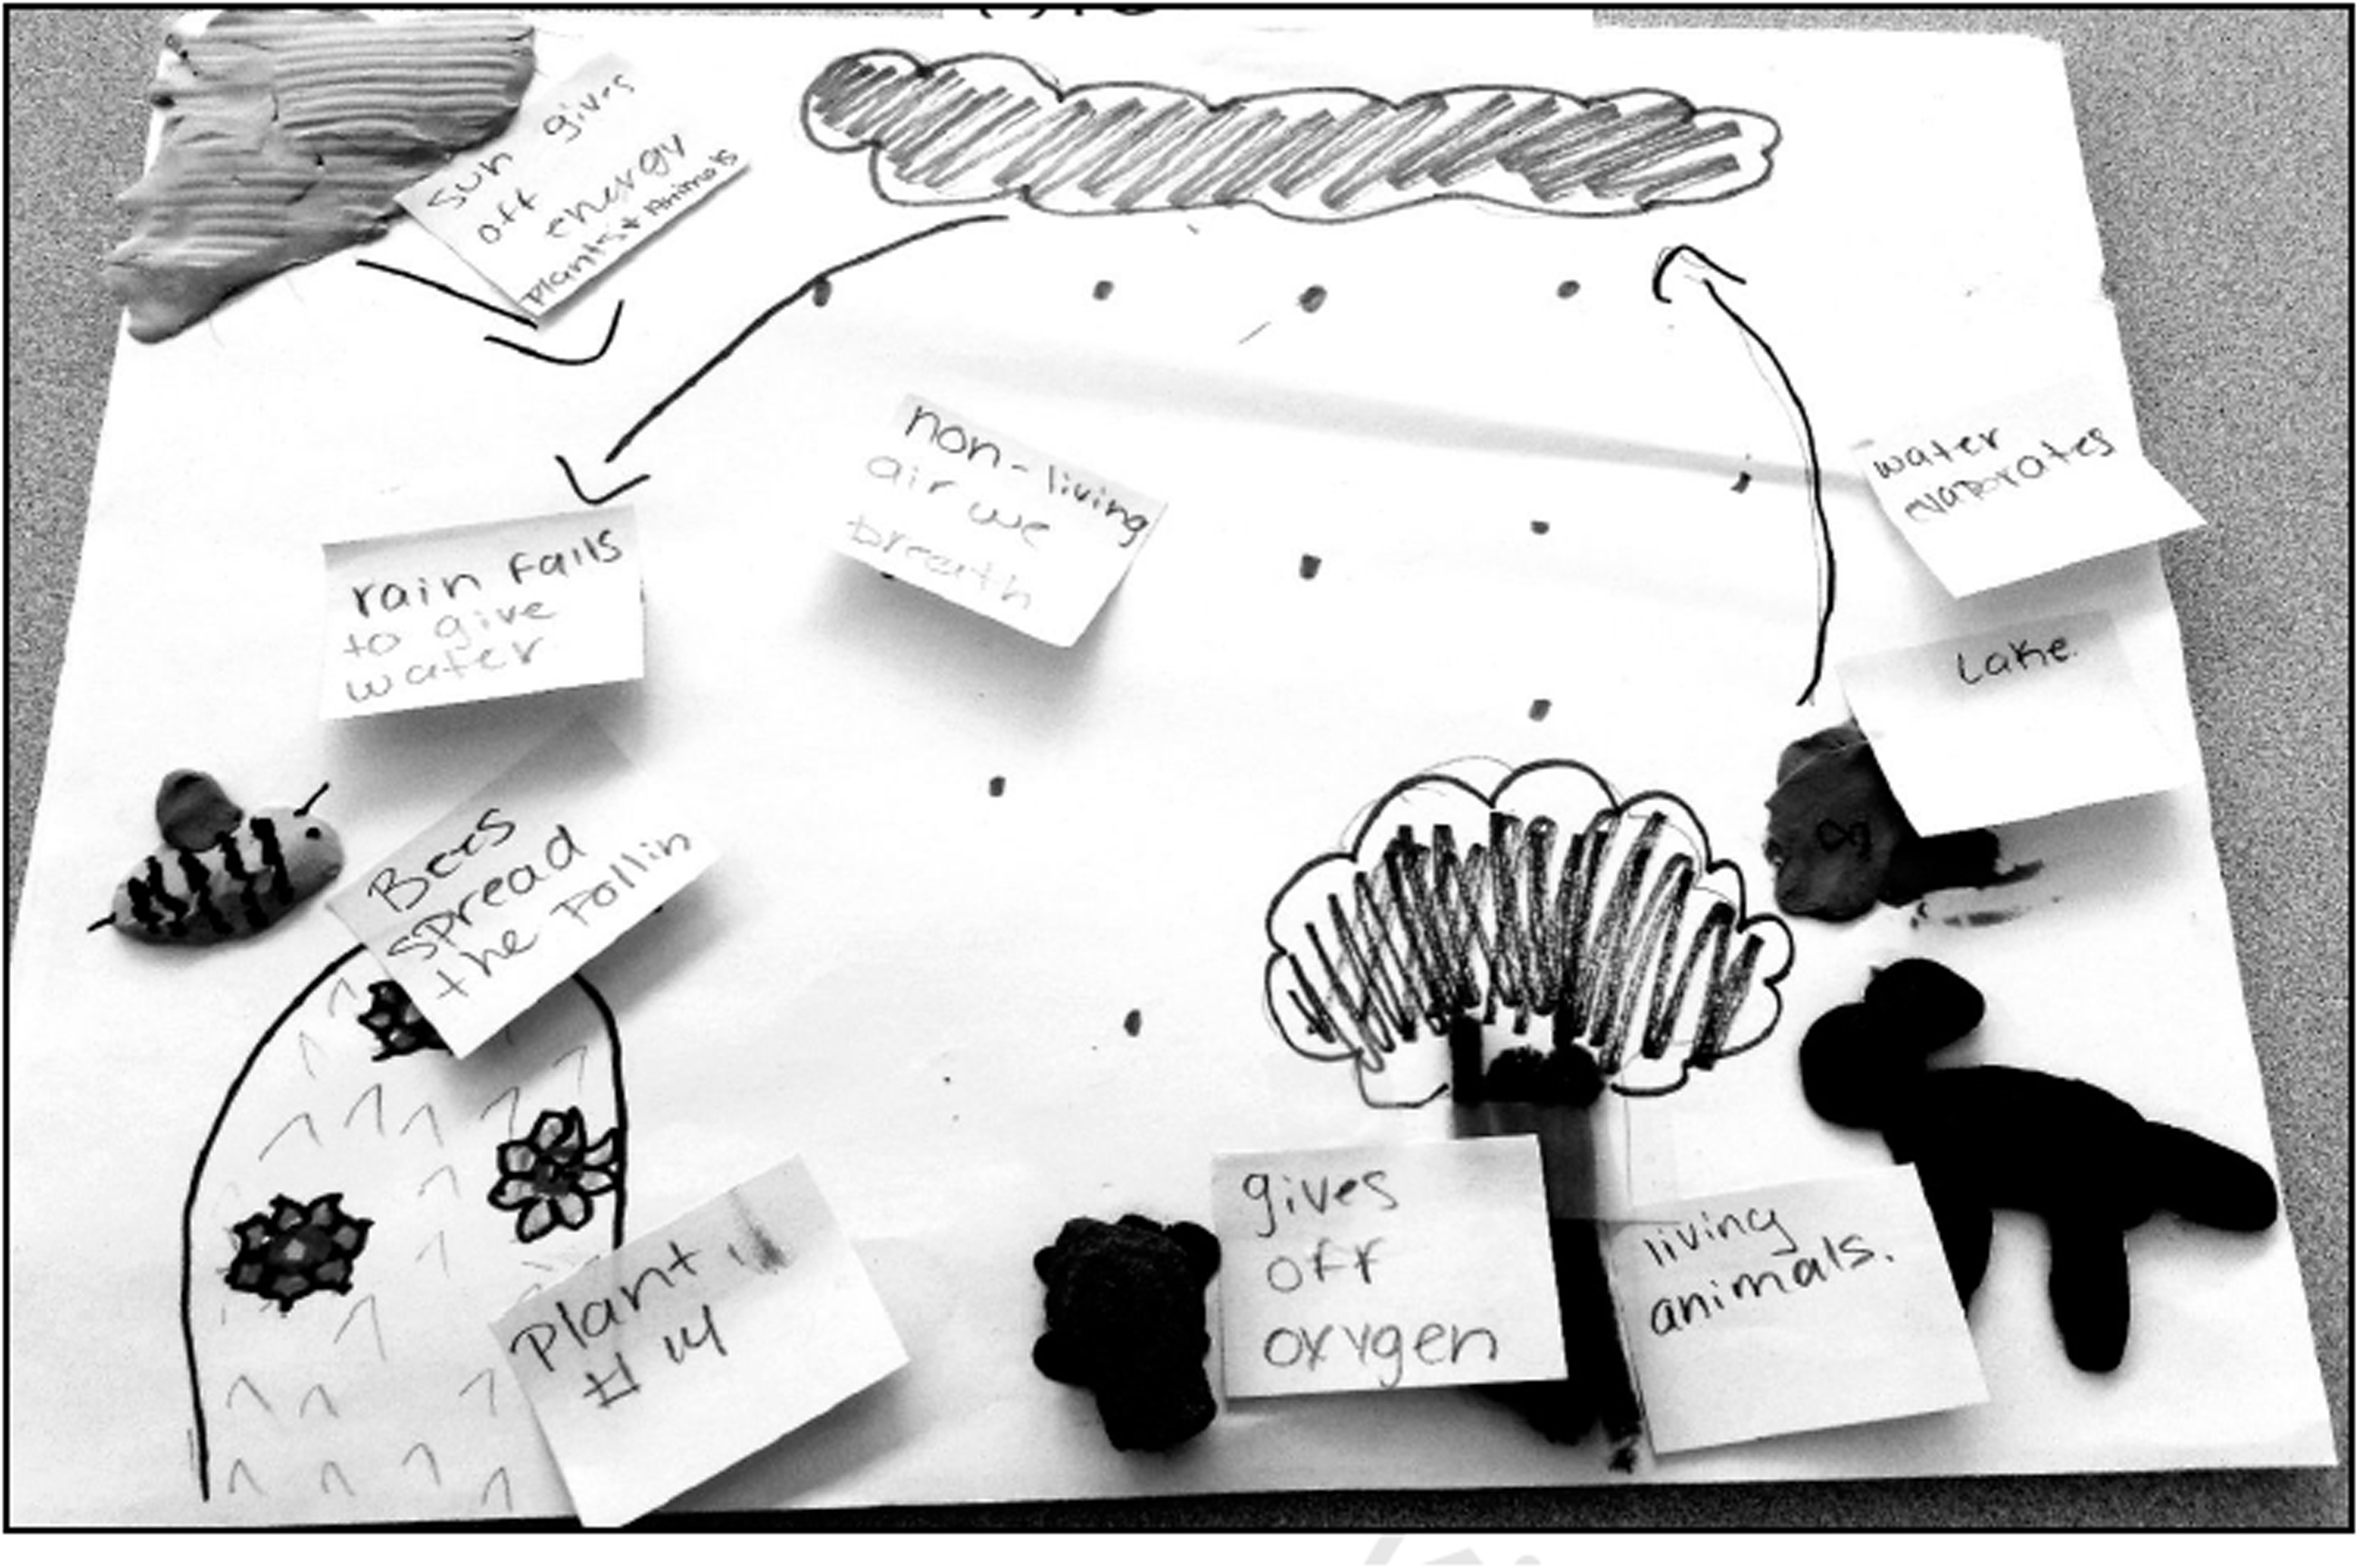
An example of an ecosystem with the final rating of “Probably.”
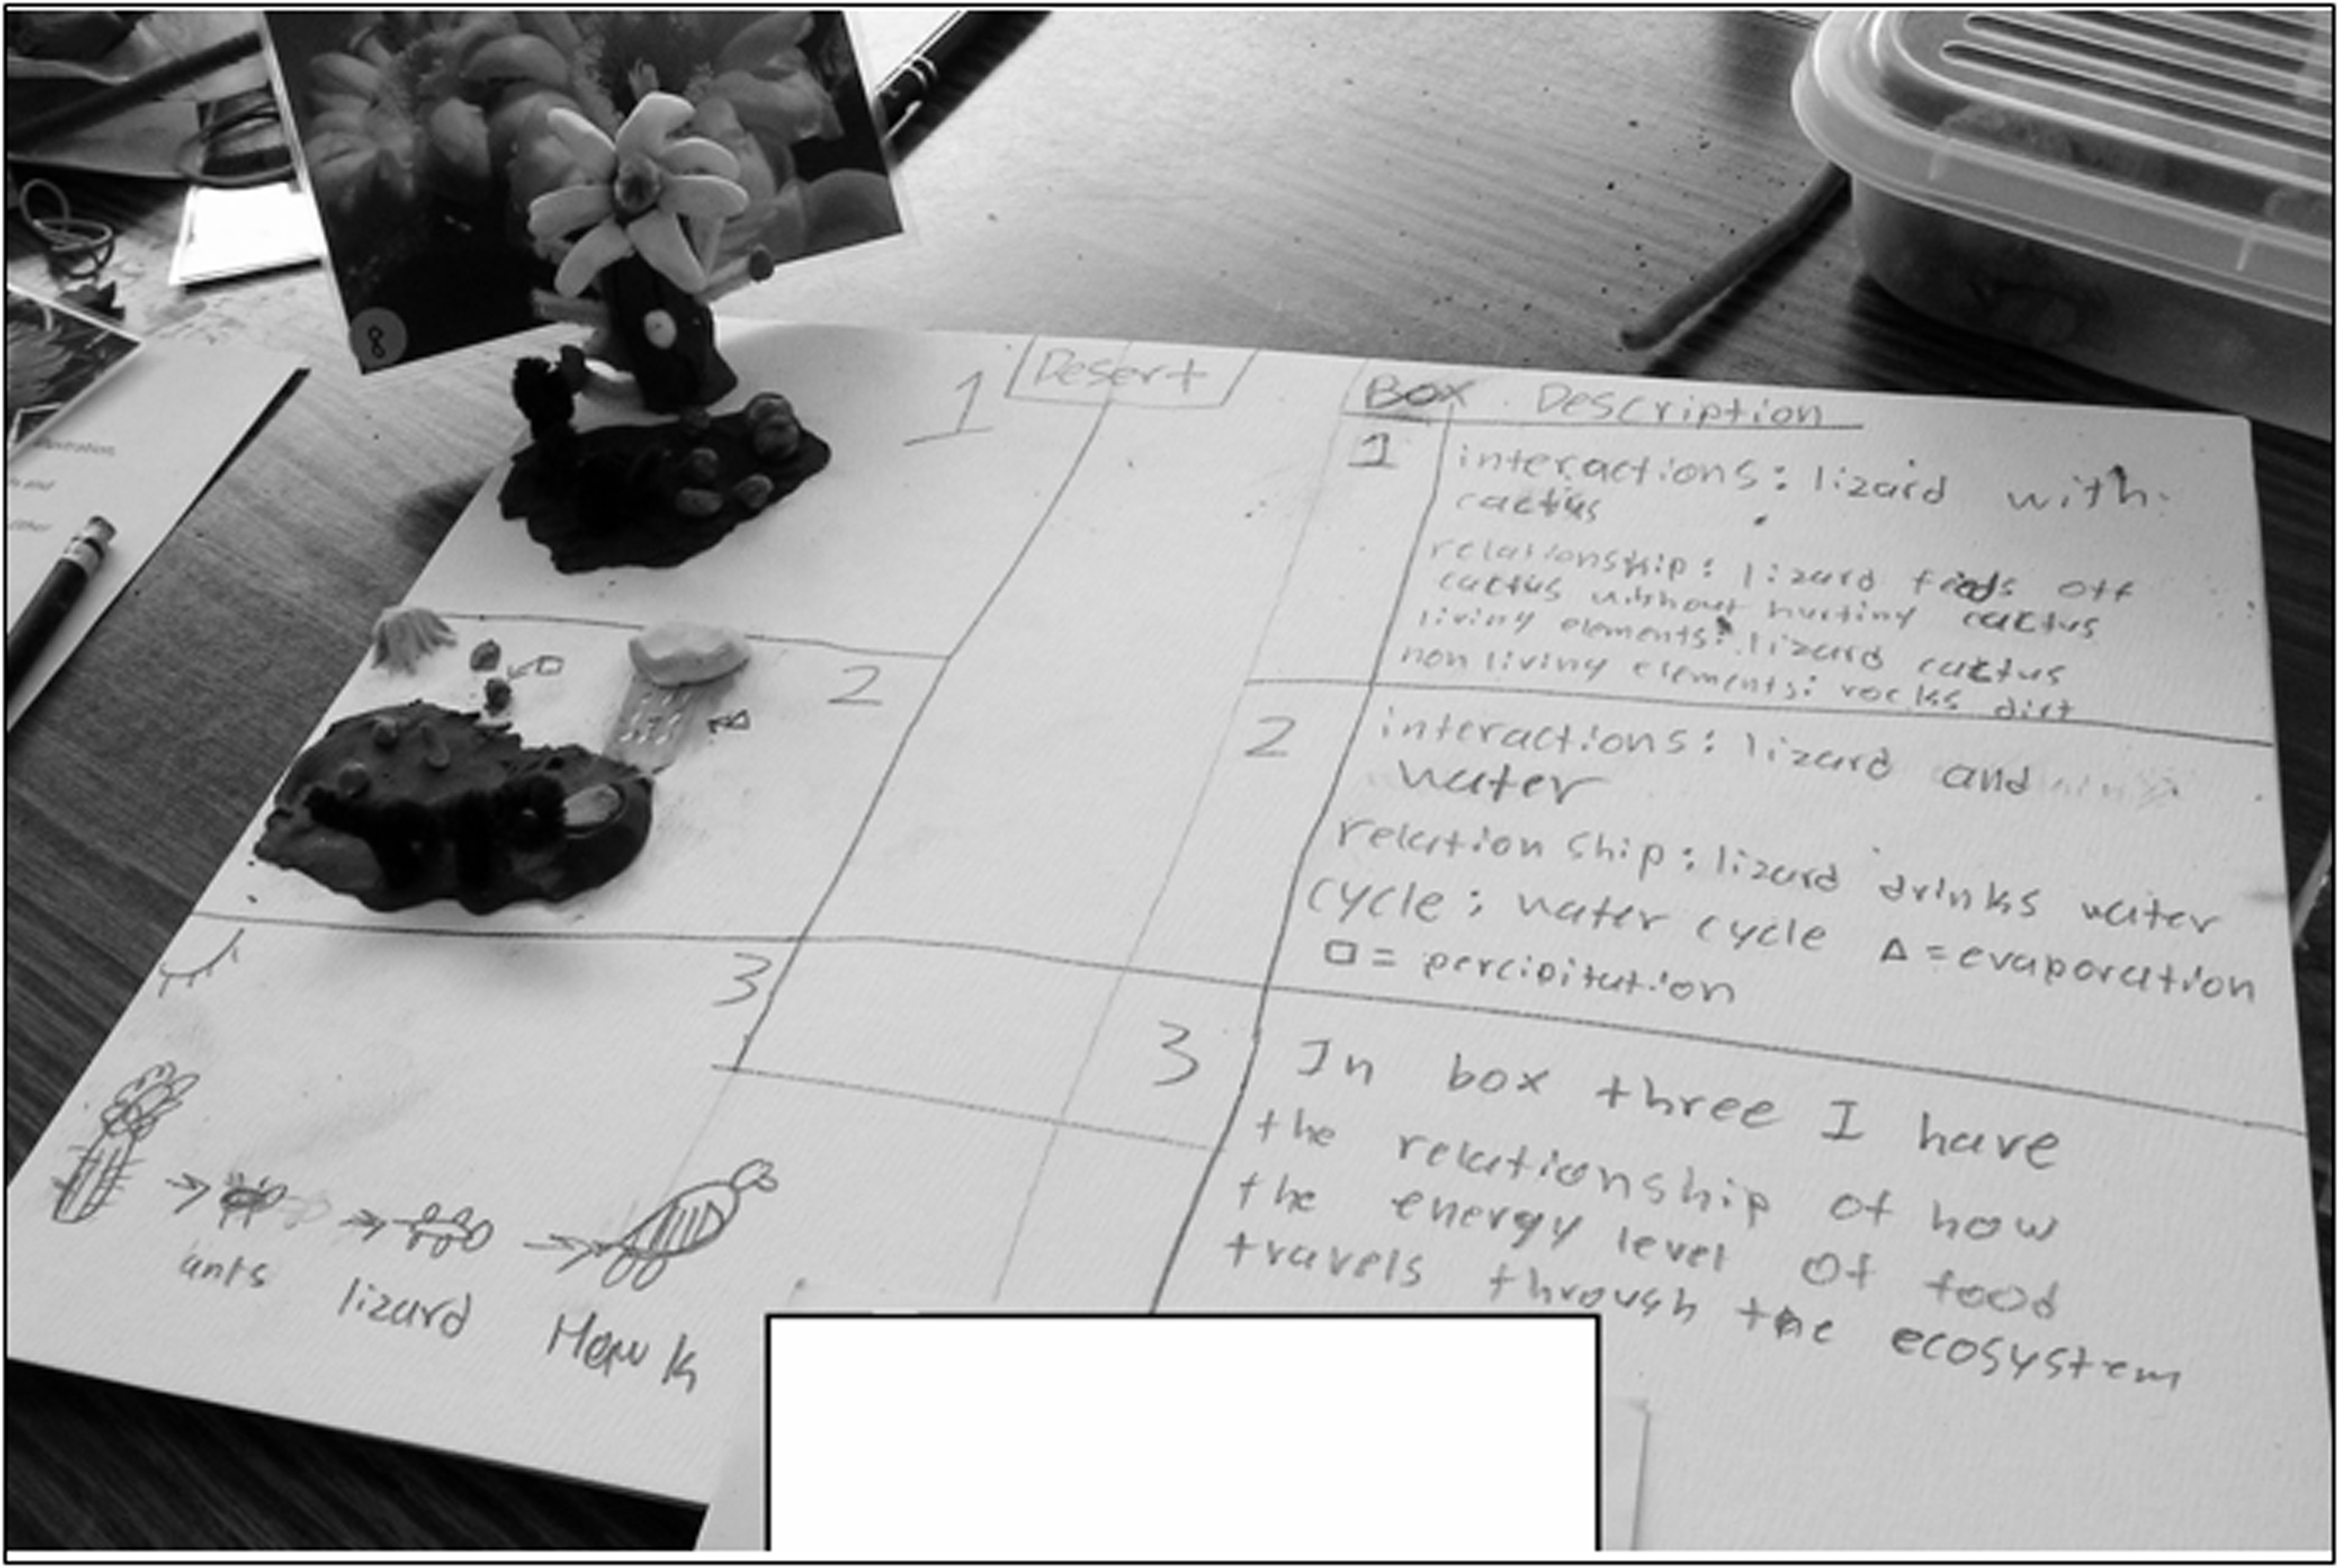
An example of an ecosystem with the final rating of “Wow.”
All four partner schools had M2 students represented in the internship program. M1 and M2 participants had very similar scores for six of the nine criteria. The M2 students had somewhat higher average flexibility and group total scores than did M1 students, whereas the M1 students had higher originality scores than M2 students (Table 7). However, no significant differences in attribute scores were found when M1 participant scores were compared with M2 participant scores (t(41), p > .38, for all scores; Table 7). Figure 9 is a comparison of the ratings for M1 and M2 participants for the insect/flower sort, the ecosystem, and the overall identification ratings.
Results of the Life Science Assessment Attribute Scores for the M1 (N = 20) and M2 (N = 23) Participants.

Note. There were no significant differences in indicator scores between M1 and M2 participants, t(41), p > .38.
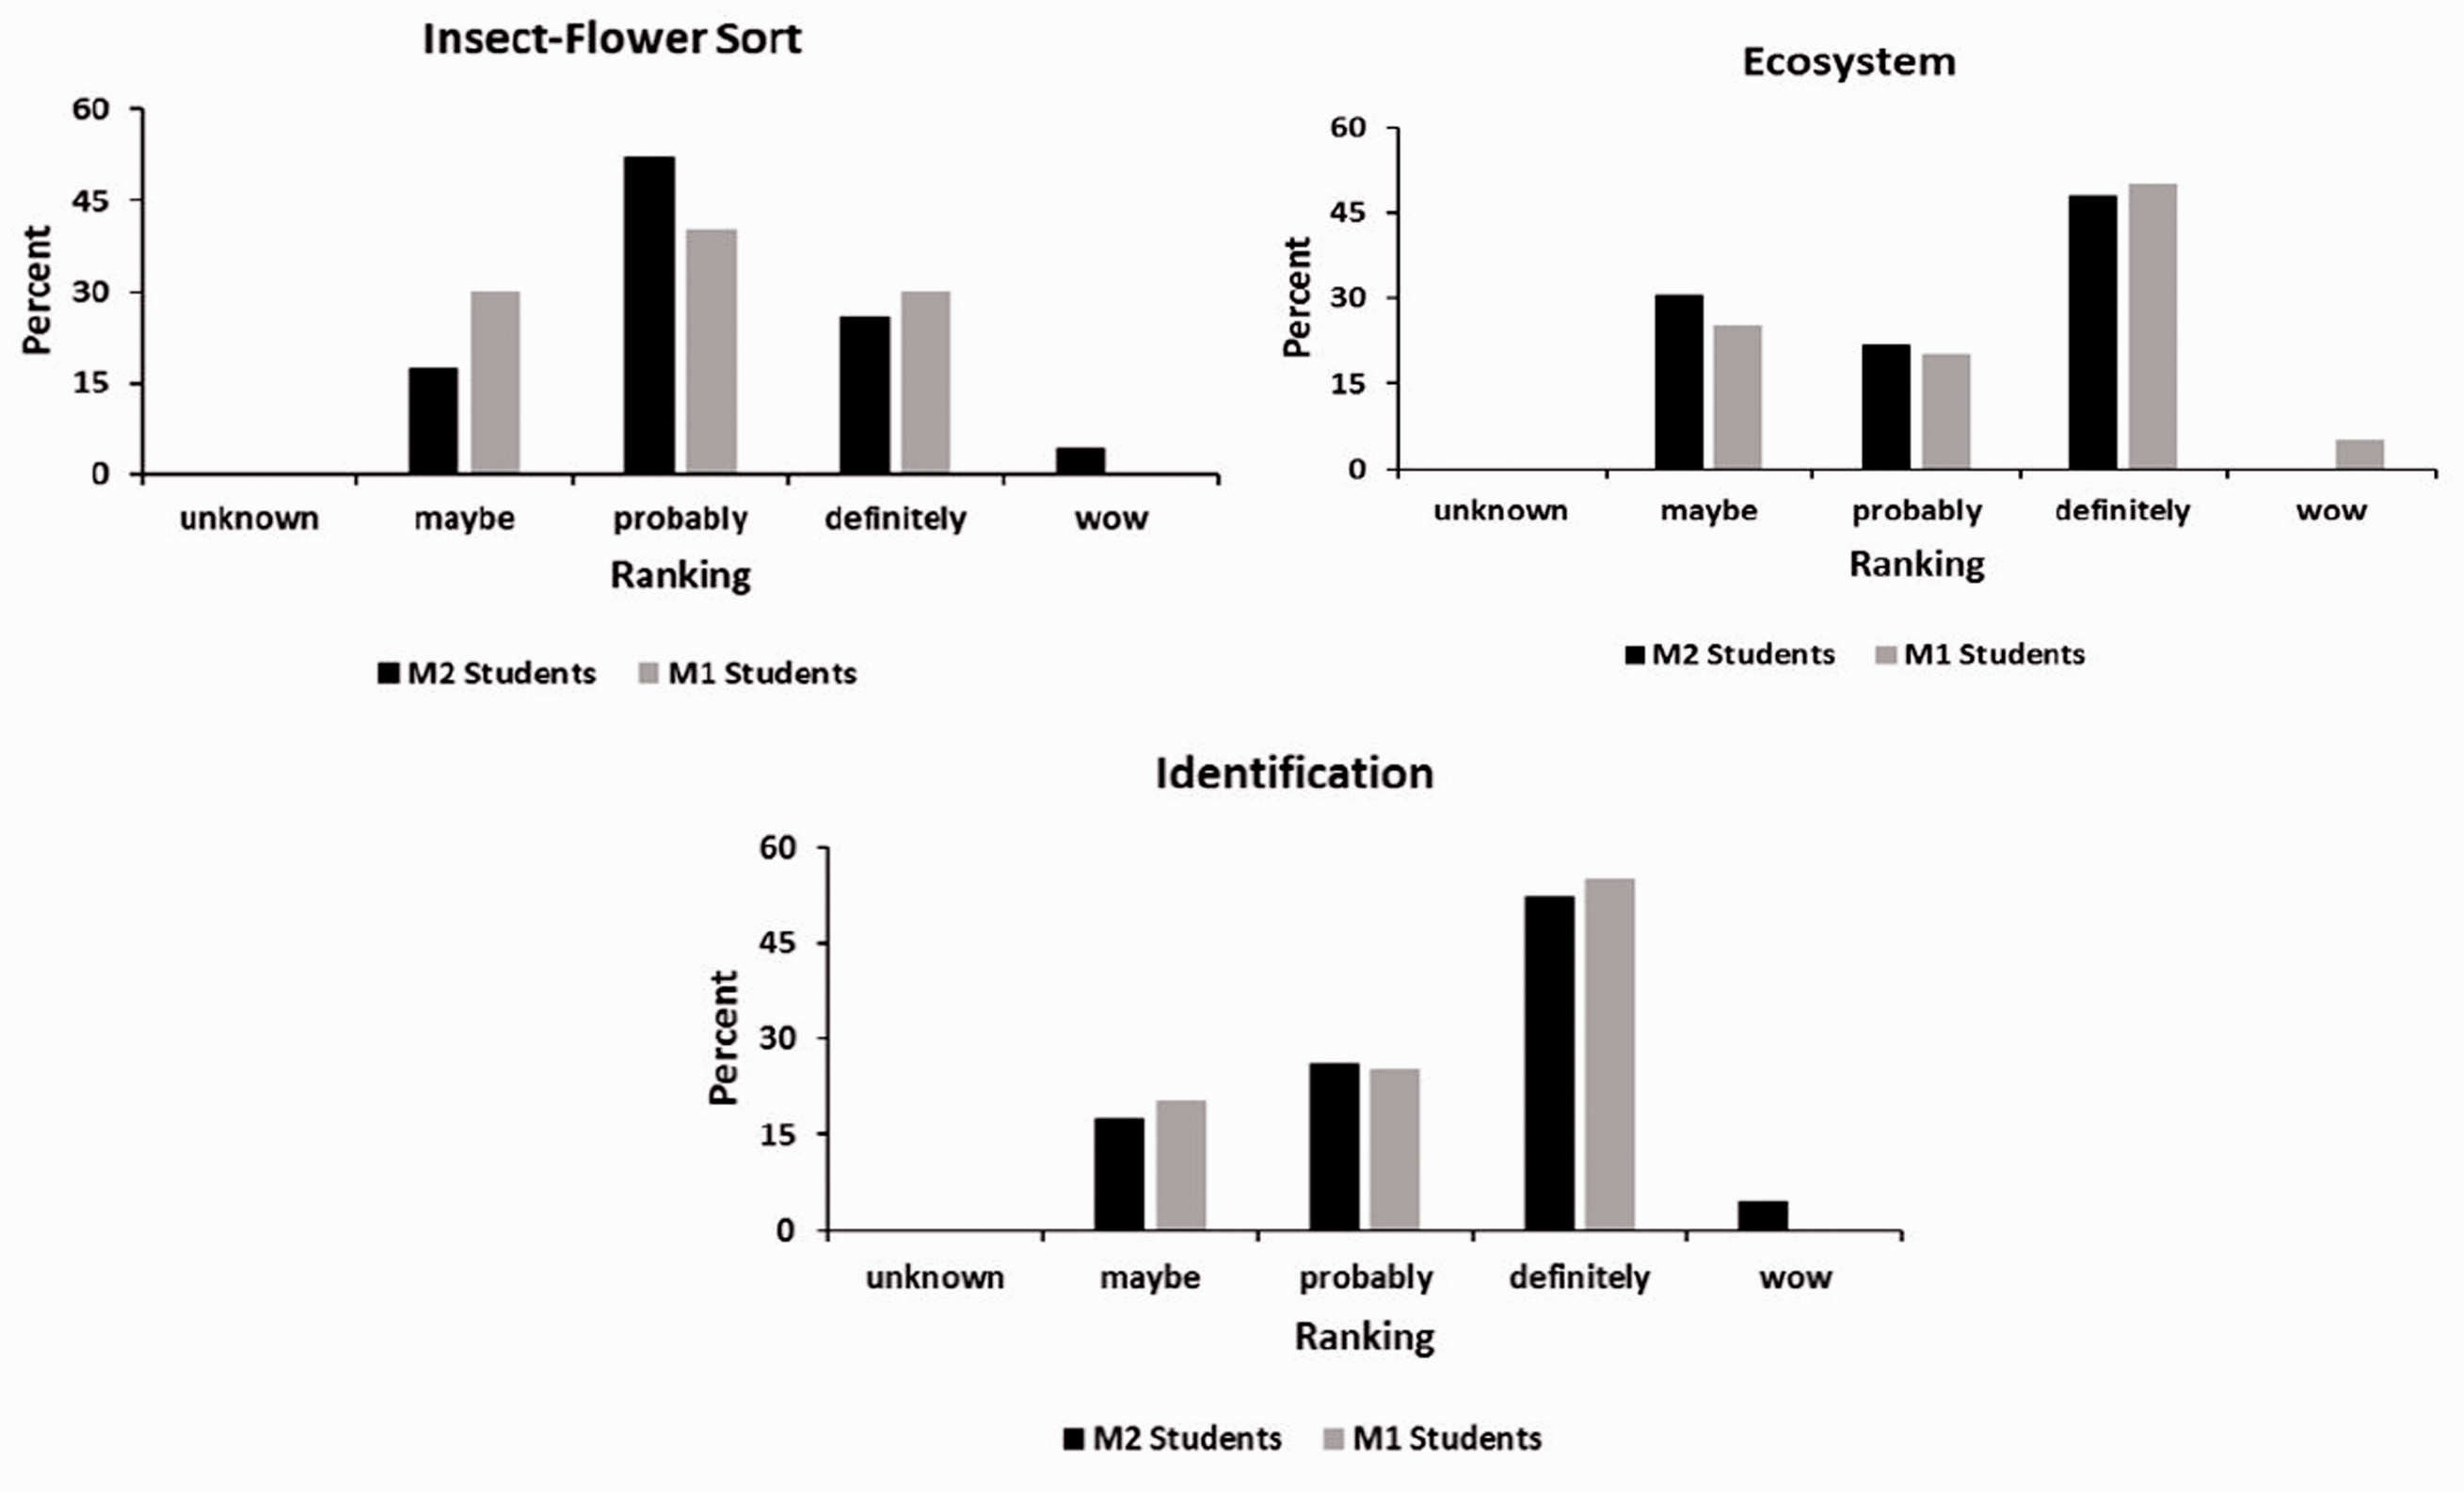
Comparison of scores on the life science assessments for M1 and M2 students.
Discussion
Field testing of the life science assessment demonstrated the need to determine the best way to assess science content using performance-based assessments and to challenge preconceived assumptions of assessment designers. The changes made by the research team during the field testing from cut flowers to flower/insect sort demonstrated that students may have little or no experience with field taxonomy that many scientists understand and use. This may be foreign to students even if they have had introductory biology and earth science courses. The flower/insect sort assessment was a way to overcome this difficulty. The focus was on first-order knowledge (Gardner, 1992) and the ability to notice similarities and differences through observations (Maker & Anuruthwong, 2003, in Maker et al., 2015) rather than second-order knowledge of taxonomies. This component of the assessment was an important way to accommodate the strengths and cultural characteristics of students from American Indian and Hispanic cultures.
The same can be said for the ecosystem assessment. The research team assumed that the students had a clear idea of the characteristics of an ecosystem; however, more guidance was necessary. The following changes were implemented: (a) a copy of the directions in Field Test 2 was given to the students, (b) more instruction on use of flower and insect pictures and components of an ecosystem was added to Field Tests 3 and 4, (c) an activity that stimulated the students’ thinking and memory about ecosystems was developed and discussed with the students in Year 2 of the implementation, and (d) students were asked by the observers to not only tell about their ecosystems but also tell how the parts of their ecosystems were related. We considered this to be a valuable addition, however, we did not see any significant change in the ecosystem assessment in Year 2 compared with Year 1.
The similarities between M2 and M1 participants on the life science assessment demonstrated that an assessment in which creativity and problem solving are included has the potential to identify underrepresented students in the life sciences from diverse cultural, ethnic, and economic groups. The results showed that this is an equitable way to identify exceptionally talented student across all demographic groups as was recommended by the NSB (2010). Students from the M1 group came from schools with many more advanced educational opportunities and in higher SES level areas of the state, but the students from both groups scored at very similar levels. These results differed from those obtained on the state science achievement test. The M1 students (N = 10; M = 584, SD = 50) had significantly higher scores than did the M2 students (N = 12; M = 491, SD = 50; t(20) = 4.4, p = .0003). Although not all student results were available because students did not take the test or the results were not obtainable, the data demonstrated that students of color and students from low SES groups were underrepresented on the state achievement test. However, they were in the top (1, 5, and 10) percent of students on the life science performance assessment. Performance-based assessments in STEM will provide an alternative and a complement to standardized achievement tests and, therefore, increase the diversity of students in the sciences.
The performance-based assessment gave students the opportunity to work as a group during the ecosystem warm-up discussion, and offered them the opportunity to relate their results to their places in their communities during the interview process. Many students would rather tell an observer about how the different insects and flowers were related in an interview and tell what they incorporated into their ecosystems rather than writing about them. This aspect of the assessment also minimizes differences between students in their writing ability.
Suggested Uses
After the life science assessments were scored, they were combined with the other STEM assessments and profiles were created for classrooms, schools, and individual students. These were given to the student, the parents, and the student’s teachers. The teachers were encouraged to use the results of the life science assessments to help students find opportunities to develop their strengths and plan instruction to meet students’ needs. Parents were given similar recommendations for assisting their children to find opportunities in their areas of strength (Pease et al., 2020).
The performance-based life science assessment can be used in multiple ways. It can be used separately, or it can be used in combination with life science concept maps, multiple-choice achievement and ability tests already being administered. Because it was developed with the goal of achieving a fair assessment of abilities across diverse cultural, ethnic, and economic groups, it can provide a way to include underrepresented students in special educational programs.
For special programs to develop problem-solving ability and creativity, this assessment can be used as a stand-alone measure or in combination with tests of creativity. The individual tasks can be used as examples to develop in-class assessments of different knowledge and skills in life sciences. For instance, tasks similar to the flower and insect sorting task can be designed for various plant and animal species and used as a pre- and posttest of the knowledge of their characteristics as well as understanding of the basic aspects of classification systems. A task similar to the ecosystem task can be used to determine students’ understanding of the connectedness and interdependence of living and nonliving things. Remember, however, that if the exact tasks in this assessment are used in science classes, they will not be valid assessments to be used for identification and placement purposes. If some students have had experiences with the tasks and others have not, those who have had these experiences will have an unfair advantage. We have also found that students are not as motivated to participate in a task if they have done exactly the same task before. The performance-based assessment could be combined with existing assessments to identify students for special life science programs for exceptionally talented students because it is fair to students from American Indian and Hispanic groups, and may be a fair assessment of other groups of students of color. The life science assessment can be used alone or in combination with other assessments to assess the quality of teaching in life science classrooms. The life science assessment can be used in classrooms to help teachers design and differentiate their lessons to meet students’ academic needs (Hodges, 2005; Pease et al., 2020; Sandri, 2013; Tracy, 2015). Teachers can use these tasks to determine the strengths of their students and then design instruction to meet these needs. If students have difficulty with open-ended problem solving but can solve closed and semiopen problems easily, then the teacher can start with these problems and gradually introduce more open-ended problems to give students opportunities to think about problems in creative ways, create new methods for solving them, and generate unusual solutions (Maker & Schiever, 2010).
Research Needed
The CDTIS research team used the life science assessment mostly with Hispanic and American Indian students because the partner schools were located in areas with a majority of students from these two groups. One of the most important future investigations needs to be with larger numbers from these two groups and with other ethnic and cultural groups, and other students from all SES levels to demonstrate the widespread utility of the assessments.
Research needs to be conducted to determine the interrater reliability with different teams of observers and the construct, concurrent, and predictive validities of the assessment. To study interrater reliability, one example is to ask a team of qualified observers to rate all products already scored by a different team of observers and calculate the extent of their agreements.
To study construct validity, both qualitative and quantitative designs are appropriate. An example of a qualitative study is to ask life science teachers and teacher educators to review the products of students, including ecosystem examples and groupings of flowers or insects, and to decide which of the products demonstrate (a) low abilities in life science and (b) high abilities in life science. Then, ask them to list the qualities of the products that distinguish between high and low abilities. The extent to which these lists of qualities match the constructs identified for the assessments is an indication of the construct validity of the assessment.
Concurrent validity often is difficult to study because so few instruments are designed to measure creative problem solving in STEM areas. Most instruments, such as multiple-choice tests, are measures of knowledge rather than critical and creative thinking. However, if state-approved, norm-referenced instruments are used, evidence of concurrent validity is low to moderate correlations with scores on the performance-based assessment. One paper-and-pencil assessment that is similar to the life science assessment is the scientific problem-solving test designed by Sak and Ayas (2013) for middle school students. Although it is not administered in the same format, the problem-solving abilities are similar.
Because the intent of the life science assessment and the other assessments was to find students with high potential to be innovators in life sciences, studies of the predictive validity of the instruments are essential. One study has been conducted (Wu et al., 2019) in which students who were selected using the life science and other new assessments developed for the CDTIS project, and who participated in the special internship program, described their experiences in the internship and in subsequent programs at their schools. Their comments provided evidence of predictive validity because of the match between what they perceived as valuable aspects of the program and the qualities assessed with the new instruments. Other evidence was that they had set future school and career goals in STEM that reflected a desire to pursue advanced studies.
Conclusion
The performance-based life science assessment developed and implemented in this study has the potential to improve the selection of exceptionally talented high school students. It can be used separately or in combination with traditional and other nontraditional assessments to measure the strengths and creative abilities of students in STEM. We presented multiple ways in which it can be used in education, not just for the identification of exceptional talent in the life sciences. Further inquiry into the factors that influence the performance of culturally or linguistically diverse students in life science and ecology was recommended by Ford and Whiting (2006). Continuing to improve how exceptionally talented students are identified in the sciences is of utmost importance.
The comparison between M2 and M1 participants validated the premise that assessments that include creativity and problem solving have the potential to identify high school students from all demographic groups who are exceptionally talented in STEM. Unlike what happens with other measures, the scores of the students of color from low-income groups were not significantly different from the scores of students from White and Asian high- and middle-income groups on the performance-based assessment in life science.
Promoting creativity among students often results in an increase in self-esteem, improved academic achievement, and acquisition of strong scientific skills (Elvan et al., 2010; Kind & Kind, 2007; Kuo, 2016; National Advisory Committee on Creative and Cultural Education, 1999; Sandri, 2013). The creative problem-solving component of the life science assessment will help teachers better understand the creative potential of students, and help the students increase their interest in the sciences.
Footnotes
Declaration of Conflicting Interests
The author(s) declared no potential conflicts of interest with respect to the research, authorship, and/or publication of this article.
Funding
The author(s) disclosed receipt of the following financial support for the research, authorship, and/or publication of this article: This research was supported by the National Science Foundation, Grant 1321190, “Cultivating Diverse Talent in STEM,” principal investigator (PI), Uwe Hilgert, and co-PIs, C. June Maker, Frans Tax, and Martha Lindsey; University of Arizona; Harold Begay; Tuba City Public Schools; and approved by a Native American Research Review Board, NNR-13.166.
