



Abstract
To what extent might race and where one lives at service start in Monroe County, New York, influence three dimensions of caregiver strain among those caring for a youth designated as having serious emotional disturbance? We used the Caregiver Strain Questionnaire to measure our outcomes: subjective internalizing strain—negative feelings of guilt and worry associated with having a child with behavioral and emotional problems; subjective externalizing strain—negative feelings about the child such as anger or embarrassment; and objective strain—interruption of personal time, lost work time, and/or financial strain in four geographical areas (place of residence) defined by ZIP code. These places included Low Income Urban (median ZIP code household income less than $39,000), High Income Urban (median ZIP code household income greater than or equal to $39,000), Suburban, and Rural.
We found that place at service start and time predicted caregiver strain levels (though time was the only predictor for externalizing strain), controlling for several factors. Race had no detectable influence. Supports can be individualized to a greater extent to address specific factors influencing the type of strain experienced by a caregiver. Providers might begin by identifying caregiver strain by type and intensity as well as identifying the specific circumstances leading to feelings and concerns associated with each type of caregiver strain.
Background
Youth designated as having serious emotional disturbance (SED) have been the focus of system-of-care (SOC) grants sponsored by the Substance and Mental Health Services Administration (SAMHSA) over the past 20 years. SED is not a particular diagnosis or illness. Rather, youth designated as having SED have at least one diagnosable disorder, according to the Diagnostic and Statistical Manual of Mental Disorders (Fourth Edition, Text Revision; DSM-IV-TR) criteria, which includes at least moderate functional impairment in two of the following life areas: self-care, family life, social relationships, or self-direction and/or learning ability (Brauner and Stephens 2006). SOC grants promote a community-based care model for children meeting criteria for SED and focus attention on the informal caregivers providing care for children affected by these problems. They are based on the principles of making mental health services and supports more easily accessible, engaging community input into the provision of mental health services, improving their cultural competence, and enabling direct family involvement along with their significant others during their youths’ assessment (Stroul and Friedman 1986). The SOC model falls within the liberation tradition of sociology that aims to rebuild society through the development of community-based action (Feagin and Vera 2001: 9,11).
This is the third evaluation analysis of a SAMHSA Phase V SOC grant initiative that Monroe County, New York, received in 2005. Our first analysis found a disparity among white non-Urban youth who showed stronger recovery by 24 months than their white Urban counterparts, and nonwhite Suburban and High Income Urban youth who showed a stronger recovery than their Low Income Urban and Rural counterparts (Grape, Plum, Fielding, forthcoming). Our second analysis examined service pathways to service assignment. There, we found differences in the level of care determination depending on whether youth were referred by Juvenile Justice or the schools (Grape, Meeker, and Fielding 2013). Here, we focus on the youths’ primary caregiver and their emotional strain related to care (Munsell et al. 2012).
Caregiver strain is associated with service use and child well-being (Dowell and Ogles 2010; Farmer et al. 1997; Garland et al. 2005; Mendenhall and Mount 2011; Perlick et al. 2004) making it an important dimension of service delivery. Our evaluation question asks, to what extent might race and where one lives at service start influence strain among caregivers of youth designated as having SED? Our goal is to provide guidelines for providers of SED services and supports.
Theoretical Orientation
We use community ecology theory to frame our analysis (Bronfenbrenner 1979; Cook and Kilmer 2010a; Richard, Gauvin, and Raine 2011; Trickett 2009). A person’s well-being is influenced not only by proximal factors such as their internal biological and psychological mechanisms, but also by their surrounding environment. Hence, we may be influenced by our family members, as well as by the larger community and the culture in which we live. This perspective views behavior as the result of mutual exchanges between a person’s biological makeup and personality traits, the immediate environment, and social influences. We are inextricably bound to our system of social and community contexts. It is a two-way street—our surroundings shape us and we shape our surroundings over time.
Children’s mental health is affected by where they live. In poorer, Urban neighborhoods with high rates of residential mobility and few opportunities for employment, there is a higher rate of problem behaviors in children compared with those living in more stable, economically advantaged neighborhoods (Leclair 2000; Leventhal and Brooks-Gunn 2011; Santiago, Wadsworth, and Stump 2011). Children exposed to community violence are more distressed than nonaffected peers due to the effects of being victimized and/or exposed to violence (e.g., witnessing stabbing, shootings, property crime) and the trauma associated with that violence (Boynton-Jarrett, Hair, and Zuckerman 2013; McKay, Lynn, and Bannon 2005; McLaughlin et al. 2010; Turner et al. 2013). These studies show that a disproportionate number of nonwhite youths were involved with Juvenile Justice. This is related to prejudice, particularly toward young, black males that stereotypes them as dangerous, something that most white youth do not face. This becomes evident when whites clutch their purses, and cross the street or give wide berth to avoid black males (Anderson 1990: 164). Individual child capacities and strengths (e.g., intelligence, resilience), alone, are not sufficient to overcome the effects of high environmental risks on their mental health and behavioral problems (Livingston 2000; Sameroff, Gutman, and Peck 2003). Community resources, stability, and safety are key elements to family well-being (Leventhal and Brooks-Gunn 2011; Rose and Thompson 2012). These findings indicate that children need the support of family and community to make improvements in their functioning.
Caregiver Strain
Caregiver strain involves the perceived burden or impact on a family living with and providing care for a special needs child. It is influenced by family disruption related to the child’s behavior, finding the appropriate services, financial strain, and the psychological burden of having a child with mental health and behavioral problems (Brannan, Heflinger, and Bickman 1997). Two broad dimensions of caregiver strain are subjective and objective strain. Subjective strain includes the negative feelings that the caregiver may experience such as worry, guilt, or fatigue; and negative feelings about the child such as anger, resentment, or embarrassment. Objective strain reflects the observable disruptions in family and community life including interruption of personal time, financial strain, or lost work time as a result of living with and caring for a child.
The type of symptomatology and impairment associated with the child’s problems is a strong predictor of the level of caregiver strain (Vaughan et al. 2013). Examples are depression and anxiety in children that are associated with lower levels of caregiver strain compared with other diagnoses (Angold et al. 1998). In contrast, suicidal ideation and behavior in youth are associated with greater caregiver strain (Barksdale et al. 2009).
Parental factors such as age, lack of social support, and a history of mental illness are associated with higher levels of caregiver strain (Angold et al. 1998). Foster parents and institutional caregivers, as well as other friends and relatives of the youth, report more strain than the youths’ biological parents (Taylor-Richardson, Heflinger, and Brown 2006).
Prior studies show mixed results on the influence of race and ethnicity on caregiver strain. For example, non-Hispanic, white parents have reported higher levels of strain than African American parents when controlling for child age, parent education, and severity of child problems. However, Hispanics did not differ significantly from non-Hispanic, whites on reported strain (McCabe et al. 2003; Shin and Brown 2009). A study looking at African Americans in Rural and non-Rural areas in one Southern state found no differences in caregiver strain after controlling for socioeconomic and clinical characteristics (Mukolo and Heflinger 2011). Another study found that race did not predict any dimension of caregiver strain measured with the Caregiver Strain Questionnaire, but African American parents experienced a slower rate of increase in objective strain (financial, lost work time) at a given increase in child internalizing problems than white parents (Kang, Brannan, and Heflinger 2005).
Poverty likely plays some role in caregiver strain. For example, Cook and Kilmer 2010b noted that 86 percent of families in their study of caregiver strain were living below the poverty level. They also found a positive relationship between community support/connection and caregiver strain related to youth designated as having SED. A subsequent study found that caregiver strain and social connections to the neighborhood were related to the caregiver’s physical and emotional well-being (Munsell et al. 2012). The latter finding is in line with prior research showing that women with high levels of connectedness are less prone to anxiety in daily life (Lee and Robbins 1998).
Monroe County’s SOC
Monroe County’s SOC focused on underserved youth involved in multiple child systems including Probation and Child Welfare. A holistic care coordination model was adopted using the child and family team process to determine strengths and needs and identify family and community resources and referrals. The community accessed services through a single point where eligibility, priority, and assignment to a care coordination provider were determined. Part of the care coordination process included a tool for “cultural discovery” and the care coordinators participated in extensive training from the lead cultural broker and cultural competence consultant. This process evolved into a weekly conversation about racial/ethnic disparities, white privilege, and institutional racism among cultural diverse groups over six consecutive weeks. Our SOC also partnered with the University of Rochester to identify and train “natural helpers” in several Urban neighborhoods about mental health issues and referral resources. A multi-stakeholder Community Collaborative was established to review data and provide input regarding service needs and gaps.
How We Conducted This Study
This longitudinal analysis was approved by the University of Rochester Research Subjects Review Board (RSRB). Eligibility for this evaluation required that families have a youth between the ages of birth to 21 designated as having SED, were entering care coordination, and residing in Monroe County. Families were excluded from the evaluation if their services began more than 30 days before or after providing their consent to participate in this evaluation, or if the youth already had a sibling enrolled in the evaluation.
Evaluation recruitment was facilitated by care coordinators at the time youth started care coordination services. Care coordinators read an RSRB approved script to the caregiver(s) highlighting the study. If the caregiver(s) were willing and eligible for the evaluation, the care coordinator would indicate this on the mental health and demographics form sent to the evaluators who would then follow-up with the caregiver(s). If after further discussion about the evaluation they were interested in participating, an appointment was set up for an interviewer to meet the primary caregiver at a time and place of their choosing to sign the consent form, and conduct their baseline interview. Of the 1,270 families in Monroe County’s population of focus with a youth designated as having SED, 257 provided their informed consent along with a baseline interview. Thereafter, each youth’s primary caregiver during the prior 6 months was interviewed in-person at 6-month intervals up to 36 months after their baseline interview.
We derived the families’ place of residence by using the ZIP Code reported when they started services. We then used U.S. Census 2000 data to determine the median household income for each reported ZIP Code to create four ZIP Code groups: (1) Urban ZIP Codes with less than $39,000 median household income ($18,997–$29,544); (2) Urban ZIP Codes with $39,000 or higher median household income ($39,000–$47,396); (3) Suburban ZIP Codes ($45,414–$82,000); and (4) Rural ZIP Codes ($27,500–$87,126). We chose $39,000 as the divide between low and high median household Urban income since the next lower ZIP Code median was $29,000—much closer to the 2010–2011 poverty guidelines for a family of four ($22,000).
Outcome Measures
We used the Caregiver Strain Questionnaire to measure three dimensions of caregiver strain: subjective internalizing strain—negative feelings of guilt and worry associated with having a child with behavioral and emotional problems; subjective externalizing strain— negative feelings about the child such as anger or embarrassment; and objective strain—interruption of personal time, lost work time, and/or financial strain. This questionnaire has been found to be valid and reliable among families with children experiencing emotional and behavioral disorders (Brannan et al. 1997) and autism (Khanna et al. 2012). It consists of 21 self-reported items; each based on a five-point Likert scale ranging from 1 = “not at all” to 5 = “very much.”
Supplemental information about our methodology, including control variables, is available online (http://www.childrensinstitute.net/sites/default/files/documents/supplemental_caregiver-strain.pdf).
Analyses
We used descriptive statistics to provide an overview of the families. Using mixed models with repeated measures for the multivariate analyses enabled us to report estimated means to measure the caregiver strain outcomes, and the Type III fixed effects of Time and Place that generated the F-ratios for the tests of significance reported. We used SPSS V19 to conduct the analyses. 1
What We Found
Socioeconomic and Family Characteristics
Our analysis shows that there are few observed differences across place of residence on demographics, with the major exception that poverty and nonwhite families are concentrated in the Urban neighborhoods. Table 1 shows that only race, Hispanic background, and poverty and Medicaid statuses are significantly associated with the place of residence at service start. White youth are the minorities in both Urban places, and youth of Hispanic origin are most heavily concentrated in Low Income Urban neighborhoods and least likely to reside in Rural neighborhoods.
Family Socioeconomic Status.

p < .01. **p < .001.
Perhaps the most striking differences in our sample are in terms of economic characteristics involving the receipt of Medicaid, and Poverty Status. These show that poverty is most concentrated among Low Income Urban youth, with the rate of poverty steadily declining as neighborhoods radiate to Rural areas. A larger proportion of caregivers in the Low Income Urban neighborhoods are likely to be single mothers who lack the financial and personal resources necessary for effective parenting, many of whom have intellectual or cognitive deficits. There is evidence that parents with intellectual disabilities are especially likely to be at greater risk of parenting strain (Aunos, Feldman, and Goupil 2008).
Turning to family characteristics, there is mixed evidence that the degree of kinship and social connections or perceived social support a family has mitigates caregiver strain (McCabe et al. 2003). African Americans and Asian Pacific Islanders reported lower perceived social support than non-Hispanic whites, whereas Latinos did not differ from non-Hispanic whites. Thus, differences in perceived social support did not explain African Americans’ lower caregiver strain. A prior study found that caregivers who reported higher utilization of extended family, friends, neighbors, and spirituality experienced lower stress and greater enrichment, compared with their counterparts (Yatchmenoff, Koren, and Friesen 1998). There is also some evidence to suggest that both “strong” (e.g., family) and “weak” (e.g., the person at the supermarket check-out stand) ties are important to a person’s well–being (Sarason and Sarason 2009). Data from the General Social Survey and other sources suggest that there has been a decline both in the number of our confidants in social networks and in community ties (McPherson, Smith-Lovin, and Brashears 2006).
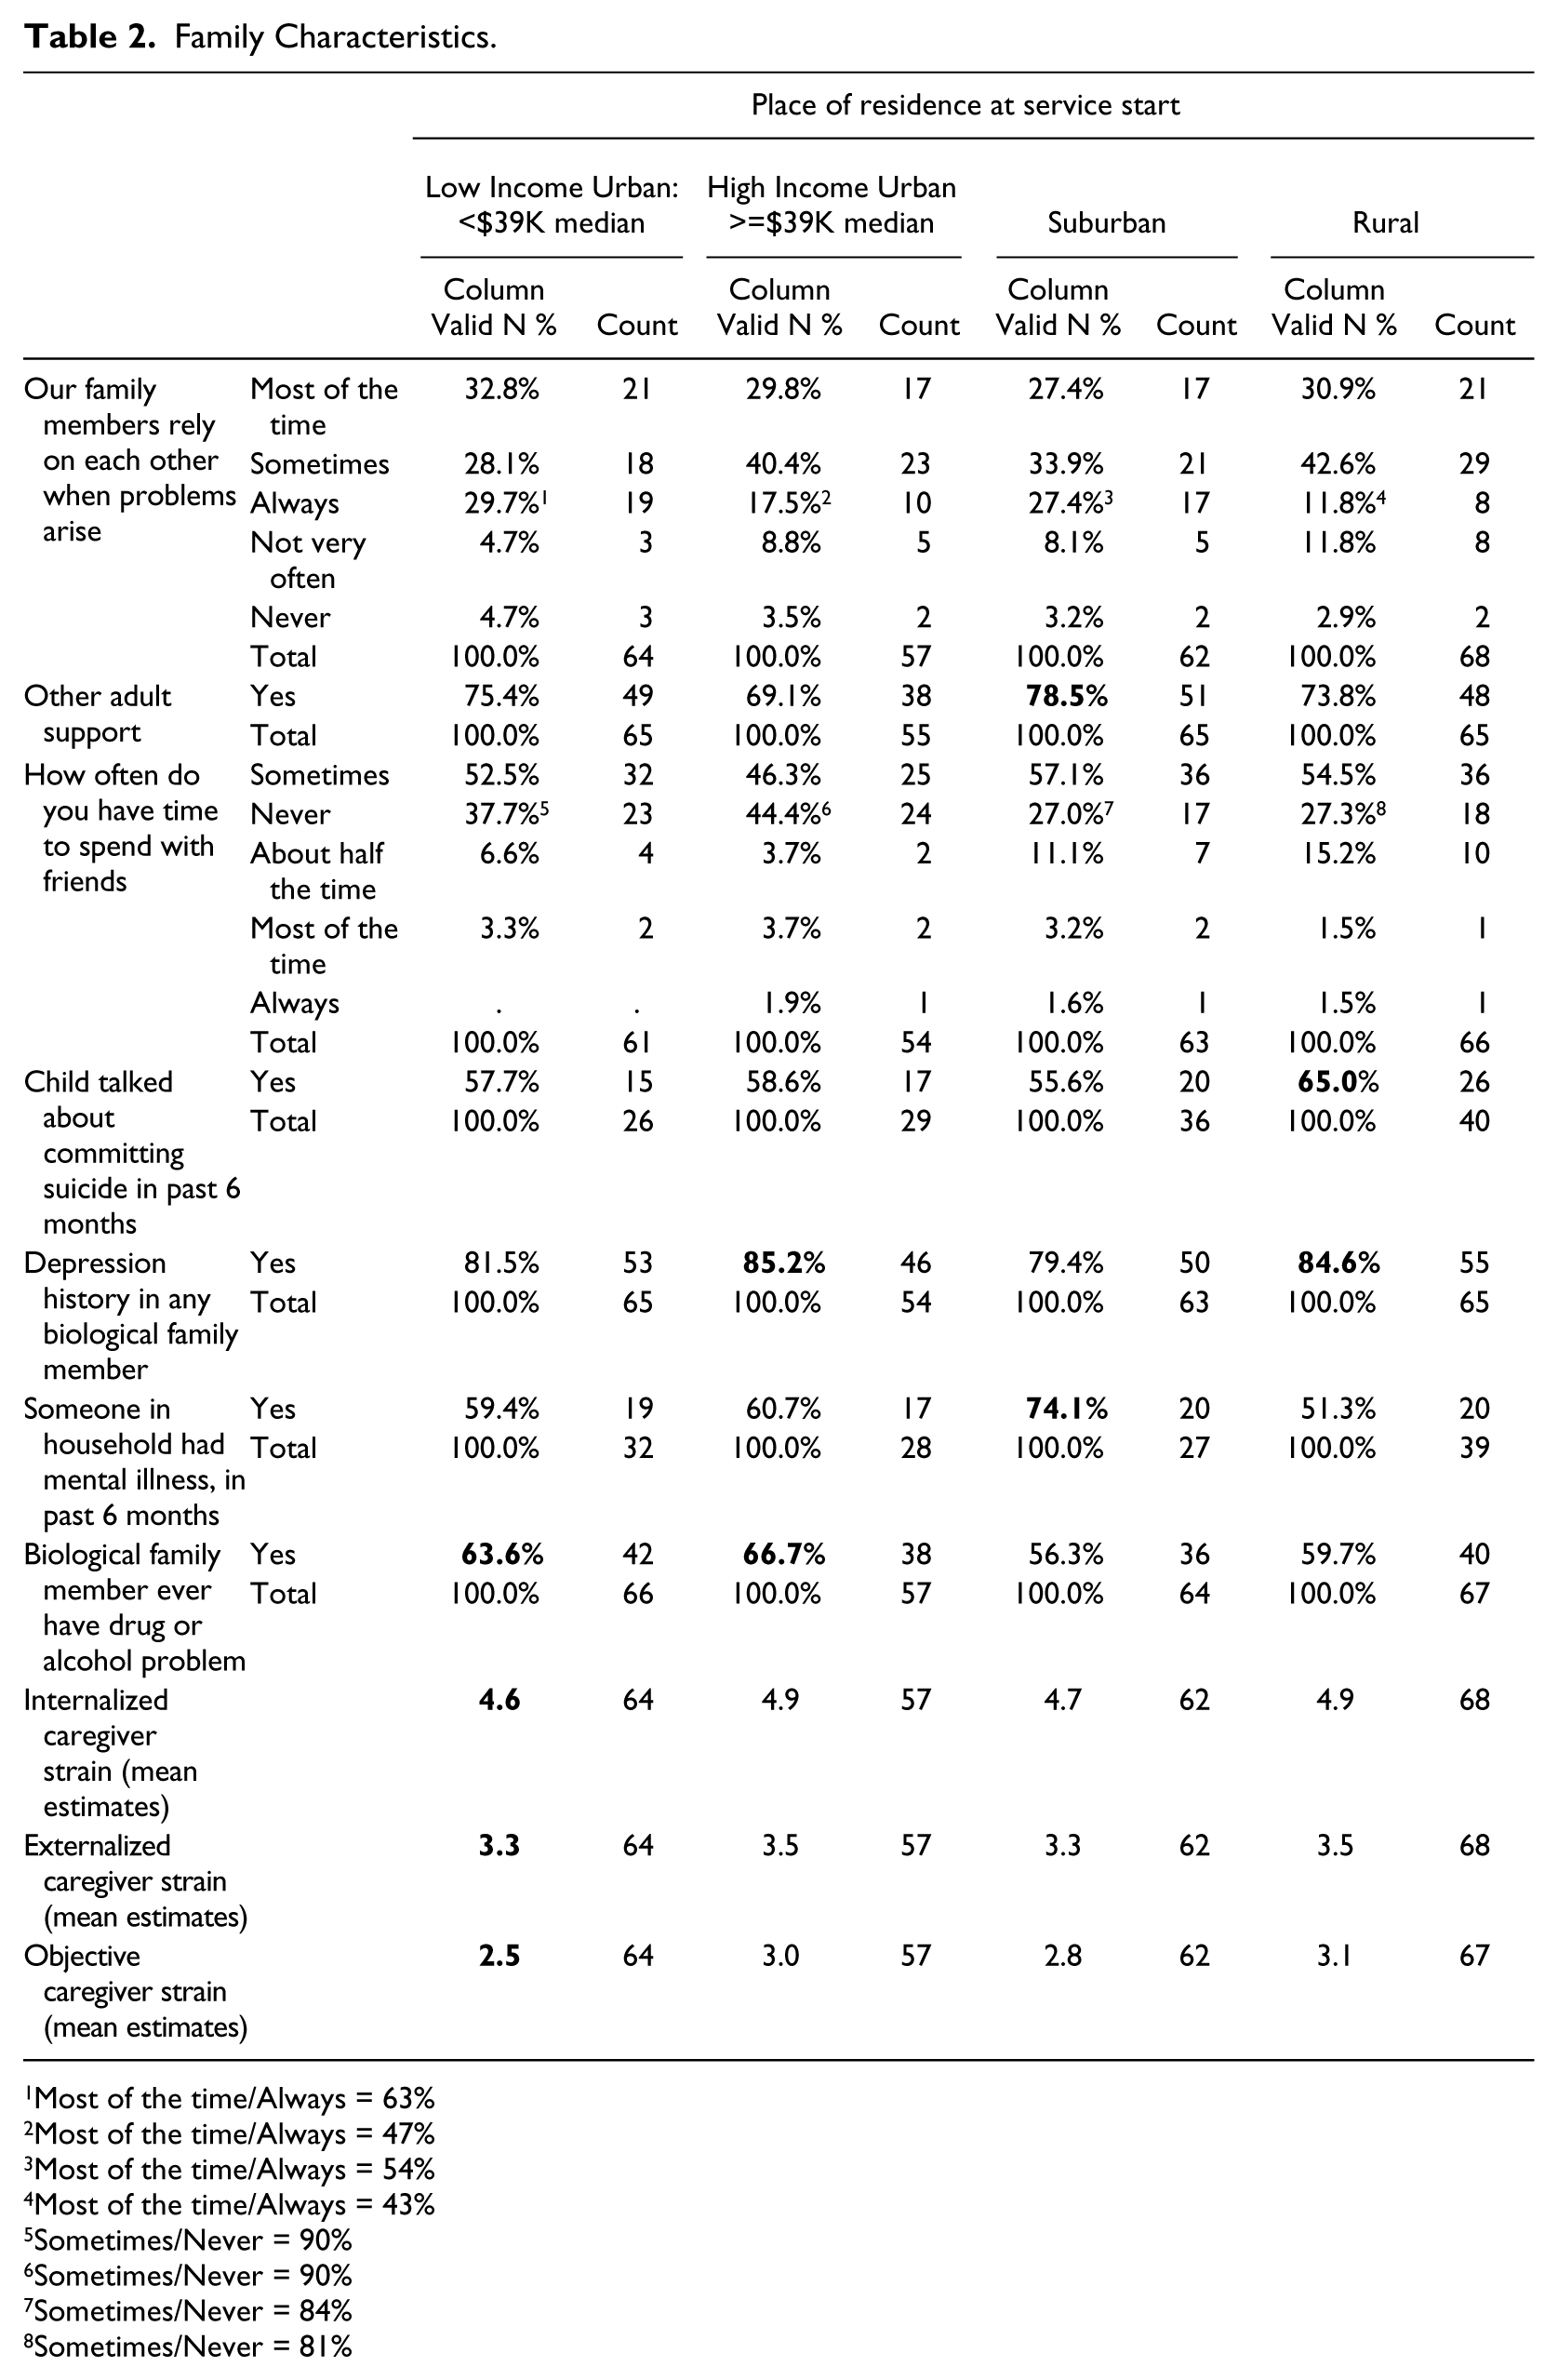
With respect to Monroe County, although we found no statistically significant differences across place of residence on caregiver responses to aspects of social support, due to too few cases, there are some differences worth noting in Table 2. Caregivers in Low Income Urban and Suburban neighborhoods responding to “family members relying on each other when problems arise” have a higher proportion reporting “most of the time/always” (63% and 54%, respectively), compared with caregivers in High Income Urban and Rural neighborhoods (47% and 43%, respectively). Caregivers in High Income Urban neighborhoods report the smallest proportion of “other adult support” (69%), whereas Suburban caregivers report the largest proportion (78%). However, a smaller proportion of Suburban and Rural caregivers report “sometimes/never” “having time to spend with friends” (84% and 81%, respectively), compared with their counterparts in Urban neighborhoods (90% each).
Family Characteristics.
Most of the time/Always = 63%
Most of the time/Always = 47%
Most of the time/Always = 54%
Most of the time/Always = 43%
Sometimes/Never = 90%
Sometimes/Never = 90%
Sometimes/Never = 84%
Sometimes/Never = 81%
Analysis of other family characteristics associated with caregiver strain in our community showed the largest proportion of caregivers reporting that “someone in the household had mental illness in the past six months” resided in the Suburban neighborhoods (74%) while the smallest proportion resided in the Rural neighborhoods (51%). The largest proportion of “drugs or alcohol problems” was reported by caregivers residing in High Income Urban neighborhoods (67%), and the smallest proportion in the Suburban neighborhoods (56%). The largest proportion of youth in Monroe County talking about suicide during the six months prior to each follow-up point reside in Rural neighborhoods (65%).
To summarize, we found that a greater proportion of caregivers in Low Income Urban neighborhoods report relying on each other in their families, compared with caregivers in other neighborhoods. Non-Urban caregivers have more opportunities to spend time with friends, and a larger proportion of them rely on other adults for support than their Urban counterparts. A larger proportion of Rural youth spoke of suicide, compared with youth in all other neighborhoods. Family depression history is highest in High Income Urban and Rural neighborhoods, which tend to be predominantly white. Caregivers in Suburban neighborhoods have the largest proportion of reported recent family mental health problems, whereas Rural caregivers reported the smallest proportion. Drug and alcohol problems are more prevalent among Urban families than non-Urban. Finally, internalized strain is the most intense, while objective strain is the least.
Referral Problems
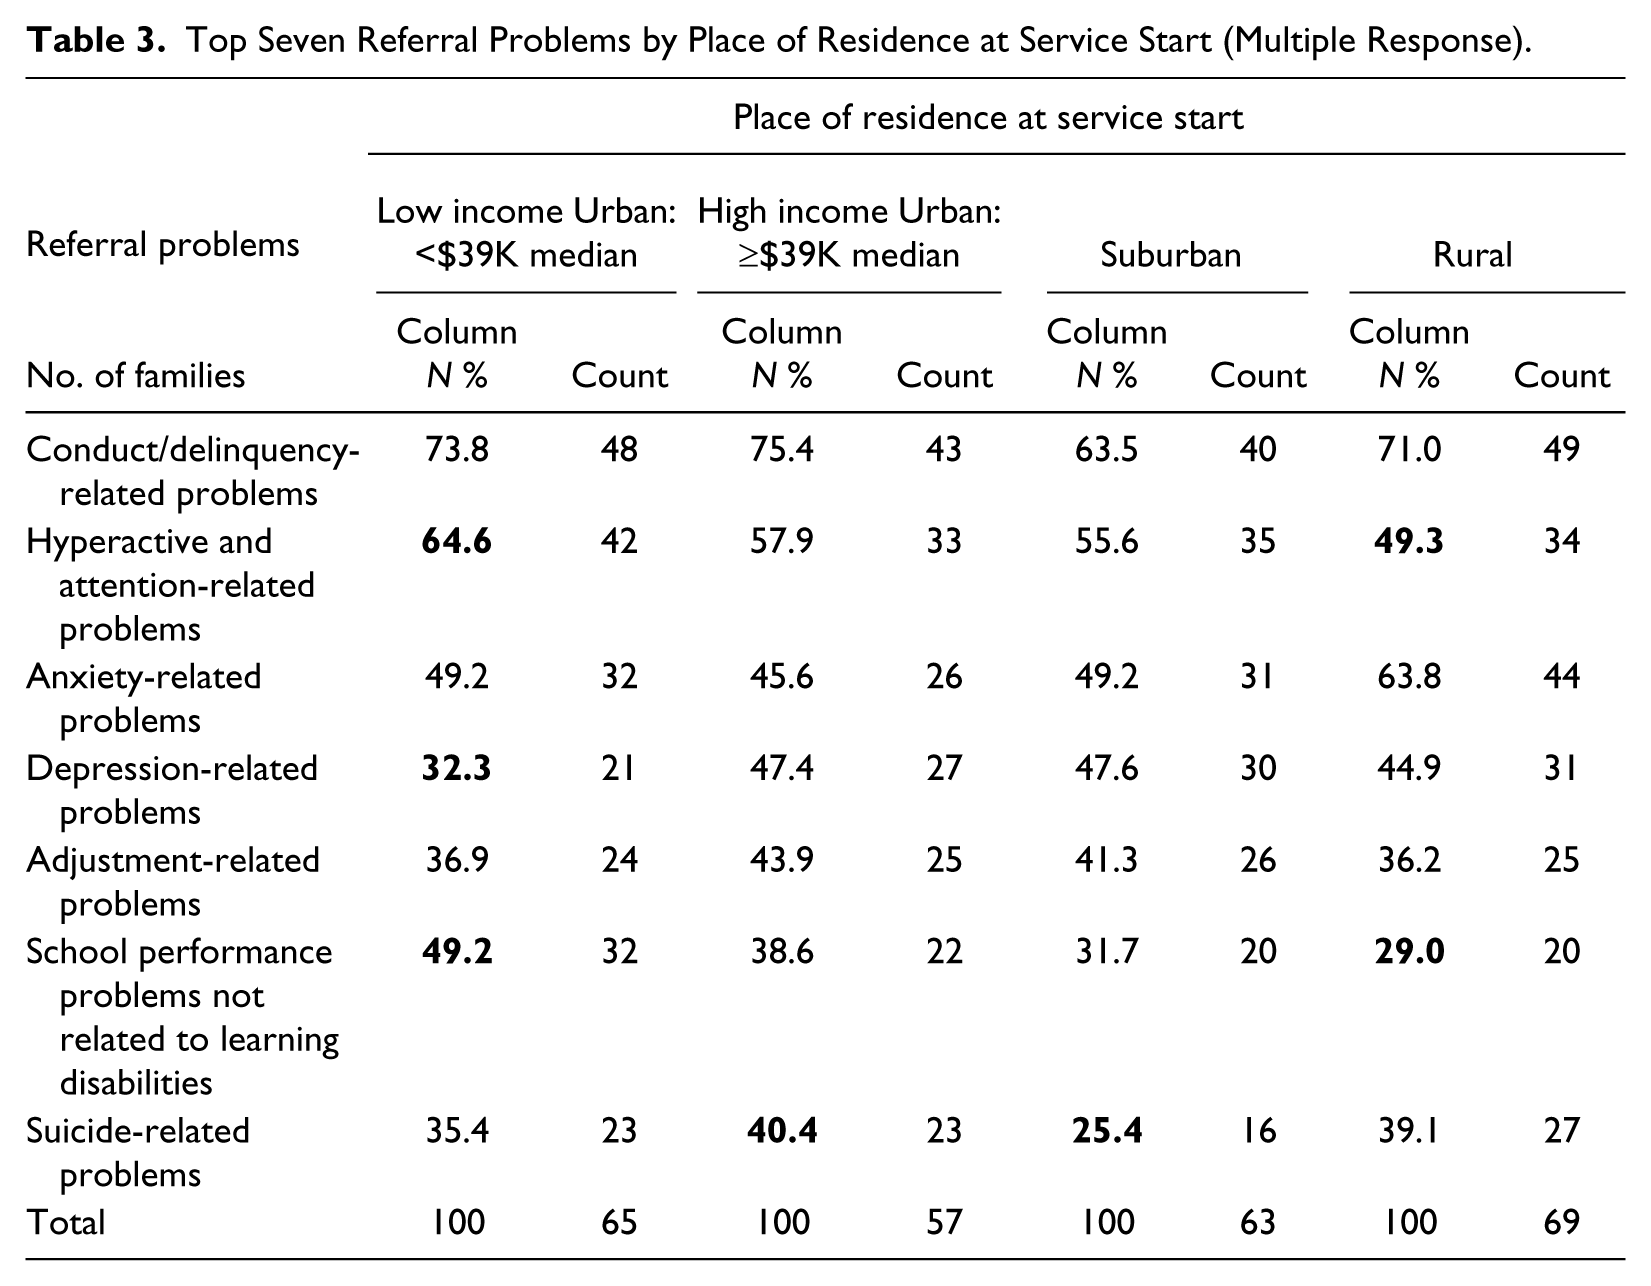
Although there are no statistical differences in referral problems across the place of residence in Monroe County, in accord with national samples of youth, nonwhite youth are more likely to be diagnosed with externalizing rather than internalizing disorders (Muroff et al. 2008, Nguyen et al. 2007). Although we found no statistically significant differences in the proportion of hyperactive and attention-related referral problems and school performance referral problems not related to learning disabilities across place of residence, there are notable differences. The largest proportions occur in the Low Income Urban neighborhoods and the smallest proportions in the Rural neighborhoods, 65% to 49% and 49% to 29%, respectively (Table 3). Children referred for depression-related problems have the smallest proportion in the Low Income Urban neighborhoods (32%). The largest proportion of suicide-related problems occur in the High Income Urban neighborhoods (40%), and the smallest proportion occur within the Suburban neighborhoods (25%).
Top Seven Referral Problems by Place of Residence at Service Start (Multiple Response).
Outcomes
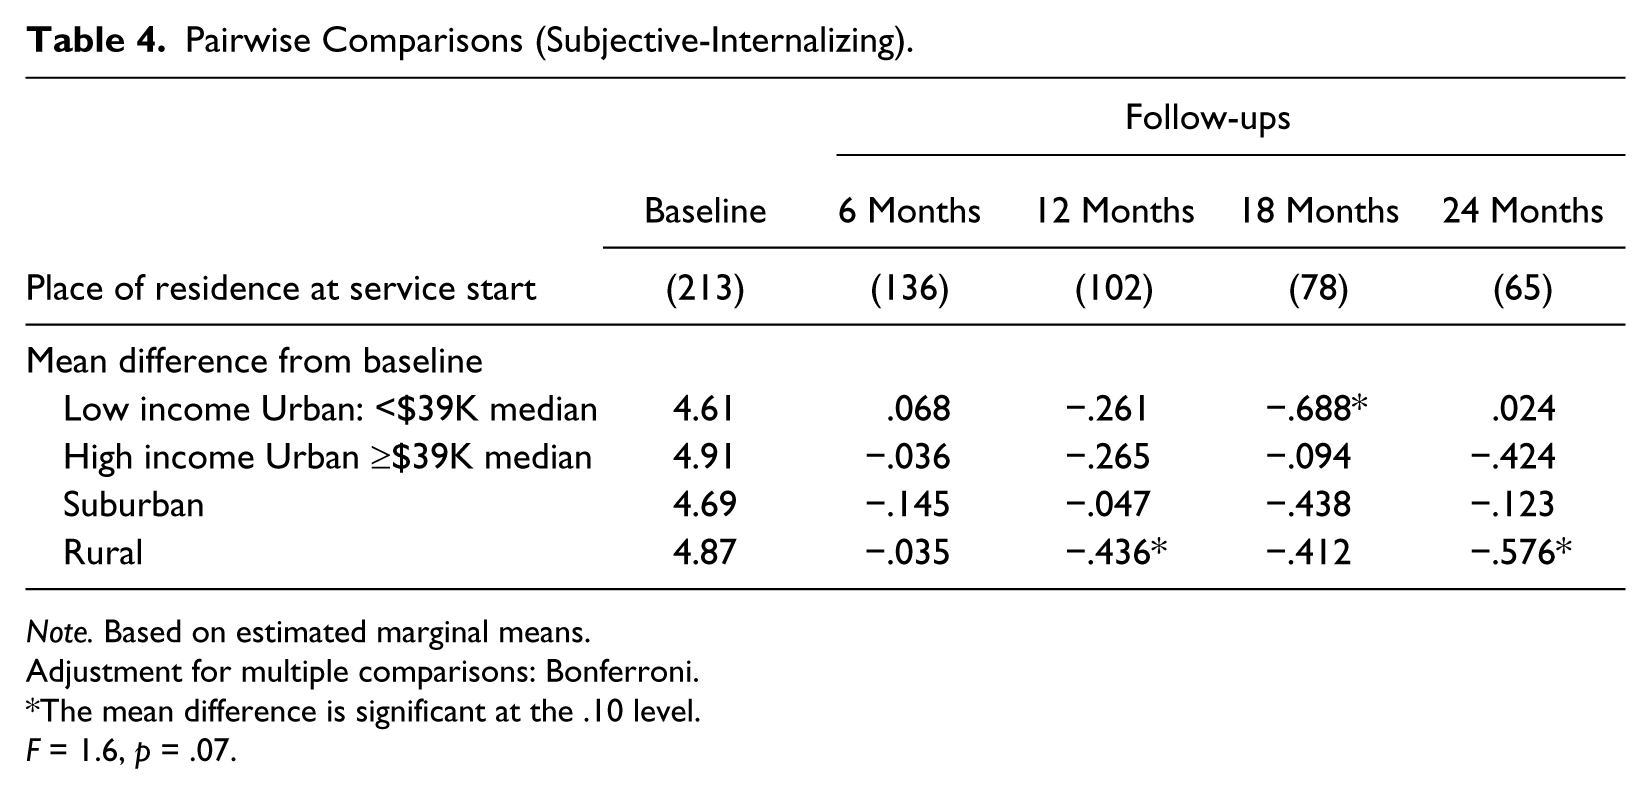
When we controlled for the covariates in each model race had no detectable influence on caregiver strain when place of residence was included. Despite the differences by race observed in our community sample, our results do not support prior findings pointing to race and ethnicity as predictive of caregiver strain (McCabe et al. 2003; Shaw et al. 1997; Shin and Brown 2009). The most pronounced declines in internalized strain, influenced by the interactive effects of time and place of residence (controlling for family members with depression, time spent with friends, and the youth’s standardized overall strength score generated by the Behavior and Emotional Rating Scale, 2nd Edition [BERS-2]) occur among caregivers from Low Income Urban and Rural neighborhoods (Table 4). However, one anomaly shows a significant drop among Low Income Urban caregivers by 18 months, but strain rebounds by 24 months. Conversely, strain declines at a lesser rate among caregivers in High Income Urban and Suburban neighborhoods.
Pairwise Comparisons (Subjective-Internalizing).
Note. Based on estimated marginal means.
Adjustment for multiple comparisons: Bonferroni.
The mean difference is significant at the .10 level.
F = 1.6, p = .07.
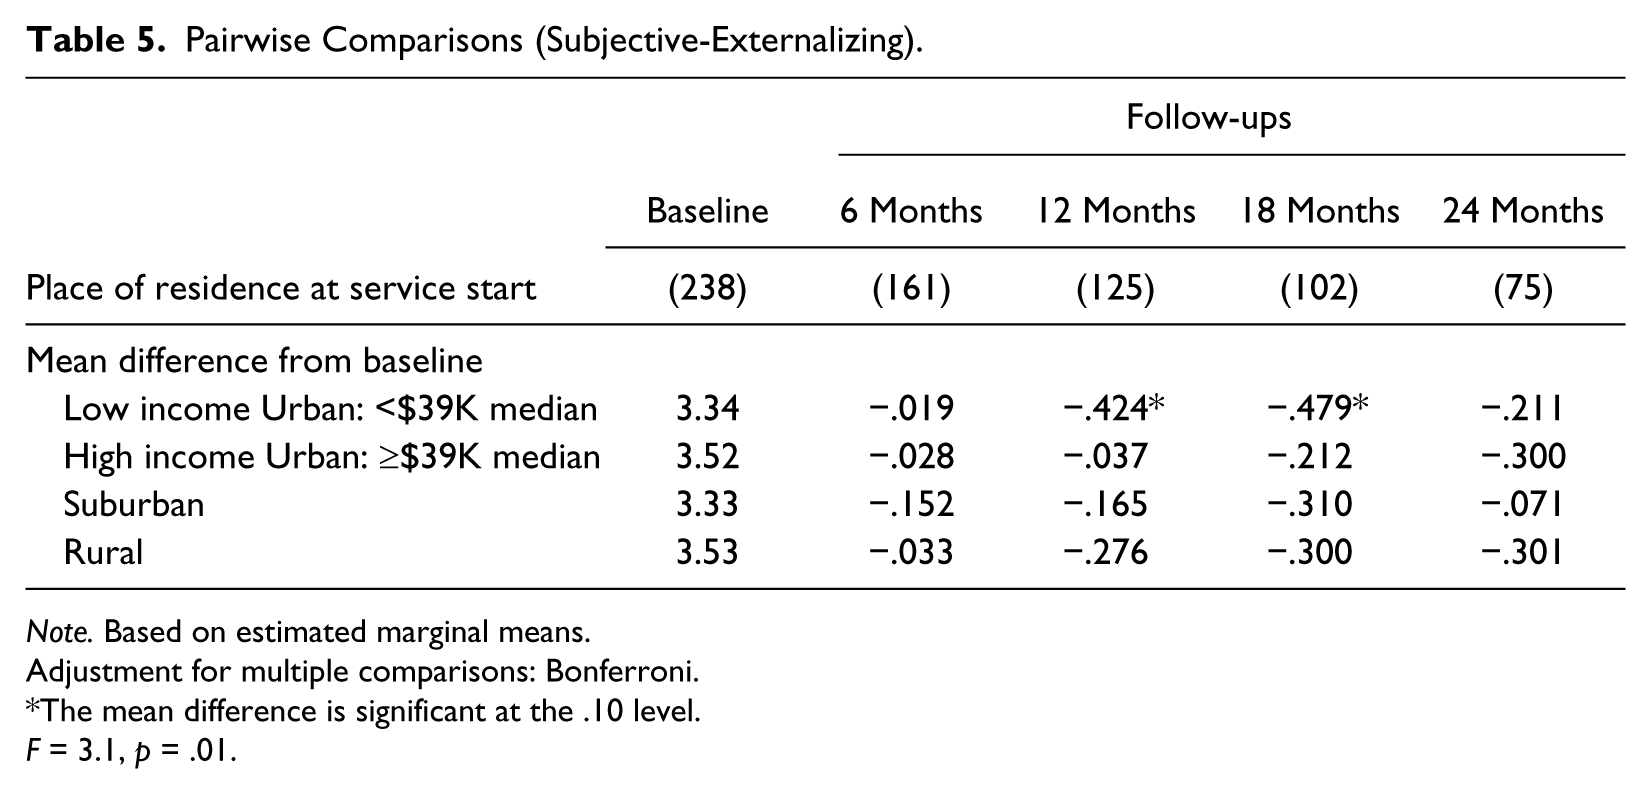
Regarding subjective-internalizing strain, time alone (controlling for family members relying on each other) is the significant predictor, as shown by the downward trend among High Income Urban and Rural caregivers (Table 5). Though Low Income and Suburban caregivers show downward trends, they rebound by 24 months.
Pairwise Comparisons (Subjective-Externalizing).
Note. Based on estimated marginal means.
Adjustment for multiple comparisons: Bonferroni.
The mean difference is significant at the .10 level.
F = 3.1, p = .01.
Finally, time and place of residence (controlling for number of children in the household under age 19), independently, predict objective strain. There are significant declines for all groups, except caregivers living in Low Income Urban neighborhoods, who rebound at 24 months (Table 6).
Pairwise Comparisons (Objective).

Note. Based on estimated marginal means.
Adjustment for multiple comparisons: Bonferroni.
The mean difference is significant at the .10 level.
F = 9.9, p = 0.000; F = 2.5, p = 0.06, respectively.
Discussion
Differences exist across the four places of residence identified in Monroe County, but race did not influence caregiver strain when place of residence was included in our statistical models. This indicates that people are shaped more by where they live, even though race might play a role in where they live. Our findings suggest that reduction in caregiver strain is modest, at best, though there might be dimensions of improvement that we could not measure. There are several areas that providers of services and supports might focus on to more effectively reduce caregiver strain among those caring for a youth designated as having SED. Specific caregiver support services are offered within SOC that are aimed at alleviating the stressors of caring for a child with SED. These supports typically include a family advocate and referrals to community resources. Supports can be individualized to a greater extent to address specific factors influencing the type of strain experienced by a caregiver. Providers might begin by identifying caregiver strain by type and intensity as well as identifying the specific circumstances leading to feelings and concerns associated with each type of caregiver strain. In this way, more targeted interventions can be implemented that may be more likely to reduce strain.
Family characteristics unique to subjective strain include a diagnosis of depression in a biological family member, and whether or not family members rely on each other when problems arise. Providers should directly address depression in sessions with a caregiver, provide education and counseling on coping with mental illness, and facilitate treatment when needed. Counseling to increase family cohesion may also reduce caregiver strain. Caregiver reliance on family members has been found to differ by race and place for types of support sought. African American women rely on family for emotional support and socializing opportunities, whereas white women rely more on neighbors for socializing than family (Gilbert 1998; Jarrett, Jefferson, and Kelly 2010). This suggests that providers should carefully assess a caregiver’s natural support system and enhance connections according to caregiver preference and the type of support needed. Our findings showed that subjective internalizing strain was the most intense type experienced in our community, particularly for families living in High Income Urban or Rural neighborhoods, but it persisted in Low Income Urban and Suburban neighborhoods. It is not only critical for providers to assess caregiver strain, but also to ask caregivers direct questions about their feelings associated with having a child with problematic behaviors, and to identify their specific concerns (Kelley et al. 2012; Larson et al. 2011). Understanding a caregiver’s concerns would help inform the best intervention to reduce the specific feelings of worry, anger, and embarrassment associated with subjective strain such as education about available services, teaching skills helpful for speaking with professionals, and aiding the parenting of youth with difficult to manage behaviors. Since new providers are less likely to involve parents in any treatment sessions, it is especially important to train them in this area (Haine-Schlagel et al. 2012).
One factor influencing both internalizing and externalizing subjective strain is a caregiver’s opportunity to spend time with friends. Resource identification to provide caregivers with more time for self-care activities such as after school care, recreational activities, and respite services could be utilized to address this area. For caregivers experiencing negative feelings toward the child (i.e., subjective internalizing strain), providers could examine the youth’s severity of functioning, indicated by the BERS-2 scale. The scale consists of five subscales: interpersonal strength, family involvement, intrapersonal strength, school functioning, and affective strength (Epstein et al. 2004). Interventions should target specific deficit areas identified by subscale scores.
Caregivers from Low Income Urban neighborhoods demonstrated a rebound in intensity of subjective strain after an initial decline suggesting that broader efforts beyond the family level need to be made to create an environment that supports the youth’s progress. Assessment of the Urban environment in which youth navigate may reveal other areas of intervention such as the level of violence, and amount of trash and community decay, which negatively impact youth functioning and mental health (McIntyre 2000). Creating safe places for youth to go and improving the youth’s ability to navigate specific risks posed by certain buildings, persons, and situations could provide youth with resources to lessen the risks on their functioning posed by the environment (Anderson 1990).
This brings us to the influence of neighborhoods on caregiver strain. We know that neighborhood qualities, such as collective action, have a positive impact on the perception of support by parents (Tendulkar et al. 2012). However, the poor often have fewer ties to their communities than others. For example, Gilbert (1998) found that African Americans in Worcester, Massachusetts, were more likely to depend on social networks related to work than neighborhood-based networks, compared with poor white women. Even so, African American women were still more likely to depend on church-based social networks for economic support, whereas white women were more likely to develop neighborhood-based ties. Interventions that focus on building relationships between neighbors, particularly among African Americans, would provide caregivers with a greater sense of neighborhood support (GGPPFF, forthcoming). Providers can assist families by linking them to resources in their communities such as supports available through the schools, churches, and neighborhood groups. Although these actions may not reduce caregiver strain, at the very least these social connections would provide parents with higher rates of life satisfaction that might reduce depression, anxiety, and sleeping problems (Munsell et al. 2012).
Regarding Rural caregivers, they demonstrated significant decreases in feelings of guilt and worry (i.e., subjective internalizing strain) over time. This might be due simply to their receiving services for their child, as Rural communities often lack mental health services (President’s New Freedom Commission on Mental Health 2003). Not knowing where to get help for your child is associated with caregiver strain (Larson et al. 2011).
Place of residence predicted objective strain (i.e., experiences of interruption of personal time, lost work time, and financial strain associated with caring for a child with special needs), which is influenced by the total number of children under the age of 19 in the household. The demands of caring for multiple children are evident across place of residence for our community. Caregivers in the Low Income Urban neighborhoods did not maintain a significant reduction in objective strain over time. This is certainly influenced by the societal structures that reinforce social inequality, racial differences, and a lack of job opportunities. Providers need to be sensitized to the effects of these experiences on minority caregivers and approach their work with a broader lens that does not exclusively focus on the individual as the only source of intervention (Thompson-Miller and Feagin 2007).
This study was one of the first to identify specific factors influencing the strain experienced by caregivers of children designated as having SED. Our evaluation results suggest that larger studies be conducted to more definitively identify any unequal impacts of caregiver strain among caregivers in different types of neighborhoods.
Footnotes
Authors’ Notes
An earlier version of this paper was presented at the University of South Florida: Children’s Mental Health and Policy Conference, Tampa, Florida, 2012.
Declaration of Conflicting Interests
The author(s) declared no potential conflicts of interest with respect to the research, authorship, and/or publication of this article.
Funding
The author(s) disclosed receipt of the following financial support for the research, authorship, and/or publication of this article: This study was supported by SAMHSA Grant SM57043.