
Abstract
Applied social science projects that involve many interviews produce a vast amount of data or text that is difficult to structure and analyze systematically. Computer-assisted qualitative data analysis software is too advanced and sophisticated when all we want is to sort and structure the text. A new method, using Microsoft Word and Excel, has been developed. The method produces a flexible Word document of interview data separated into logical chapters and subchapters. All text is coded, and the codes correspond with headings in the final document. Systematic manual coding ensures that all the content is coded, not just words or terms that are extracted from the text. After several years of using and refining the method, both in projects with relatively few interviews and in those with more than 100, I believe that the method is efficient when there are four or more interviews. The method is also suitable for coding and structuring answers to open-ended questions in Web-based surveys. The coding may be performed by a supervised research assistant or a multidisciplinary analytical team, depending on the complexity of the problem. The purpose of the method is not to quantify qualitative data but only to sort and structure large amounts of unstructured data. The method consists of 10 steps, screenshots of which are included in the paper.
In large research projects, we often interview many respondents. Large amounts of text data are produced when the interviews are transcribed, often amounting to several thousand pages of text. Very often, we are not interested in testing existing theory, but rather in suggesting improvements in various systems based on the experiences reported by many respondents. Such projects typically answer very broad problems, for instance, how a social security scheme works according to actors in the labor market or how health services can be improved to better meet the users’ needs based on interviews with patients, their families, and health personnel. We may use a general inductive approach instead of a deductive approach, as there is often no specific existing theory or hypothesis to be tested (Thomas 2006).
Although we develop interview guides based on existing theories or those we develop, it may be difficult to define the limits of the problem that we study. However, applied researchers often operate close to the field and use their knowledge to gradually narrow down the topics that need to be covered in the interviews to answer the research questions. Typically, the initial interviews are wide ranging and last for several hours. Gradually, as the researchers come to better understand the framework conditions and the operating parameters, the interviews become more focused on the specific study question.
Computer-assisted qualitative data analysis software (CAQDAS) is increasingly being developed. The first specially designed qualitative software program, “Non-numerical Unstructured Data Indexing Searching and Theorizing (NUD*IST),” was introduced in the 1980s (Richards 2002). NVivo, a currently popular qualitative data management program, has its roots in NUD*IST. NVivo software supports qualitative and mixed-methods research. It is designed to organize and provide insights into unstructured or qualitative data such as interviews, open-ended survey responses, articles, social media, and Web content. It is a sophisticated program that does much more than simple coding; it also provides tools to facilitate thinking, linking, writing, modeling, and graphing (Bazeley and Jackson 2013). Other popular programs are ATLAS.ti, MAXqda, and N6. ATLAS.ti also includes highly sophisticated tools to help the researcher manage, extract, compare, explore, and reassemble meaningful segments of information from large amounts of data (Friese 2014). MAXqda includes a wide range of functions to analyze interviews, reports, tables, online surveys, focus groups, videos, audio files, literature, images, and other sources (Maietta 2008). The N6 program also has roots in the original NUD*IST, but is a simpler package. N6 may be easier for the less information technology (IT) literate to learn unless the unfamiliarity of the interface is seen as a barrier (Tagg 2011).
However, no software can actually analyze qualitative data; only the human mind can do that (Faherty 2010). NVivo and all other CAQDAS are basically data management packages to support the researcher during the data analysis process (Zamawe 2015). The CAQDAS core functionality is rather simple: coding, retrieving, and recoding text fragments (Lewins and Silver 2007). Several of the tools in the CAQDAS appear controversial because they exceed the limits of qualitative syllogism logic, such as displaying quantified information from qualitative data (Schönfelder 2011).
An interview lasting for approximately one and a half hours will result in a transcribed document of about 30 pages. Therefore, 50 interviews yield approximately 1,500 written pages, which is a sizable amount of data. It is not uncommon to conduct 50 interviews in a large applied social science project, so finding an efficient way of structuring the resulting data seemed like a good investment.
The available CAQDAS did much to help in structuring the text but it was too advanced for my purpose, because all I wanted was to sort and structure the text in an efficient manner. I then started looking at functions in standard office programs that could help.
Several researchers have shown how standard office programs may be used in qualitative data analyses. Microsoft Word tables (La Pelle 2004) or Microsoft Word macros (Ryan 2004) can be used for the coding and retrieval of interview data. Others have shown how Excel can be used for qualitative analysis using conditional formatting and other functions (Amozurrutia and Servos 2011; Meyer and Avery 2009). Other researchers have developed methods for using relational database management technology with Microsoft Access (Pruijt 2012). Microsoft Office is used by millions around the world and the program packages always include Word and Excel. An easy method for systematic coding and structuring interview data based on basic functions in Word and Excel may be useful to many researchers and students.
With this in mind, the purpose of this paper is to present a simpler way of coding qualitative data and to sort all of the text in proper chapters and subchapters rather than trying to analyze the data using complex, very powerful, and sophisticated software.
Method
The method involves only Microsoft Word and Microsoft Excel. The text is transferred from transcribed Word files into Excel, and by using a few common Excel functions, the text is organized for coding. After coding in Excel, the data are sorted by content and transferred back to Word. The text is separated into chapters and sections because the actual codes are transformed into headings in the text. The structure in Word (Heading 1, Heading 2, and Heading 3) is used to structure the text into main categories, topics, and subtopics.
In the resulting Word document, all quotes include information, such as place of the interview, role of the respondent, and where in the interview the text sequence is found. The question asked by the interviewer appears immediately in front of the quote.
With all quotes on the same topic and subtopic collected in the same place in a document, it is relatively easy to read through the text on a specific topic and write an introduction based on what all the respondents have said. The quotes are already in the document, so it is easy to evaluate them and choose which to use in the text: the most common, most accurately formulated, or those that provide the most important knowledge. This will vary from study to study.
The method includes the following 10 steps:
Collect the data.
Transcribe the audio files.
Transfer the text from Word to Excel.
Prepare the Excel document for coding.
Code in Excel.
Prepare the coded interviews for sorting.
Sort the data.
Transfer quotes and references from Excel to Word.
Sort the text into a logical structure based on the coding.
Analyze the data.
Collect the Data
All interviews must be recorded. Make sure that the equipment produces good sound quality that enables a high level of accuracy in transcriptions. A structured or semistructured interview guide may be used, or the researcher could choose to have a discussion with the subjects rather than following an interview guide. In qualitative interviewing, “rambling” or going off at tangents is often encouraged as this might give insight into what the interviewee sees as relevant and important (Bryman and Bell 2015). This method captures the unstructured nature of interview data, as it is not at all necessary to follow an interview guide. This methodology is also appropriate in more narrative interviews, for instance, where the aim of the research is to collect experiences in relation to a chosen subject from many respondents.
Transcribe the Audio Files
Trained research assistants should transcribe the interviews from the audio files. The important point when transcribing the interviews using this method is to start all quotes with “I:” for the interviewer and “R:” for respondents, or similar labels. The colon is important, although it does not matter what precedes or follows it. When transcribing focus group interviews, one may give each participant a letter or name, but it may be difficult and time-consuming for the assistants to distinguish between the voices, and the cost must be weighed against the gain. However, at the very least, the transcriber must always distinguish between the interviewer and the respondent.
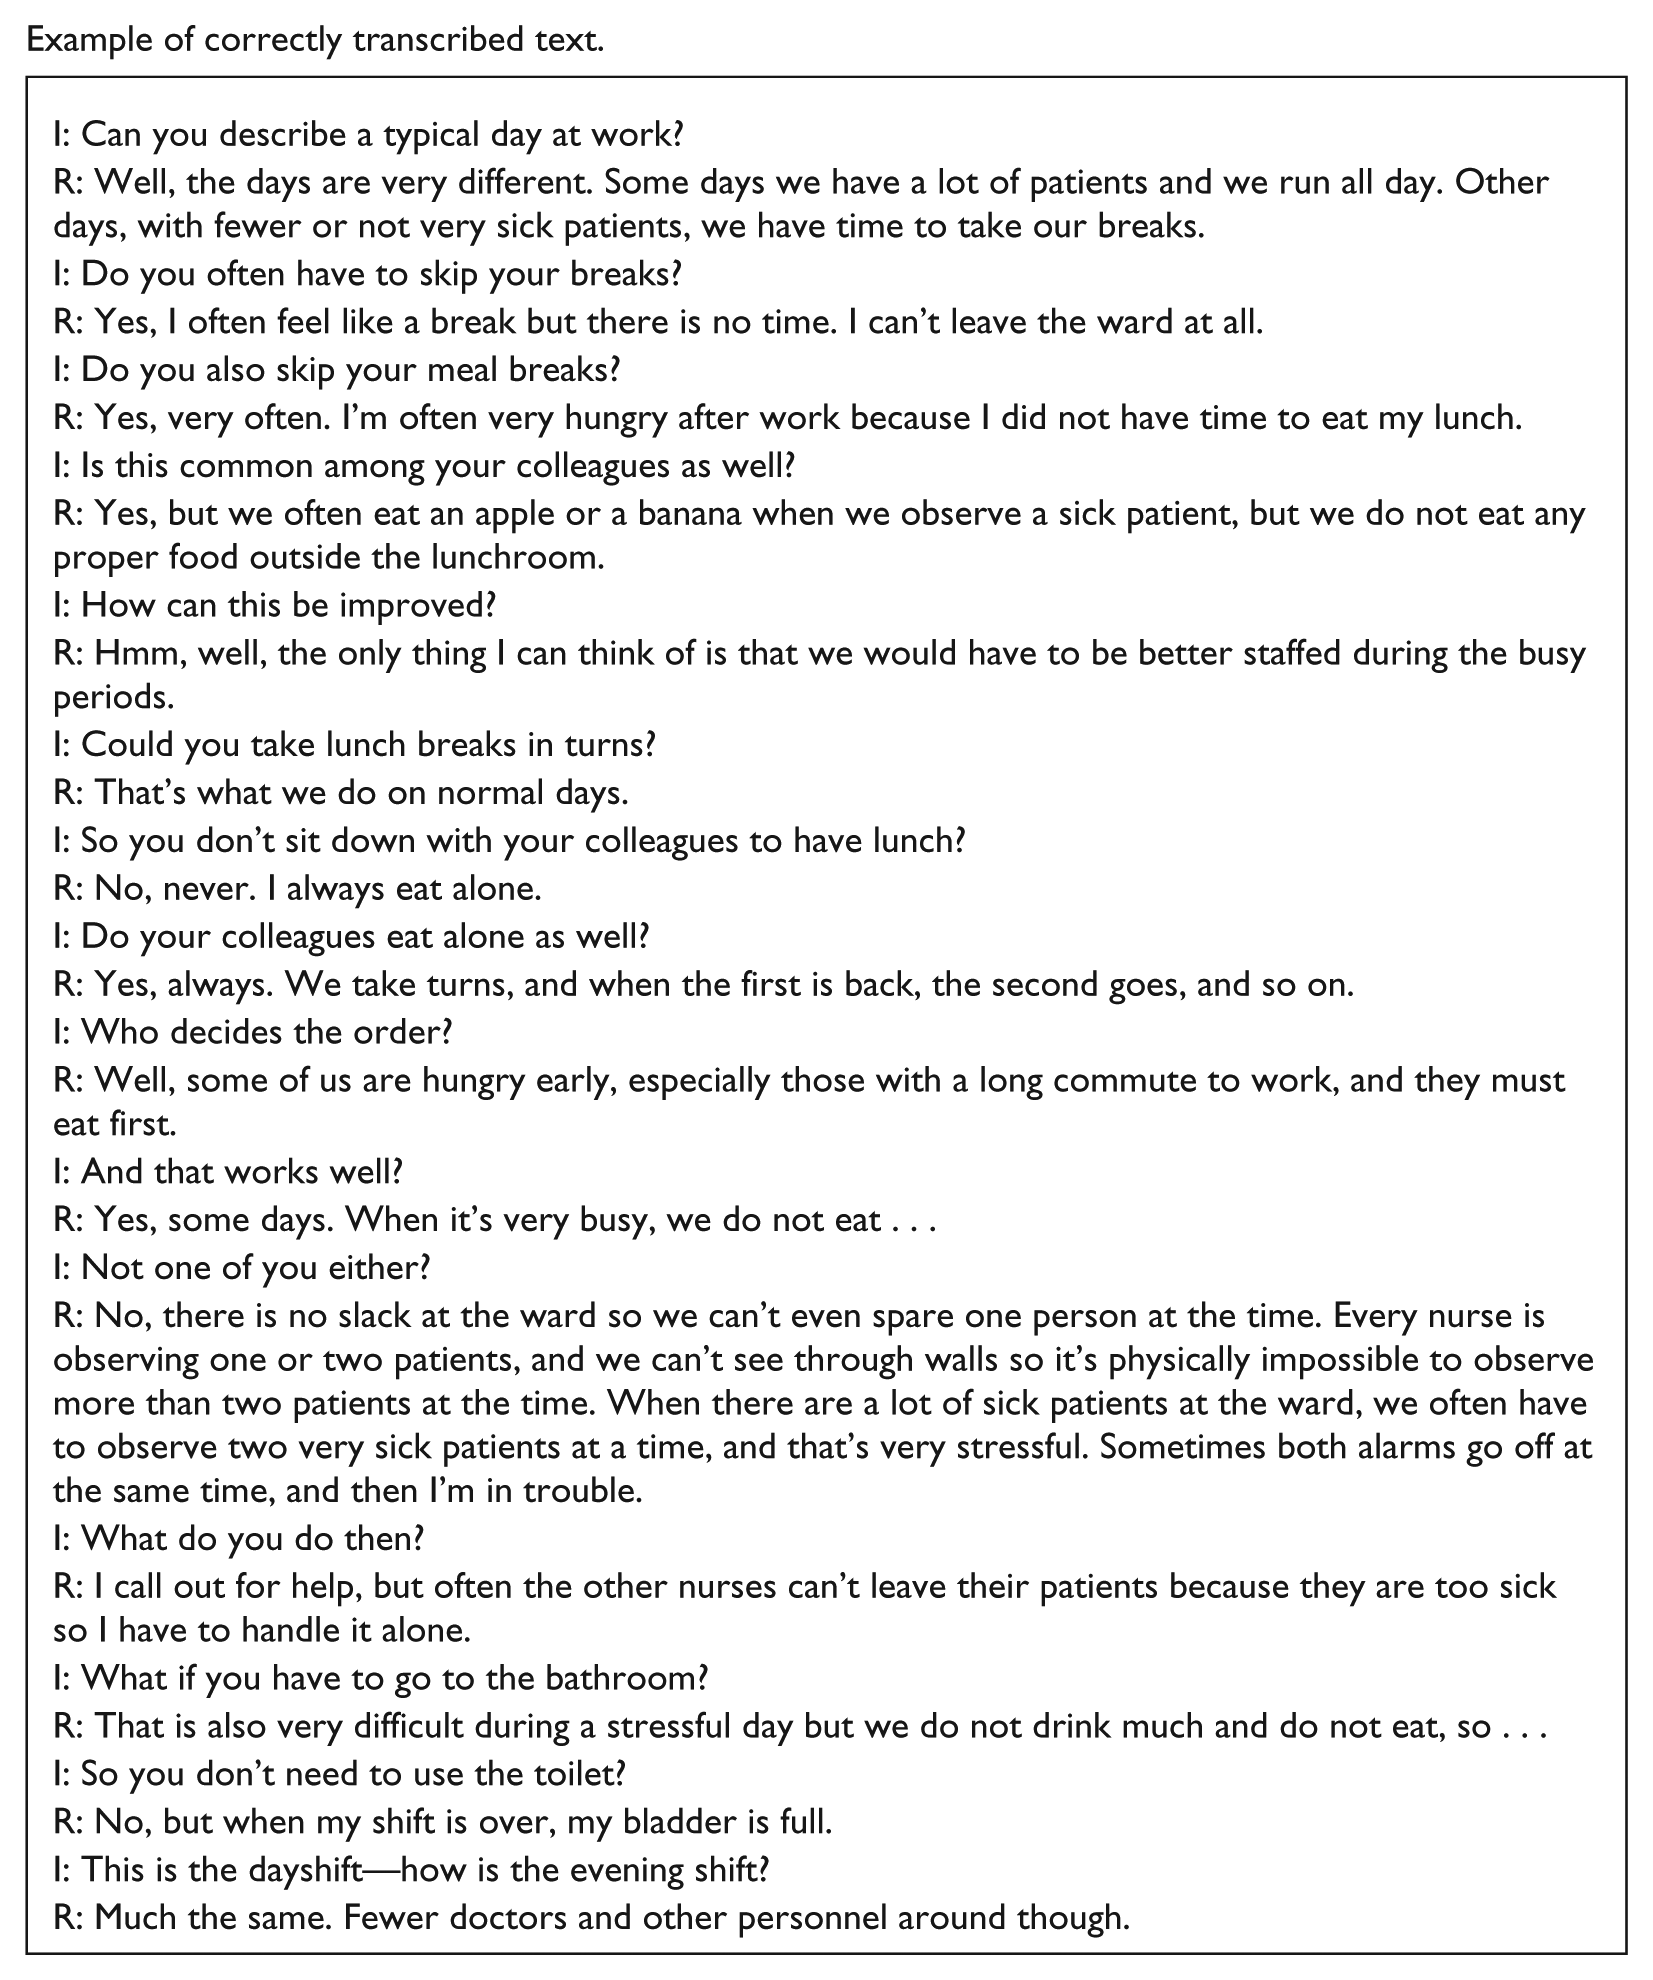
Example of correctly transcribed text.
In the instructions to the transcribers, we emphasize the importance of not using line breaks inside quotes, and of using a colon only as a separator and not in the quotes. The document should be inspected to make sure there are no other colons before transferring the text from Word to Excel. Each interview should be kept in a separate Word file, and a list made in which all interviews are numbered.
Transfer the Text from Word to Excel
Now all text from the transcribed interviews must be transferred to Excel.
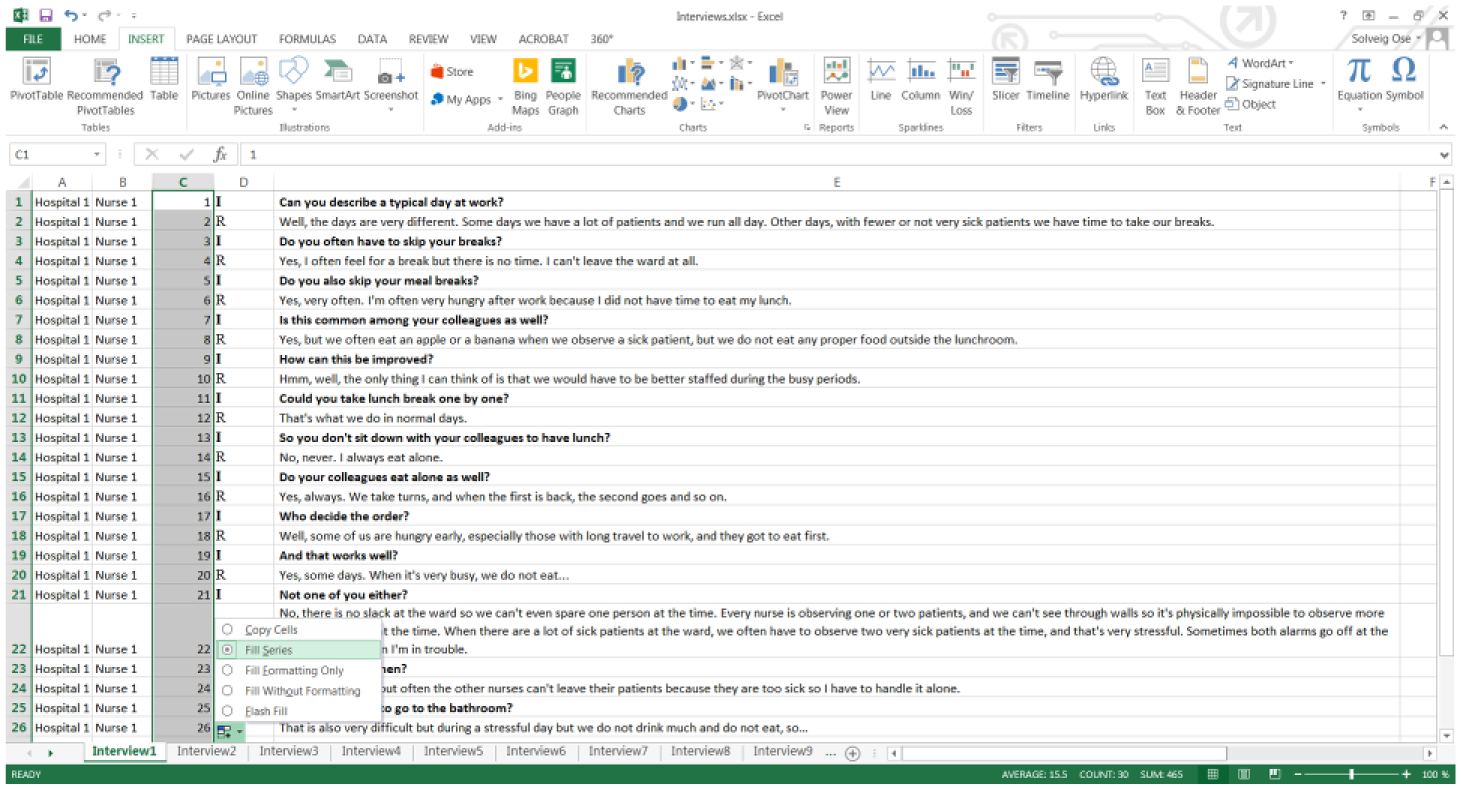
Create a new document in Excel (a blank workbook). Save it as Interviews.xlsx (or whatever is most suitable). Copy all the text from the first interview from the Word file (the order of the interviews is not important) and paste it into the top-left cell of a sheet in the Excel workbook. If the transcribed interviews include a heading or something before the quotes, this should not be copied into Excel.
Now all the text appears in the first column of the Excel sheet. Select all items in the column, click on the “Data” tab, choose the “Text to Columns” option, and choose “Delimited,” click “Next,” and then “Other,” and insert a colon. Then the text is separated into two columns—one for the speaker (interviewer I or respondent R) and one for the quote. There may now be a lot of white space in the sheet. To clean this up, select all items in the sheet by placing the cursor at the top left of the sheet (in the frame) and click. The sheet is now selected. Place the cursor between Rows 1 and 2 (on the left-hand side of the frame of the sheet), and double-click. The text is now neatly shown, but the B column is too wide. Select all items in the column, right-click the mouse, choose “Format Cells,” and “Alignment,” then “Wrap Text.” Drag the B column to a suitable width and clean up the text again as described above if necessary.
Copy and paste every interview into a different sheet of the workbook. Each sheet has a number: Sheet 1, Sheet 2, and so on, which could correspond to the number or name of the interview (1, 2, etc.). The order of the sheets does not matter. The result should look like Figure 1.
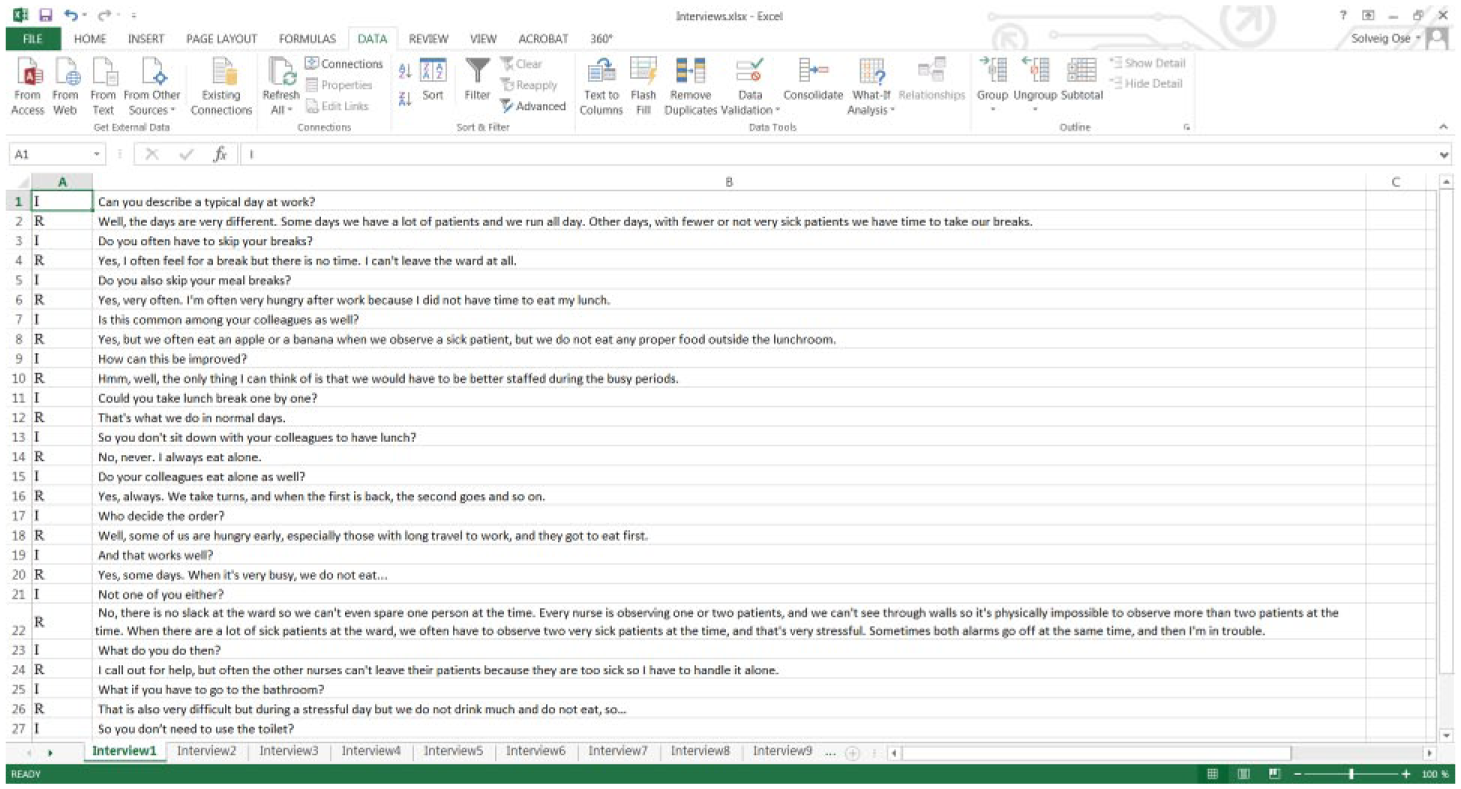
Example of transcribed text in Excel.
Scroll through all sheets and make sure there are no empty cells in the B column before the end of the text.
When all interviews have been placed in a sheet in this way, the text has now been transformed into a format that is suitable for coding and sorting. 1
Prepare the Excel Document for Coding
It is useful to have a different format for the questions and the answers to provide a better visual overview of the text (Figure 2).
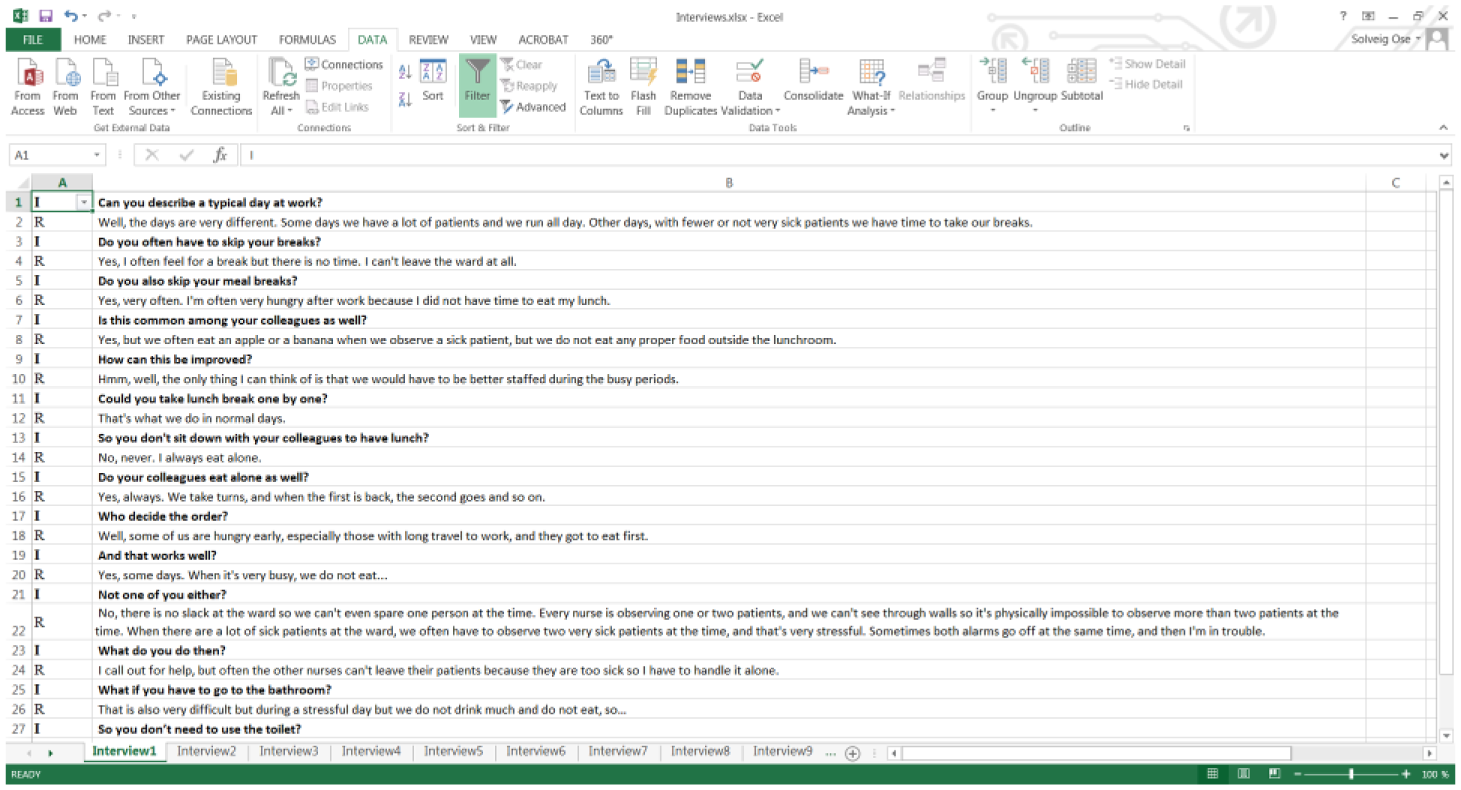
Filter on interviewer/questions asked and format questions in bold font.
Select the first column and filter for “I” (choose Data, Filter, and tick the “I” box).
Select all items in Column B and make the text bold (Home, Font, Bold) and clear the filter (Data, Filter, Clear). Now the questions are bold, but the answers are not. However, one could choose to keep the answers bold, but I prefer to have the questions in bold format. This format is retained when the text is transferred back to Word.
Code in Excel
Coding is a crucial stage of qualitative data analysis and an important step of the method. The coding process itself is a topic beyond the scope of this paper but much literature is available on the topic (Auerbach and Silverstein 2003; Flick 2014; Saldaña 2012).
Depending on the type of project and problem at hand, a single researcher or a multidisciplinary analytical team can conduct the coding. A multidisciplinary analytical team can generate unique insights from differing perspectives, engage in critical discussions of unclear or subjective data, and ensure consideration of multiple interpretations of the data (Curry, Nembhard, and Bradley 2009).
In this method, the code list is created consecutively. The coder does not have to follow the interview guide, and usually ends up with something much more detailed than the interview guide would provide. The coding is not done on main themes and subtopics, but at this stage there are just flat codes. The structuring of codes into main categories, topics, and subtopics is done in Word; see Step 9. A question and answer should be given the same code (see Figure 3).
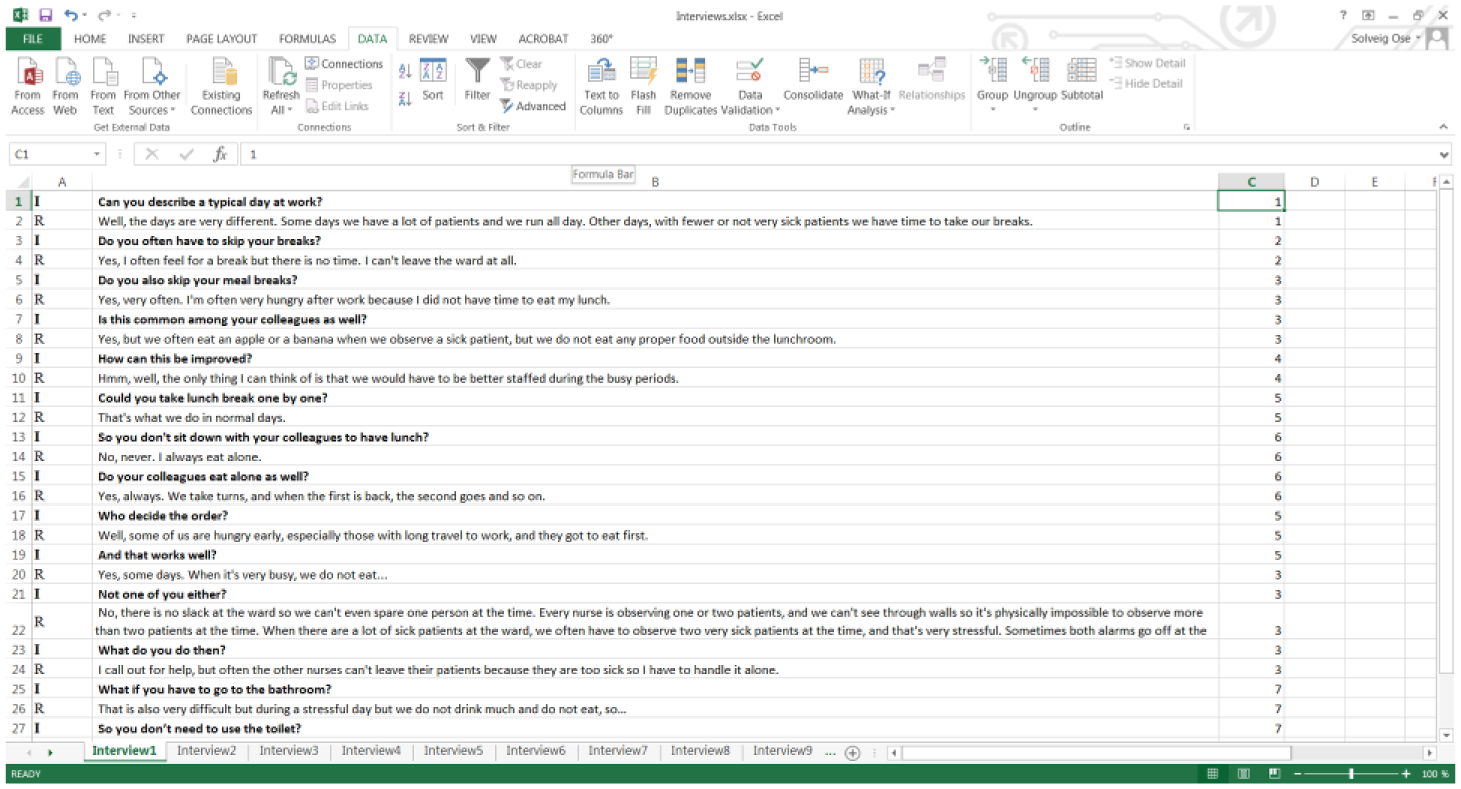
Code in Column C.
It is up to the researcher to decide how detailed the codes should be, but experience suggests that it is better to produce a rather detailed code list because it is easy to reduce the number of codes in Step 9. If one quote contains information on more than one code, the row may be copied and given separate codes. This is often necessary, as one quote may cover more than one topic.
In a separate sheet called “Codes,” keep a list of the codes used. This sheet has two columns, the first for the text describing the code and the second for the code number (1, 2, 3, etc.). The text could be one or more words describing the theme. A common first code is “Presentation,” wherein the subjects describe their position, tenure, formal responsibilities, and other details. The second code may be whatever occurs after the presentation in the first interview that is coded. The order of the codes does not matter, and is simply a result of which interview the coder starts with (Figure 4).
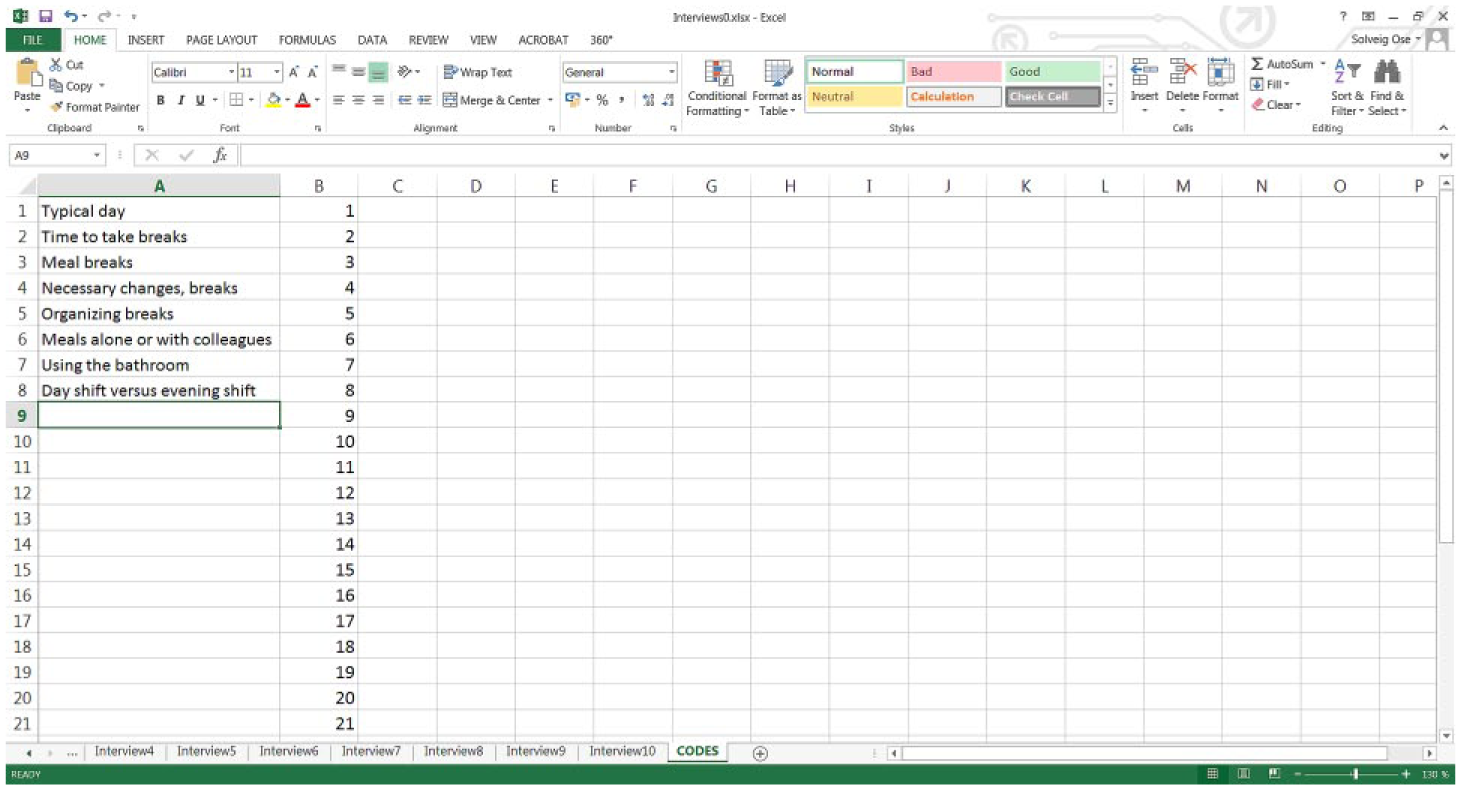
Example of a simple code list.
The number of codes increases sharply during the first few interviews, but by then most of the content is usually covered, and the coder then only adds new codes as they are needed throughout the coding process. After coding a few interviews, it is always necessary to go back to the first interview, examine the coding, and make any necessary adjustments. This is usually done several times. When the growth in the coding list slows, print out the list or keep it on a separate screen to locate easily which code to use.
Inane or insignificant quotes may be given a separate code. I use “999.” These quotes thus appear at the bottom of the file in Step 7, and may be inspected and deleted before the data are transferred into Word to reduce the quantity of data.
The coding is time-consuming in the beginning, but after a few interviews, the speed increases. The number of codes will vary from study to study, but typically in my projects, I end up with 80 to 120 codes. However, when the data are structured in Word, the codes are organized into main topics and subthemes in about seven to 10 chapters, with five to eight subchapters in each, and even sub-subchapters below that.
Now you have what you need to start the coding process, and you should now code all interviews. The interviews are kept in separate sheets throughout the coding process.
Prepare the Coded Interviews for Sorting
This step includes the following objectives:
Define respondents.
Keep track of the sequence in each interview.
Combine all interviews in the same sheet.
Link the information in the columns to the quotes.
Include the code list in the same sheet as the coded interviews.
Define respondents
We need to keep track of each interview so that we know who said what. Insert some columns (select Column A and right-click the mouse buttons, then insert) at the left of each interview sheet and give them a proper identification text. In the example, 10 nurses at two hospitals were interviewed. Two columns are used to identify the respondents, that is, hospital number and nurse number.
Keep track of the sequence of each interview
To retain the structure of the interview, a sequence variable, numbered 1, 2, 3, and so on, must be included. Enter 1, 2, and 3 into the first three cells starting from the top, highlight these, double-click on the bottom-right corner or drag it down (place the cursor at the bottom right of the highlighted cells) and fill the series all the way down to the last row. Make sure that all rows are included. This is to keep track of the sequence of the text (Figure 5). Do the same for all interviews. The result is now that each sheet has six columns with text or numbers. These sheets will now be combined.
Create the sequence variable.
Combine all interviews in the same sheet
Copy the first coded interview (include all six columns) into a new sheet, call this sheet “Combine.” Drag out the E column as necessary. Then take the second coded interview, copy all six columns and paste it into the same sheet below the first interview. Make sure to keep the formatting when the data are pasted. Do this with all interviews until they are all stacked on top of each other in the same sheet. Delete Column D, because it is no longer required.
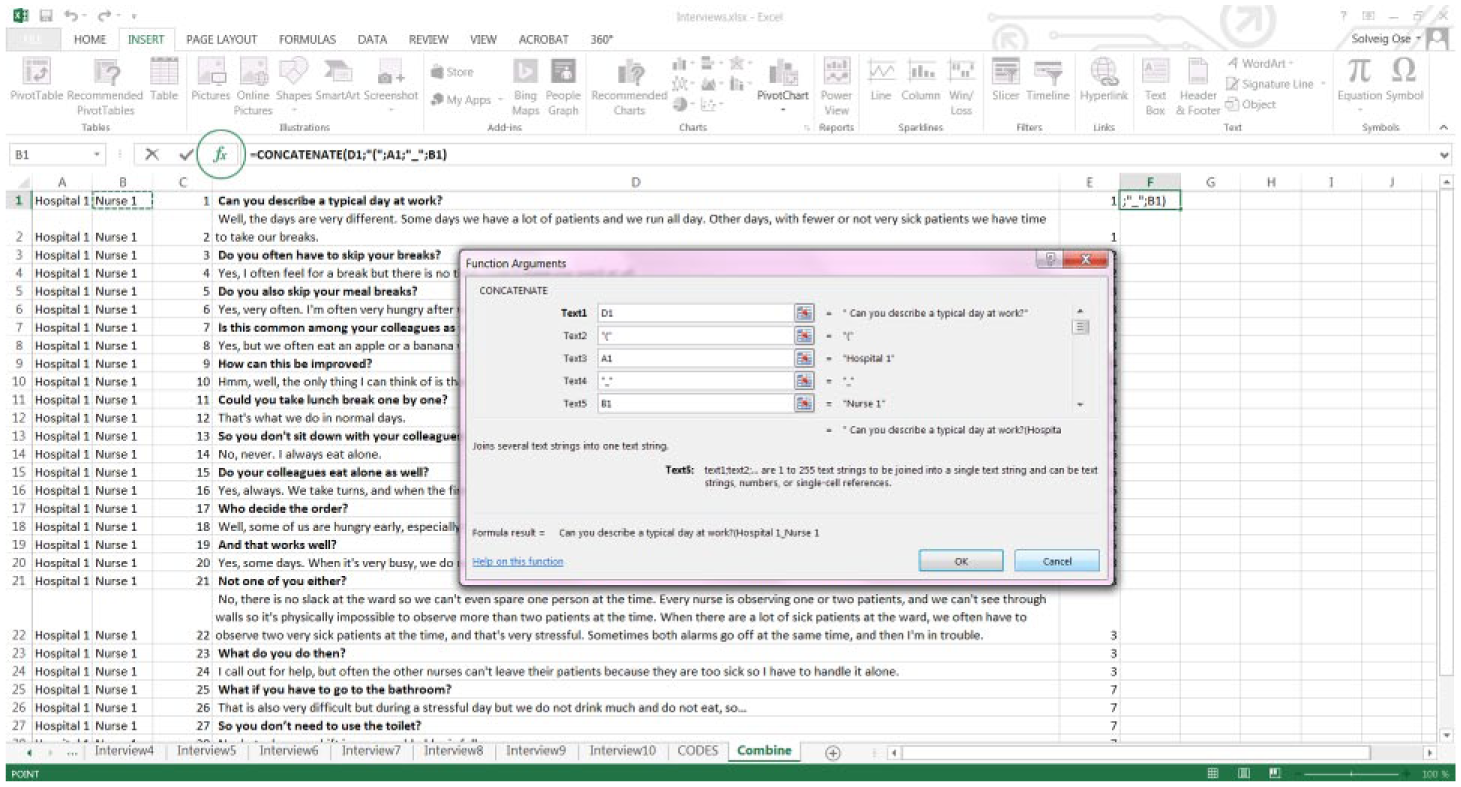
Link the information in the columns to the quotes
The information in Columns A, B, C, and D will now be combined. Place the cursor on cell F1 and click “Insert Function” (the fx symbol shown in Figure 6). Choose “Concatenate.” Using this function, the quote may be combined with information about the interviewee (ID, place, position, etc.) and where in the interview the quote appears (using the sequence variable in Column C) so that the information about the interviewee is attached to the quote in parentheses.
Concatenate/link the cells.
In Text6, just add a space. In Text7, click on the C1 cell, and finally in Text8, include the end parenthesis. Then click “OK.”
Here, you could add any information you want to link to the quote, for instance, the name of the interviewer or when the interview was conducted. In the example, the following appears in the F1 cell: =CONCATENATE(D1;”(“;A1;”_”;B1;”_”;C1;”)”). Fill down the formula so that all rows with text are covered. 2
Now, the format must be copied from Column D to Column F to make the text on the right bold (Figure 7). Select Column D, click on the brush (“Format Painter” on the Home menu), then select Column F and the format is copied.

Copy the format from Column D to Column F.
Then copy Column E into Column G to obtain the codes on the right-hand side of the quotes containing the parentheses with interview information. Then hide Columns D and E (Select all items in the columns, right-click, and select “Hide”).
Include the code list in the same sheet as the coded interviews
Go to the Codes sheet and underline all text (Figure 8).
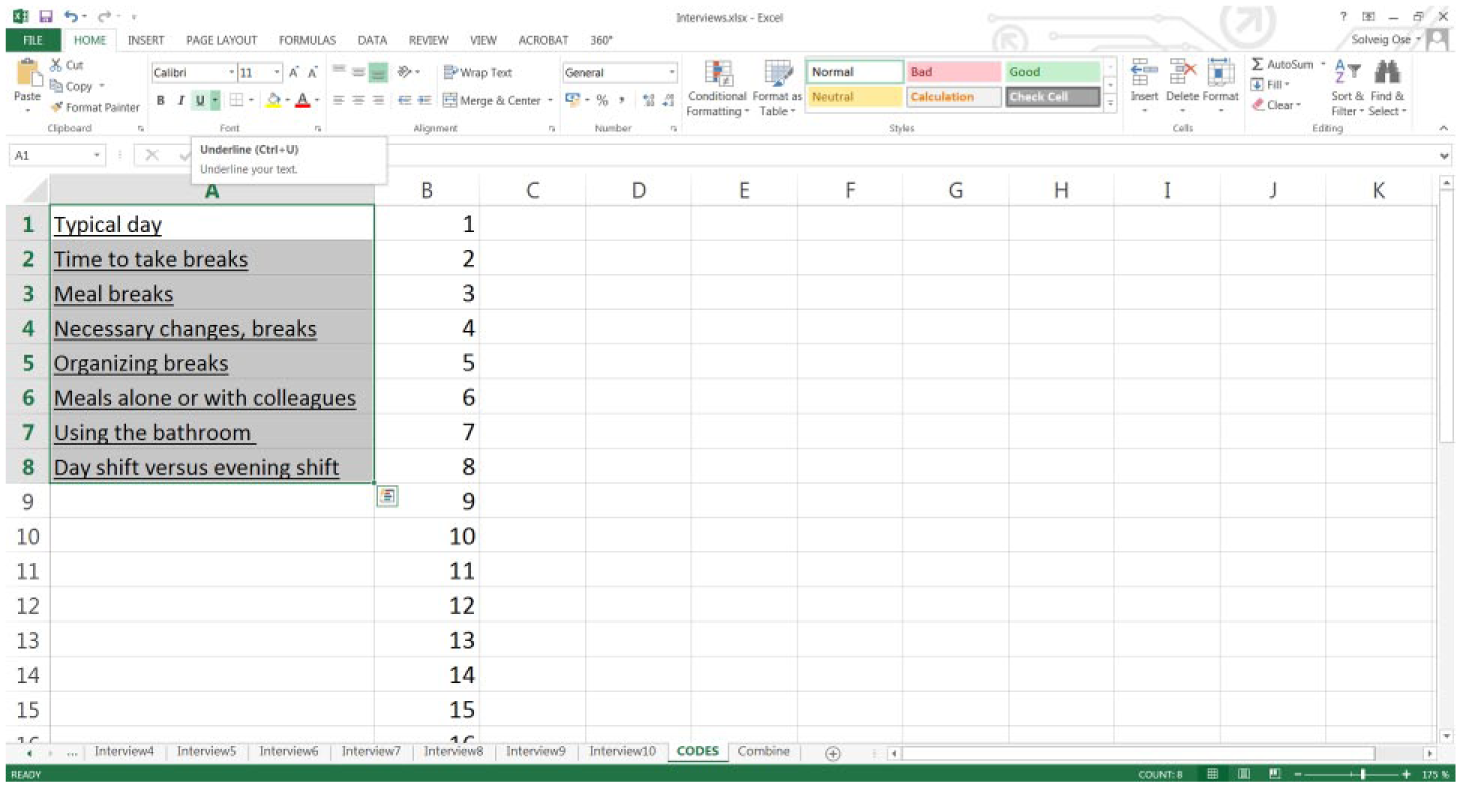
Format the code list.
This formatting is important, as this will provide the headings for the Word document that will be created in Step 8. Copy all the codes into the bottom of the worksheet called Combined (below the last interview) where all the coded interviews have been gathered, retaining the formatting when pasting. The text for the code must be placed in Column F and the code itself in Column G (Figure 9).
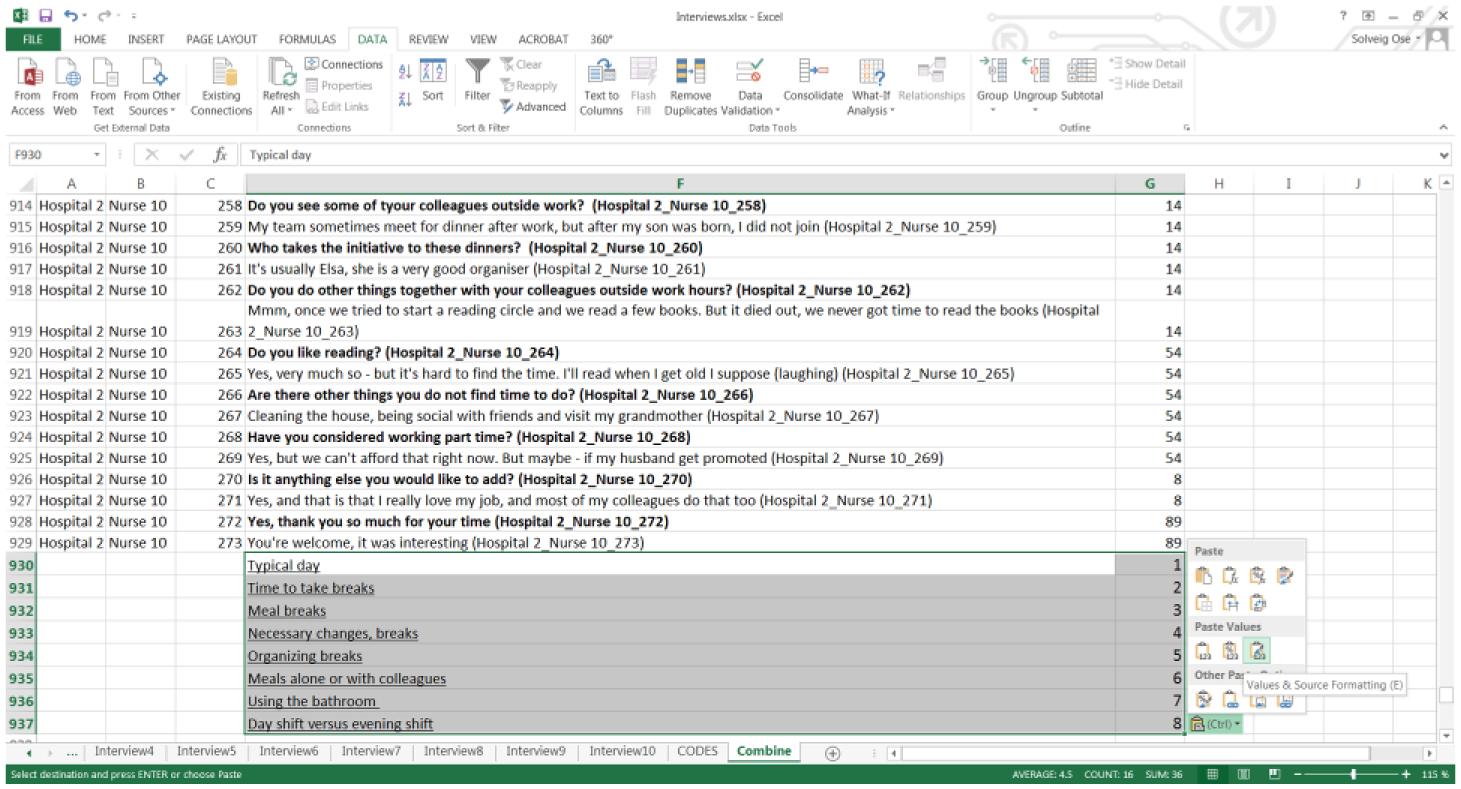
Including the code list at the end of the sheet with all coded interviews.
In addition, in Column H, give all the underlined rows the value 0 and the remaining rows the value 1. This ensures that the name of the code becomes first when the data are sorted in the next step (Figure 10).
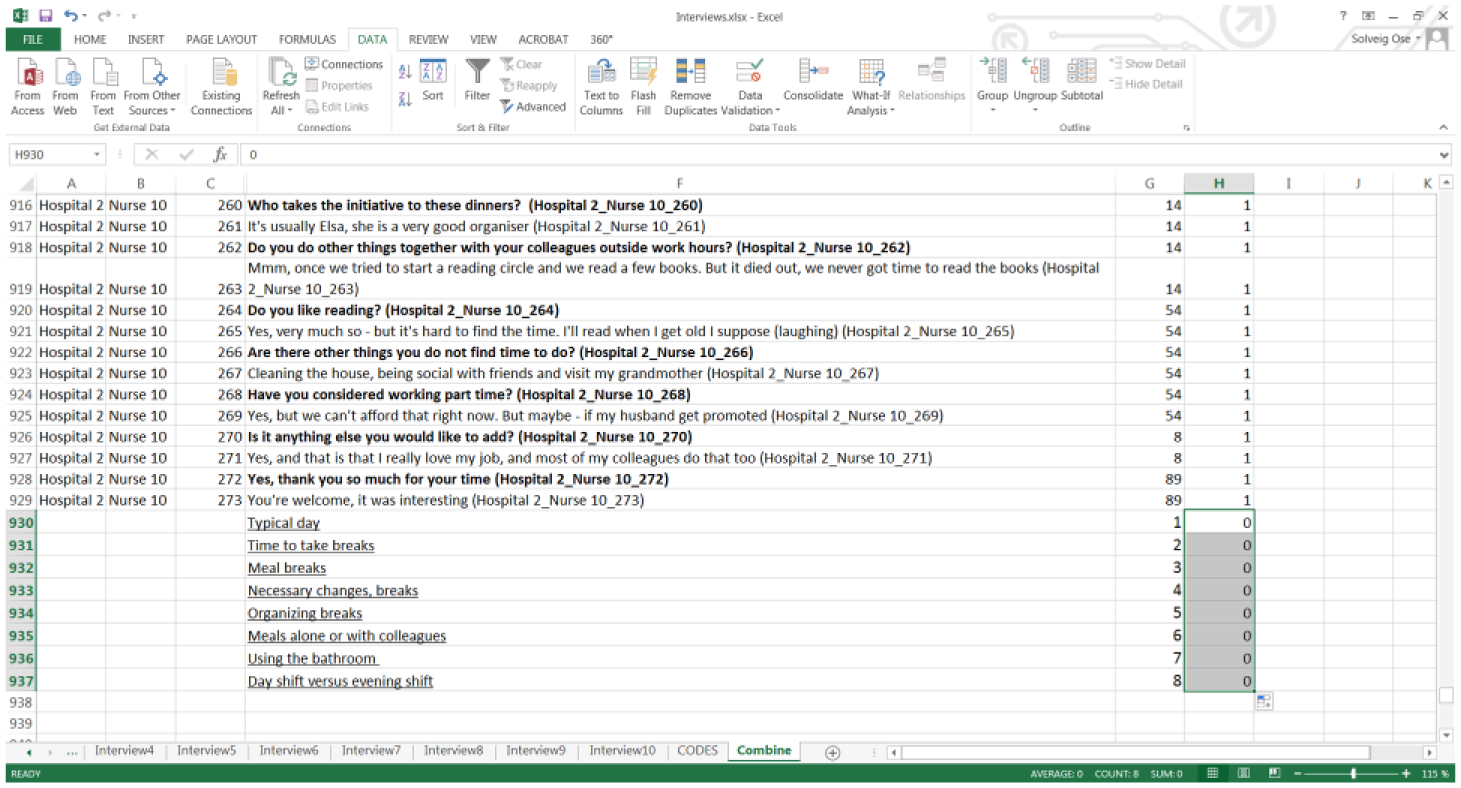
Including a binary sorting variable in Column H.
Sort the Data
Sort the data by Columns G, H, A, B, and C in that order (select all columns, click “Data,” choose “Sort,” and “Add Levels” as many times as necessary, then click “OK”; Figure 11).
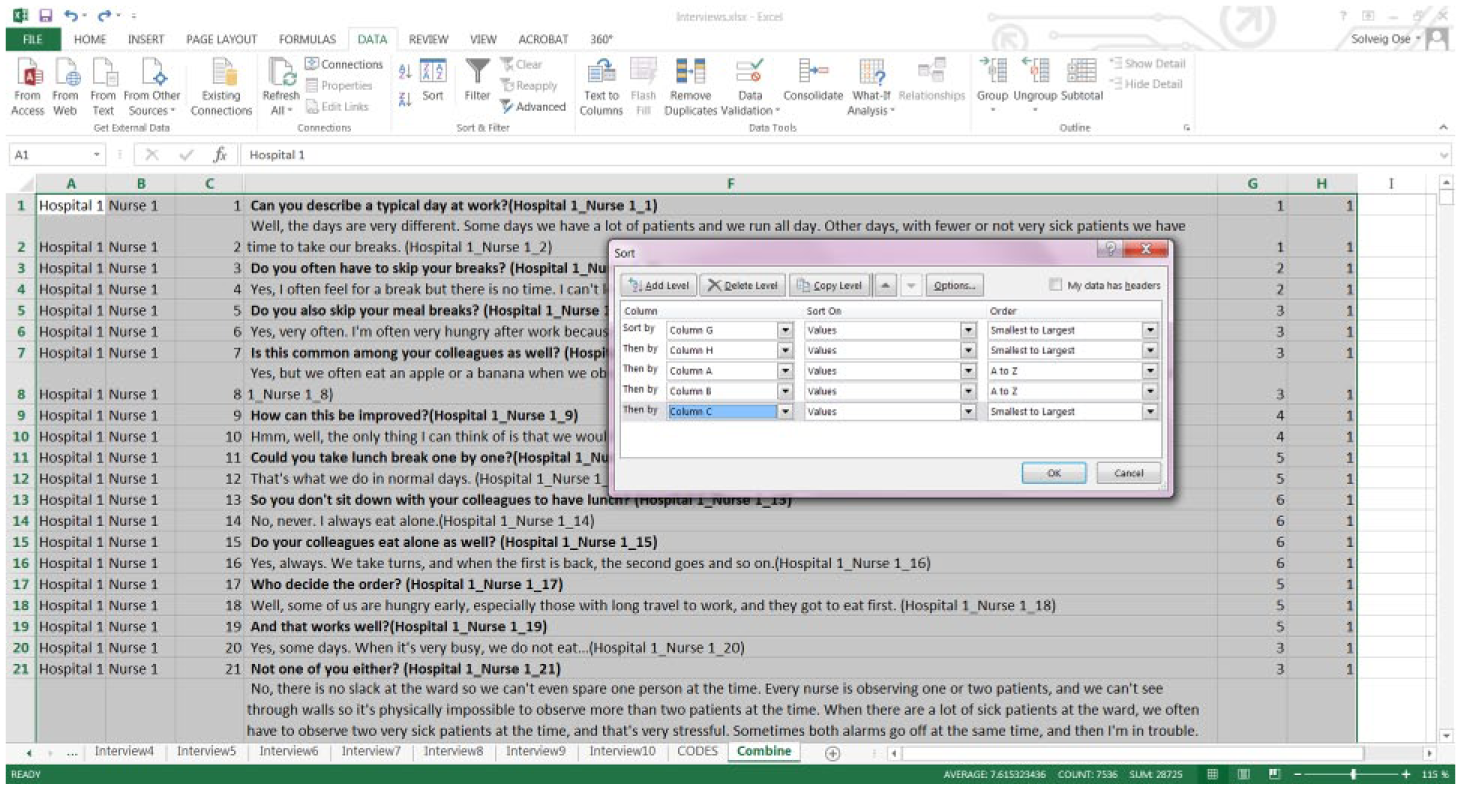
Sorting the coded interviews and the code list.
The text is now sorted by codes used, but still not by the importance of the code or by other criteria. This is done in Step 9.
Transfer Quotes and References from Excel to Word
Create a new blank document in Word. Give it a name such as InterviewData.docx.
Select Column F and copy it into Word (omit all other columns). Pasting into Word may take a while if there are many and/or long interviews. If the computer does not have enough internal memory, smaller passages must be copied one at a time.
Make sure the formatting is retained so that the questions are still bold and that the code names are underlined. If not, paste it again, choose “Paste Special” and choose “Formatted Text (RTF)”.
After Column F is copied into Word, the Excel file may be saved and closed. Excel has now completed its mission in the method and is of no further use.
There will now be a large table in Word. Highlight the table (click the “+” in the top-left corner), select “Layout,” choose the “Convert to Text” menu and click “Paragraph Marks.” The table text is now converted into regular text. Keep the text selected, choose “Paragraph,” and add spacing (for instance, 6 pt.) after each paragraph (Figure 12).
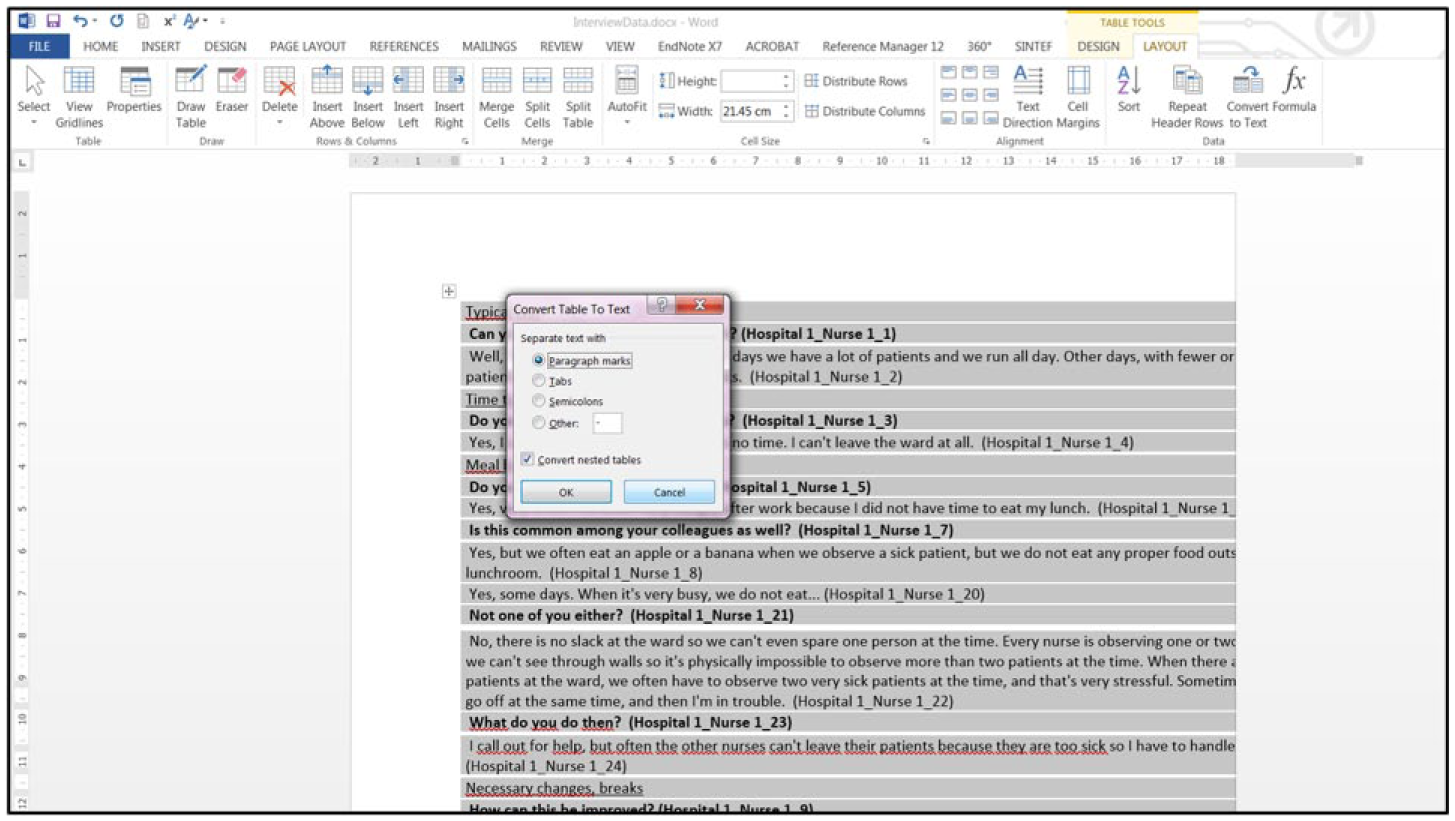
Convert the table text to regular text.
Highlight one of the underlined coded texts, use the “Select” option toward the top right of the menu, choose “Select Text with Similar Formatting” and change all occurrences to Heading 2. Number the headings using the multilevel list function (Figure 13).
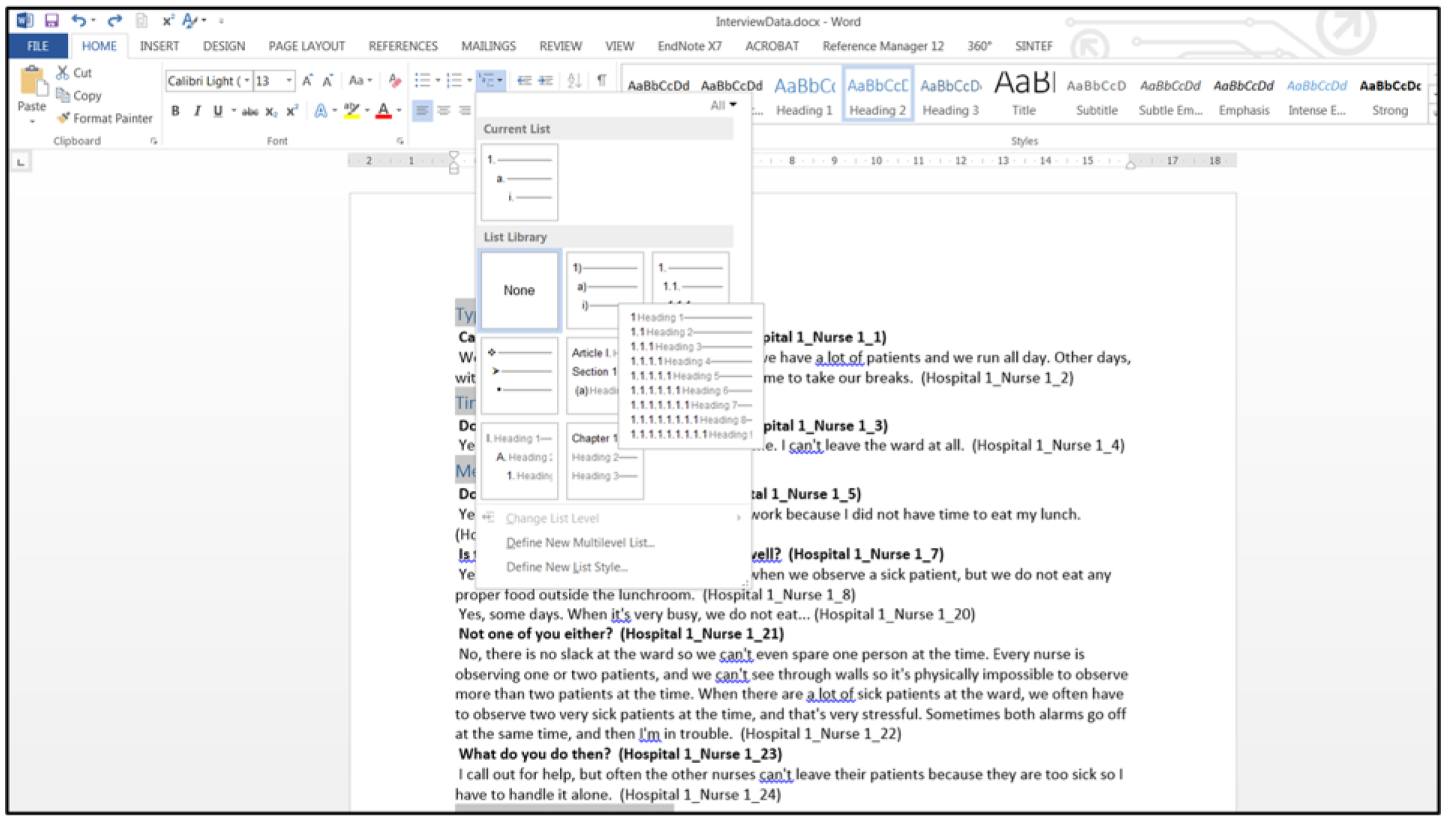
Use the heading function to obtain code levels.
The sequence of the codes is still random, but if a table of contents is created at the beginning of the document, all subchapters (which are the codes) can be seen, and the document is ready for sorting into a logical structure.
Sort the Text into a Logical Structure Based on the Codes
Start by typing a few logical main headings with Heading 1 format at the beginning of the document. The coding process produces great familiarity with the data, so this is often easy to do. I chose the following main categories in this simple example:
Description of a day at work.
Breaks.
Using the bathroom.
Other.
The document is now easily organized by selecting the “View” menu, then “Outline” and “Show Level 2.” Now it is easy to drag and drop the headings (the text will follow) and to organize the text as desired (Figure 14). To change a Heading 2 to Heading 1, press Shift + Tab. If you want to change Heading 2 to Heading 3, press the Tab key.
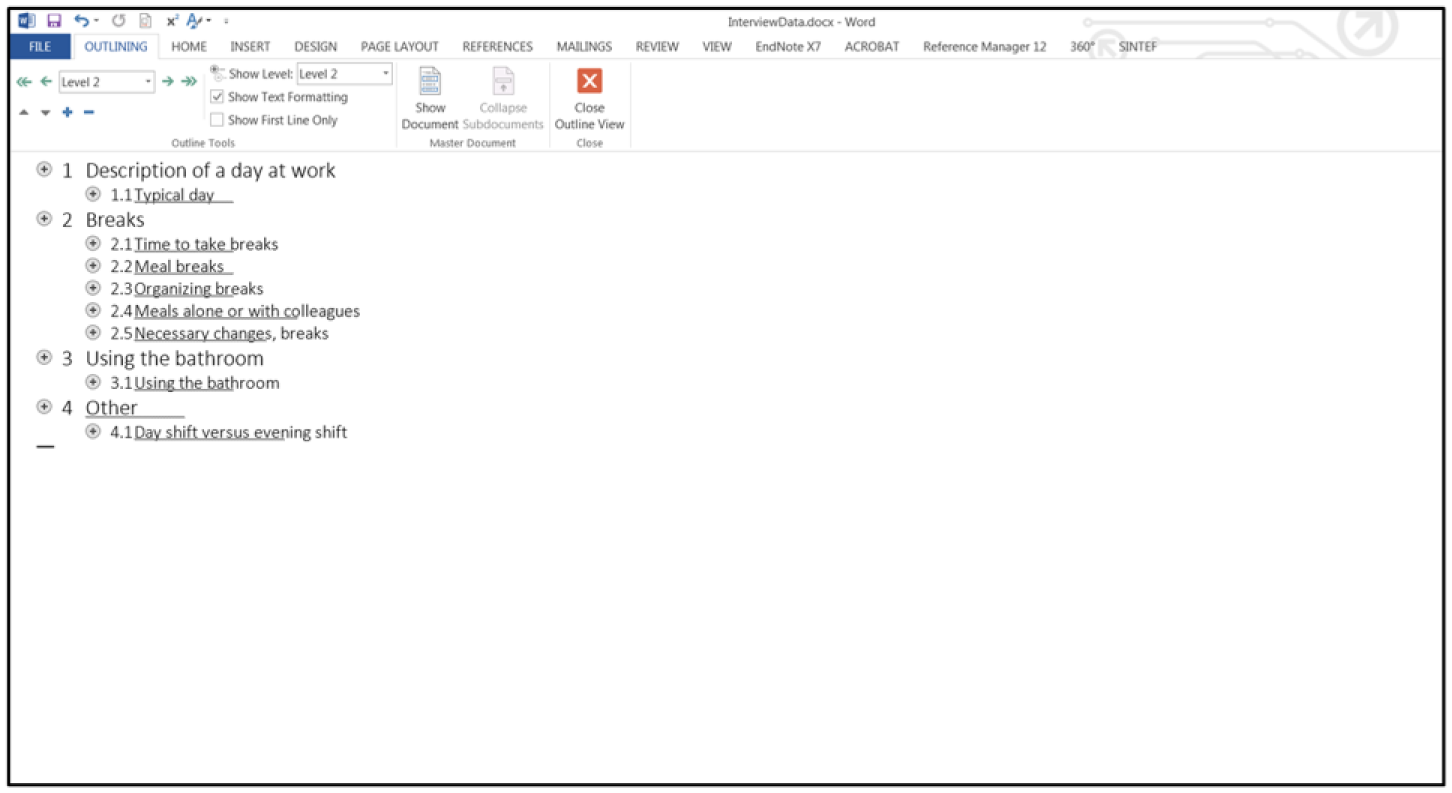
The outline view.
Structure the text further if necessary by making more subchapters, but this is often not needed if a detailed code list is used.
I often go in and out of the Outline window to follow the changes in the document. I also update the Table of Contents many times until I am satisfied with the structure of my data.
The document is ready for analysis when you are satisfied with the structure.
Analyze the Data
The method of analysis obviously depends on the research topic and on the breadth and depth of the data. In an applied social science project, classical content analysis may be the most suitable method, but discourse analysis, narrative analysis, qualitative comparative analysis, and other analyses may also be appropriate depending on the topic studied. Different parts of the text (chapters or subchapters) can be analyzed using different methods.
Discussion
Written notes taken during interviews do not serve as reliable documentation of data, but the verifiability increases when interviews are recorded and the raw data are in the form of audio files. The sensitive nature of recorded audio files (the voice of the informant can be recognized) means that the data should be transcribed to text files and the audio files deleted.
However, transcribed recordings of interviews produce a vast amount of data or text, and it seems an insurmountable task to organize and code all of this text and to develop a sorting scheme following regular procedures for qualitative research. As a result, interview data may be treated unsystematically and not necessarily in accordance with scientific standards.
In applied social science, it is often necessary to take an inductive approach, whereby the researcher does not have a specific theory or hypothesis to test. Rather, results should be based on experiences reported by many respondents who have firsthand information about the topic of the study. Because the results should not be based on only a few voices, it may be necessary to conduct numerous interviews. Many social scientists are reluctant to include large numbers of interviews because of the huge amount of qualitative data that is produced.
Efficient methods for sorting and structuring data are necessary in such projects, and the method described in this paper is systematic but not very complicated or time-consuming when the 10 steps are followed.
Conclusion
Using an efficient method for sorting and structuring qualitative data releases resources for more thorough analyses. After several years of using and refining the method, I find that this method provides good documentation of the qualitative data collected, and that the document produced is a good basis for direct scientific text production. The method does not require additional expensive software but uses programs available to most researchers.
An increasing amount of text data has become available, not just from interviews but also from open-ended questions in Web-based surveys. The same method has been used successfully on this type of data.
Several colleagues have adopted this method, and I have frequently been asked whether I have published a paper describing it. After several years of using this method in many different projects, it is time to make the method available to others struggling with huge qualitative datasets.
Footnotes
Acknowledgements
I thank my colleagues at SINTEF Technology and Society for their interest in the method and people who have encouraged me to write this paper. I am also grateful for very helpful comments from two anonymous reviewers.
Author’s Note
The method has been developed alongside working with many applied social science projects for the last 13 years.
Declaration of Conflicting Interests
The author(s) declared no potential conflicts of interest with respect to the research, authorship, and/or publication of this article.
Funding
The author(s) received no specific financial support for the research, authorship, and/or publication of this article.