
Abstract
Using data from the 2021 Iowa Narrow Cost Analysis of child care, the current study examines business practices of family home child care providers. Family home child care providers make up a sizeable portion of the available child care in Iowa; however, their sustainability is threatened by providers making a low income and lacking access to benefits. The current study describes the enrollment of family home child care, cost drivers of providing care, and participation in business practices such as paying oneself a salary, providing for one’s health insurance, accepting state child care subsidy, and participating in the state quality rating system (QRS), as well as relationships among these business practices. Chi-square analyses indicate that providers who accept child care assistance (CCA) are more likely to contribute to their health insurance and provide themselves with paid time off; however, their participation rates in QRS are similar to those who do not accept CCA. Directions for future research and potential points of intervention to support family home childcare (FHCC) providers as small business owners are discussed.
Introduction
In the United States, many children are cared for in providers’ homes by individual caretakers who are also the small business owners of the program. Registered family home childcare (FHCC) programs in Iowa provide over 27,000 slots for young children, making up approximately 15% of available child care slots (Governor’s Task Force Family home childcare [FHCC] providers are nonparental, paid childcare providers working in their own houses who make up an important sector of the early childcare and education [ECCE] workforce). FHCC plays a crucial role in caring for Iowa’s children, especially among the estimated 23% of Iowans living in childcare deserts (Governor’s Task Force 2021), which are concentrated in rural areas. However, the number of FHCC in Iowa (and most states) has been on a trajectory of decline, with a 21% decrease in the number of programs from 2005 to 2017 (National Center on Early Childhood Quality Assurance [NCECQA] 2019) with an additional steep decline during the COVID-19 pandemic (Child Care Aware of America 2022). Although research on why FHCC programs close is scant, recent reports of FHCC providers in Iowa indicate a need for better income, access to benefits, and improved working atmosphere (Rouse et al., 2023) to remain in the field. As FHCC providers sit at the unique confluence of early care and education providers and small business owners, we examine the small business practices of FHCC providers in this paper.
Family Home Child Care
Since researchers and policymakers first turned their attention to FHCC in the 1980s (Porter et al. 2010), there has been an emphasis on researching aspects of program quality and associated child outcomes. In 1984, Harms and Clifford introduced the Family Day Care Rating Scale, an observation-based tool intended to assess the quality of the physical environment, materials, and practices in FHCC. Kontos, Howes, and Galinsky (1996) examined the impact of provider training on the quality of family childcare, seeking to identify and address the professional development needs of FHCC providers. Bradley, Caldwell, and Corwyn (2003) introduced versions of the HOME Inventory (Bradley 1994) as an additional tool for evaluating quality in FHCC. In 2006, Doherty and colleagues observed more than 200 regulated FHCC providers to identify provider characteristics that predicted quality in childcare homes. This collection of studies together with others (e.g., Blevins-Knabe et al. 2000; Burchinal, Howes, and Kontos 2002; Weaver 2002) focused on identifying predictors of quality and/or informing and training FHCC providers.
In a 2010 review of home-based childcare research, Porter and colleagues sought to extend the FHCC research agenda by addressing structural and interaction quality and identifying resources and support that might benefit FHCC providers. In their extensive review, nearly all training included components related to materials, activities, and interactions with children. Almost no attention was paid to aspects of running a small business. Over a decade later, this lack of attention to business needs of FHCCs is still relevant. In the 2023 study of the Iowa childcare workforce (Rouse et al., 2023), FHCC providers indicated that in order to stay in the field, they would need more financial support and security, as well as access to benefits and increased professionalization of the job. Furthermore, 87% of FHCC providers indicated that their income is critical to meeting their family’s financial needs. Certainly, child care quality is of the utmost importance; however, FHCC programs can only provide quality care when they are stable enough as a business to remain in operation.
FHCC as a Small Business
Childcare providers’ ability to develop and maintain the business aspects of their programs is essential for staying open, providing steady income from their childcare program, and contributing a necessary financial resource for many providers’ households (Blasberg et al. 2019), particularly among the 31% of these providers who are single and therefore the primary or sole earner for their family (Rouse et al., 2023). However, FHCC seems to sit at the complex intersection of small business, early childhood education, and informal family support. Many providers focus their identity on their role as a caregiver and identify less as a business owner (Helburn, Morris, and Modigliani 2002). However, there is great heterogeneity in the workforce, and providers vary in their engagement with formal structures (e.g., state licensing), caring for relatives vs. non-relatives, and use of business strategies such as paying themselves a set salary. Helburn and colleagues (2002) found that many child care providers reported not keeping detailed records of expenses or using their own money to supply their program, yet others reported better income from their FHCC than from previous employment working for others.
Indeed, business practices among FHCC have received less attention by both the owners themselves and in FHCC research. In a notable exception, Zeng and colleagues (2021) conducted a small intervention study in which they surveyed 34 child care business owners, most of whom were FHCC providers (79%), about their professional efficacy. While providers rated themselves highly “confident about my own ideas and capacities” related to providing childcare, they indicated moderate confidence in their ability to manage their business and limited confidence in creating and managing a budget. Less than a third indicated currently having a budget, and fewer than that implemented it (Zeng et al. 2021). Strong business practices are critical to successful and high-quality FHCC. Helburn and colleagues (2002) examined the use of eight business practices among FHCC providers—the use of written contracts with families, tuition charged when child was absent, tuition charged during provider vacation, FHCC is licensed, FHCC fulfills Internal Revenue Services requirements, program participates in Child and Adult Care Food Program, provider participates in a professional organization, and provider has some early childhood education training. They report that 20% of providers in their study with the highest net income were using an average of 6.12 out of 8 professional business practices, whereas smaller, more informal programs were only using an average of 3.12 out of 8 professional business practices.
Research about self-employment in care-taking professions suggests that many women in such fields intertwine their business and personal household budgets (Anderson and Hughes 2010), making it difficult to determine what income or profit they might be deriving from their work. This was more likely to be true of FHCC providers than of others in self-employed service jobs (Anderson and Hughes 2010). In focus groups with regulated and unregulated home FHCC providers, Herman and colleagues (2021) note that themes related to the business aspects of running an FHCC were limited. We suggest this may stem from providers not viewing themselves as a small business, a viewpoint further affirmed by the flood of ECE training on other education and caregiving topics and the dearth of training and resources emphasizing business practices. The very limited research to date highlights the need to understand FHCC providers’ business struggles to further tailor training and support to empower their business skill sets, which are critical to maintaining their provision of child care.
Current Study
As was highlighted during the COVID-19 crisis, the child care workforce is a critical support to all other sectors of the U.S. workforce (Gromada, Richardson, and Rees 2020; Jeon et al. 2018). Challenges of increasing child care program closures and general labor shortages have highlighted the unique role of the FHCC sector (Butler and Modaff 2008; Lanigan 2011). FHCC providers are particularly important for children and families in low-income communities (Jeon et al. 2018), as well as rural communities (Hooper and Hallam 2021). With half of the families in the U.S. living in a child care desert (Malik and Hamm 2017), it is crucial to support the sustainability of FHCC programs. In order to do that, there must be an understanding of FHCC providers’ business management behaviors and struggles while identifying key points for intervention.
Our current study describes characteristics of FHCC in Iowa and FHCC engagement with state systems intended to enhance accessibility, quality, and financial stability of child care programs (e.g., childcare subsidies, quality rating system [QRS]). We further examine how engagement in these systems relates to small business owners’ business practices of paying themselves a salary and providing for their benefits (e.g., health insurance, paid time off). Primary goals were to (1) add a thorough description of current FHCC in one Midwestern state to the very limited research on FHCC and (2) identify potential opportunities for intervention and supports related to FHCC business practices. To fulfill these goals, we address four aims. First (aim 1), we describe enrollment in FHCC by child characteristics including age, disability status, receipt of child care subsidy known as child care assistance (CCA), and being a provider’s relative. Next (aim 2), we describe aspects of the true costs of FHCC, specifically examining how those costs are distributed and the role of providers’ own salary and benefits in those costs. Then (aim 3), we describe FHCC providers’ engagement with outside systems, such as their participation in the state QRS. Finally (aim 4), we test our hypotheses that providers who pay themselves a salary and provide some benefits are more likely to engage with statewide systems intended to support childcare, specifically that these providers will be more likely to accept children who receive CCA and participate in QRS.
Method
This study comprises a secondary analysis of administrative data collected as part of the federally required narrow cost analysis for Iowa’s Child Care Development Block Grant program. For the original analysis (Iowa Department of Human Services 2021), registered FHCC were contacted via email and invited to complete an online survey reporting the various costs they incur, enrollment at the beginning and end of 2020, Covid-19 impacts on their program, and other program information.
Data Source and Procedures
Data for the current study are taken from the Narrow Cost Analysis conducted by the Child Care Bureau of the Iowa Department of Human Services (now the Department of Health and Human Services) in early 2021. The narrow cost analysis is a survey to examine the actual costs of providing care meeting regulatory standards and costs at various quality markers. For this study, all registered FHCC programs and any unregulated home-based care that were in the Iowa Child Care Resource and Referral database were emailed a detailed online survey about costs related to providing care. Response rate among FHCC programs was approximately 10% (n = 251).
Data were cleaned and de-identified before archiving with Iowa’s Integrated Data System for Decision-Making (I2D2; i2d2.iastate.edu) on behalf of the Department of Human Services (DHS). The authors requested de-identified data, and it was determined to be non-human subjects research by the first author’s home institution review board before the current study began. We do note a potential perceived conflict of interest in that some of the current study authors were involved in the original collection of the narrow cost analysis. However, we undertook the following practices to avoid such conflict: All questions included in the survey were designed to answer specific questions of the Iowa DHS; Iowa DHS approved all survey questions before dissemination; all project work for the narrow cost analysis was completed before the initiation of this project; all identifiable data were archived with I2D2 or destroyed prior to the initiation of this research; and approval was obtained from the staff of the Child Care Bureau for the use of the data for research purposes in the current project before initiating the project.
Sample
Data for the current study are drawn from the 2020 Iowa Narrow Cost Analysis described earlier. Respondents (n = 251), all registered FHCC programs, had at least 60% complete data, and reported at least one child enrolled in December 2020. Overall, the median enrollment per program was seven children, with a median of two infants and toddlers and three preschoolers. The majority of programs (69%) did not employ additional paid staff beyond the owner/provider; 16% employed one additional staff member. Most programs (83%) accepted CCA although only 65% currently had children who receive CCA enrolled.
Measures
Narrow Cost Analysis Survey
Respondents completed either the long version (78%) or the short version (22%) of an online survey via Qualtrics. This survey was designed to identify actual costs, cost drivers, and cost per child per day (PCPD) of providing childcare in Iowa that meets regulatory standards and at various levels of quality. To design the survey, members of the narrow cost analysis (NCA) team reviewed previous NCA reports, NCA reports from other states, and regulator and QRS documents for the state of Iowa. The primary difference between the long and short versions of the survey was that the long version asked for more detailed information, such as distinguishing between costs related to food purchases and costs related to art supplies and toys, whereas the short version simply asked the respondent to estimate total costs of expendables used for the program. In both versions, respondents reported on their enrollment for March and December of 2020 and answered questions about their business experiences related to the Covid-19 pandemic. The current study used enrollment and financial data and data related to program practices (e.g., participating in the QRS and accepting child care subsidies).
Analysis
To address the first three aims, descriptive statistics were used to describe means, medians, and frequencies. For aims 1 and 3, all 251 respondents were included in the analyses. For aim 2, providers determined to be outliers regarding costs were excluded from the analyses. Excluded respondents were the 17.5% who reported less than $1 PCPD costs (15% of the total sample reported zero PCPD costs) and the 1% who reported more than $100 per day costs. Finally, to address aim 4 of identifying factors associated with paying oneself and providing oneself with benefits, we conducted chi-square tests. We hypothesized that providers who accept CCA and/or participate in QRS would be more likely to pay themselves and provide themselves with specified benefits.
Results
Enrollment in FHCC
For aim 1, enrollment by age and child characteristics (e.g., having a disability, receiving CCA, and being a relative of the provider) was described (see Table 1). Most respondents reported a mix of three age groups enrolled in their programs—infant/toddler, preschool, and school age. The majority of programs (65%) reported current enrollment of a child receiving CCA. In terms of the age of children who received CCA, it was most common among school-age children with 59% of FHCCs who enrolled school-age children currently serving children receiving CCA. Furthermore, providers with school-agers were more likely to have multiple children with CCA enrolled than those taking CCA for younger children. Similarly, the majority of the FHCC-enrolled children with disabilities were school-age children (42%). In addition, nearly 30% of FHCCs enrolling school-age children have a relative of that age enrolled. Of programs enrolling infants and toddlers, 27% of programs had one or more relatives of the provider enrolled.
Description of Enrollment (n = 251).

Data are given as mean (SD, range).
Cost of FHCC
Aim 2 was to describe how FHCC costs are distributed and the role of providers’ salaries and benefits in those costs. To address the second aim, we first refined our sample to those providers who reported more than $1 and less than $100 PCPD costs to minimize outliers. This resulted in a sample of 202 respondents with reported PCPD costs for meeting regulatory requirements. As reported in Table 2, PCPD costs ranged from $2.02 to $95.15, with a median cost of $19.04 (mean $22.85, SD 16.70). Note that the particular PCPD cost of these providers likely differs from those of different geographic regions, with state regulations different from those of Iowa. Therefore, the rest of our results for aim 2 focus on identifying cost drivers that might reflect business practices of interest. We specifically examine differences in providers who do or do not pay themselves, do or do not provide themselves with benefits (e.g., health insurance, retirement, paid time off), and do or do not accept CCA.
Average PCPD Costs of Family Home Child Care.

Minimum Wage calculated as ($7.25 × 50 hrs, $19,500 annually).
Benefits were defined as health, dental, disability, retirement, and so on.
In this sample of 202 providers reporting more than $1 and less than $100 PCPD costs, the proportion of costs spent on different categories was examined. Given that these data were drawn from the state narrow cost analysis, the proportion of costs is described for (1) salary and benefits, including any employees where applicable; (2) expendable goods, including groceries and supplies; (3) facilities costs such as a proportion of the mortgage and utilities; and (4) outsourced services such as accounting or cleaning. Among the 202 providers who fit the PCPD parameters (>$1 and <$100), 9% report no salary costs. However, for those who do pay themselves, salary costs make up the greatest proportion of costs (mean = 49% of total costs, median 56% of total costs). Expendable costs, such as food and art supplies, were the next largest proportion of costs, making up about one third of costs on average, regardless of self-pay status. Facilities costs were the next highest proportion, with 90% of providers reporting facilities costs at 20% or less of total costs. A few outliers reported facilities costs making up over half of total costs; in each of these cases, the provider reported not paying themselves or paying themselves very little. Outsourced work, such as tuition billing or cleaning, made up very little of total costs. Nearly half of providers (46%) reported no costs in these areas.
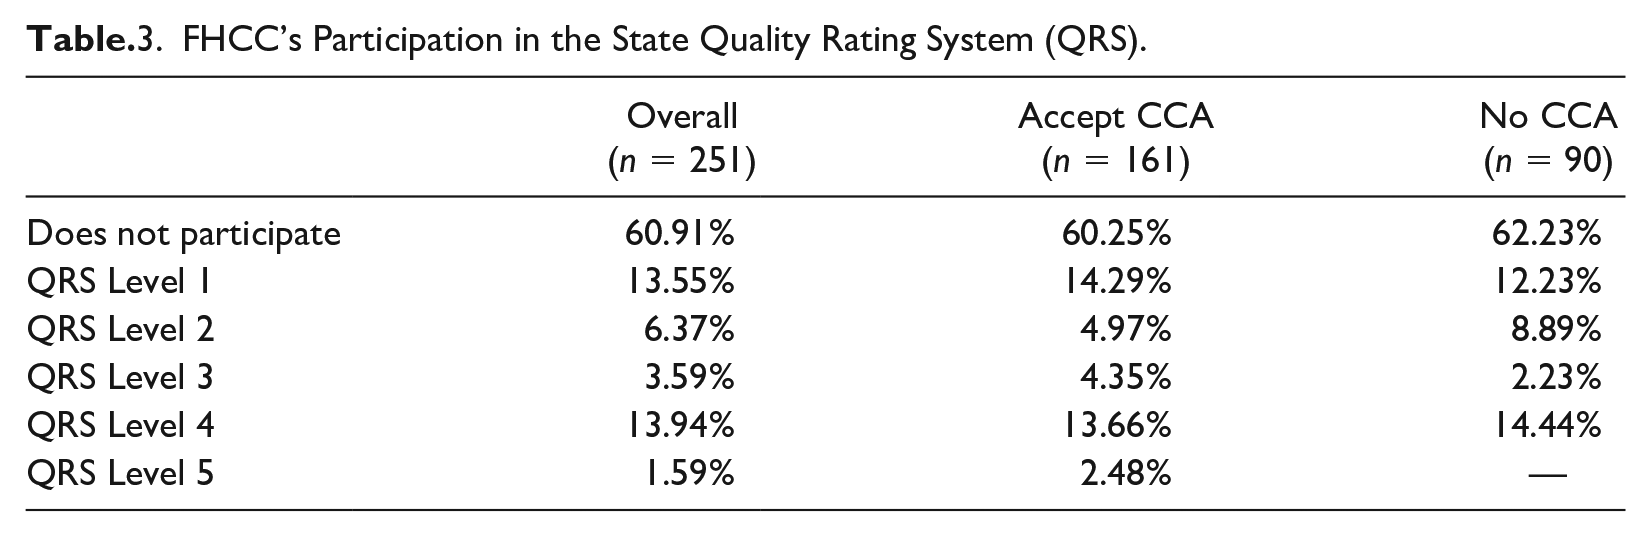
FHCC’s Participation in the State QRS
To address aim 3, we describe the participation in QRS among our 251 participants. The result in Table 3 show that more than half of the sample (60.91%) did not participate in QRS. Among the programs that participated in QRS, level 4 (13.94%) and level 1 (13.55%) have the greatest number of FHCC participants. These patterns hold for both providers who accept CCA and those who do not, and chi-square analyses did not indicate a significant difference between CCA accepting and non-accepting FHCCs in the proportion of providers participating and achieving each QRS level.
FHCC’s Participation in the State Quality Rating System (QRS).
Factors Associated with FHCC Professional Practice
To address aim 4, we examine chi-square analyses to identify professional practices that might be associated with QRS and CCA participation. Contrary to our hypothesis, those who do not accept CCA are more likely to report paying themselves any salary and more likely to report paying themselves more than minimum wage: χ2 (2, N = 251) = 16.43, p < .001. However, providers who accept CCA are more likely to provide at least one benefit for themself such as health insurance or retirement account contributions, χ2 (2, N = 251) = 10.83, p < .01, and more likely to provide themselves with at least one type of paid time off, χ2 (2, N = 251) = 7.99, p < .01. Regarding QRS participation, no statistically significant difference in the proportion of respondents reporting the specified business behaviors was identified between those who do and do not participate in QRS.
Discussion
Although primarily descriptive, this paper adds detailed information about the FHCC field as a small business. It describes who is enrolled in FHCC, what drives costs in FHCC, and how FHCC providers engage with professional systems in ECE and suggests opportune ways that states could make more informed decisions about policies and programs to support this critical and diverse sector of the childcare workforce. A key contribution of this research is a systematic analysis of business practices to identify potential intervention points to increase financial well-being, capacity, and childcare subsidy acceptance among home-based childcare providers.
In terms of enrollment, most programs enroll children in each of the specified age groups—infant/toddler, preschool, and school age. The majority of FHCC programs who have school-age children enrolled report having children who received CCA and enroll a higher proportion of children with disabilities, compared to children of other ages. Although slightly lower, reported enrollment of children with special needs is in line with that of studies that make use of the National Survey of Early Care and Education data (Hooper and Hallam 2021), including more likely enrollment of school-age child with disabilities. Similarly, a greater proportion of enrolled school-age children were relatives of the provider than other ages.
This study highlighted a critical problem with estimating costs of care among FHCCs—calculations and estimates of owner-provider income and benefits. It is striking that 9% of our sample reported not paying themselves, and another 24% were paying themselves less than hourly minimum wage. This may be at least partially explained by the blending of family and business budgets common among women in caregiving professions (Anderson and Hughes 2010). It is worth noting that providers who reported less than $1 PCPD were excluded from these analyses; likely excluding additional providers who did not report paying themselves. Among those who reported paying themselves, their salary was a major cost driver. This has crucial implications for future narrow cost analyses—simply relying on provider reports of current costs will not accurately reflect the actual cost of providing care and, when these zero salary responses are included in averaging costs, will devalue subsidized child care spots in programs with providers who do pay themselves. Helburn and colleagues (2002) provide a detailed review of various estimation techniques and challenges to those techniques. However, they promote the use of a salaried pay model common to jobs that include benefits packages and other non-cash compensation, as opposed to an hourly estimate that better fits with the lack of other types of compensation FHCC providers access. Continued work on how to best estimate FHCC provider-owners’ income is necessary. In addition to supporting FHCC small business owners in developing a budget that both identifies the amount they pay themselves and sets that amount at a reasonable level, determining effective ways to estimate FHCC using salary parity data from center-based child care or other self-employed caregiving professions may be useful.
Many states use policies such a child care subsidy and QRS to simultaneously improve access to quality child care among children from low-income families and to bolster the stability and sustainability of child care programs (Caronongan et al. 2022). In 2019, Iowa implemented a tiered-reimbursement system for childcare subsidy and QRS participation. Tiered-reimbursement is intended to encourage programs to achieve higher quality rating levels by increasing the subsidy rate for those programs. Although most respondents in this sample accept subsidies, most do not participate in QRS. Results suggest that providers accepting subsidies may be a good target for outreach to expand QRS engagement, as this would be a way to increase subsidy income and, in turn, provider income. The additional financial incentives associated with tiered reimbursements could be especially beneficial for those providers who reported paying themself a salary but a salary less than minimum wage.
Limitations and Future Research
This study used data collected for a statewide market rate analysis to examine multiple aspects of FHCC associated with running a child care business. Although we found the majority of these providers accepted state-provided subsidies, nearly half did not pay themselves above minimum wage or fund retirement or insurance benefits for themselves. One possible limitation of the study is how FHCC providers were asked about their income. Providers were asked to report on their monthly or annual wages or salary. It is possible that questions could have been worded differently or additional questions included to further understand providers’ business income. Furthermore, we interpreted acceptance of CCA as a positive business practice; however, it is possible that more business-savvy FHCC providers choose not to accept CCA because the subsidy rate is often lower than family private pay rates. Finally, although our study lends detailed insights into the costs and financial practices of FHCC small businesses, we are unable to answer questions about other business practices or how practices might vary by providers’ personal and professional goals related to providing care.
Future research on FHCC providers is essential to building and sustaining the child care workforce. Research could examine how home providers identify as professionals and if supporting their skills as small business owners would boost important aspects of their well-being, such as longevity in the field, satisfaction, and financial stability. In addition, research addressing challenges in methods to recruiting FHCC providers for participation in studies and understanding their financial practices when business and home budgets are blended is key. Finally, in light of recent influxes of funding for early childhood services since the beginning of the COVID-19 pandemic, research opportunities are abound to determine how FHCC spend cash influxes and if they use these resources to support their own income.
Despite these limitations and remaining questions, our study highlights the importance of better understanding FHCC providers’ business practices. For the nearly 61% of providers who report not paying themselves a salary above minimum wage (especially the 9% who report not paying themselves at all), outreach in business training and support may be as beneficial as the myriad of training about caring for and educating young children. Although some providers may be able to access benefits such as health insurance or retirement savings through a spouse, greater availability and affordability of such benefits would further fortify the FHCC workforce. Finally, effectively estimating the cost of providing child care is critical for stabilizing and improving child care availability and quality and ensuring adequate income for providers who do accept CCA (Caronongan et al. 2022).
Footnotes
Declaration of Conflicting Interests
The author(s) declared the following potential conflicts of interest with respect to the research, authorship, and/or publication of this article: We do note a potential perceived conflict of interest in that some of the current study authors were involved in the original collection of the narrow cost analysis. However, we undertook the following practices to avoid such conflict: All questions included in the survey were designed to answer specific questions of the Iowa DHS; Iowa DHS approved all survey questions before dissemination; all project work for the narrow cost analysis was completed before the initiation of this project; all identifiable data were archived with I2D2 or destroyed prior to the initiation of this research; approval was obtained from the staff of the Child Care Bureau for the use of the data for research purposes in the current project before initiating the project.
Funding
The author(s) disclosed receipt of the following financial support for research, authorship, and/or publication of this article: Collection of data presented in this publication was made possible by the Preschool Development Grant Birth to Five (Grant Number 90TP0030-01-00) from the Office of Child Care, Administration for Children and Families, U.S. Department of Health and Human Services as part of a grant totaling $2,190,119 with 0% financed with non-governmental sources. Its contents are solely the responsibility of the authors and do not necessarily represent the official views of the Office of Child Care, the Administration for Children and Families, or the U.S. Department of Health and Human Services.