
Abstract
Because articular cartilage (AC) lacks inherent repair capacity, research has focused on translating tissue-engineered cartilage to the clinic. Toward this, rapid and nondestructive methods would be useful for determining in-process and release characteristics during the manufacture of tissue-engineered products. The current work aims to introduce a Raman-based methodology for nondestructive qualitative and quantitative characterization of tissue development using AC. First, Raman shifts associated with critical biochemical components of AC, with particular emphasis on DNA, glycosaminoglycans (long chains of sugar molecules and a key component of cartilage), total collagen, as well as pyridinoline (a marker of collagen crosslinking and maturation), were collated. Next, verification of the molecular spectroscopic biomarkers was conducted by temporally tracking tissue maturation/development of nascent and mature AC, establishing a temporal reference dataset. Finally, validation was performed by correlating the spectroscopic biomarkers with traditional photometric biochemical assays and mass spectrometry. The results presented here include a Maturity Index for quantification of tissue development/maturation. Strong correlations were found between nondestructive spectroscopic-based measurements and destructive (photometric and mass spectrometric) measurements with high linearity for both nondestructive Raman (R2 > 0.96) and destructive biochemical (R2 > 0.97) assays, respectively. Uses of the proposed rapid and nondestructive method include in-line quality assessment (in which the sample is not removed from the process stream) to monitor the manufacturing of tissue-engineered medical products. This study shows that Raman spectroscopy has the capacity of being a powerful tool for nondestructive quality control and assurance in traditional biomanufacturing workflows, and the approach taken here may also be utilized as a template and research tool for studies on the development of other native and engineered tissues.
Impact Statement
This work introduces a rapid and nondestructive Raman spectroscopy method for biochemical analysis of native cartilage, validated against gold-standard destructive assays. This approach enabled the development of a novel cartilage-specific Maturity Index, which integrates collagen, glycosaminoglycan, and crosslink content into a single nondestructive metric of tissue development. By eliminating destructive sampling and by yielding data rapidly, Raman spectroscopy allows continuous monitoring and quality assurance/quality control of tissue-engineered medical products, conserving resources and enabling fast and reliable release assays. This methodology establishes a scalable, multiplexable platform with strong translational potential for tissue engineering and regenerative medicine.
Keywords
Introduction
Articular cartilage (AC) is the thin layer of hydrated soft connective tissue that covers the articulating surfaces of long bones and sesamoid bones within diarthrodial joints. 1 It protects the bones from wear by providing lubrication, absorption, and distribution of compressive load, and withstanding shear stress during joint movement. Its elasticity, which allows it to deform under dynamic compressive loading, is essential in reducing stress to the underlying bone and a product of the interplay of the fluid and solid phases of the tissue. 2 The fluid phase consists of water (60–85%) and electrolytes, whereas the solid phase is comprised of chondrocytes, collagen (15–22% wet weight), proteoglycans (PGs; 4–7% wet weight), and other glycoproteins. 1 Because AC has a low cell count, a high matrix-to-cell ratio, and no direct blood supply, it presents a challenging environment for healing. 3 If untreated, there is a high probability of AC damage progressing to more serious joint disorders such as osteoarthritis, necrosis of subchondral bone tissue, or arthritis. Current treatments for AC damage are not satisfactory and rarely restore full or long-term function to the affected joints. 4 Tissue-engineered medical products (TEMPs) focused on AC repair have shown to be promising treatment options but can be cost- and time-intensive to manufacture, in part because the majority of assays useful for determining the critical quality attributes (CQAs) of tissue-engineered AC are destructive.
The fast-growing biomanufacturing industry aims to develop, manufacture, and translate promising therapies. A major bottleneck in translating cell therapy products, however, is navigating the regulatory process 5 that requires product data, which are typically obtained through destructive means. Specifically, the development of robust analytical methods, reference datasets, and assays 6 for quality assurance and control (QA/QC) within biomanufacturing workflows represents significant biomanufacturing and regulatory challenges. Due to the inherent complexity of biological tissues, modes of assessing the CQAs that affect the intended clinical function are needed in order to correlate to process parameters and material attributes, 7 which ensure reproducibility and repeatability of the end-use product. The Food and Drug Administration defines the CQA as “a physical, chemical, biological, or microbiological property or characteristic that should be within an appropriate limit, range, or distribution to ensure the desired product quality.” 8 Currently, the biomanufacturing field largely relies on destructive, labor-intensive methods for structural and functional characterization of TEMPs. 9 To ensure that product CQAs are not compromised during final product testing, methods that are accurate, rapid, and nondestructive are desired for characterizing TEMPs during development and for the final product. 9 Such testing methods would also be valuable for ongoing monitoring of CQAs and process optimization. 7 Toward this end, this study seeks to verify and validate the use of Raman spectroscopy as a nondestructive test method by comparing it to traditional destructive assays 9 using AC as a model.
Traditional assays for analyzing the quality of tissue-engineered implants include histological staining for tissue structure, collagen organization, composition, cell density, and collagen type. The drawbacks of these assays include their time-intensive and destructive nature, which limits analyses to temporal snapshots as opposed to longitudinal tracking of product CQAs. These assays also tend to be labor-intensive and prone to human error and bias. Finally, for some assays, the critical reagents (e.g., antibodies) are either not widely available, expensive, or lack supplier qualification/testing.
The drawbacks of traditional, destructive assays may be readily addressed through the adoption of validated and verified nondestructive tests. Therefore, there is a growing need to develop nondestructive and noninvasive quantitative tools and methods to: (1) verify and validate the accuracy of their measurements in determining the critical biochemical components of TEMPs produced from a biological source, (2) monitor extracellular matrix development and composition, (3) correlate these critical components to tissue function (continuously and at predefined timepoints), and (4) to do so in a labor- and time-saving manner. Vibrational spectroscopy is a rapid, label-free, nondestructive quantitative technique used to characterize molecular structure and composition. 10 This common analytical tool used to identify and assess the quality of material feedstock as well as monitor manufacturing processes for QA/QC purposes11,12 may be valuable and applicable to biomanufacturing once verified and validated against traditional destructive assays. Here, Raman spectroscopy was selected as the vibrational spectroscopic modality of choice and investigated for said analyses due to its adoption in other industrial workflows where spectroscopic sensor probes, for instance, can be used directly in a bioreactor chamber (in-line) or a small, on-line perfusion chamber via transmission without coming in direct contact with the cell culture so as to prevent contamination.
Raman spectroscopy is a non-invasive and label-free vibrational spectroscopy method for obtaining compositional information of a material based on the inelastic scattering of monochromatic light due to molecular interactions with the material under interrogation. This Raman scattering produces a spectroscopic fingerprint of the material composition, which can be used to identify a material as well as to quantify the components of a mixture through proper deconvolution and analysis. 13 Raman spectroscopy, empowered by validated reference datasets for tissue matrix components, has the potential of enabling real-time, nondestructive quality monitoring in biomanufacturing. The technique has the potential of transforming how decisions are made across product development stages. By comparing live spectral data from in-process materials to establish molecular profiles, operators can quickly confirm product quality or trigger precise corrective actions without halting production. Using AC as an example, accurate quantification of glycosaminoglycans (GAGs) or other matrix components can ensure that cartilage products meet strict quality standards and function as intended.
Quantitative, real-time metrics during production reduce reliance on time-insensitive assays and strengthen regulatory compliance. This study demonstrates the potential of Raman spectroscopy toward nondestructive qualitative and quantitative analysis and characterization of tissue development (temporal tracking) for the purpose of establishing a spectral reference dataset, which may be employed toward QA/QC of biomanufactured tissue-engineered cartilage medical products. Previously, a Functionality Index (FI) based on destructive testing methods has been devised to quantify the developmental stage of tissue-engineered cartilage. 14 This study expands on the FI by developing a nondestructive Raman spectroscopy method for biochemical analysis of cartilage tissue. The Raman spectroscopy method is then validated against gold-standard assays, allowing for continuous monitoring and quality control of TEMPs through a Maturity Index (MI) that provides a quantifiable measure of the developmental stage of the tissue-engineered implant.
Materials and Methods
Animals and tissue preparation
In this study, no live animals were used, and all tissues were obtained from deceased animals culled for other purposes. Fresh-frozen whole fetal and neonatal pigs (Sus scrofa domesticus, Yorkshire cross, female and male) were acquired from Nebraska Scientific. The fetuses of length 17.8 cm–22.9 cm were estimated to be approximately 80 days of gestational age (“Fetal”), and pigs over 35.6 cm that were stillborn were considered “Neonatal.” Knees from juvenile (5–6-month-old) and mature (2–3-year-old) pigs (Sus scrofa domesticus, Yorkshire cross, female and castrated male) were purchased from Corona Cattle, Inc. Prior to sample collection, juvenile and mature knees were fresh-frozen en bloc and subsequently thawed to ensure consistency with fetal and neonatal groups. For fetal and neonatal pigs, unilateral (only the right) knee joints were used, and for juvenile and mature pigs, bilateral knee joints were used.
Knee joint capsules were dissected and opened to reveal femoral condyles with smooth, pristine AC. A total of 20 knees were used, as follows: 5 knees from fetal, 5 knees from neonatal, 5 knees from juvenile, and 5 knees from mature pigs. A full-thickness slice of cartilage, approximately 3 mg in wet weight, was taken from the center of the lateral condyle for biochemical analysis, a smaller full-thickness cartilage slice of approximately 1 mg wet weight from the lateral condyle was used for crosslink analysis, and a 3 mm diameter biopsy punch was taken from the medial condyle for Raman spectroscopy.
Biochemical characterization by Raman spectroscopy
Raman spectra were collected from the surface of cartilage samples. To prevent tissue dehydration and shrinkage during measurement, which can alter spectral features and absolute intensities, the following precautions were taken. The samples were kept hydrated in phosphate-buffered saline, blotted dry, and centered under the objective. Spectra were acquired within 2–3 min of transfer to minimize any potential fluid loss using a modified Renishaw InVia confocal Raman microscope (Renishaw, Inc.), equipped with a near-infrared laser (λ = 785 nm) with incident laser radiation of 109 mW (Laser Spectroscopy Laboratories fee-for-service core, University of California, Irvine). A 20× long-working-distance objective (NA = 0.75) was used for excitation and signal collection. Five scans per spot and five spots per sample were acquired at a resolution of 1 cm−1 with an acquisition time of 5 s to achieve a good signal-to-noise ratio. Spectra were acquired, smoothed, linear baseline corrected per Lorentz fitting, and normalized using WiRE 4.4 (Renishaw, Inc.). Multiple characteristic Raman shifts are analyzed and summed because some peaks become distinguishable earlier in tissue development or molecular organization, enabling early detection of structural changes, where peak shape reflects the degree of (dis)organization, and amplitude indicates quantity. For quantitative analyses, the sum of relative intensity of the main peak(s) was plotted per sample, as shown in the Results section.
The confocal Raman probe (with a lateral resolution of ∼1 μm and a depth of field of ∼2 μm) samples a microscopic volume within the tissue. To avoid bias from local cellular or matrix heterogeneity, we acquired five spectra per sample, each from a spatially distinct spot separated by at least 50 μm across the cartilage surface. This approach ensures the measurement integrates signal from multiple chondrocytes (where present in the sampling volume) and the surrounding extracellular matrix (ECM), providing a tissue-averaged biochemical profile.
The Raman signal originates from the entire focal volume, which includes both chondrocytes and the pericellular/territorial matrix. In immature, cell-dense cartilage (fetal/neonatal), the sampling volume is highly likely to include one or more chondrocytes. In mature cartilage, with lower cellularity, the signal becomes increasingly dominated by the ECM, but chondrocytes within the sampled volume still contribute. This is directly analogous to the destructive biochemical assay, where a homogenized tissue fragment includes DNA from all chondrocytes within it.
Raman shifts of interest were selected based on historical and current literature and can be found in Table 1. The main Raman shifts used in the current work are as follows: 1096 cm−1, corresponding to the phosphate mode of DNA15,20; 880 cm−1 to 1640 cm−1, corresponding to “very strong” peaks for GAGs including chondroitin-sulfate 4, chondroitin-sulfate 6, and hyaluronic acid (HA), 16 where “total GAG content” is the sum of all peak intensities; 810 cm−1 to 1275 cm−1, corresponding to collagen-specific proteins including the C–C bond stretching of proline. 17
Raman Spectroscopy Characterization of Articular Cartilage Biochemistry
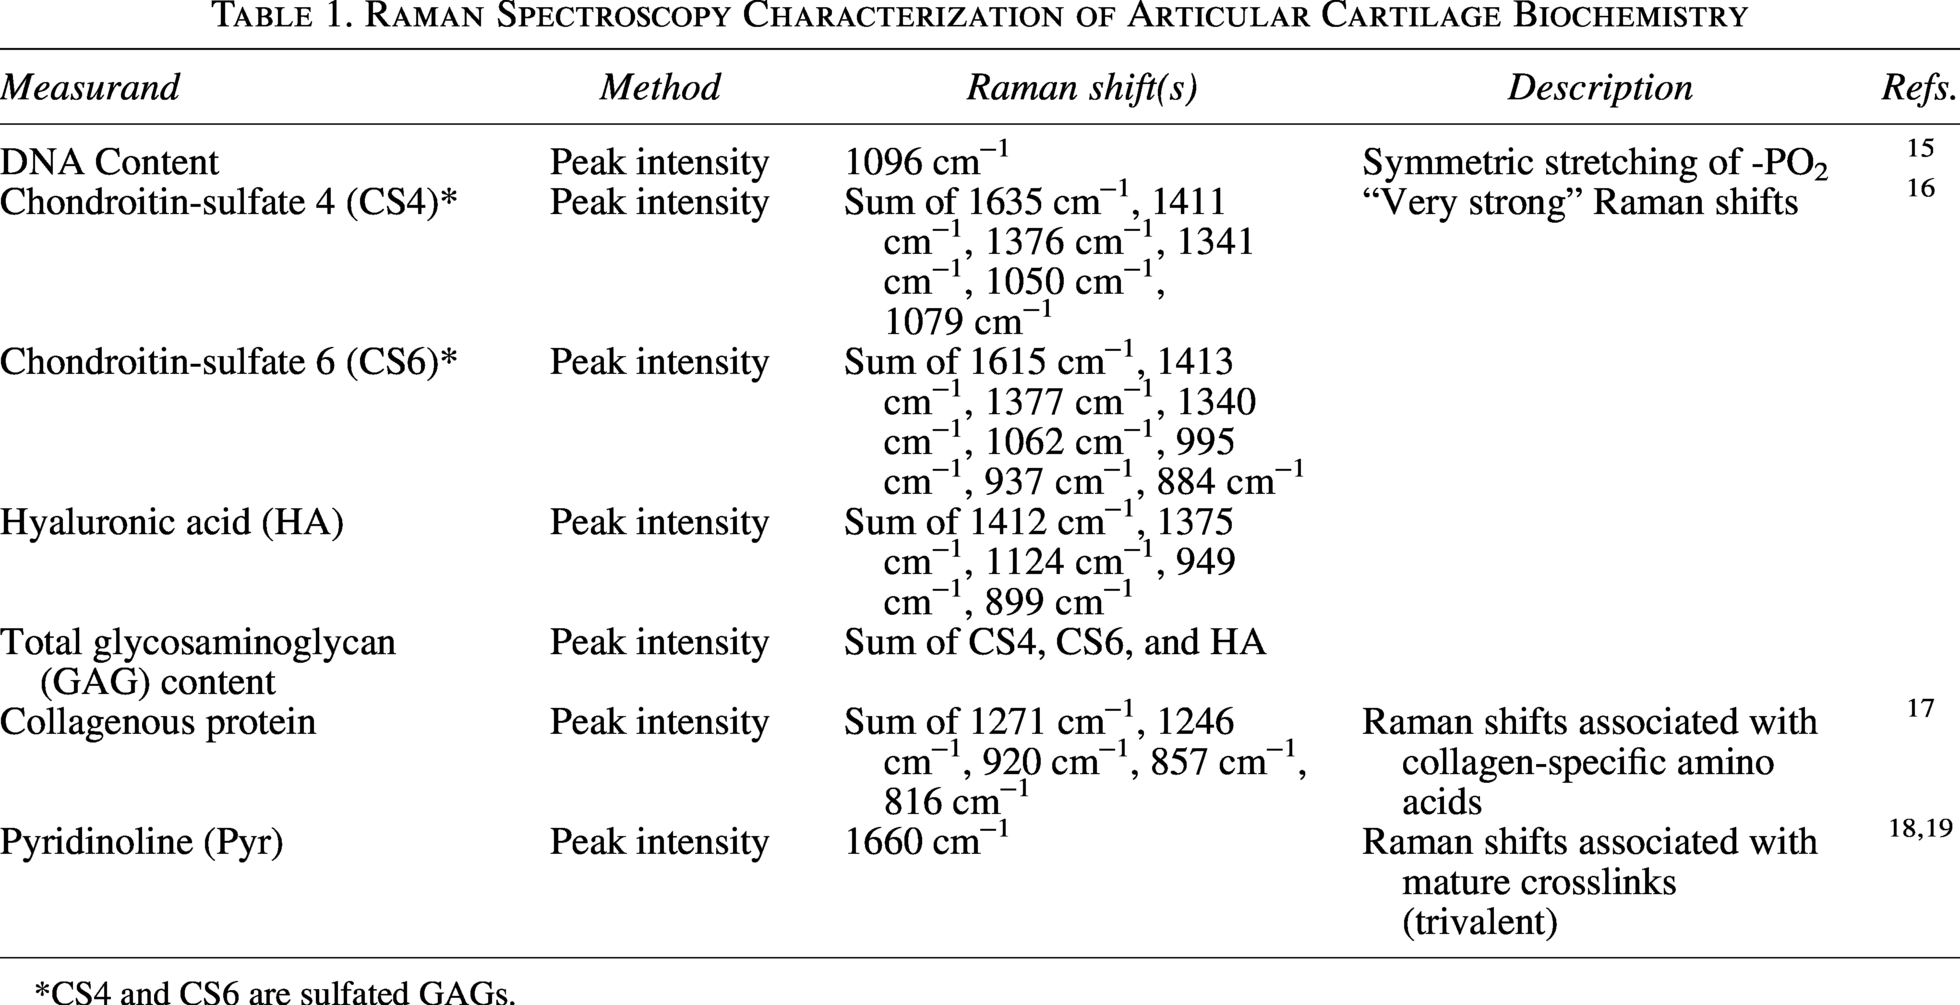
CS4 and CS6 are sulfated GAGs.
Due to the spectral complexity of cartilage, where collagen and GAG signals extensively overlap, we did not assign collagen content to a single Raman band. Instead, the “total collagen-associated signal” was defined as the sum of baseline-corrected peak intensity from several prominent peaks assigned to collagenous protein backbone and side chain vibrations. These include, but are not limited to: the Amide I band (∼1660 cm−1, C=O stretching), the Amide III band (∼1240 cm−1 to1280 cm−1, C–N stretching and N–H bending), and peaks associated with the amino acids proline and hydroxyproline (∼850 cm−1 and ∼875 cm−1, C–C stretching). This summed intensity provides a robust proxy for total collagenous protein content, as it integrates signal from multiple vibration modes of the collagen molecule, reducing bias from any single, potentially overlapping band.
Lastly, the Raman shift at 1660 cm−1, which corresponds to mature collagen trivalent crosslinks via Pyr, has been evaluated as a potential marker of tissue maturation and tissue degeneration.18,19,21 But, unlike previous work evaluating collagen crosslinking, where peak area measurements were used for pyridinoline analysis, the current study employed relative intensity measurements as a simplified approach for qualitative and quantitative characterization of collagen crosslinking and maturity.
Biochemical quantification by biochemical assay
To validate the Raman spectroscopy measurements, parallel analyses were performed using established, destructive biochemical assays on the same sample. All biochemical samples were processed using standardized protocols to ensure consistency and comparability. Briefly, biochemistry samples were weighed wet, then frozen and lyophilized to acquire dry weights. Lyophilized samples were digested in papain (Sigma-Aldrich, St. Louis, MO) at a concentration of 125 μg/mL for 18 h at 60°C. Total protein was calculated via a modified Bradford assay (Bio-Rad, Hercules, CA). DNA content was calculated with the use of a PicoGreen dsDNA reagent (Invitrogen, Carlsbad, CA). The micro assay protocol was followed, which called for a standard curve composed of 5 × 1 mL solutions containing 0 μg/mL, 10 μg/mL, 20 μg/mL, 30 μg/mL, 40 μg/mL, and 50 μg/mL of bovine serum albumin (BSA), as BSA is the most abundant globular protein and commonly used as a protein standard. Collagen content was measured with the use of a modified chloramine-T colorimetric hydroxyproline assay as described previously. 22 For comparative analysis, sulfated GAG (sGAG) content was quantified using the dimethylmethylene blue (DMMB) assay-based Blyscan assay kit (BioColor, Belfast). All quantification measurements for DNA, sGAG, and collagen content were performed with a GENios spectrophotometer/spectrofluorometer (TECAN) as previously described. 23
Liquid chromatography-mass spectrometry (LC-MS) was performed to quantify pyridinoline crosslinks within cartilage. Lyophilized samples were hydrolyzed in 6 N HCl at 105°C overnight, HCl was evaporated, and hydrolysates were resuspended in 500 μL of a solution of 25% (v/v) acetonitrile, 0.1% (v/v) formic acid, and 1 μg/mL pyridoxine (internal standard) in water. Resuspended samples were injected into a Cogent Diamond Hydride 2.o HPLC column and eluted using a gradient of two solvents (A: 0.1% formic acid in water and B: 100% acetonitrile) with a flow rate of 400 μL/min for aqueous normal phase separation, coupled to a Waters ACQUITY QDa mass spectrometer. 23 Pyridinoline crosslinks and hydroxyproline were quantified in MassLynx v4.1 by quantifying the area under the curve of the extracted ion chromatograms of the second charge state of pyridinoline ([M + 2H]2+ = 215.1 m/z) and the first charge state of hydroxyproline ([M + H]+ = 132.1 m/z), and interpolating into a standard curve of serial dilutions of pyridinoline and hydroxyproline. 24 Pyridinoline content was normalized to dry weight and hydroxyproline concentration.
Statistical analysis
For each biochemical (Raman spectroscopy, liquid chromatography) and spectroscopic (Bradford, PicoGreen dsDNA, Sircol collagen, chloramine-T hydroxyproline, and Blyscan GAG assays) test, n = 5 samples were used. All statistical analyses were performed using Prism 8 (GraphPad Software). Match-paired quantitative data were assessed using a one-way analysis of variance (ANOVA) with a post hoc Tukey’s HSD (honestly significant difference) test at a significance level of α = 0.05. Correlation and correlation probabilities of cartilage photometric and spectroscopic datasets were analyzed by JMP® Pro 15.2.1 (SAS). All data are presented as means ± standard error and can be found in Supplementary Data. For all figures, statistical significance is indicated by groups not sharing the same letters. Correlation coefficients of R2 ≥ 0.5000 and p values of < 0.05 are highlighted in the figures below.
Results
Spectral analysis of cartilage development
The Raman spectra obtained from porcine AC across four developmental stages (Fig. 1) revealed distinct biochemical changes associated with tissue maturation. Specifically, the fingerprint region most informative for biological molecules (720 cm−1 to 1820 cm−1) was baseline-corrected and normalized.
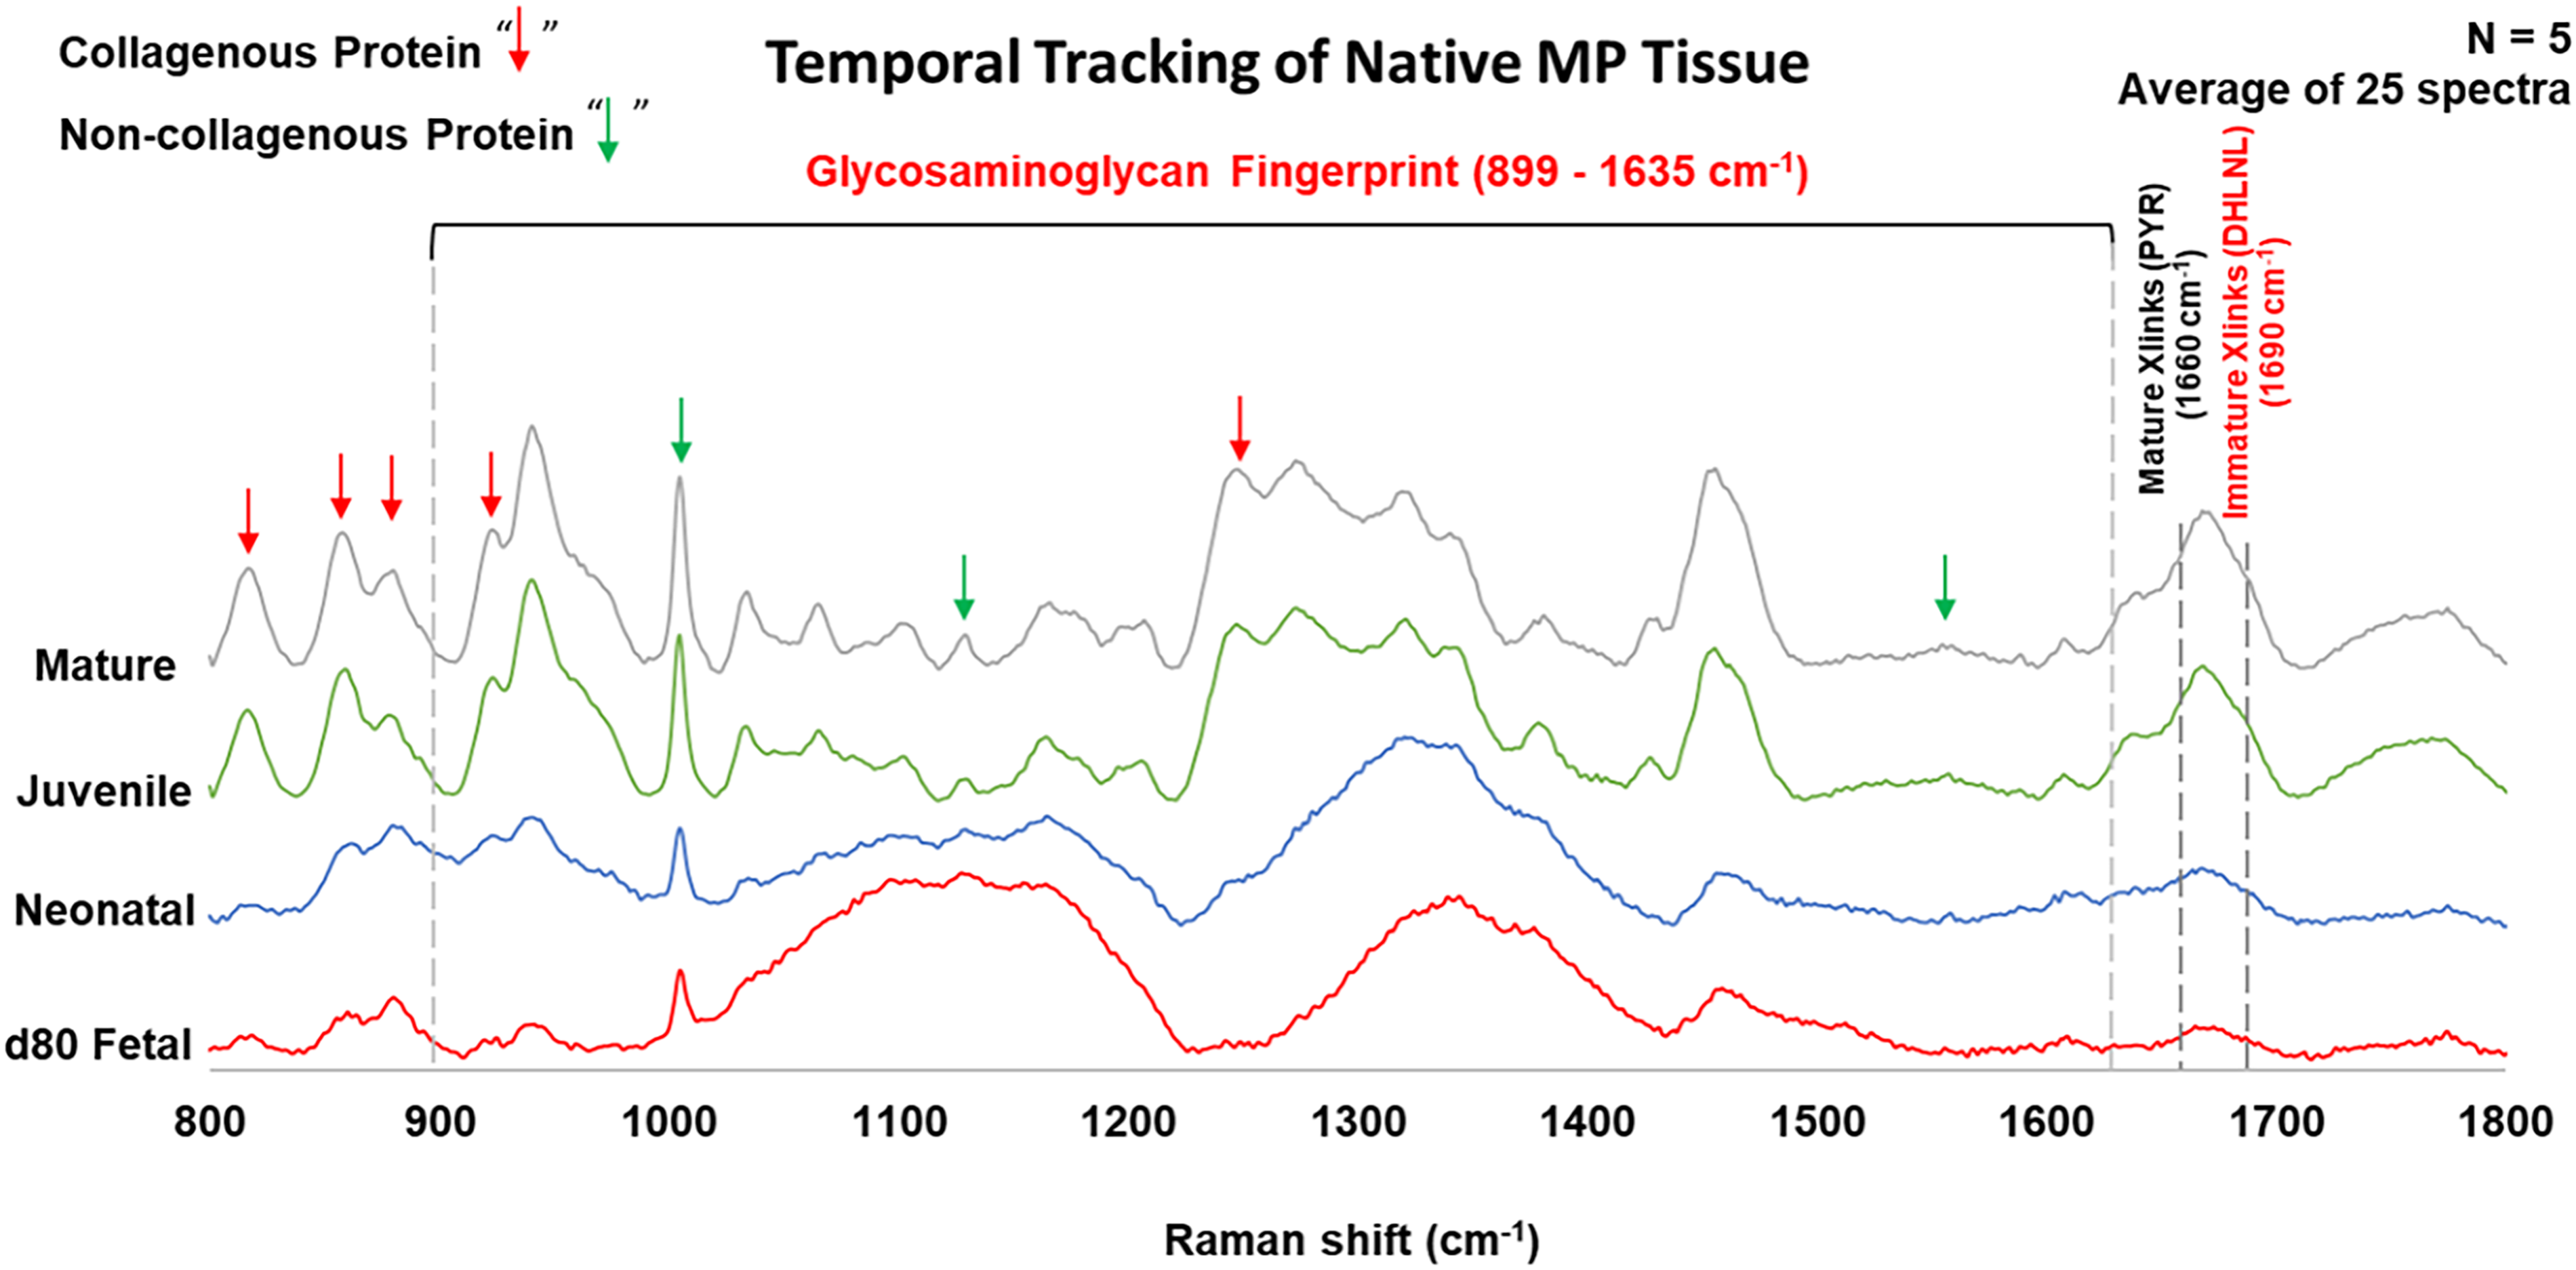
Baseline corrected and normalized Raman spectra of farm pig articular cartilage at different developmental stages obtained at a λ = 785 nm with incident laser radiation of 109 mW, 5 scans, 1 cm−1 resolution and 5 s acquisition time. Red arrows point to collagenous protein, and the green arrows point to noncollagenous protein.
Several clear spectral trends were observed. Fetal cartilage spectra showed broader, less defined peaks, whereas mature cartilage spectra exhibited sharp, well-resolved peaks. Specific baseline-corrected relative peak intensity changes were observed that correlated with the developmental stage. The amide I band (approximately 1660 cm−1), associated with C=O stretching vibrations in peptide bonds, 25 increased in intensity and sharpened with maturation. Peaks in the 1000 cm−1 to 1100 cm−1 region, corresponding to carbohydrate vibrations in GAGs, 26 also changed in relative peak intensity and profile shape across stages.
The ratio of the 1450 cm−1 peak (CH2 bending 27 ) to the 1240 cm−1 peak (amide III28,29) decreased with maturation. In addition to intensity differences, several bands showed subtle shifts in position. For instance, the amide I band shifted from approximately 1655 cm−1 in fetal tissue to 1665 cm−1 in mature tissue, the complex region between 1000 cm−1 and 1100 cm−1 showed changes in relative peak ratios across developmental stages.
These observations confirmed that Raman spectroscopy could detect meaningful biochemical changes during cartilage development. The next step was to extract quantitative information from these spectra by focusing on specific biomarker peaks associated with key matrix components.
DNA content
Cellularity, as assessed by DNA content, showed characteristic changes during cartilage development. Both Raman spectroscopy and the destructive PicoGreen assay detected significantly higher DNA content in fetal and neonatal cartilage compared to juvenile and mature tissue (Fig. 2).
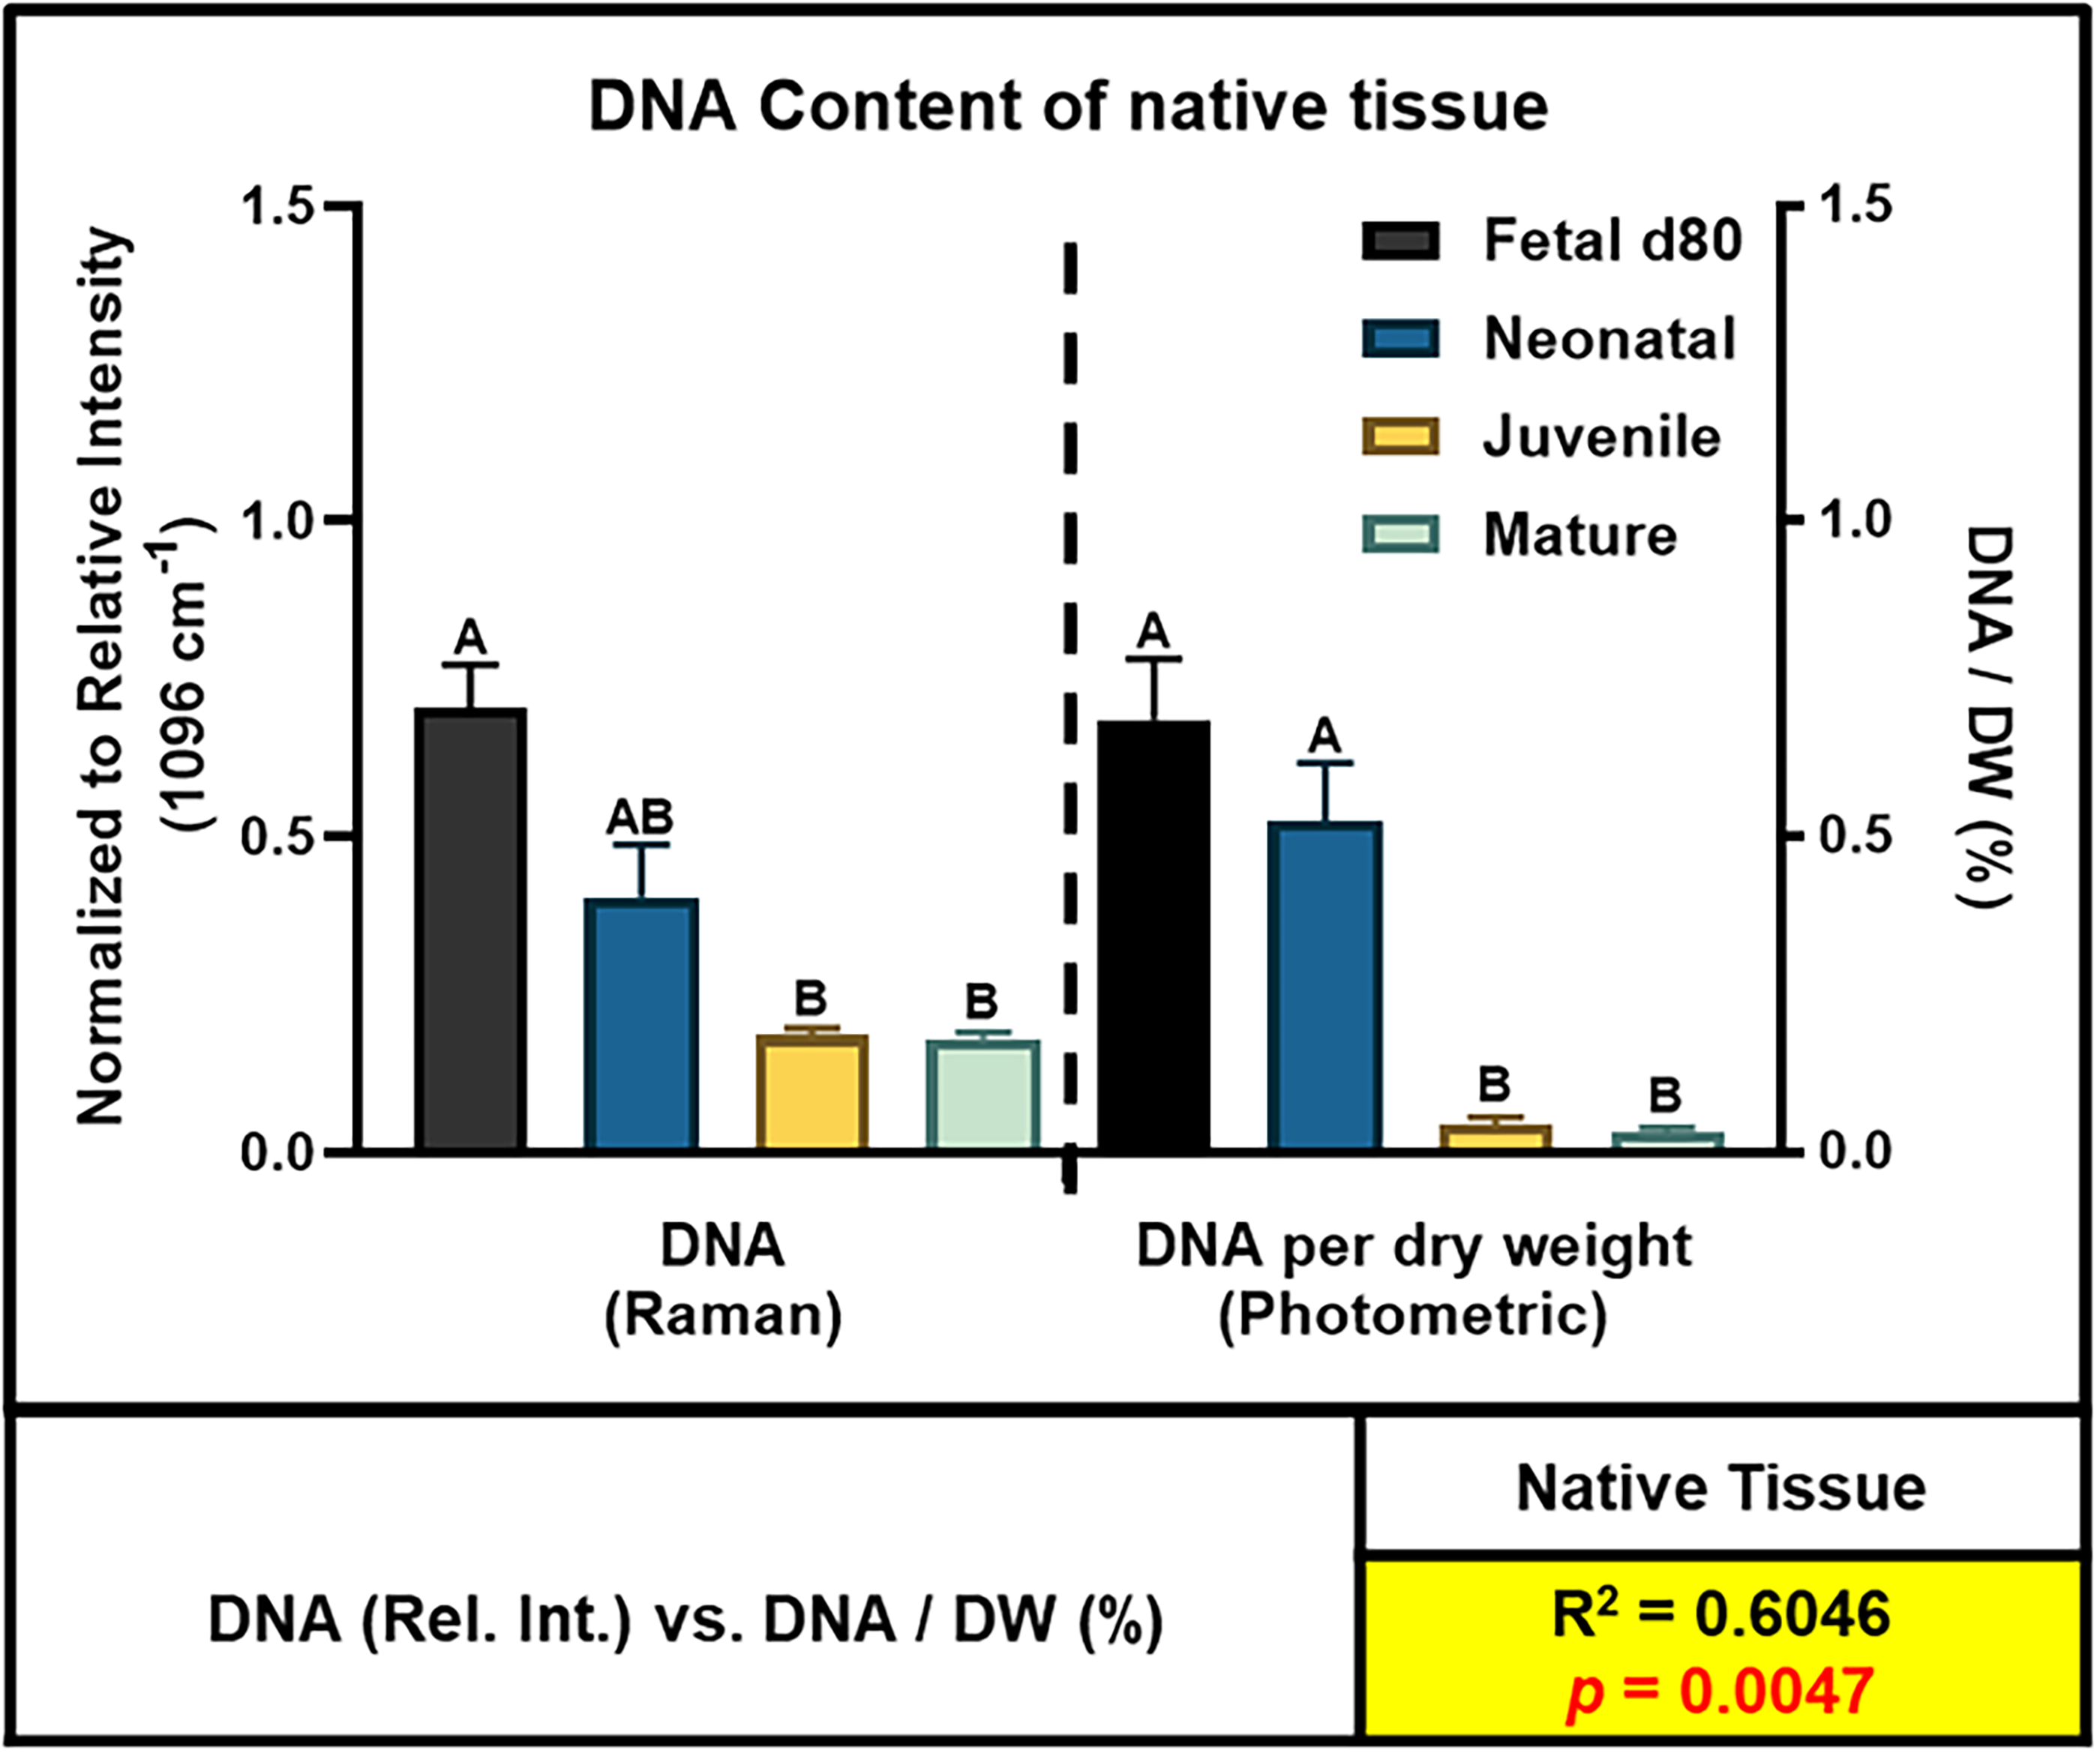
PicoGreen photometric and Raman spectroscopic analysis of DNA content of cartilage with test methods separated by dashed line (|). Correlation (R2) and correlation probability (p value) of matched pair data with R2 > 0.5 and p value < 0.1 highlighted (in red). DNA content was compared between Raman spectra and PicoGreen assay values normalized to dry weight, since cartilage has a variable extracellular matrix composition, and normalization ensures that DNA reflects cell content rather than total tissue mass. All data are presented as means ± standard error mean, and statistical significance is indicated by groups not sharing the same letters.
The Raman measurements focused on the peak at 1096 cm−1, corresponding to the symmetric stretching vibration of phosphate groups in the DNA backbone.6,7 The relative intensity of this peak was highest in fetal cartilage, decreased in neonatal tissue, and was lowest in juvenile and mature cartilage. Statistical analysis confirmed that all pairwise comparisons between groups were significant (p < 0.001) except between juvenile and mature tissue.
Glycosaminoglycan content
GAG content, a key indicator of cartilage functional capacity, showed complex changes during development. Both Raman spectroscopy and the destructive DMMB photometric assays revealed developmental differences in sGAG content of native cartilage (Fig. 3). Fetal and neonatal tissues showed the highest sGAG levels, while juvenile and mature tissues showed significantly lower levels. A strong correlation (R2 = 0.6401) was observed between the cumulative relative intensity of Raman peaks (corresponding to CS4 and CS6) and the photometric quantification of GAGs in cartilage samples as a function of developmental stage (Fig. 3). The correlation between Raman and DMMB measurements was strong (R2 = 0.6401, p < 0.010) and suggests that both methods capture the same biological trends.
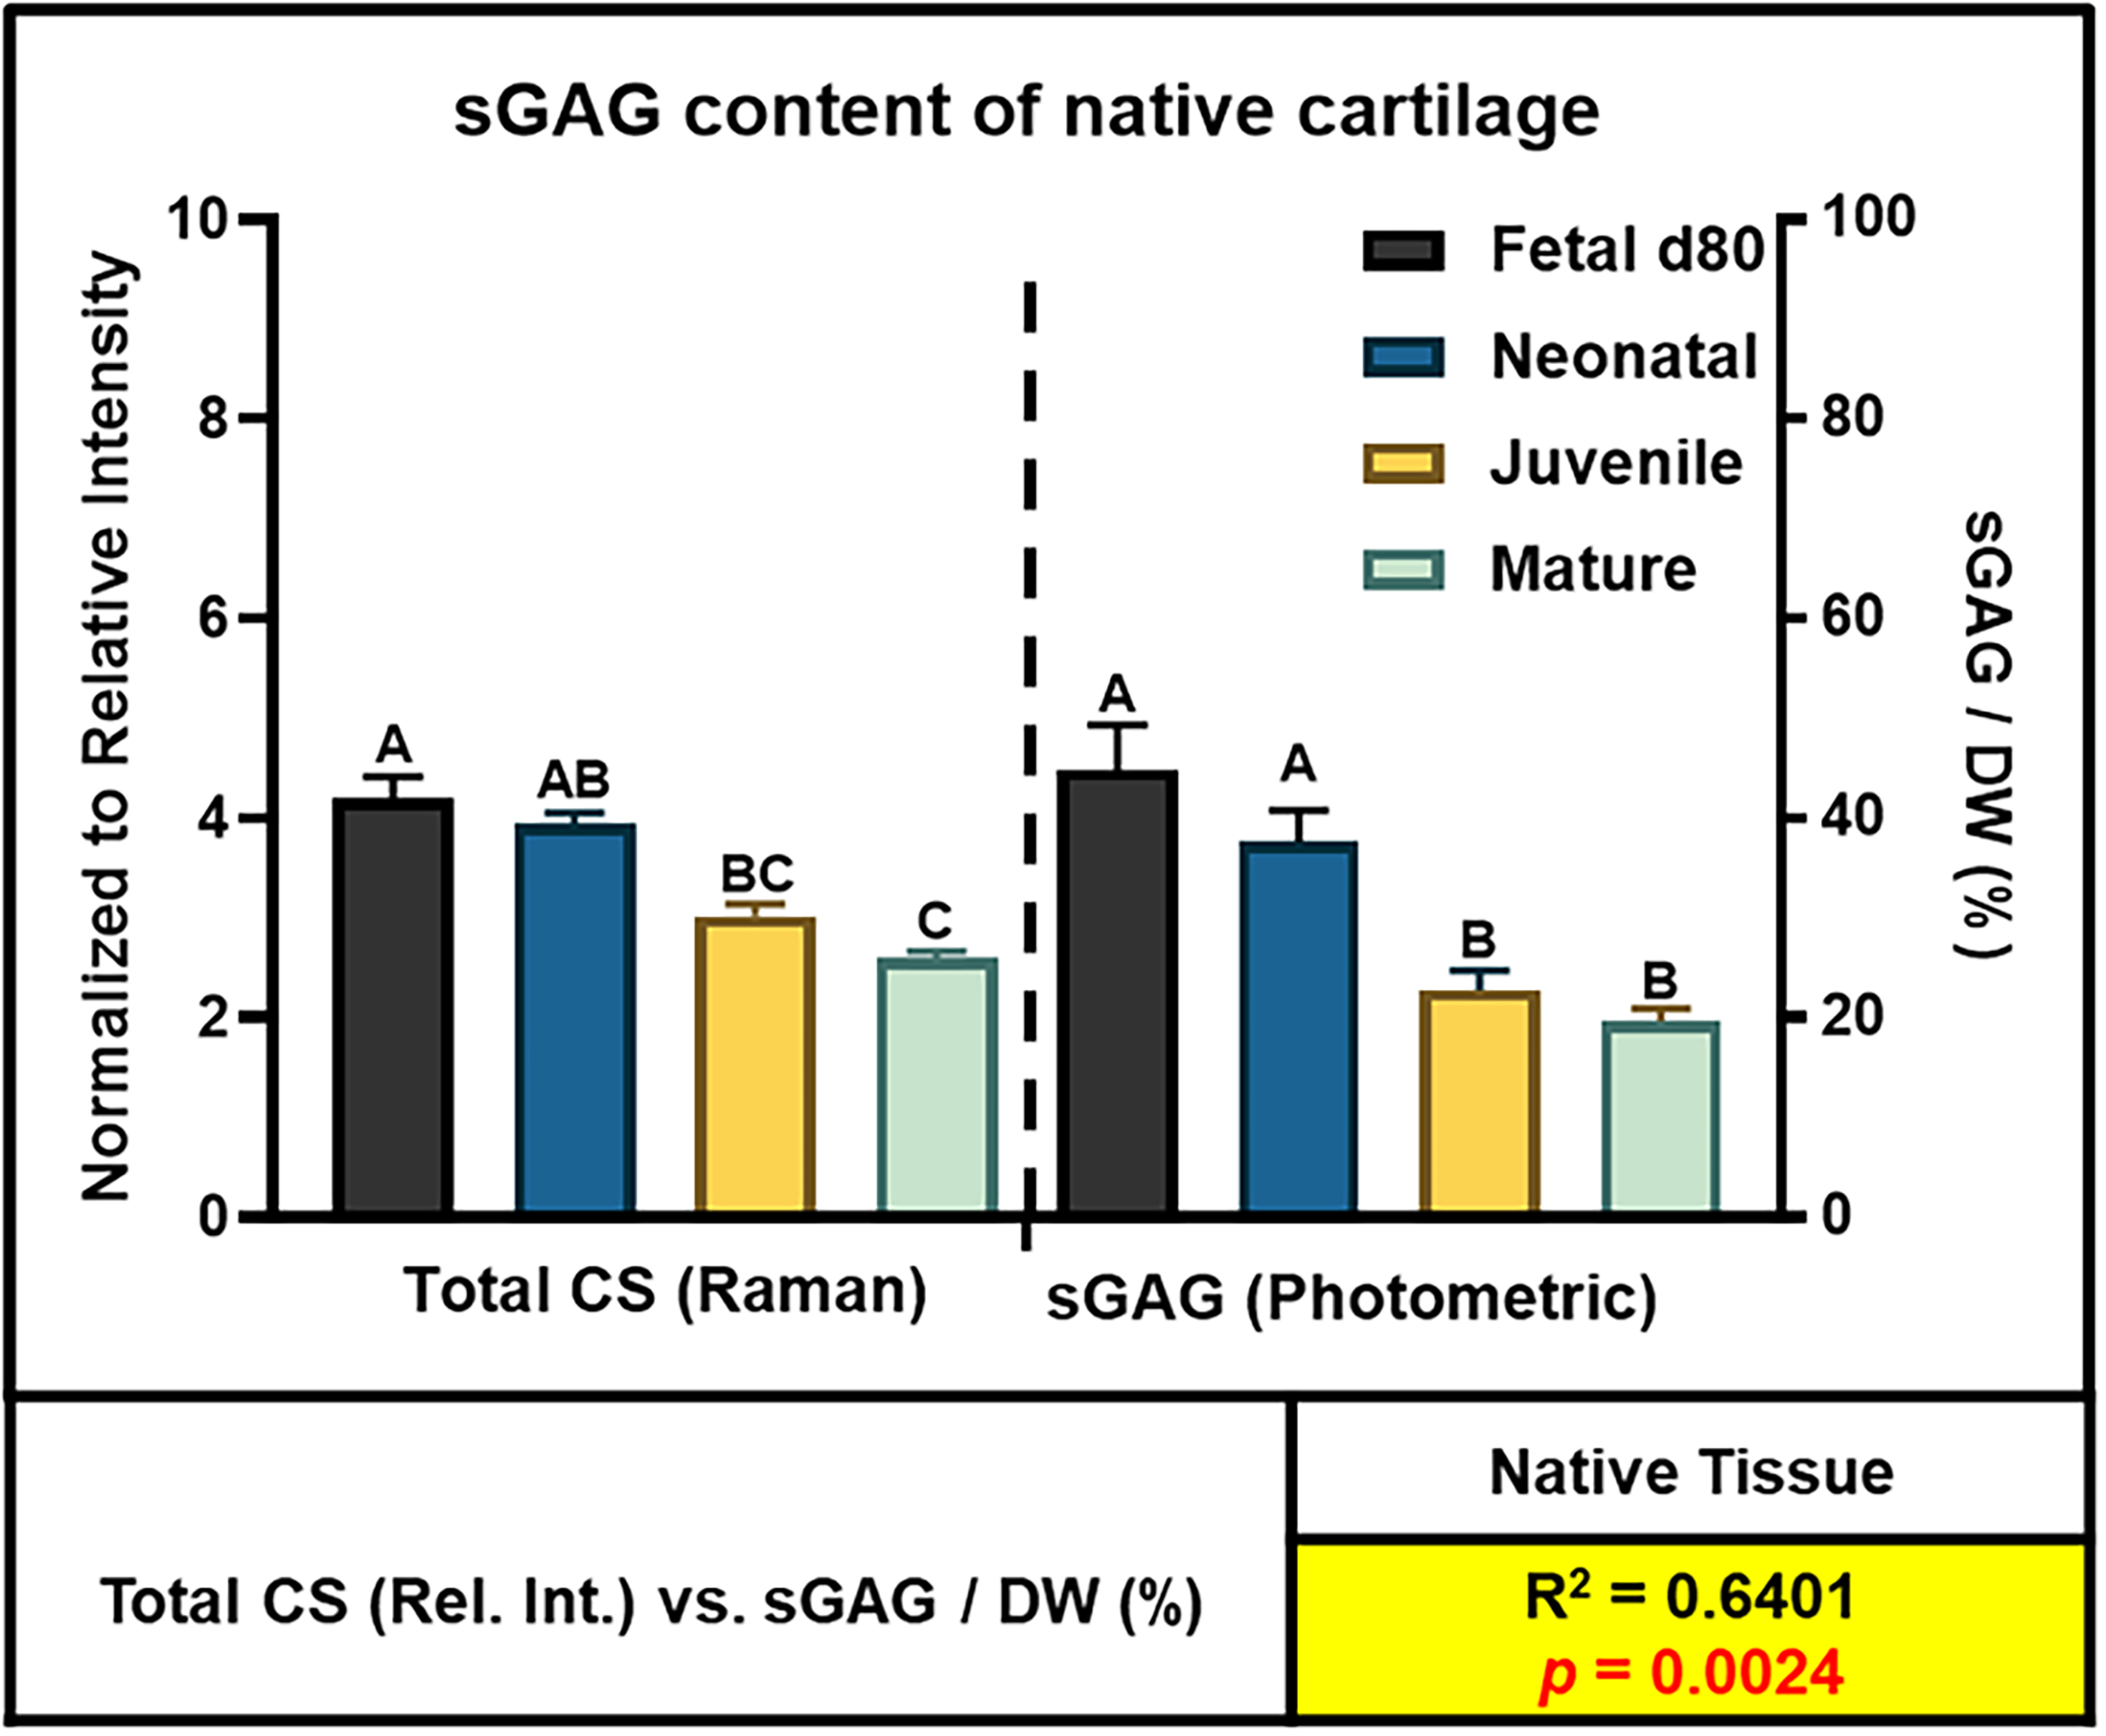
DMMB photometric assay and Raman spectroscopic analysis of sGAG content analysis of cartilage with test groups separated by dashed line (|). Correlation and correlation probability of matched pair data with highlighted R2 > 0.5 and p value < 0.1 (in red). DMMB, dimethylmethylene blue; sGAG, sulfated glycosaminoglycan. All data are presented as means ± standard error mean, and statistical significance is indicated by groups not sharing the same letters.
Collagen content
The hydroxyproline assay for total collagen showed progressive increases with cartilage maturation. Raman spectroscopy detected this increase via a summed intensity metric representing total collagen-associated protein signals (see “Materials and Methods” section). This composite Raman signal and the total collagen measured from hydroxyproline both increased with development (Fig. 4). The percentage of collagen in the dry weight (calculated from hydroxyproline data × 7.14) also increased with development. This increase reflects the growing dominance of the collagen network in the mature extracellular matrix. Raman and photometric measurements showed a strong correlation (R2 = 0.8208, p < 0.001), confirming that this multipeak Raman metric serves as a reliable, nondestructive method for quantifying relative collagen content during cartilage development.
Pyridinoline crosslinks
Pyridinoline crosslinks, which stabilize the collagen fibrils and contribute to tissue mechanical properties, showed dramatic increases with cartilage maturation (Fig. 5). Both Raman spectroscopy and LC-MS mass spectrometry detected this pattern, though the absolute values differed between methods.
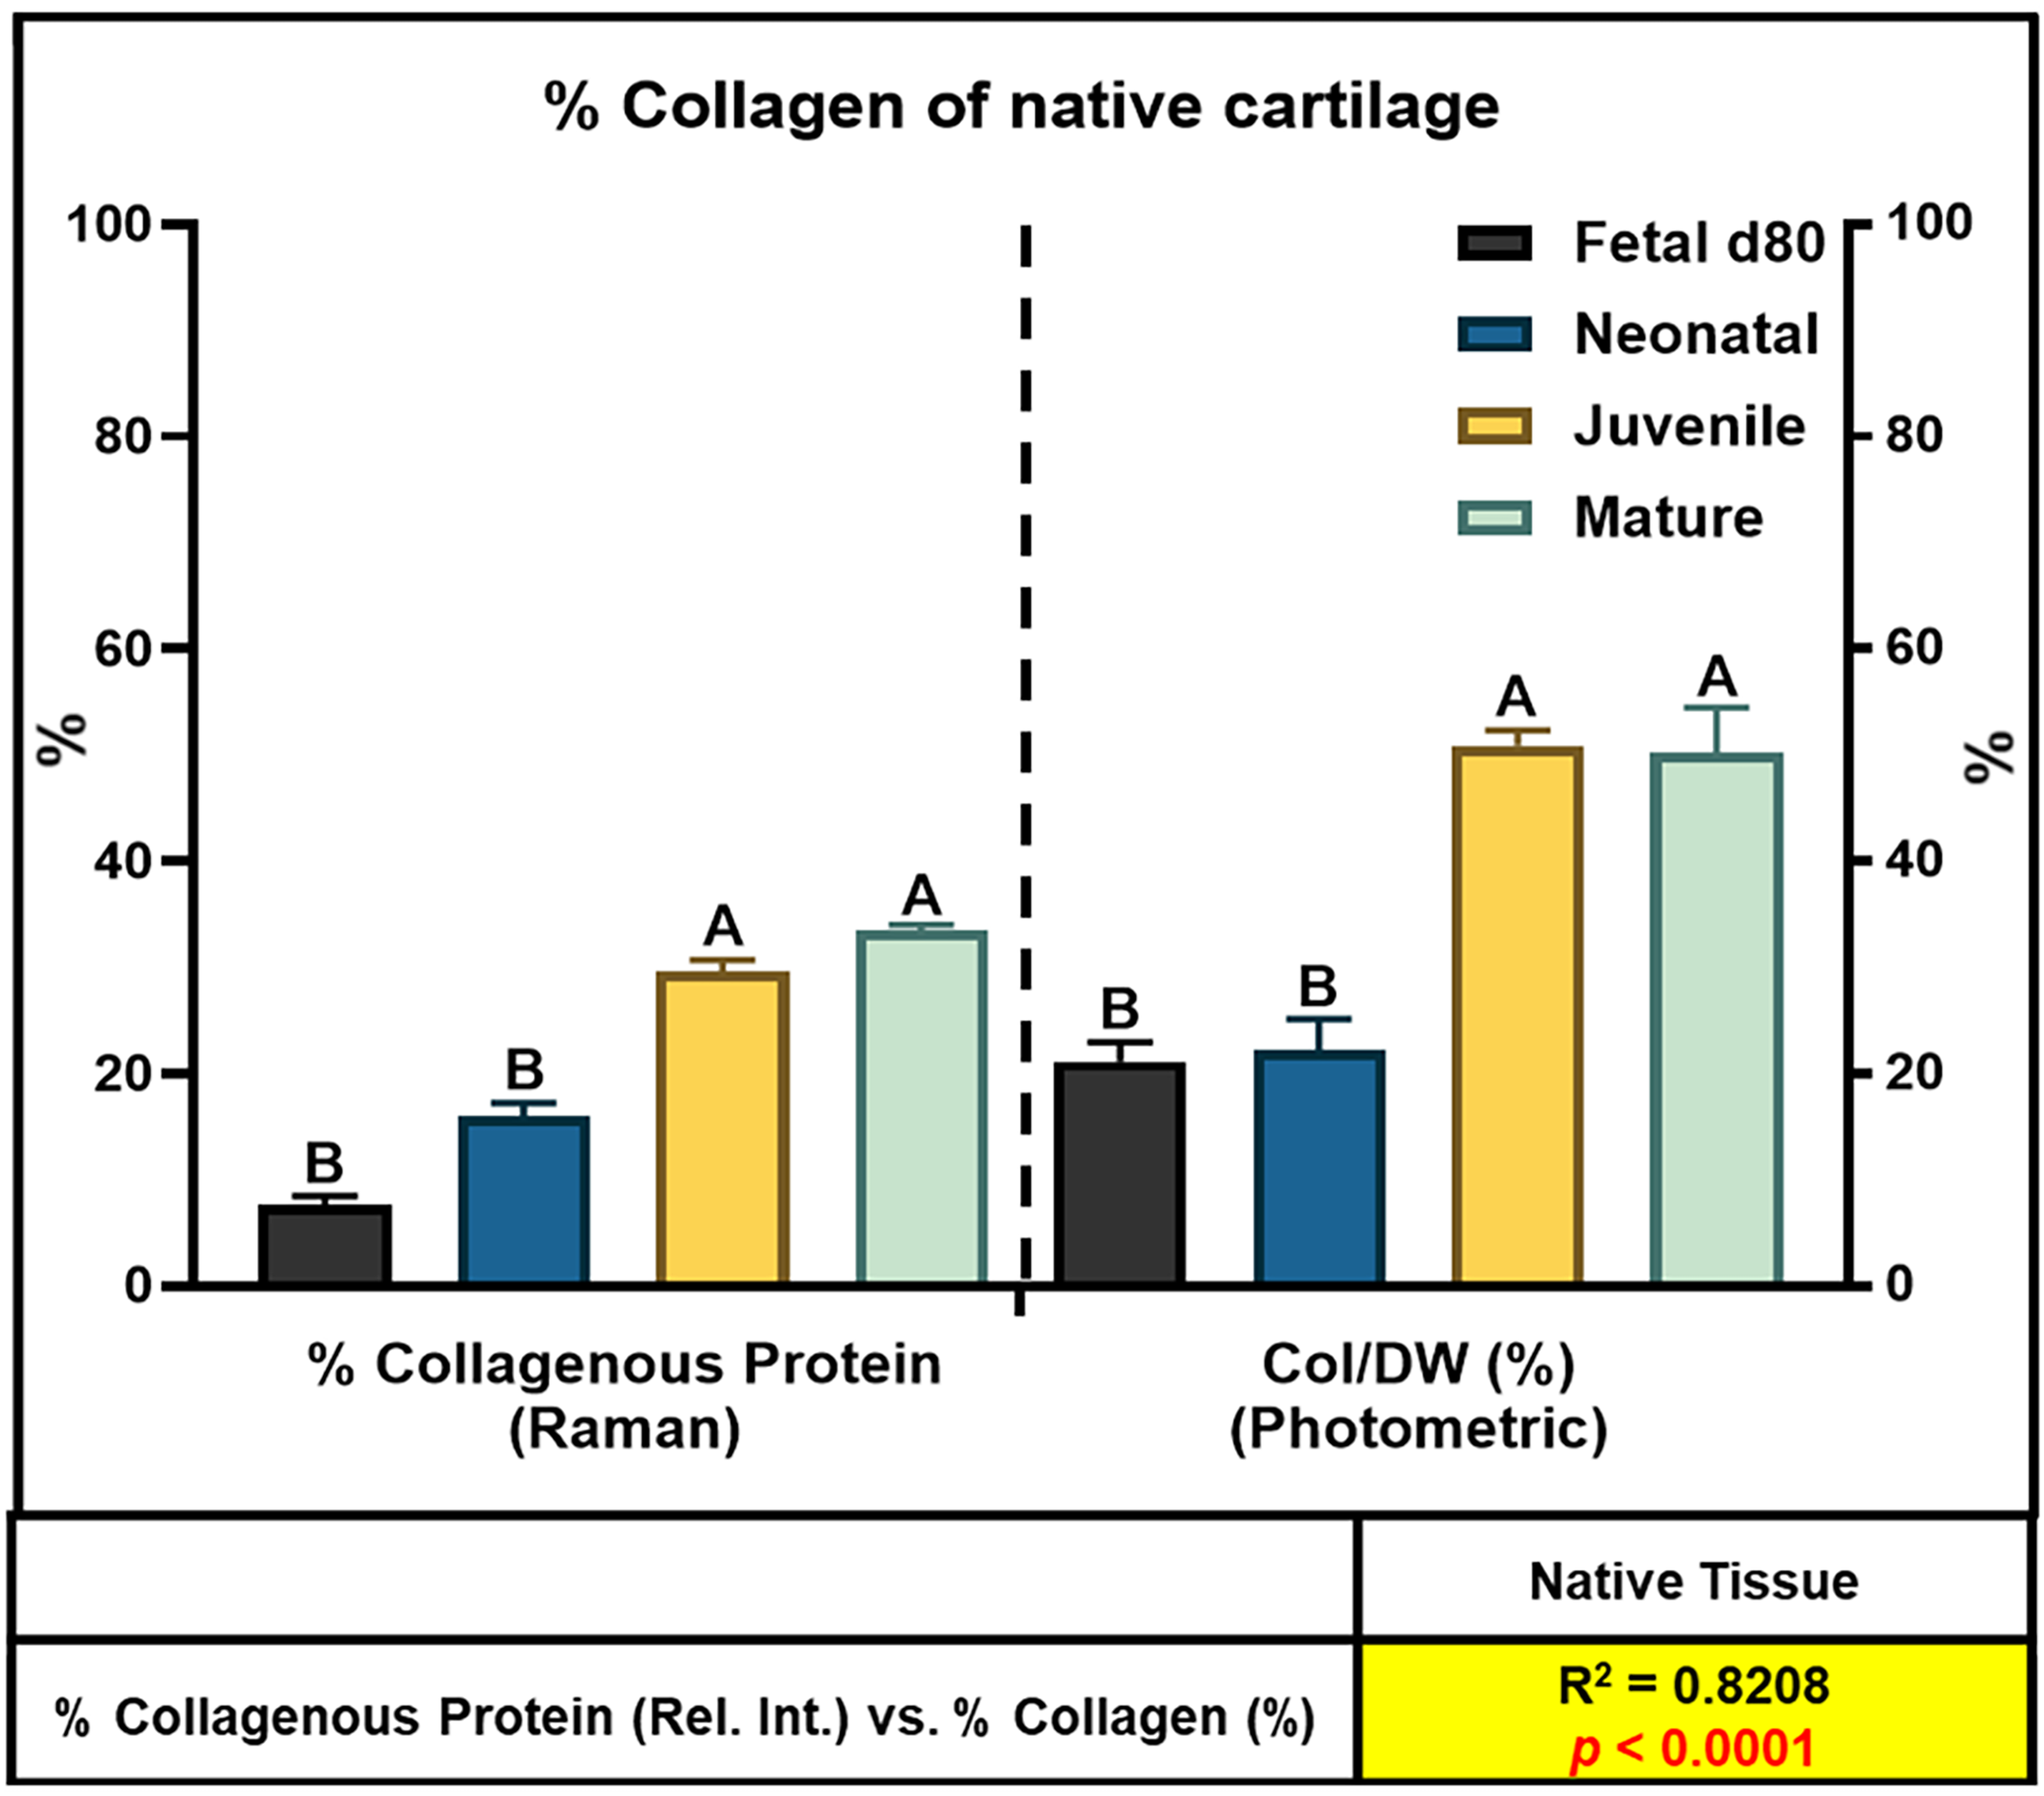
Percent collagen as measured by hydroxyproline photometric assay and Raman spectroscopic analysis of total collagen content of cartilage with Raman (left) and photometric (right) test groups separated by a dashed line (|). Correlation and correlation probability of matched pair data with highlighted R2 > 0.5 (yellow) and p value < 0.1 (red). All data are presented as means ± standard error mean, and statistical significance is indicated by groups not sharing the same letters.
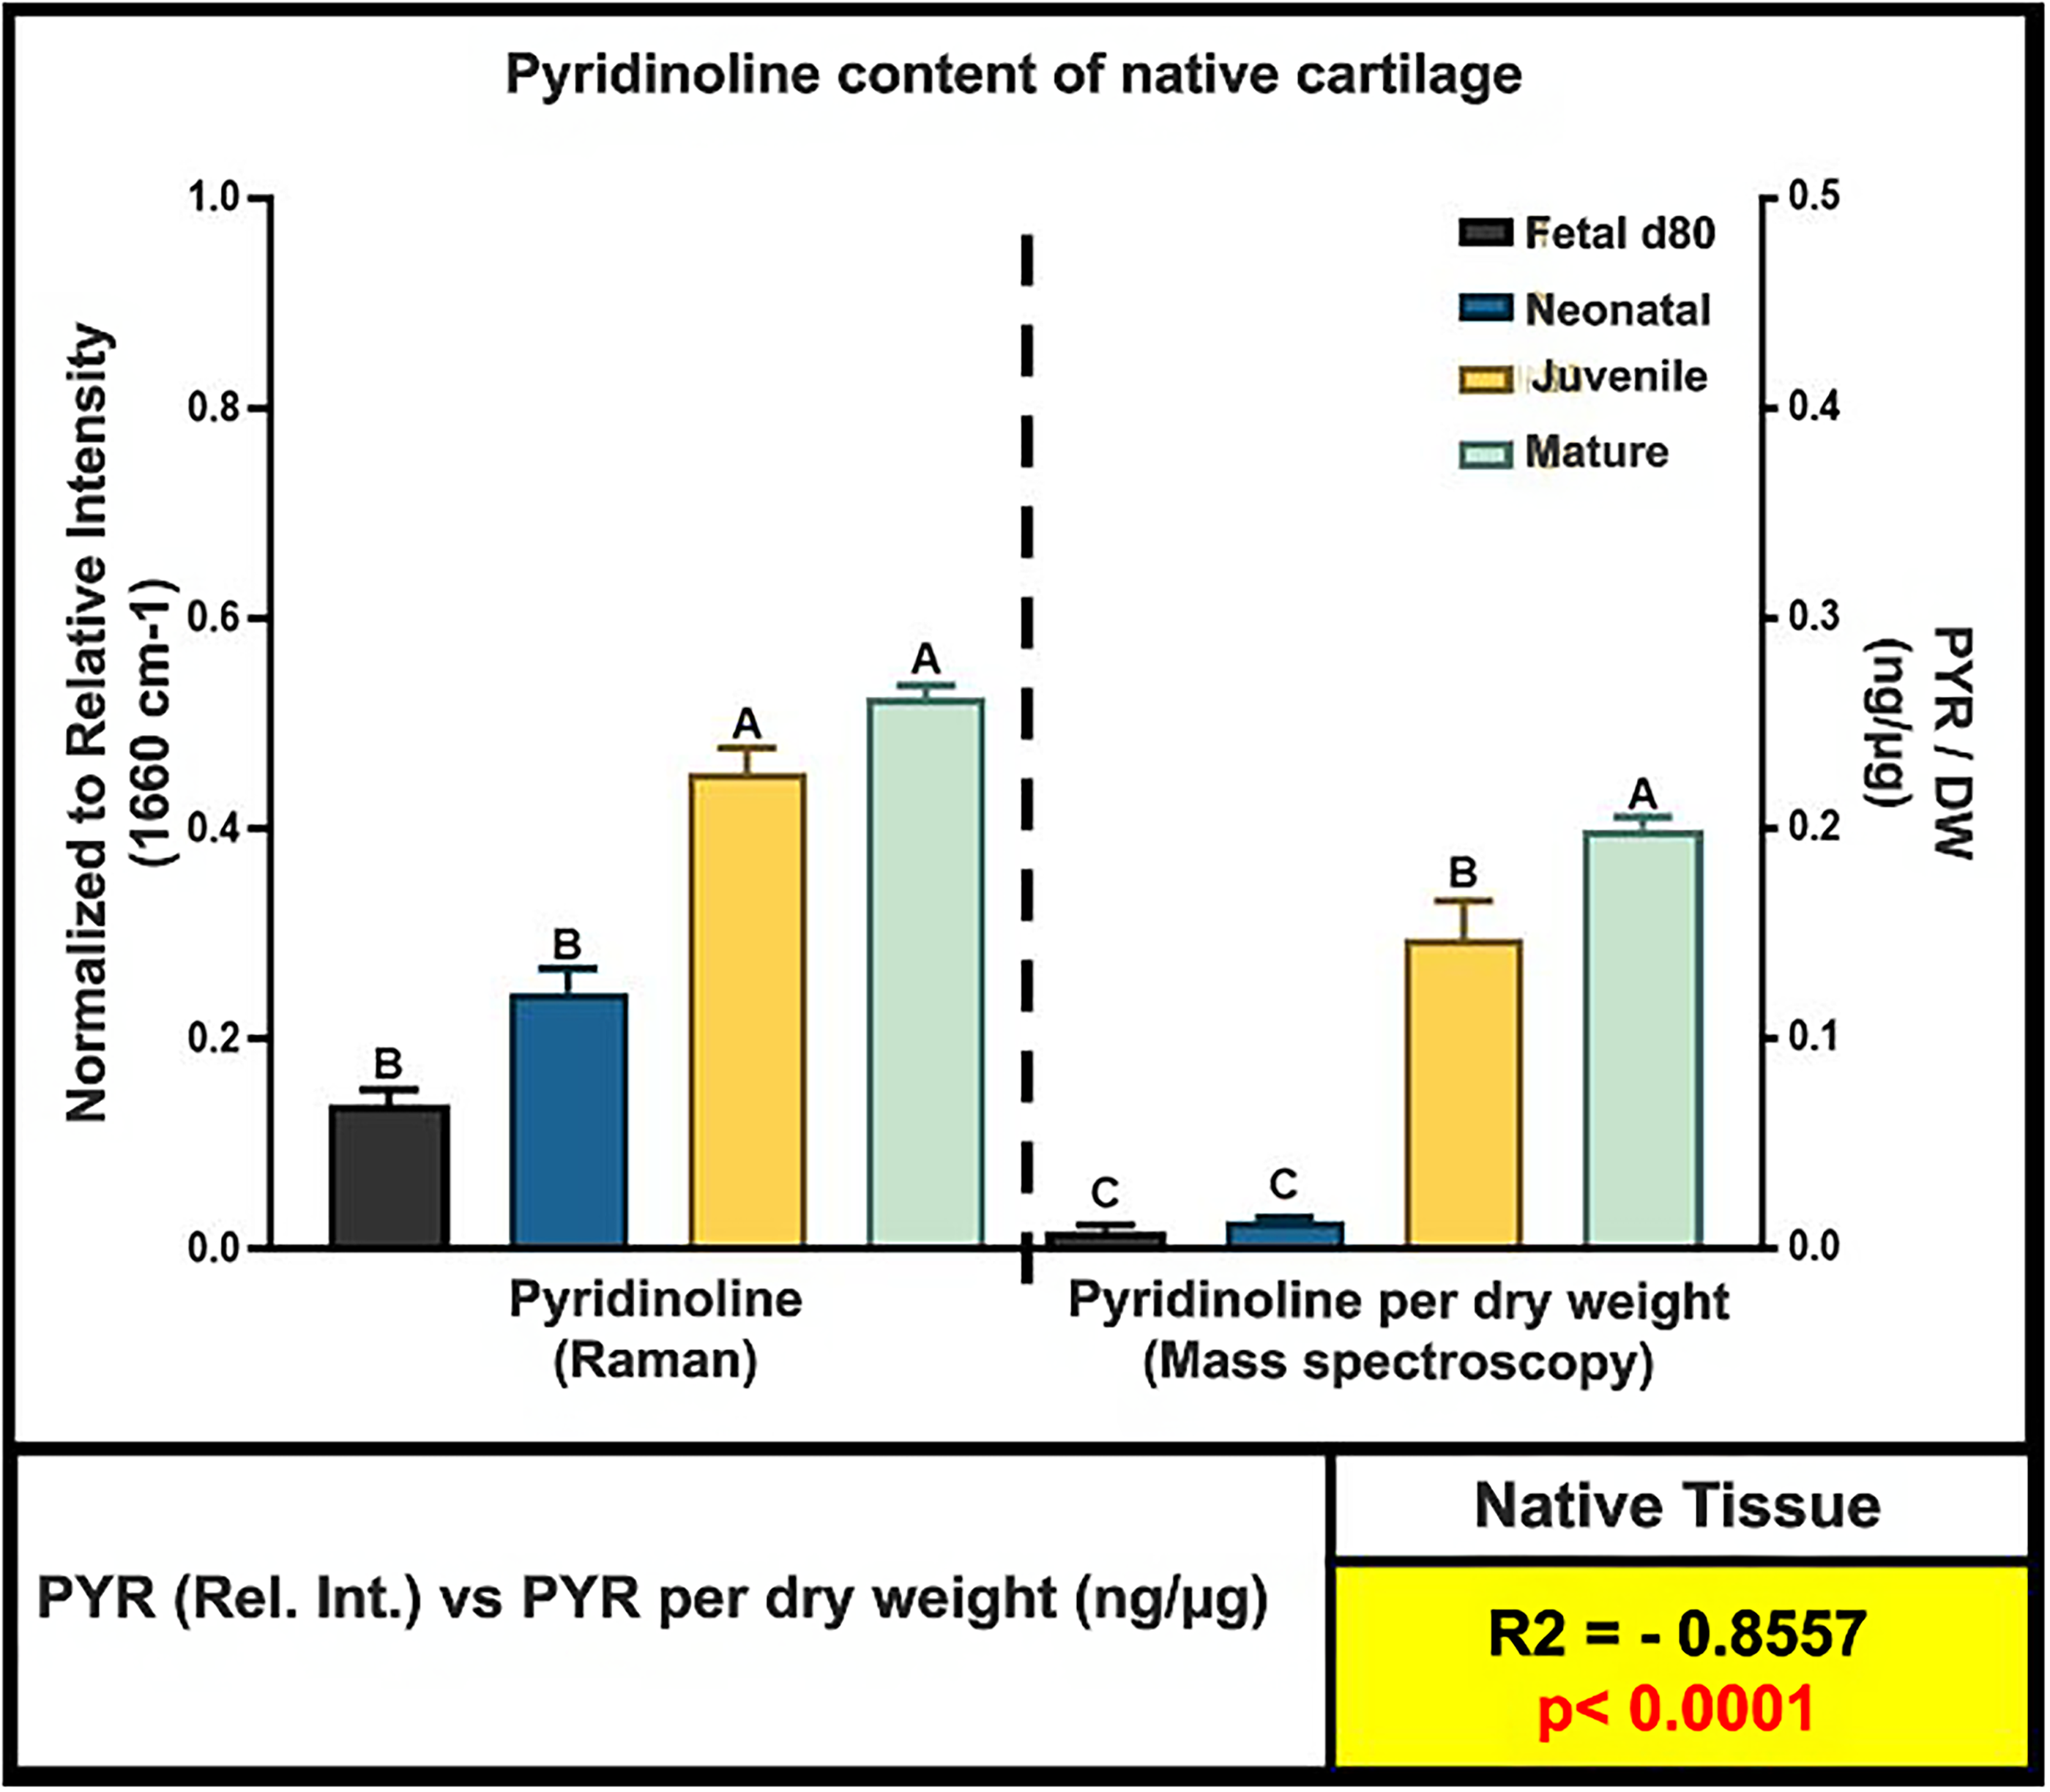
Mass spectrometric and Raman spectroscopic analysis of pyridinoline content analysis of cartilage with test groups separated by dashed line (|). Correlation and correlation probability of matched pair data with highlighted R2 > 0.5 (yellow) and p value < 0.1 (red). All data are presented as means ± standard error mean, and statistical significance is indicated by groups not sharing the same letters.
The Raman measurements focused on the peak at 1660 cm−1, which is associated with the mature trivalent pyridinoline crosslinks.18,19,21 The relative intensity was very low in fetal and neonatal cartilage, increased substantially in juvenile tissue, and was highest in mature cartilage. All pairwise comparisons were statistically significant (p < 0.001). The LC-MS measurements quantified pyridinoline content normalized to both dry weight and hydroxyproline content. The correlation between Raman and LC-MS measurements was excellent. For Raman intensity versus pyridinoline/dry weight: R2 = 0.8403, p < 0.001. For Raman intensity versus pyridinoline/hydroxyproline: R2 = 0.8327, p < 0.001. The slopes were 0.89 and 0.91, respectively.
Photometric and spectroscopic Maturity Index
Based on the individual biochemical parameters, we developed a composite MI that integrated information about GAG content, collagen content, and pyridinoline crosslinking into a single quantitative metric (Fig. 6). The MI was designed to approach a value of 1 for fully mature tissue, with lower values indicating less mature tissue. Values > 1 are possible due to variance in the system.
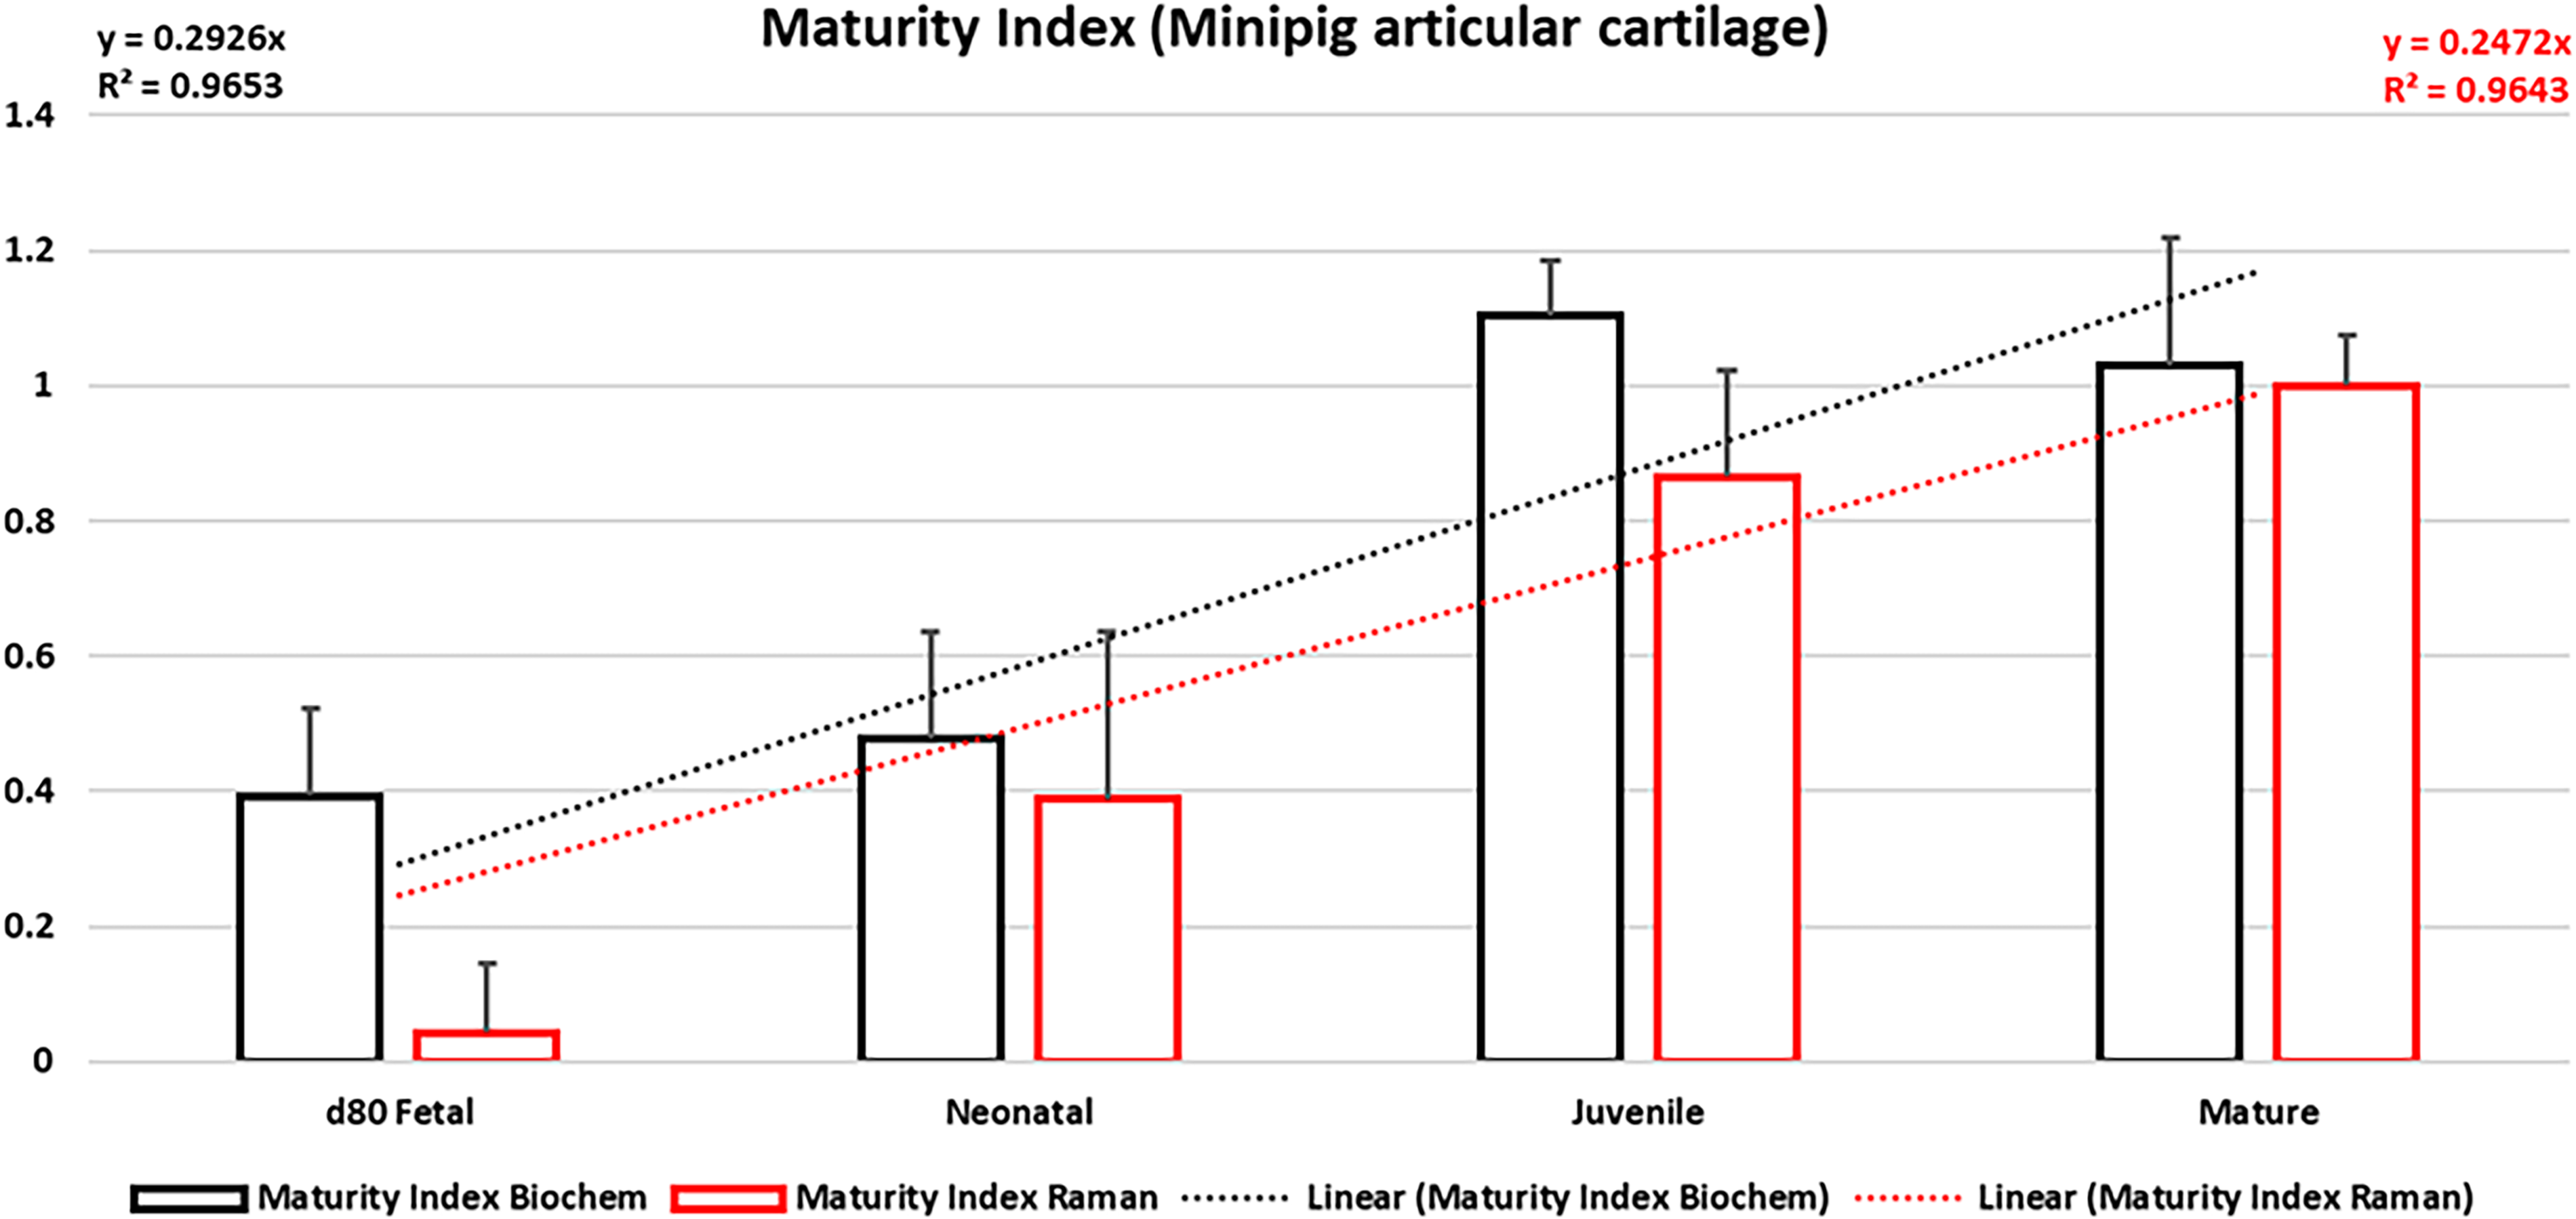
Maturity Index comparison of Fetal–Neonatal cartilage as determined by photometric (destructive) and spectroscopic (nondestructive) methods with annotated R2 linearity (dotted line). All data are presented as means ± standard error mean.
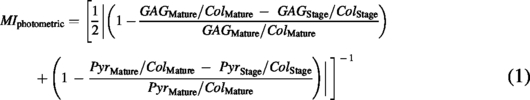
Raman-based MI (Fig. 6) was modeled after the previously established FI,14,30,31 where overall tissue quality was quantified by comparing the neocartilage’s properties to those of natural cartilage. Maturity indices were calculated based on correlative photometric and spectroscopic assays and have been developed based on biochemical parameters currently used for cartilage FI measurements, specifically stiffness, tensile stiffness, GAG content, and collagen content parameters. Here, we extend our previous work on cartilage scoring by verifying the following photometric MI (MIphotometric):
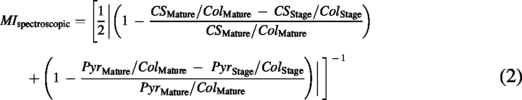
The correlation between photometric and spectroscopic MI values was excellent (R2 = 0.9653, p < 0.001) with a slope of 0.98 and intercept of 0.02, indicating nearly perfect agreement between the two methods. This strong correlation suggests that the Raman-based MI can serve as a reliable nondestructive surrogate for the destructively measured MI.
Discussion
This study demonstrates that Raman spectroscopy can serve as a reliable, nondestructive method for quantitative assessment of AC development. The strong correlations between Raman measurements and established destructive assays across all major biochemical components (DNA: R2 = 0.6046; GAGs: R2 = 0.6401; collagen: R2 = 0.8088–0.8208; pyridinoline: R2 = 0.8403) provide compelling validation of the spectroscopic approach. Furthermore, the development of a Maturity Index that integrates multiple biochemical parameters into a single metric represents a significant advance for cartilage tissue engineering quality assessment.
Spectral analysis of cartilage development
The observed spectral changes reflect the biochemical and structural maturation of cartilage. The progressive improvement of Raman-based spectral quality with developmental stage suggests an evolution from a more disordered to a more organized molecular structure. This evolution from amorphous to ordered structure is consistent with the known process of cartilage maturation, where initially disorganized matrix components become increasingly structured and aligned. The increase of “Total Organic Matrix” (Supplementary Fig. S1 indicates the increasing collagen content and improved fibrillar organization that occurs in developing cartilage 32 among others. The peaks in the 1000 cm−1 to 1100 cm−1 region showed changes in relative intensity and profile shape that suggested compositional changes in the PG population by age, including possible alterations in GAG sulfation patterns or relative proportions of different GAG types. To quantify the observed shift in matrix-to-cellular dominance, we calculated the lipid-to-protein matrix ratio for each developmental stage. This ratio was derived from the sum of baseline-corrected peak intensities related to the ester carbonyl (∼1745 cm−1) and CH2 twist (∼1300 cm−1) associated with lipid acyl chains, normalized to the sum of organic matrix components (GAGs, collagenous, and noncollagenous protein) representing the total protein matrix.
This analysis revealed a significant decrease in the lipid-to-protein ratio from fetal (0.29 ± 0.10) to mature (0.20 ± 0.02) stages (p < 0.02, see Supplementary Fig. S2), quantitatively supporting the interpretation that the extracellular matrix (predominantly proteinaceous) becomes progressively more dominant relative to cellular components (rich in membrane lipids) during cartilage maturation. Additionally, the changes in peak shape and position may reflect changes in collagen secondary structure or crosslinking pattern. Together, these systematic changes suggested that multivariate analysis of spectral features could provide quantitative information about tissue development.
DNA content
It is known that the relative cellularity of cartilage tissue decreases as a function of developmental stage, where nascent and immature tissue exhibit a higher degree of cellularity when compared to mature tissue. 33 Early in development, cartilage contains a high density of chondrocytes that actively produce extracellular matrix. As the tissue matures, the matrix expands dramatically while the cell population remains relatively constant or decreases slightly through apoptosis, resulting in lower cellular density. Our results in Figure 2 are consistent with this expectation, demonstrating higher DNA content in fetal and neonatal cartilage, indicative of greater cell density at early stages of development. The lower DNA levels in juvenile and mature cartilage are consistent with tissue maturation, 23 where ECM expands relative to the number of cells, leading to reduced cell density per dry weight.
The strong correlation (R2 = 0.6046) between Raman and PicoGreen measurements demonstrates that confocal Raman spectroscopy can serve as a reliable, nondestructive surrogate for assessing tissue cellularity, unlike PicoGreen, which requires destructive tissue processing. This correlation is mechanistically grounded: our Raman sampling protocol (multiple spatially averaged spots) captures a tissue-averaged signal that includes contributions from both chondrocytes and the ECM, analogous to the bulk tissue homogenate used in the destructive assay. The higher DNA signal in fetal and neonatal cartilage corresponds to greater chondrocyte density and metabolic activity during active growth and matrix synthesis. As the tissue matures, ECM expansion dilutes the cellular fraction, leading to the observed decrease in both Raman and biochemical DNA measures. Crucially, the Raman method achieves this without destroying the sample, enabling longitudinal tracking of cellularity in the same specimen—an impossible feat with destructive assays. This capability is particularly valuable for monitoring cell proliferation, death, or metabolic changes in developing tissue-engineered constructs or in studies of cartilage degeneration over time.
Glycosaminoglycan content
It is well established that sGAG content is inversely correlated with age, and our experimental data in Figure 3 are consistent with this expectation. 34 Figure 3 findings show that sGAG content is highest in fetal/neonatal cartilage and decreases in juvenile/mature tissue, consistent with matrix remodeling during maturation. High content in fetal and neonatal cartilage reflects the early establishment of the PG-rich matrix, which provides the osmotic properties necessary for cartilage function. The decrease in GAG content with maturation may seem counterintuitive but is consistent with some literature reports showing that immature cartilage sometimes has a higher GAG concentration that decreases slightly in proportion to collagen, whose content increases with age as the tissue becomes more organized.
An important consideration in the GAG analysis is the specificity of the methods. The DMMB assay primarily detects sGAGs (chondroitin sulfate, keratan sulfate) with limited sensitivity for HA, which is nonsulfated. The Raman approach included peaks associated with both sGAGs and HA, which might explain the slight differences in absolute values between methods.
Most physicochemical and biochemical analyses of GAGs from complex biological systems like tissues and cells have involved ion pairing chromatography and mass spectrometry applied to enzyme digest solutions.35,36 These methods are time-consuming and require specific reagents and enzymes. Therefore, novel and alternative methods of GAG analysis have been developed. The rapid, non-invasive, and nondestructive approach based on Raman spectroscopy presented here appears to be promising because it gives a global molecular fingerprint that can be used for GAG characterization, exhibits good correlation to standard photochemical assays, and requires less time to perform.
Collagen content
Collagen content (Fig. 4) increased from fetal to mature cartilage, reflecting the progressive accumulation and organization of ECM during tissue maturation. This trend matches known cartilage development, where collagen-rich fibrils gradually replace the initially cell-dense, matrix-poor early tissue. 33 This pattern contrasts with the decreasing trends observed for DNA and GAGs, highlighting the dynamic nature of matrix remodeling during development. Both Raman collagen signals and biochemical assays showed consistent age-dependent increases. The progressive increase in collagen content is biologically significant. Early in development, cartilage matrix contains relatively more PGs and less collagen. As the tissue matures, the collagen network becomes more extensive and organized, providing the tensile strength needed for mechanical function.
The excellent correlation between Raman and destructive methods demonstrates that Raman spectroscopy can reliably quantify these important developmental changes. Thus, Raman may be used as an alternative collagen quantification assay to the hydroxyproline assay. The non-invasive and nondestructive nature of Raman collagen quantification offers significant advantages over the hydroxyproline assay, such as the ability to track samples over time throughout culture periods or to analyze tissues prior to destructive mechanical testing. Furthermore, Raman does not require dangerous chemical reagents that are needed to perform the hydroxyproline assay. 22 Therefore, researchers performing tissue engineering and tissue characterization experiments may consider Raman spectroscopy for collagen analyses.
Pyridinoline crosslinks
The increasing pyridinoline content with maturation is biologically significant. Pyridinoline crosslinks form through enzymatic processes that mature over time, stabilizing the collagen fibrils and increasing tissue mechanical strength. The very low levels in fetal and neonatal tissue indicate immaturity of the collagen network, while the high levels in mature tissue reflect a fully developed, mechanically competent matrix. Collagen crosslinking is an important parameter when assessing tissue maturity and can be measured as changes in the amide I region. This was first illustrated by Fourier-transform infrared spectroscopy,18,37 where biochemical analysis of collagen model peptides showed that mature trivalent crosslinks (PYR), Figure 5, crosslinks resulted in a band at ∼1660 cm−1 and immature divalent dehydrodihydroxylysinonorleucine (de-DHLNL) crosslinks in a band at ∼1690 cm−1. It is purported that the content of de-DHLNL crosslinks decreases with collagen maturity, while PYR crosslink content increases, as seen in bone 38 and cartilage, 39 likely due to the maturation of the former to the latter. 40 Most of the published work has focused on determining tissue maturity and, conversely, tissue degeneration based on relative intensity and peak area ratiometry of the 1660 cm−1/1690 cm−1 bands. Even though this metric was developed for infrared spectroscopy, 18 it has been used successfully in Raman spectroscopy.21,41 Unlike the work previously discussed, the current work qualitatively and semiquantitatively measures collagen PYR crosslinks by temporally tracking changes in the relative intensity of 1660 cm−1 Raman shifts to quantitative measurements of PYR as determined by mass spectrometry. The increase in pyridinoline content with development is well established, as collagen fiber bundles mature. 33 Our results corroborate this finding, showing a corresponding increase in pyridinoline content with cartilage maturation using both Raman spectroscopy and mass spectrometry (Fig. 5). The strong correlation between Raman and mass spectrometric measurements validates Raman spectroscopy as a reliable method for assessing collagen crosslinking noninvasively.
The Maturity Index: Relevance, meaning, and critique
The development of the Raman-based MI is a significant conceptual and practical advancement for tissue engineering. This parameter reflects the extent to which the extracellular matrix is fully formed or mature. Rather than monitoring multiple biochemical parameters separately, researchers and manufacturers could use a single integrated metric to assess tissue quality. MI introduced here is focused on temporal compositional changes as measured nondestructively and verified through destructive assay(s). As a direct measure of tissue maturation and TEMP development, MI can be integrated within biomanufacturing workflows for dynamic in situ evaluation of processes for QA/QC. In addition, process optimization may be evaluated with minimal cost. The Raman-based approach allows this assessment to be performed nondestructively, enabling longitudinal monitoring of the same sample throughout development.
The MI integrates three critical, interdependent CQAs:
GAGs (CSStage): Represent the fixed charge density, responsible for hydration and swelling pressure. Collagen (ColStage): Provides the tensile strength and structural scaffold. Pyridinoline (PyrStage): Signifies the maturation and mechanical stabilization of the collagen network..
5
The index’s form of
One potential alternative approach is to employ multivariate statistical techniques, such as Partial Least Squares Regression (PLSR), to develop a model that predicts a ‘maturity score’ based on the full spectral data, rather than relying on preselected peaks. However, while PLSR models can be highly effective, they can also be opaque and challenging to transfer across different instruments or laboratories, and may not provide clear insights into the underlying biological mechanisms. 15 The proposed MI, based on known biochemical peaks, is transparent, easily interpretable, and directly links the metric to biological processes, which is a significant advantage for regulatory approval and fundamental understanding.
The excellent correlation (R2 = 0.9653) between the destructive and spectroscopic MIs is paramount. Comparing the two is not redundant; it is the core of the validation process. The excellent correlation proves that the relationship between these key components is preserved in the Raman data. It demonstrates that the simplified, nondestructive method captures the same complex biological narrative as the combined effort of three separate, destructive gold-standard assays. This relevance is crucial for granting confidence to use the Raman MI as a surrogate endpoint in manufacturing.
Quantitative performance and validation of Raman spectroscopy
This study establishes Raman spectroscopy as a robust quantitative method for tracking cartilage development, moving beyond its traditional role as a qualitative tool. The high linear correlations (R2 > 0.96 for Raman vs. destructive assays) across all major biochemical constituents—DNA, sGAG, collagen, and pyridinoline—provide compelling validation. This performance is particularly significant when placed in a broader context. Similar Raman-based quantification efforts in other tissues, such as bone (mineral-to-matrix ratio) or skin (collagen hydration), typically report strong qualitative trends but often achieve lower quantitative R2 values (often in the range of 0.7–0.85) when correlated against destructive standards.7,12 The exceptional correlations (R2 > 0.96) we observed for cartilage can be attributed to the tissue’s relatively simplified extracellular matrix (dominantly Type II collagen and specific GAGs) compared to more compositionally complex tissues, making it an ideal model for developing precise spectroscopic biomarkers.
A key question remains: how does the sensitivity of Raman spectroscopy compare to that of destructive assays? Our data suggests its sensitivity is context-dependent and complementary. For high-abundance components like total collagen, traditional assays like the hydroxyproline assay may have a lower absolute detection limit. However, Raman’s strength lies in its multiplexed, nondestructive sensitivity. For instance, it can detect the pyridinoline crosslink signal in nascent tissue where its concentration is too low for easy quantification by LC-MS without extensive sample pooling. 11 Furthermore, while a Picogreen assay might be more sensitive for isolated DNA quantification, it requires tissue destruction. Raman provides a statistically significant (p < 0.05) measure of relative cellularity in situ without damaging the sample, allowing for longitudinal tracking that is impossible with destructive methods. 13 While Raman spectroscopy may not necessarily offer a lower detection limit than traditional methods, it provides a significant advantage in terms of informational efficiency, extracting multiple quantitative data points from a single, rapid, and nondestructive measurement.
Methodological considerations: GAGs and limitations
The choice to sum only sGAG (CS4/CS6) peaks, excluding nonsulfated species like HA, is justified for this context. HA is more prevalent in the pericellular matrix and synovial fluid, while the sGAGs (chondroitin sulfate, keratan sulfate) are the primary contributors to the fixed charge density of the cartilage ECM proper. 20 Furthermore, the DMMB assay used for validation is specific for sGAGs. 16 Therefore, using CS4/CS6 peaks ensures a direct and valid comparison to the destructive benchmark. For studies specifically focused on the pericellular matrix or synovial joint biology, incorporating HA peaks would be essential.
Several limitations and potential areas for error must be acknowledged:
Spectral overlap: The greatest potential for error is in crowded spectral regions, particularly the Amide I region (∼1660 cm−1) where the pyridinoline signal resides. Changes in collagen secondary structure or water content could theoretically influence this peak.
17
Our validation against LC-MS mitigates this concern for this study, but it remains a consideration for unknown samples. Sampling depth: The confocal Raman microscope probes a small volume (∼µm³). While multiple scans were averaged, the measurement remains a surface-weighted analysis. Heterogeneity within the tissue depth (e.g., the tidemark) could be missed. Model specificity: The current model is built and validated on native, healthy porcine cartilage development. Its direct application to engineered tissues (which may have different matrix compositions) or diseased states (e.g., osteoarthritis, characterized by degraded GAG fragments and collagen cleavage) requires further validation and potentially an expanded spectral library.
21
Generalizability to other tissues
The concept of a Raman-based MI is highly relevant and can be readily adapted to other tissues. While the specific biomarkers may vary, the underlying methodology provides a versatile template that can be applied to different tissue types:
Bone: An MI could combine the mineral phosphate peak (∼960 cm−1) with the collagen crosslink peak (1660 cm−1) and a matrix ratio.12,18 Vascular tissue: An MI could ratio elastin-specific peaks (∼1100 cm−1, 1340 cm−1) to collagen peaks.
19
Skin: An MI could track collagen organization and hydration levels.
7
In each case, the index would need to be calibrated and validated against destructive standards, as was done here, for that specific tissue. However, the framework established here provides a powerful blueprint for developing nondestructive QA/QC metrics across regenerative medicine.
Conclusion
There has been significant scientific progress in the field of tissue engineering over the last several decades, leading to advancements in therapeutics and devices. Despite the research advancements in the field, only a handful of this work has been translated into a commercialized TEMP, partly due to the QA/QC monitoring and tracking as described herein. Through the course of this work, our intent is to illustrate the capacity of Raman spectroscopy as a viable, rapid, and nondestructive method for the quantification of tissue biochemical compounds, including collagens, GAGs, and crosslinks. The methods described in this paper correlate well with destructive measurement modalities [OHPro (Hydroxyproline) assay, DMMB assay, MS for PYR], leading to the development of a cartilage-specific MI, which showed excellent correlation to cartilage development. In addition, each respective nondestructive test as well as MI was verified and validated by widely accepted traditional destructive methods.
Nondestructive biochemical analysis including the Raman-based method presented here is particularly valuable in tissue engineering, as it enables continuous monitoring of the growth and development of TEMPs without compromising their sterility or integrity. The development of photometric and spectroscopic MI is commercially significant as it conserves resources and enables the establishment of release criteria for QA/QC and traceability. Consequently, it enhances understanding and confidence in the quality of surgically deployed implants, moving beyond reliance on assumptions based on the composition of similar devices.
Multiplexing, or the capability of analyzing multiple analytes at a given time, is another advantage and potential capability of nondestructive Raman spectroscopy method developed here. By minimizing the need for sample preparation, this renders the method more efficient and thus streamlines studies and manufacturing processes. Additionally, by correlating other Raman measurements to proteomic components such as collagen subtypes (which have special, unique structure-function relationships) as well as mechanical properties (to develop structure-function relationships of Raman measurements) will further validate Raman spectroscopy for tissue characterization and tissue engineering.
This work successfully transitions Raman spectroscopy from a qualitative observational tool to a validated quantitative platform for cartilage characterization. The high correlation with destructive benchmarks, the development of a physiologically meaningful MI, and the clear outline of its strengths and limitations provide a strong foundation for its adoption in tissue engineering biomanufacturing. The methodology offers a scalable, multiplexable, and nondestructive path toward ensuring the quality and efficacy of next-generation TEMPs, not only for cartilage but for the field of regenerative medicine as a whole.
Authors’ Contributions
N.J.C., R.D., B.B. performed Raman, mechanical testing, and mass spectrometry, respectively, as well as contributed to the writing of the article. G.B. analyzed the data and edited and revised the article. J.H. and K.A.A. reviewed and edited the article.
Footnotes
Acknowledgments
Certain equipment, instruments, software, or materials are identified in this article to specify the experimental procedure adequately. Such identification is not intended to imply recommendation or endorsement of any product or service by NIST, nor is it intended to imply that the materials or equipment identified are necessarily the best available for the purpose. Official contribution of the National Institute of Standards and Technology; not subject to copyright in the United States.
Author Disclosure Statement
No competing financial interests exist.
Funding Information
This work was supported by the US National Institutes of Health (NIH)
Supplemental Material
Supplemental Material
Supplemental Material
References
Supplementary Material
Please find the following supplemental material available below.
For Open Access articles published under a Creative Commons License, all supplemental material carries the same license as the article it is associated with.
For non-Open Access articles published, all supplemental material carries a non-exclusive license, and permission requests for re-use of supplemental material or any part of supplemental material shall be sent directly to the copyright owner as specified in the copyright notice associated with the article.