
Abstract
Aim:
This article aims to provide a description of fundamental elements of discrete event simulation (DES), the process and the values of applying DES in assisting healthcare design and planning decision-making. More importantly, it explores how new technology such as electronic medical records, real-time location services (RTLS), and other simulation methods such as space syntax analysis (SSA) can facilitate and complement DES.
Background:
Healthcare administrators increasingly recognize DES as an effective tool for allocating resources and process improvement. However, limited studies have described specifically how DES can facilitate healthcare design.
Method:
Three case studies were provided to illustrate the value of DES in supporting healthcare design. The first case study used DES to validate a surgical suite design for shorter surgeon walking distance. The second case study used DES to facilitate capacity planning in a clinic through testing the utilization of exam rooms upon various growth scenario. The detailed process data for the current clinic were captured through RTLS tracking. The third case study applied DES in an emergency department for both site selection in master planning and capacity test at various growth scenarios with seasonal volume swing. In addition, SSA was conducted to evaluate the impacts of design on visual surveillance, team communication, and co-awareness.
Conclusions:
It is recognized that the DES analysis is an effective tool to address the process aspects of healthcare environments and should be combined with post-occupancy evaluation and SSA to address behavioral aspects of operations to provide more solid evidence for future design.
Keywords
Healthcare organizations are under increasing pressure to provide high-quality and efficient healthcare services while controlling the operating cost. Numerous literature in evidence-based design (EBD) has proven the impacts of the physical environment on operational efficiency (Chaudhury, Mahmood, & Valente, 2009; Zimring, Joseph, & Choudhary, 2004). However, most EBD studies are conducted through post-occupancy evaluation (POE) and have limited impacts on the current buildings. Discrete event simulation (DES) has gained popularity lately as a cost-effective approach to use data to inform design decisions before the actual investment in brick and mortar. Moreover, DES provides an experimental setting to test the impacts of a single-design feature as well as the interaction of multiple interventions. This article provides a detailed description of fundamental elements of DES, the process of applying DES in design, and its values in assisting decision-making in healthcare design and planning. More importantly, it explores how technology such as electronic medical records (EMRs), real-time location services (RTLS), and other simulation methods such as space syntax analysis (SSA) can facilitate and complement traditional DES.
Literature Review
DES is a type of computer-based modeling that imitates the operation of a real-world system (Hamrock, Paige, Parks, Scheulen, & Levin, 2013). A discrete event should be thought of “as occurring instantaneously and causing transitions from one state value to another” (Cassandras & Lafortune, 2008, p. 27). DES was originally developed in the 1960s in industrial engineering. Over the past 40 years, DES models have been accepted increasing popularity by healthcare administrators as effective tools for allocating resources and improving patient flow, with reduced healthcare delivery cost and improved patient satisfaction (Jacobson, Hall, & Swisher, 2006; Jun, Jacobson, & Swisher, 1999). DES is particularly appropriate for healthcare settings as it is capable of modeling events that trigger activities and both predictable and unpredictable processes, and it can incorporate variability, which is common in healthcare systems (Saunders, 2010). Moreover, unlike Static tools, such as spreadsheets, DES can model the complex interactions within and between departments. It allows decision makers to systematically test various what-if scenarios by evaluating the impact of multiple variables and modify solutions till reaching an optimal scenario.
Key Elements and Process of Applying DES
Fundamental elements of DES in healthcare include: Entity, which defines what flows through the system, for example, patients, lab specimens, and supplies; Arrival rates, which defines the rate at which an entity arrives at a specific location; Location, physical areas where resources process entities; Resource, what process entities through the system include human resources, equipment, and medical devices; and Service time, which defines the time needed for resources to process entities at certain locations. Figure 1 describes how these fundamental elements work together in DES. The arrival rates of entities can be extracted from various sources, such as historical archival data, EMR, and schedule. The location is based on the floor plans. The resource can be obtained through organizational staffing schedule and equipment inventory. The service time is based on how long the entity spent at each process step, which can be obtained through staff interviews, EMR, on-site observations, and RTLS tracking. Process logic links all the model elements together. It determines the rules for how entities flow through the system and how resources and entities interact (Hamrock et al., 2013).

Key elements of discrete event simulation models.
A typical process of performing DES includes the following steps (Figure 2):

Typical simulation procedure.
Applications of DES in Healthcare
DES has been applied in healthcare at various levels and settings. Many publications have reported using DES for process redesign and optimization (Baril, Gascon, Miller, & Côté, 2016; Rutberg, Wenczel, Devaney, Goldlust, & Day, 2015), staff scheduling (Rossetti, Trzcinski, & Syverud, 1999), resource allocation for staffing (Koyuncu, Araz, Zeger, & Damien, 2017) and equipment (López-Valcárcel & Pérez, 1994); scheduling patients and procedures in outpatient (Cayirli, Veral, & Rosen, 2006) and surgical units (Saadouli, Jerbi, Dammak, Masmoudi, & Bouaziz, 2015); managing patient admission in inpatient units (Griffiths, Jones, Read, & Williams, 2010); and using ancillary resource such as labs, pharmacies, and imaging departments (Reynolds et al., 2011). Moreover, DES has been proven to be effective in planning and design of healthcare facilities, such as sizing and surge capacity planning for facility (Saunders, 2010; Zilm, Berry, Pietrzak, & Paratore, 2008), exam rooms (Wiinamaki & Dronzek, 2003), patient beds (Rodrigues, Zaric, & Stanford, 2017; Zhu, Hen, & Teow, 2012), and operating rooms (ORs; Wullink et al., 2007). For instance, O’Hara (2014) demonstrated that using DES to integrate the clinical operations in architectural design process is able to optimize the performance of an intensive care unit (ICU). Peavey, Zoss, and Watkins (2012) compared DES with physical and virtual mock-ups in planning for the healthcare facility and highlighted the value of DES in helping to evaluate what-if scenarios in complex healthcare design. Similarly, Zilm (2004) has identified DES as the most sophisticated decision-making tool to estimate emergency service treatment bed needs, which can take into consideration the variations in emergency department (ED) visits by season, days of the week, and time of the day. However, it is pointed out that the complexity and time and cost associated with data collection before simulation has made it less accessible to the broader healthcare design field.
In the next section, we will use three DES projects conducted by a predictive analytics team in a major international architectural firm as case studies to describe detailed methods, process, and findings using DES in supporting healthcare design and planning. More importantly, the case studies demonstrated new possibilities offered by integrating technology such as RTLS, EMR, and other analytical tools such as SSA.
Case Studies
Case 1: Design Evaluation of a Surgical Department
The efficiency of the surgical department has great impacts on the financial performance of hospitals. ORs contribute largely to a hospital’s financial success and represent one of the most costly units within a hospital (Cima et al., 2011). The physical environment can present the challenge for a more efficient workflow.
Objective
This project applied DES to evaluate the efficiency of a proposed dual-floor layout (Figure 3) for the surgical suite in a large teaching hospital. The goal was to minimize surgeon travel time and distance, hence improve the work efficiency.

Dual-floor surgical suite design.
Data collection
In this model, OR patients were defined as entities. Arrival rate was defined by patient type, schedule time, and OR according to the predefined schedule. The floor plan provided the locations. Physician, nurse, and other staff were defined as resources. Duration time was defined as the time patients spent moving through each step of the surgical suite (e.g., prep, OR, postanesthesia care unit [PACU], and recovery). For resources, the simulation team calculated an average number of surgeons by service type working in the ORs using the hospital-provided operational data on the complete set of cases performed during 2009. In addition, EMR data of 2009 were analyzed and fit into distribution function using the “Stat::fit” plug-in to generate the durations of cases by each service type as the model input data (Figure 4).
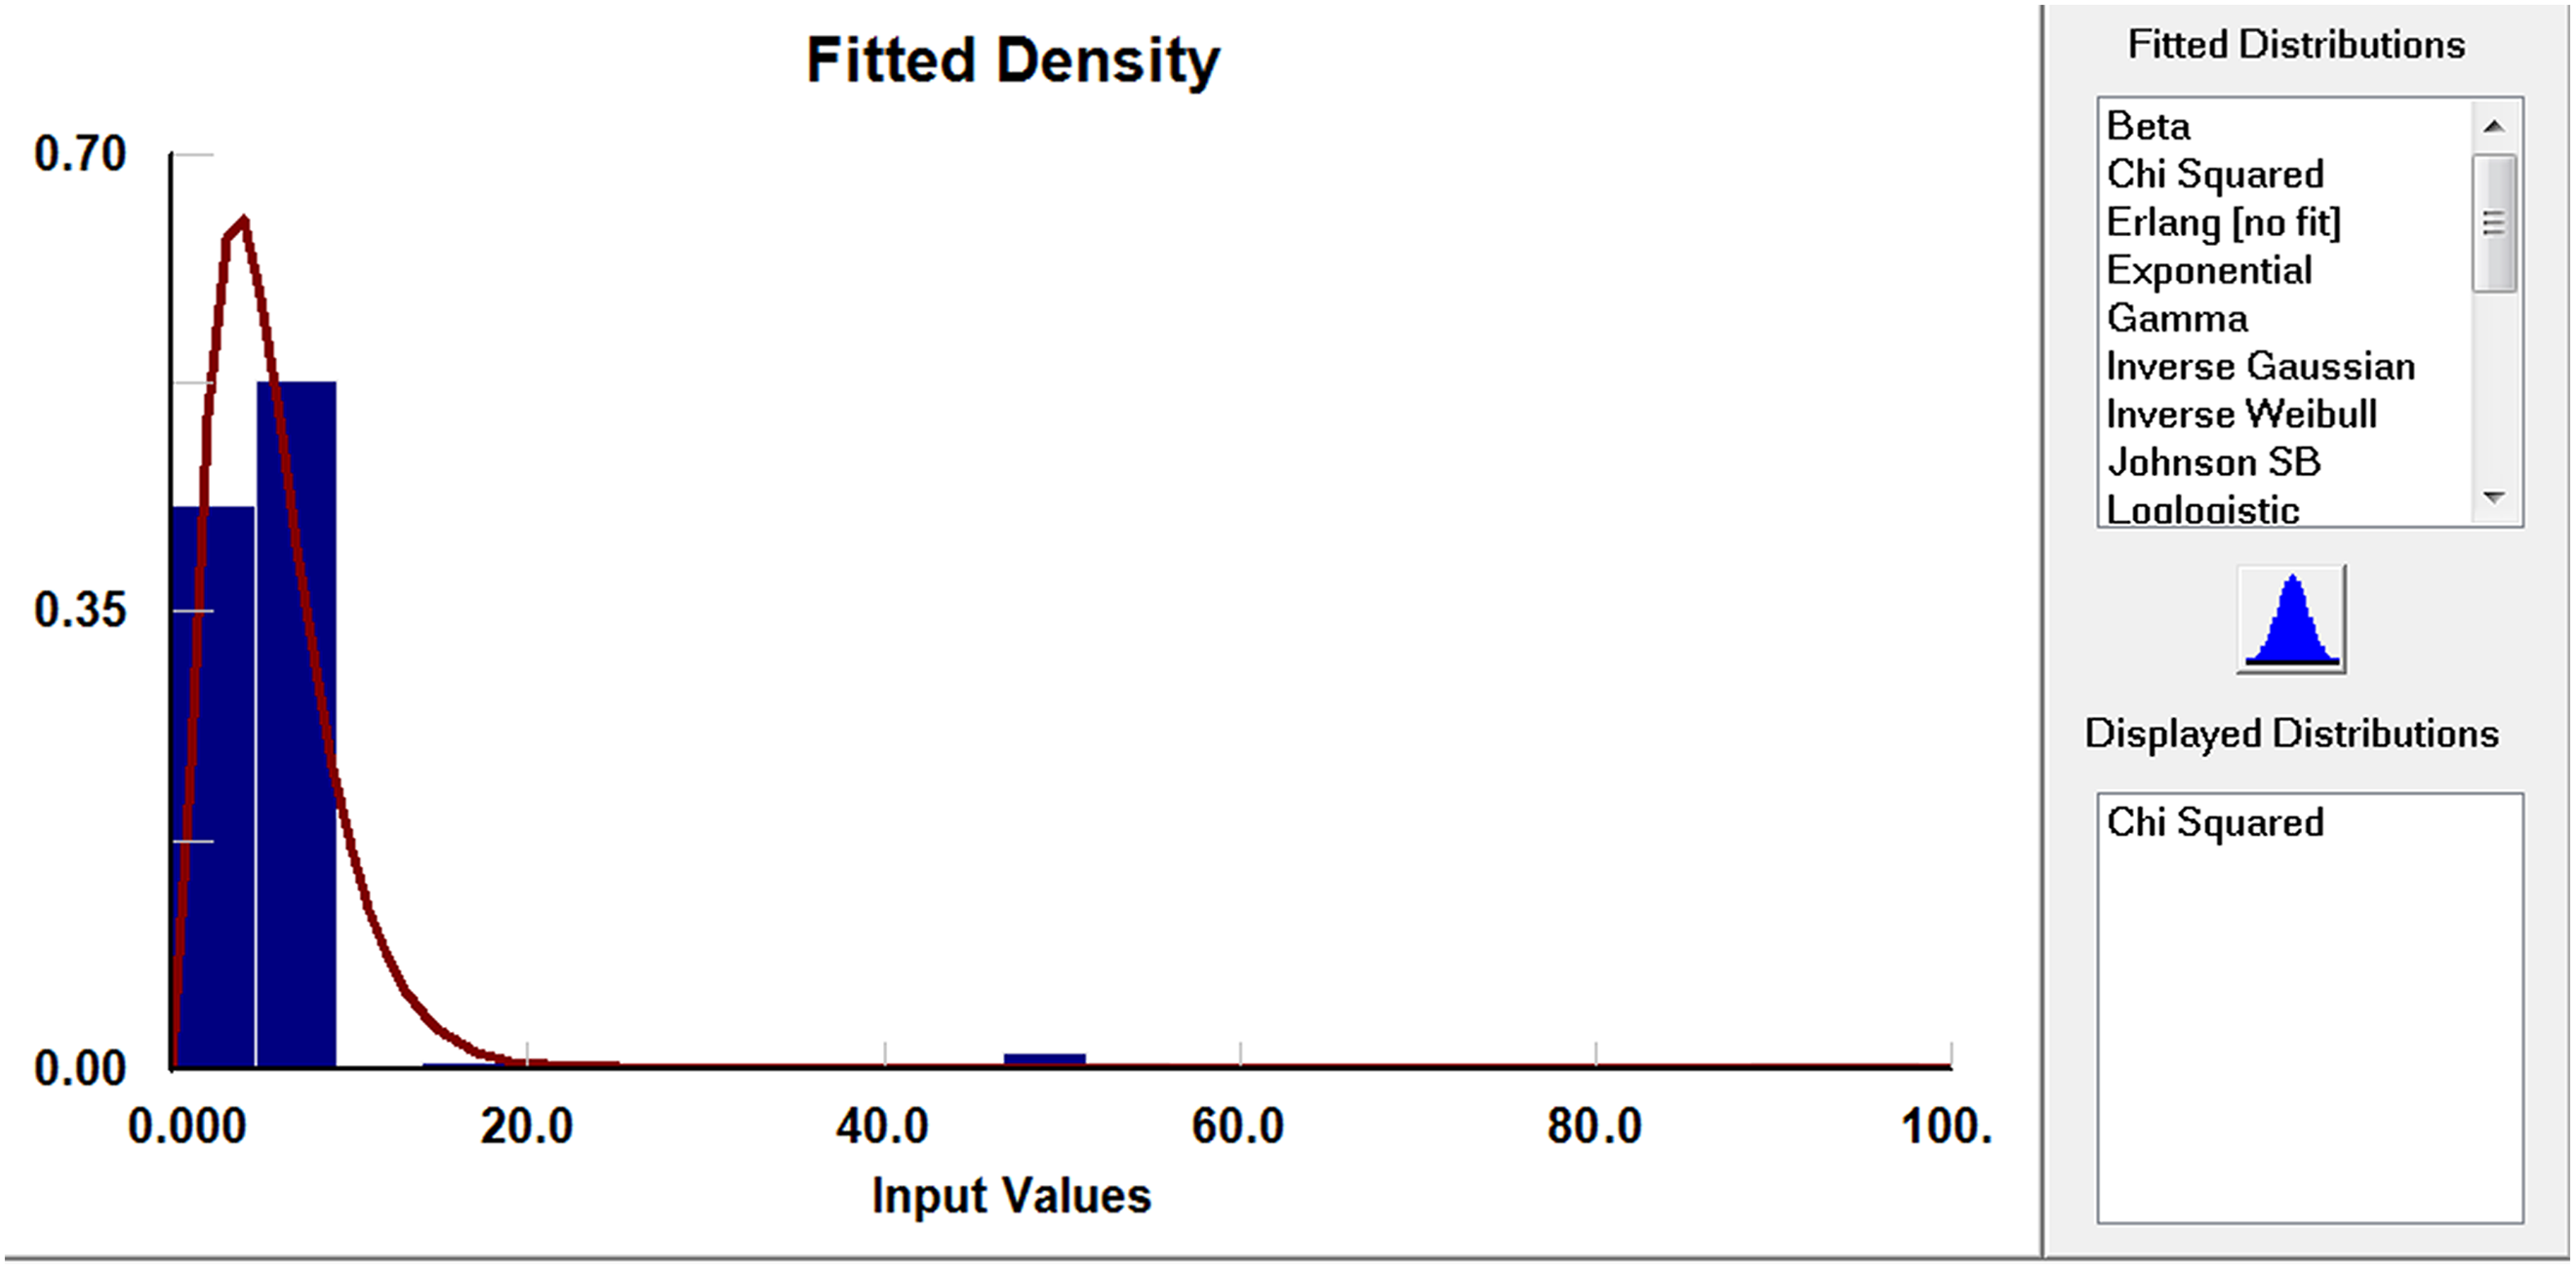
Operating room electronic medical records fitted distribution.
Process mapping
The typical workflow for each of the primary surgical service lines was developed through interviews with representative surgeons. These were compiled into a comprehensive surgeon process master list that defined the sequence of events through hospital spaces by surgeon type. The set of surgeon work processes and durations was then applied to the hospital projected patient volumes for the years 2015, 2020, and 2025.
Simulation and design decision
An integrated simulation model that tracked patients through prep/recovery, PACU, and the interaction with the physician, registered nurse, and other staff was built with the collected EMR data, process, and the floor plan. The simulation was run for 4 weeks (20 workdays) to generate the average surgeon travel distance per day (Table 1). The mean travel distance of 0.65 miles that resulted from the simulation is substantially less than the 2.5 miles per day that the surgeons walk in the existing building, indicating that the dual-floor design is effective in reducing non-value-added travel time.
OR Surgeon Travel Distance in Dual-Floor Layout.

Note. OR = operating room.
Case 2: Capacity Planning for a Clinic
The original family medicine center (FMC) clinic was comprised of five clinic modules, three of which (south, east, and west module) were to be consolidated into a single, shared 22,000 sq. ft. space in a new facility. In the existing building, each module had 12 exam rooms.
Objective
The discrete event modeling was engaged during the early design phase of the FMC to evaluate chassis capacity and support the investment decision. The focus was to project the number of exam rooms that the new clinic would need in various growth scenarios.
Data collection
In this model, clinic patients were defined as entities. Arrival rate was defined by patient type, schedule time, and the hourly arrival pattern according to the EMR data. Duration time was defined as the time needed to process patient through the clinic. Unlike OR, the EMR data in most of the clinics only recorded the patient arrival and exit time. Hence, an ultrasound RTLS technology was applied to capture the intermediate duration time for the current clinic including the touch time with physicians, nurses, and the patients’ waiting time. The wireless transmission tag was attached to the clinical staff. As the person moved through the monitored area, the tag would transmit its unique identification signal using ultrasound waves. 36 Sonitor high-definition receivers were installed at certain places such as exam rooms as detectors to receive the transmitted signals from the tags. Through the RTLS technology, it was possible to not only track the location of clinical staff but also the space utilization and the duration of key activities such as patient encounters. During 6 weeks of data collection, 18 million data points were collected, filtered to remove invalid records, and organized by patient type for each clinic. Due to the wide variability of collected RTLS data, triangular distribution was used to define the duration time, which was expressed with three parameters: minimum, mode, and maximum value. With the defined triangular distribution, the “random generator” built in the simulation model would generate random duration time data as model input.
Process mapping
Based on the information collected through RTLS and validated through the clinic staff interviews and on-site observations, a detailed patient journey with time durations was developed for each patient type. The data were used as input to build the current state model, to simulate the future projected clinic patient volumes, and to track room utilization in the new schematic design (Figure 5).
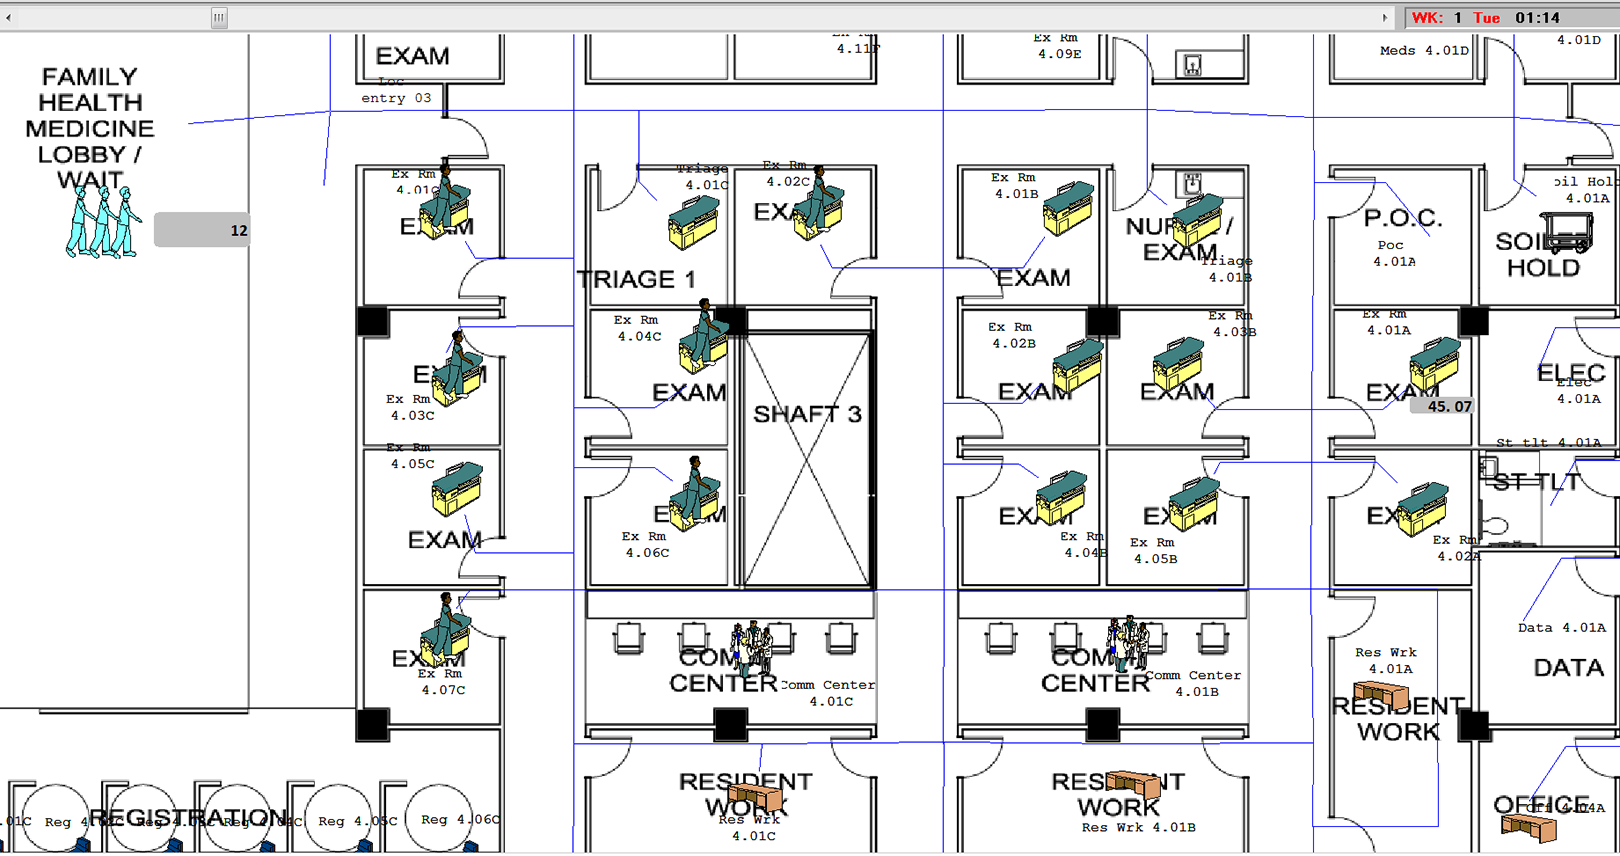
Simulation model interface.
Sensitive analysis with simulation scenarios Phase I
The simulation was developed in two phases. The first phase evaluated whether the new design could provide enough capacity for the project patient volumes for the FMC. The predicted 2017 annual volumes for the FMC were documented based on hospital provided planning information with three possible growth rates at 0%, 5%, and 10%. Both average and peak volumes for three growth scenarios were tested.
Data analysis Phase I and design decision
The simulation results confirmed that the new design provided more than adequate amount of spaces to support the projected patient volumes. Even under peak volume conditions, 25% of the physician-requested exam rooms would not be utilized at all, thereby freeing a significant amount of space that allowed the skin, bone, and joint clinic (SBJC) to be added into the FMC (Figure 6).

Utilization rates of exam rooms.
Sensitive analysis with simulation scenarios Phase II
The second phase of this simulation tested the chassis capacity of the FMC even with the SBJC patient volumes added. The predicted 2017 annual average and peak volumes patient volumes for all five clinics with three possible growth rates at 0%, 5%, and 10% were added to the simulation model. Table 2 shows the summary of patient volumes organized by original clinics and patient types.
Projected Average and Peak Patient Volume for Five Clinics With Three Different Growth Scenarios at 0%, 5%, and 10%.
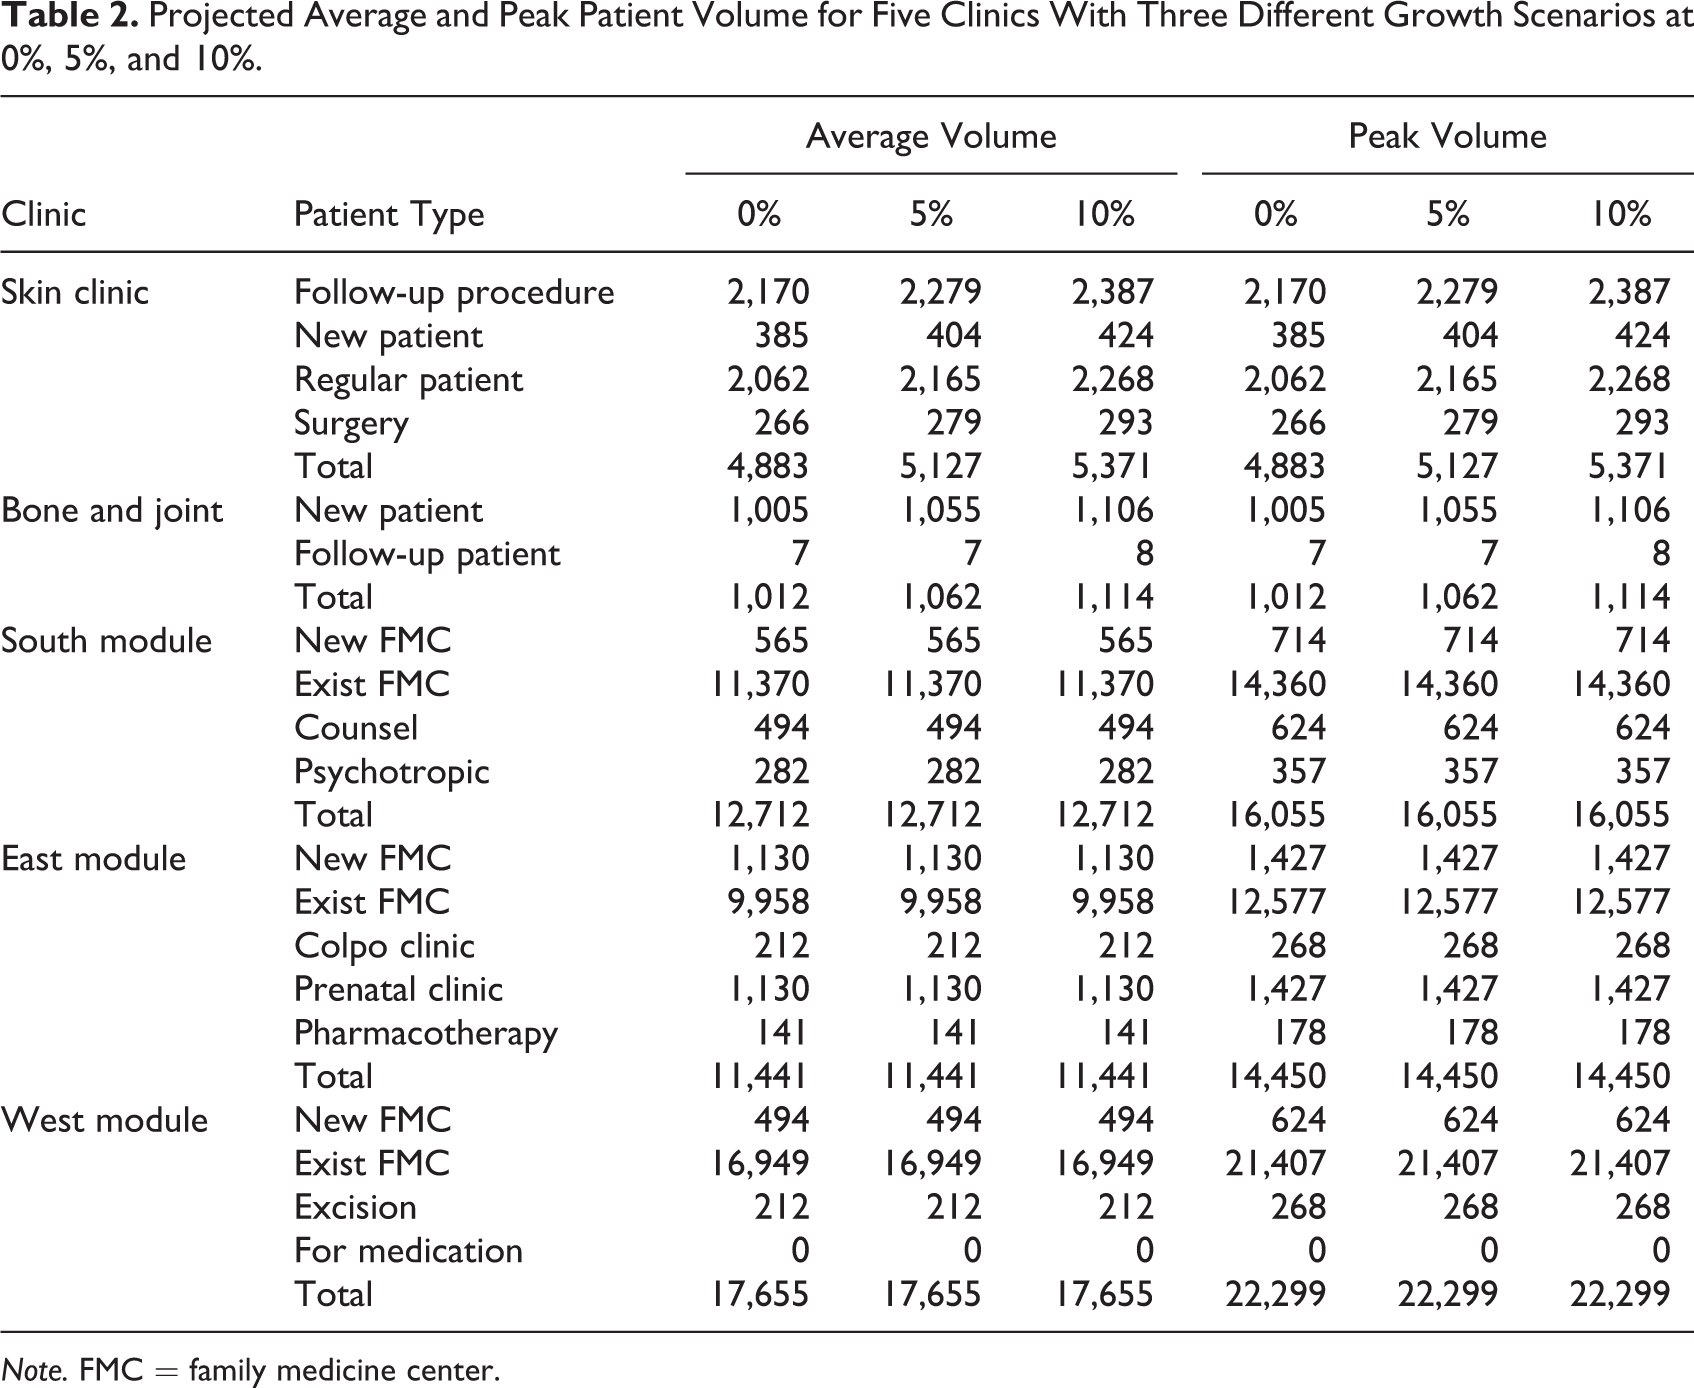
Note. FMC = family medicine center.
Results analysis Phase II and design decisions
The simulation results showed that the addition of the SBJC to the three clinics did not result in excessive demand on the chassis even when all five clinics grow 10% and even 22% over their original 2017 growth targets. The final resulted design had four provider clinical pods. Each pod included eight exam rooms, one resident workroom, and a shared clinical staff work area. There were four additional exam rooms that were shared between the different specialties at the clinic.
Case 3: Integrate SSA and DES in Planning an ED
Due to the large volume and uncertainty of patients’ arrival, EDs face the challenge of crowding and long patients’ waiting time. This case study is in a large regional Level 1 trauma center ED that has wide seasonal swings in volume, due to the influx of retirees during winters. A new ED was proposed to replace the existing ED that has outgrown its capacity. Current ED treatment area was divided into a low-acuity area (Main B) and a high-acuity area (Main A). There was one nurse station for Main A, one for Main B north and one for Main B south (Figure 7). A comprehensive simulation services was conducted for various aspects of the project, which has been reported elsewhere (Morgareidge, Cai, & Jia, 2014). This article focuses on reporting how DES support decision-making regarding the physical environment and how the SSA complement with DES.
Existing emergency department plan.
Objectives
The simulation had two phases, one during the master planning and the other during the new ED schematic design. The objective of master planning simulation was to decide an optimal site for the ED for operational efficiency. To quantitatively evaluate the cost-effectiveness of two master planning siting options (Option B vs. Option C; Figure 8), DES was applied to evaluate the transactional relationships between the ED and 12 key clinical departments, that is, inpatient units, ICUs, surgical suite, lab, imaging department, CT, heart center, pediatric center, maternity unit, observation unit, morgue, and nuclear medicine. After the site was selected, the Phase II simulation was conducted on the new ED design to test whether the design met the future capacity even during peak season. In addition, the simulation aimed to evaluate whether the new design that incorporated several process improvement strategies could result in shorter length of stay and less waiting time for patients.
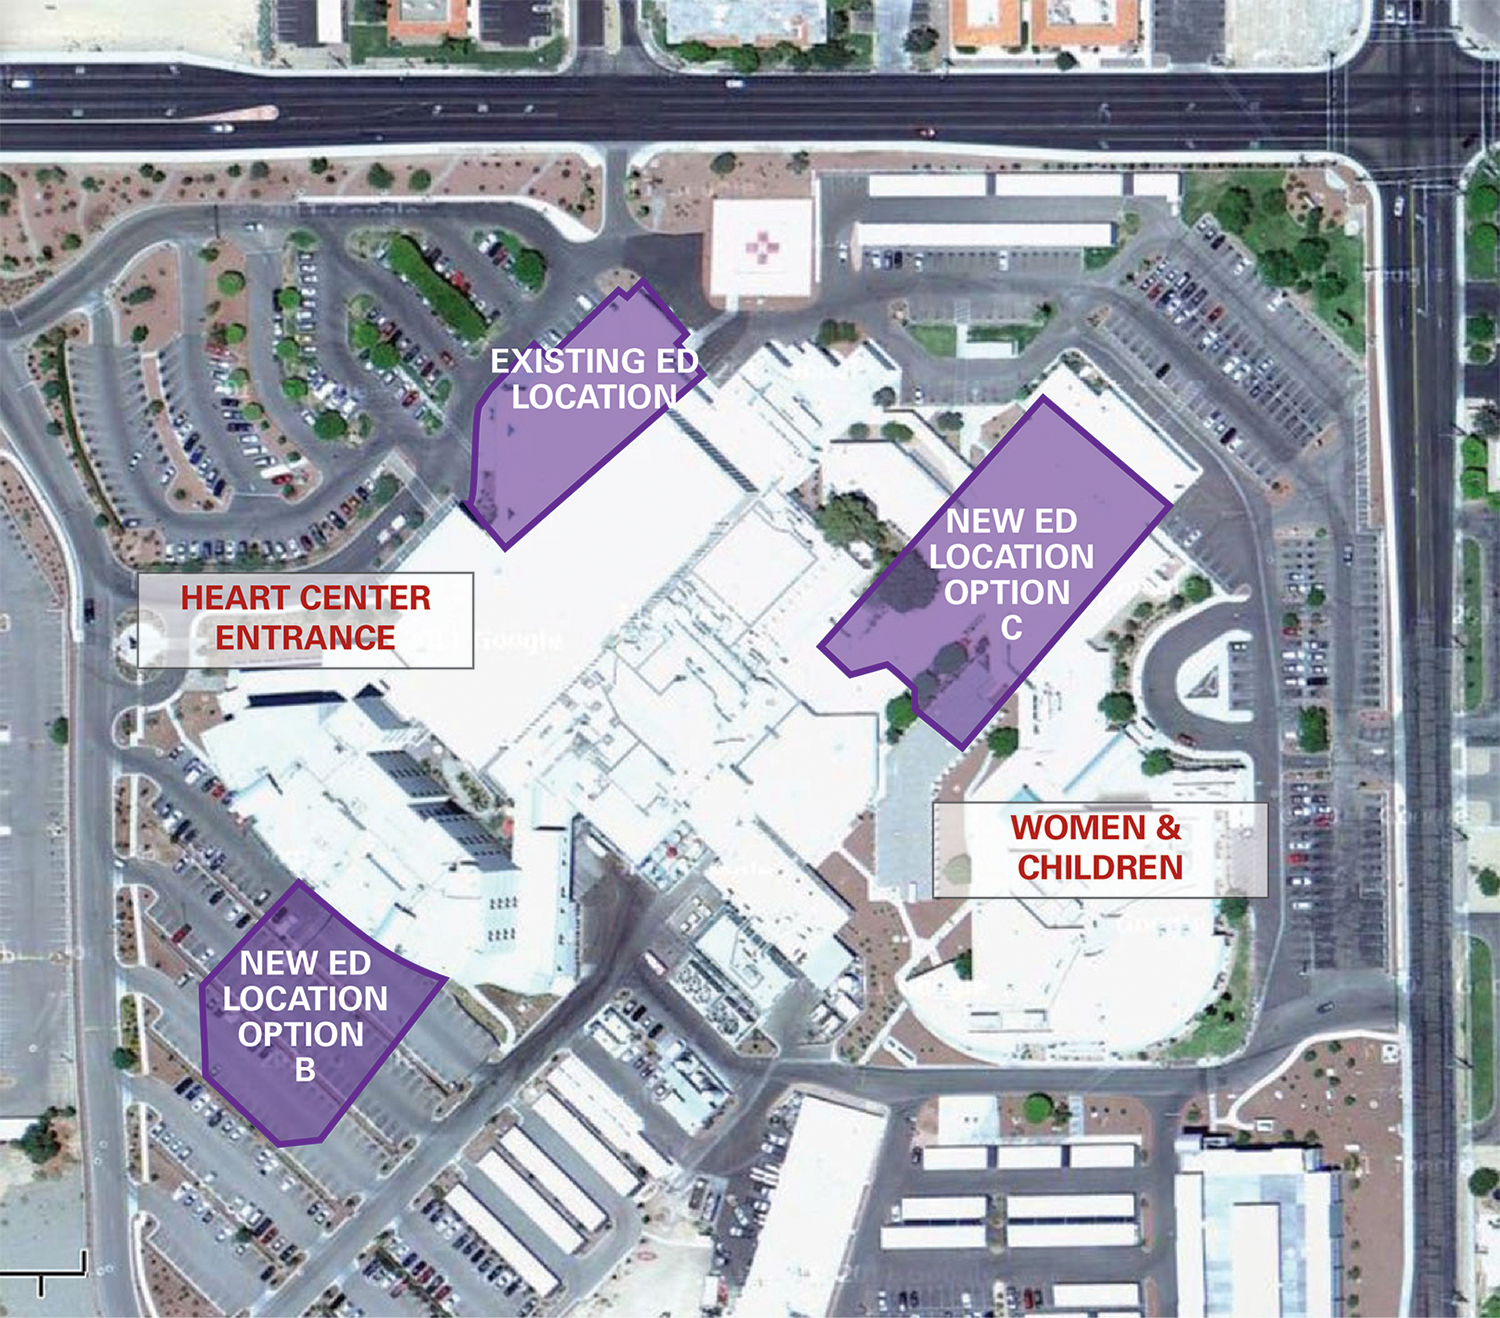
Emergency department master plan options.
Master planning simulation
In this model, the trips between departments were defined as entities. The number of trips per day associated with direct patient care between ED and all 12 departments, path and distance for each trip, and hourly rate for each type of trip was gathered from the interviews with hospital administrators and analysis on operational data of 2011. Due to the wide seasonal swing, the trip information was collected based on both summer and winter volume. The master plan was scaled and put into the model for the locations and to generate the travel distance. The distance variance as output was then converted into operating cost, considering clinical and nonclinical staff hourly rate and workdays invested in all the trips. The result demonstrated that based on the forecasted 2016 volumes, the Option C will save US$100,000 per year in overall operating cost, when compared to the Option B.
New ED simulation data collection
The new ED simulation started with a current state assessment. Like Case 2, patients were defined as entities and distribution function generated through RTLS data collection was used to define the duration of each step of patient flow (e.g., triage, exam time, and discharge). ED patient arrival data from 1-year EMR were used to generate the hourly arrival pattern through discontinuous distribution function (Figure 9).
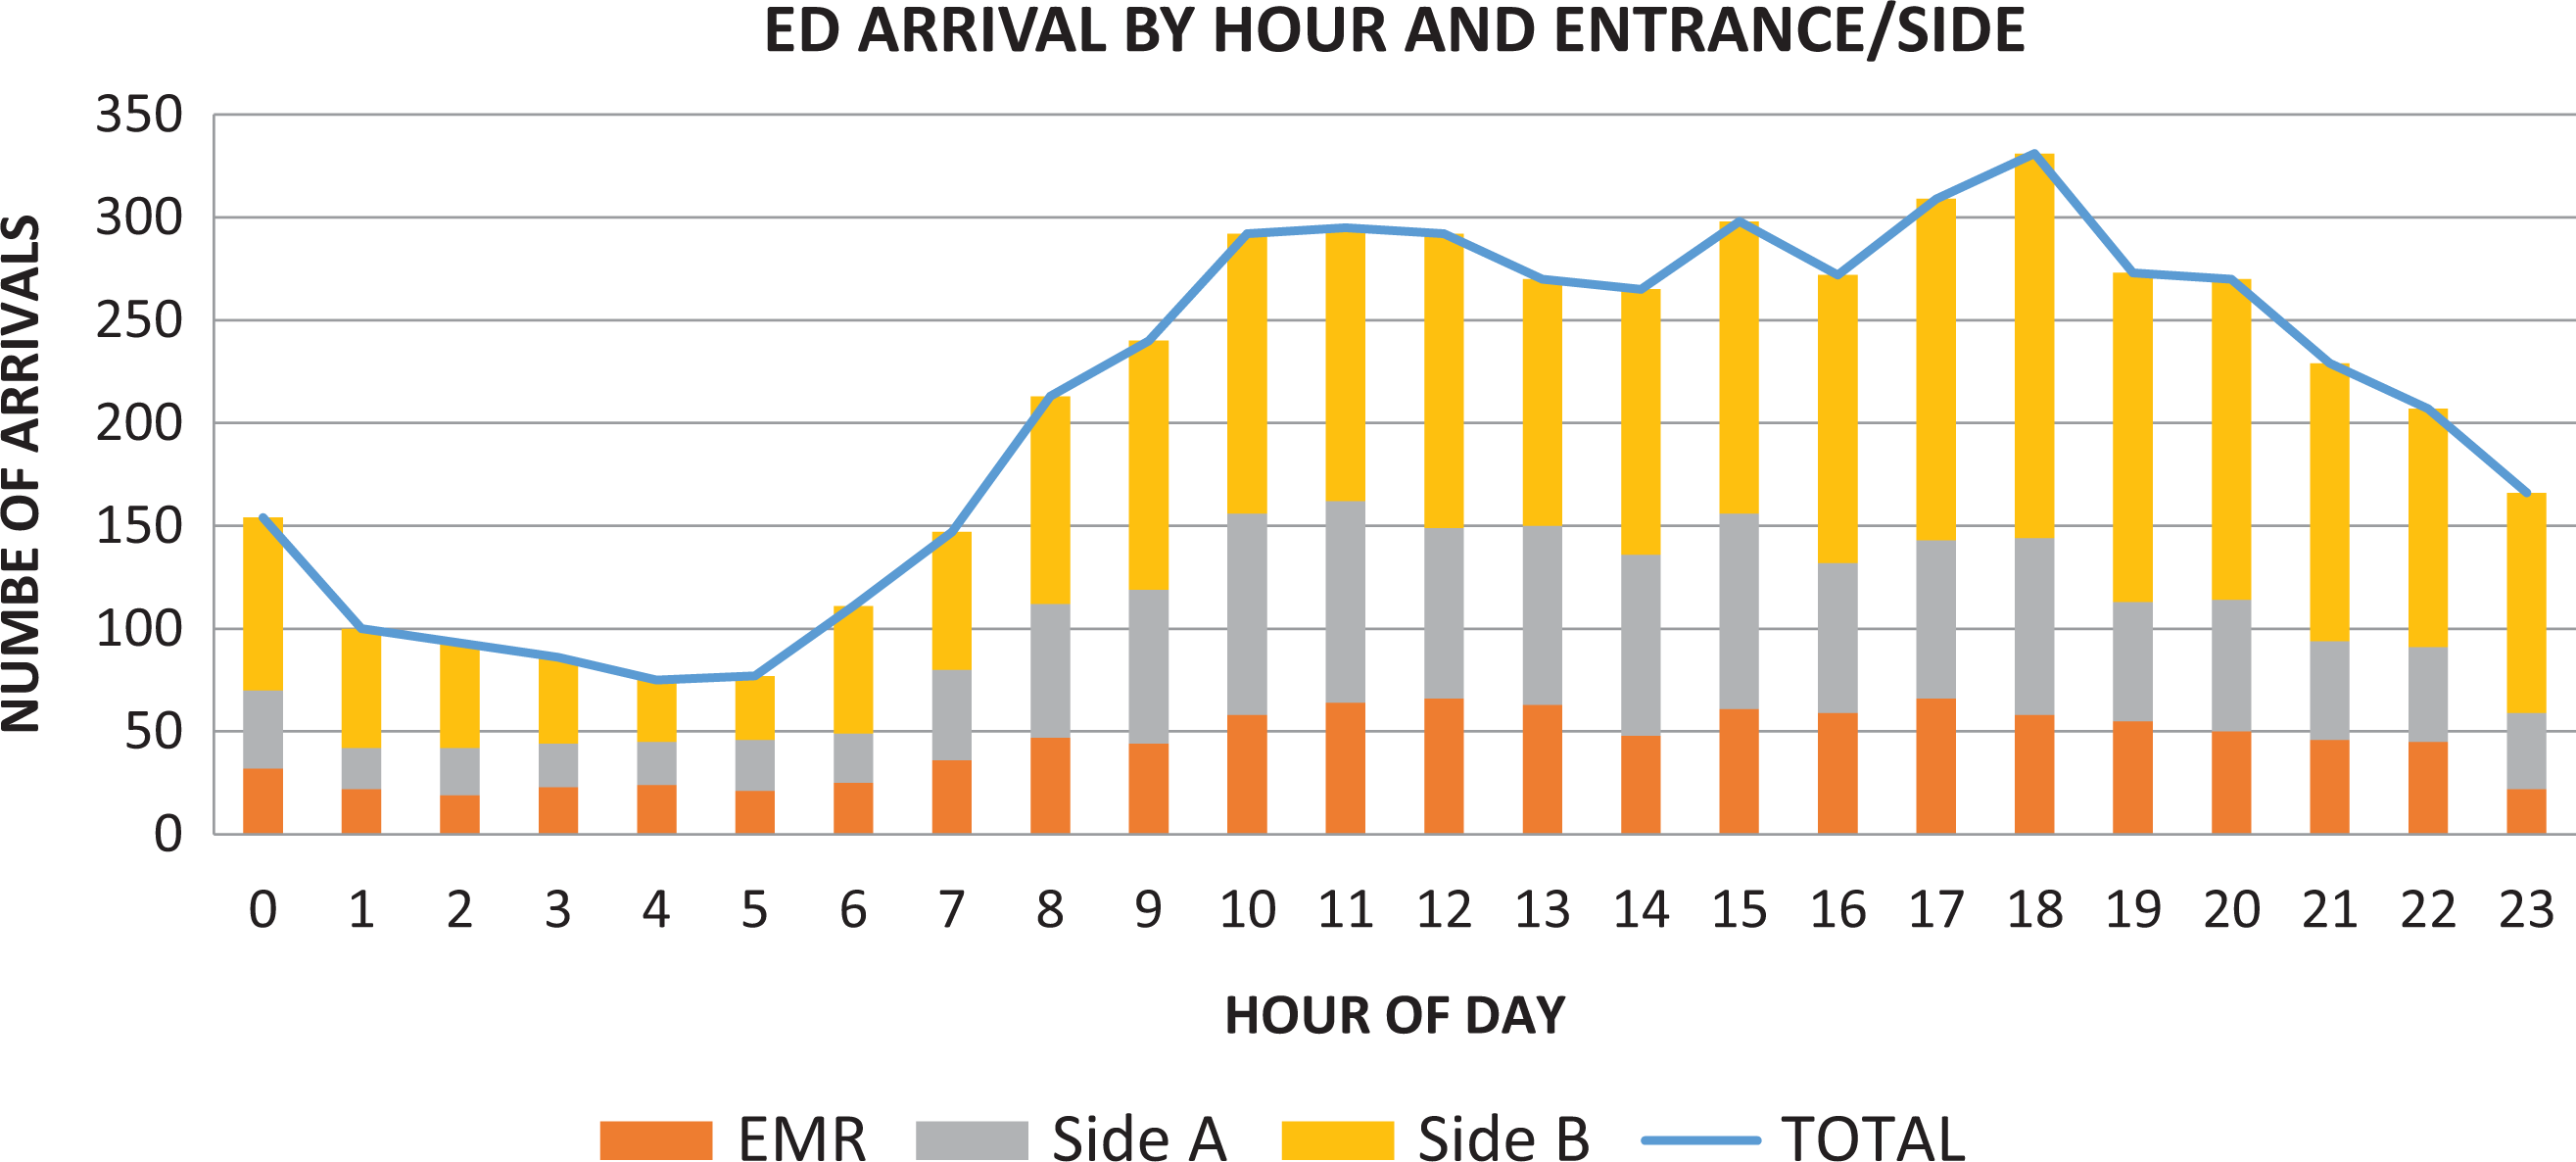
Emergency department arrival by hour and entrance/side.
Process mapping and base model
Detailed process maps for each Emergency Severity Index (ESI)-level patients were developed based on the data gathered from a 28-day on-site study. A lean system reengineering exercise was conducted to help evaluate current state process and propose future state process. The results were fed forward to inform the schematic design for the new ED and the base model. The base model was validated and verified by comparing to the historical data. For instance, the historical data on ambulance patient arrival gathered from EMR were compared to the arrival pattern generated by the model. The result showed that the mean variance is zero with the range (−.003 to .003), and the model is proven to be valid (see Figure 10).
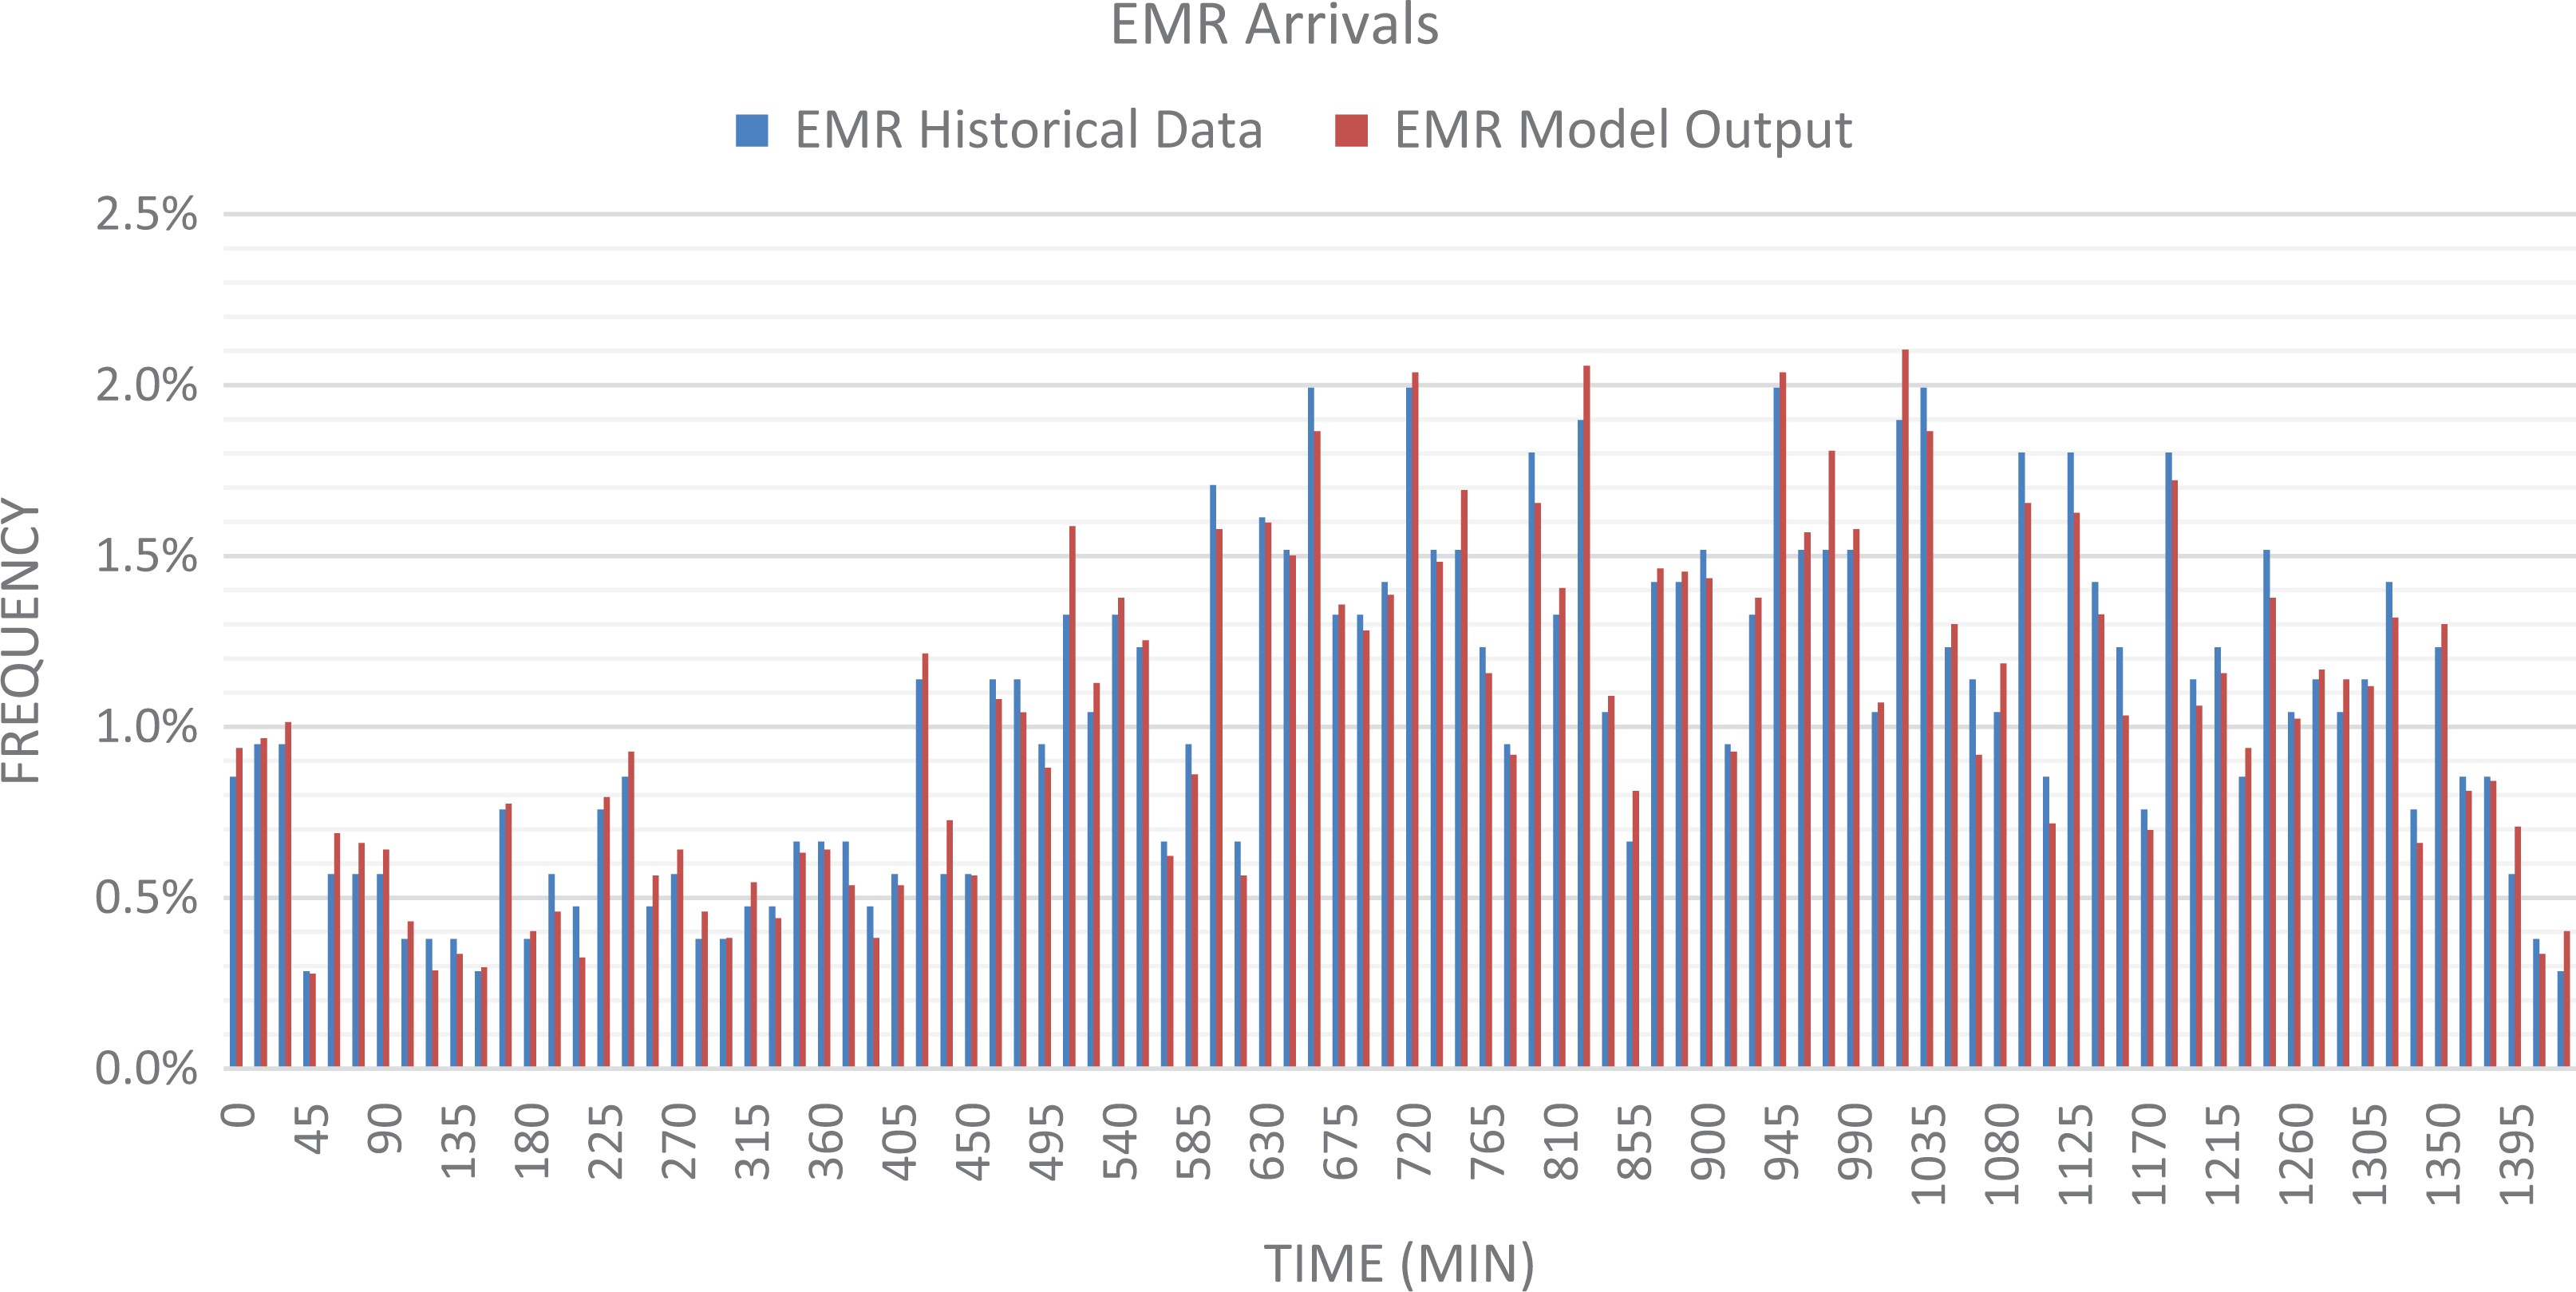
Model and data validation by comparing EMS patient arrivals model output and historical data.
Design decision
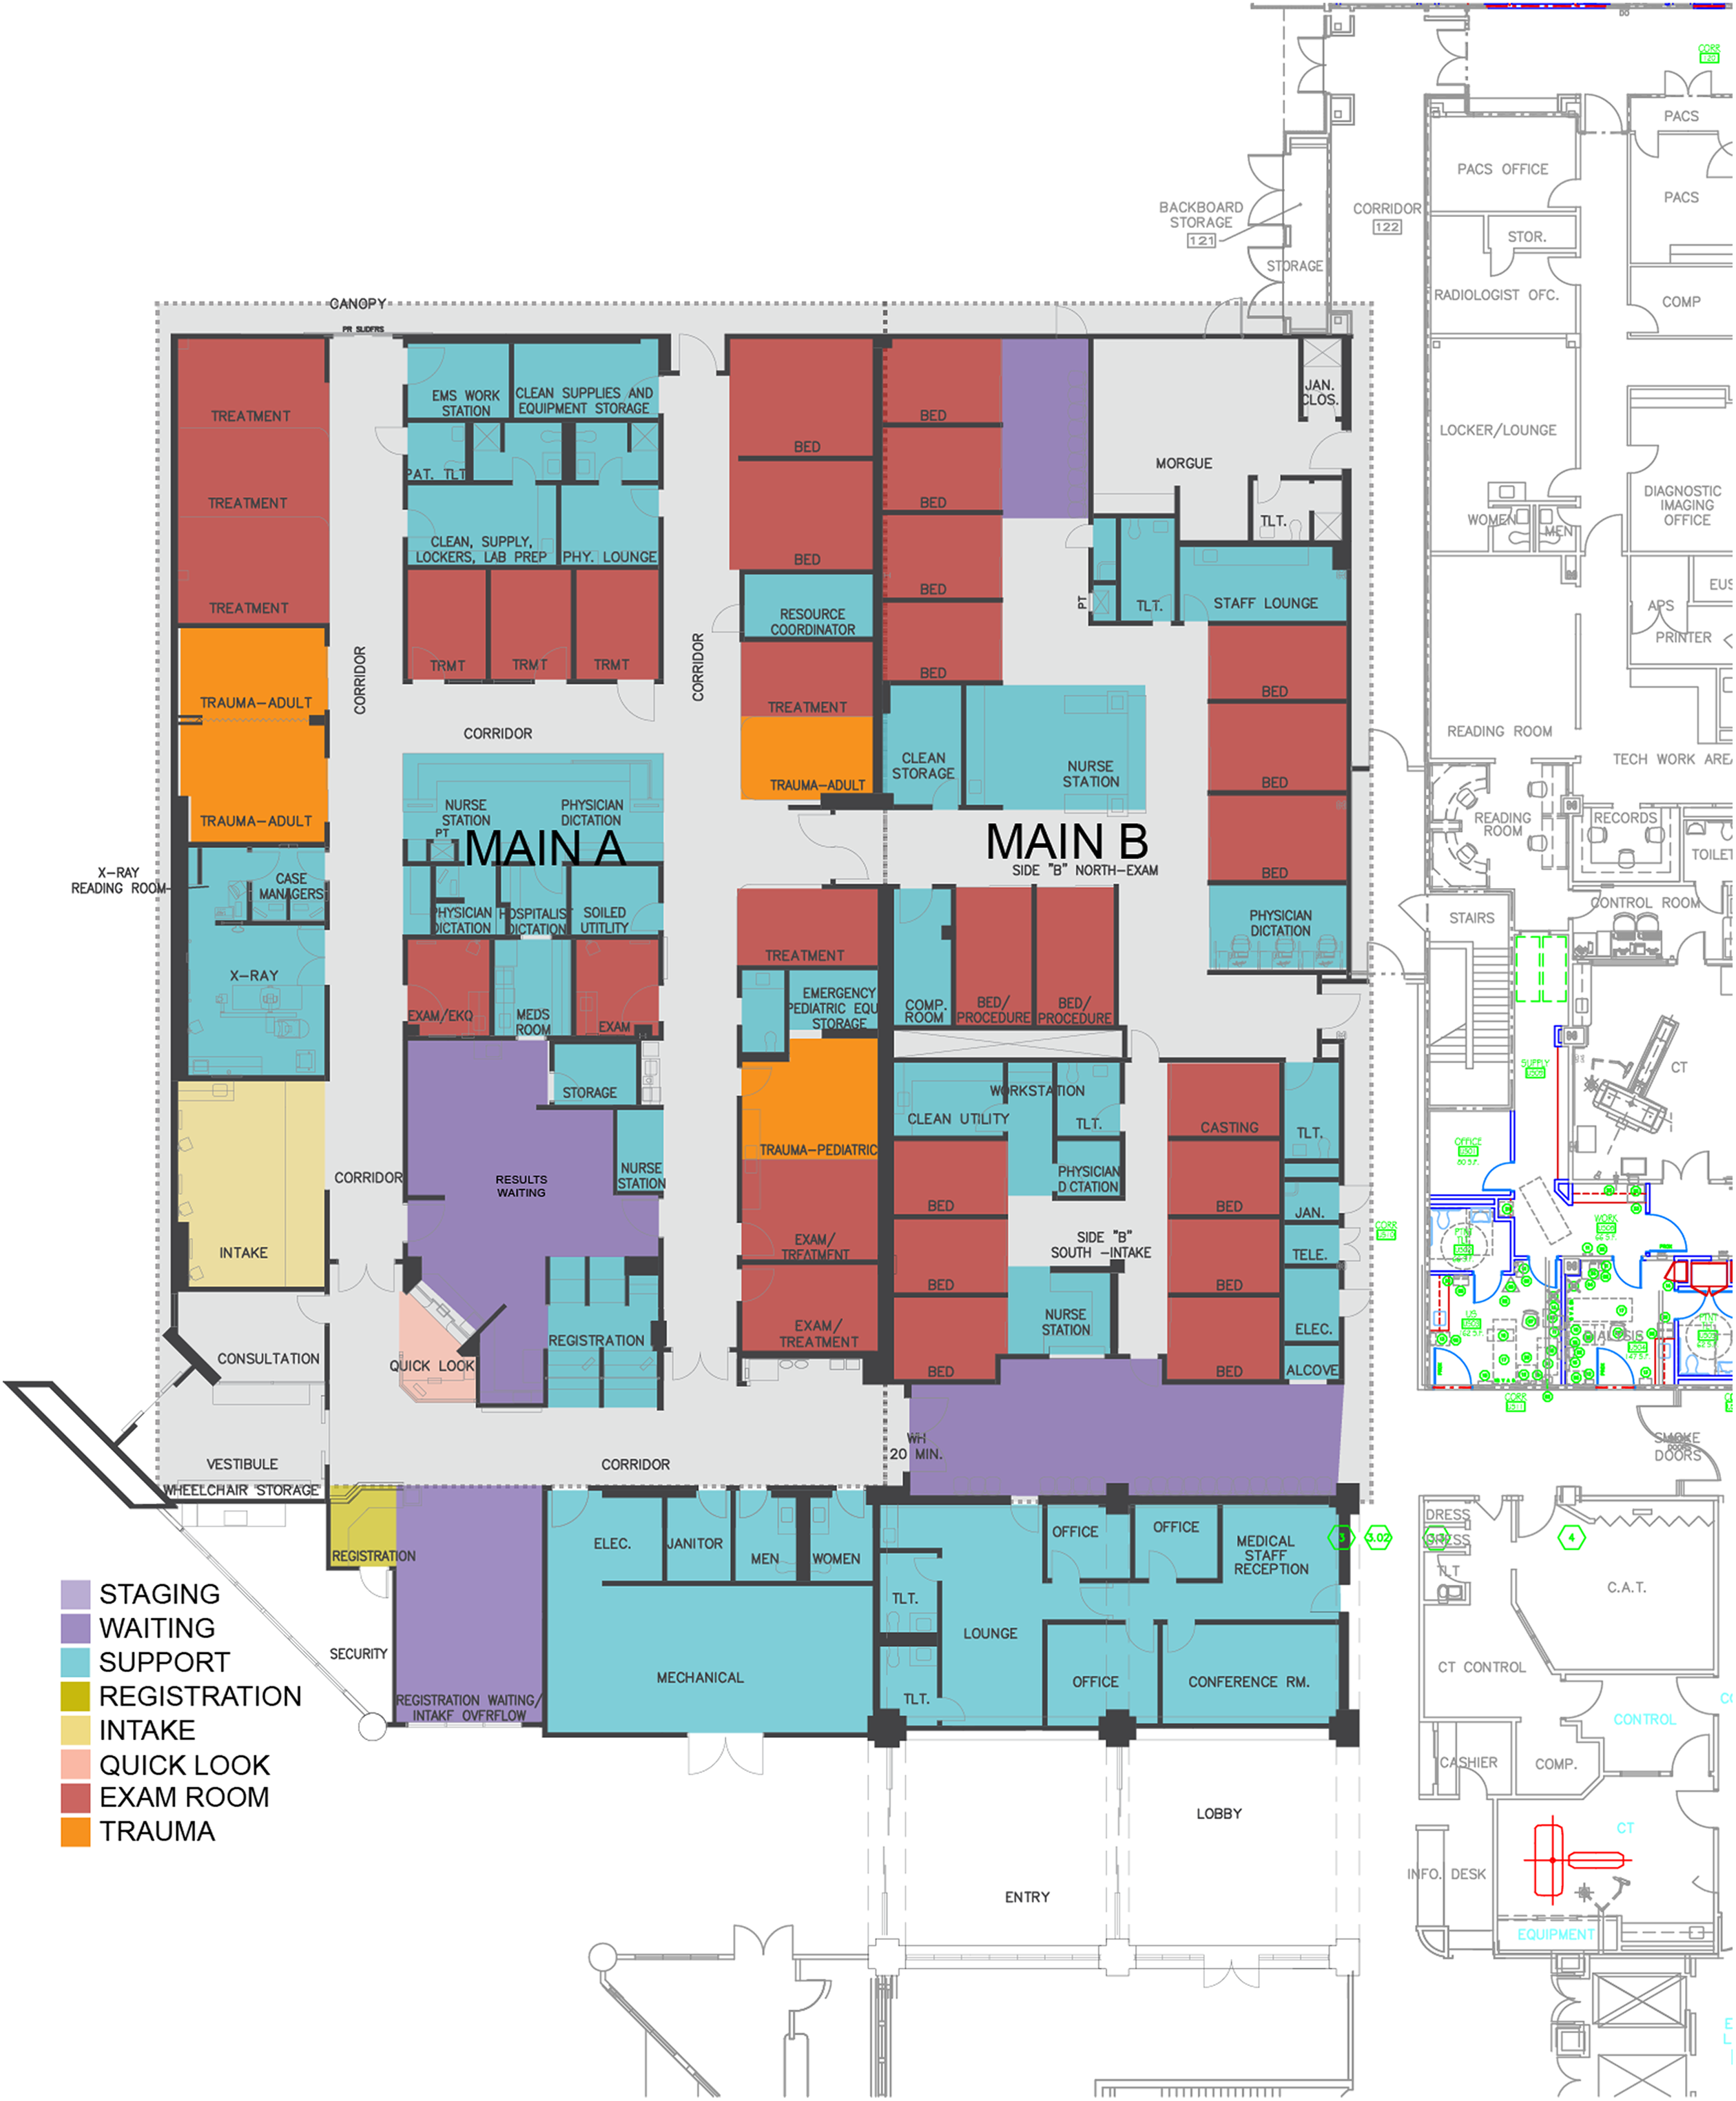
The new ED had four patient pods with one shelled, which divided patient care areas into several smaller treatment zones to streamline patient flow (Figure 11). Each pod focuses on treating patients with specific ESI levels. A quick look triage zone was designed to sort out the patients based on their ESI levels and streamed them down to the right Pod. Next to triage, six intake rooms were provided as a super track for the ESI 4s and 5s. Pod 1 near the ambulance entrance was mainly for ESI 1s and 2s. ESI 3s patients could float between Pod 2 and Pod 3, depending on the season.
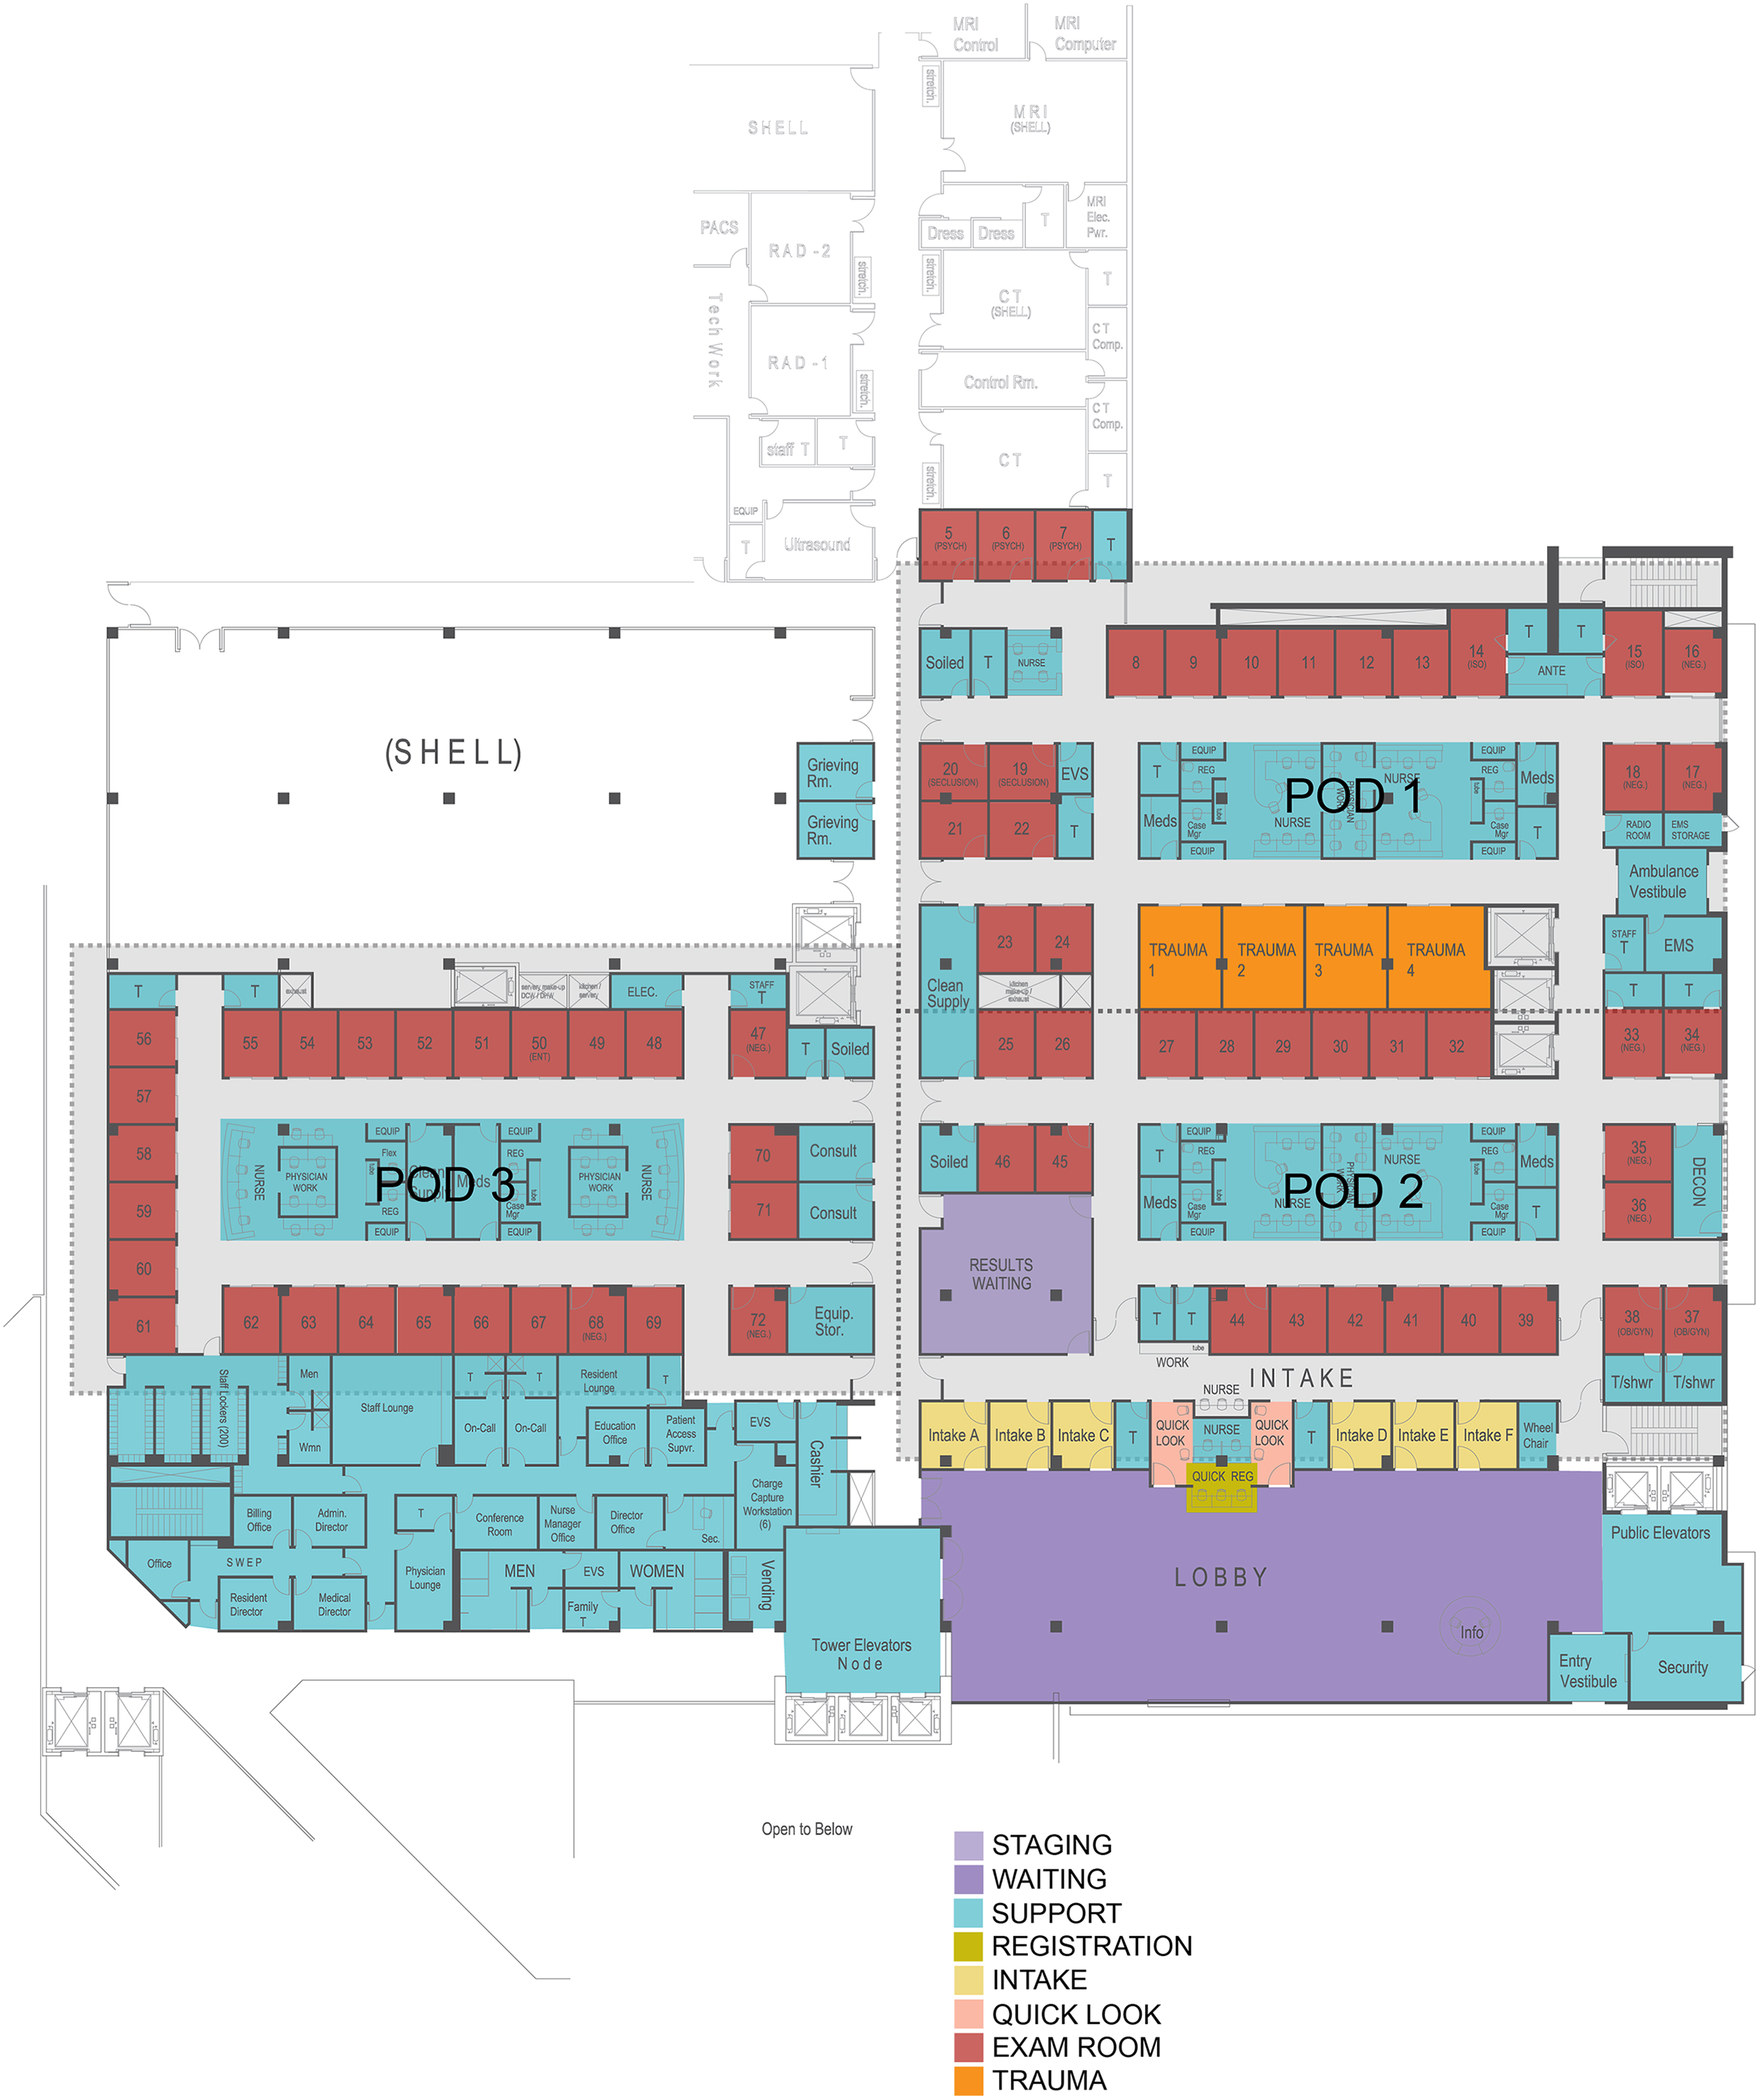
Floor plan of the new emergency department.
Sensitive analysis with simulation scenarios
The new design was then evaluated through simulation. Patient journeys for each ESI level were redefined based on the new design and the implementation of process improvements. Using the current state as baseline information, the team simulated the patient volumes and room utilization of three planning horizons (2016, 2026, and 2036), each with three different annual growth rates (1%, 3%, and 5%). The seasonal volume swings were also taken into consideration, by simulating the volumes for winter peak and average, and summer average, which resulted in a total of 27 different future state scenarios. The simulation results showed that the new design supports the volume of the year of opening (2016), even with the highest annual growth rate (5%). However, by 2036, during the winter peak season, all the exam rooms in the Pods 1 and 2 would reach more than 95% of utilization rate, which demonstrated the breaking point of current capacity and the needs for opening the shell space for more exam rooms (Figure 12). In addition, the future state model performed more effectively than the current state, resulting in an average decrease in Length of Stay (LOS) of 33.9%. For instance, for ESI 3 patients, the intake and staging were eliminated from the process, which led to a LOS reduction of 100 min relative to current state LOS.
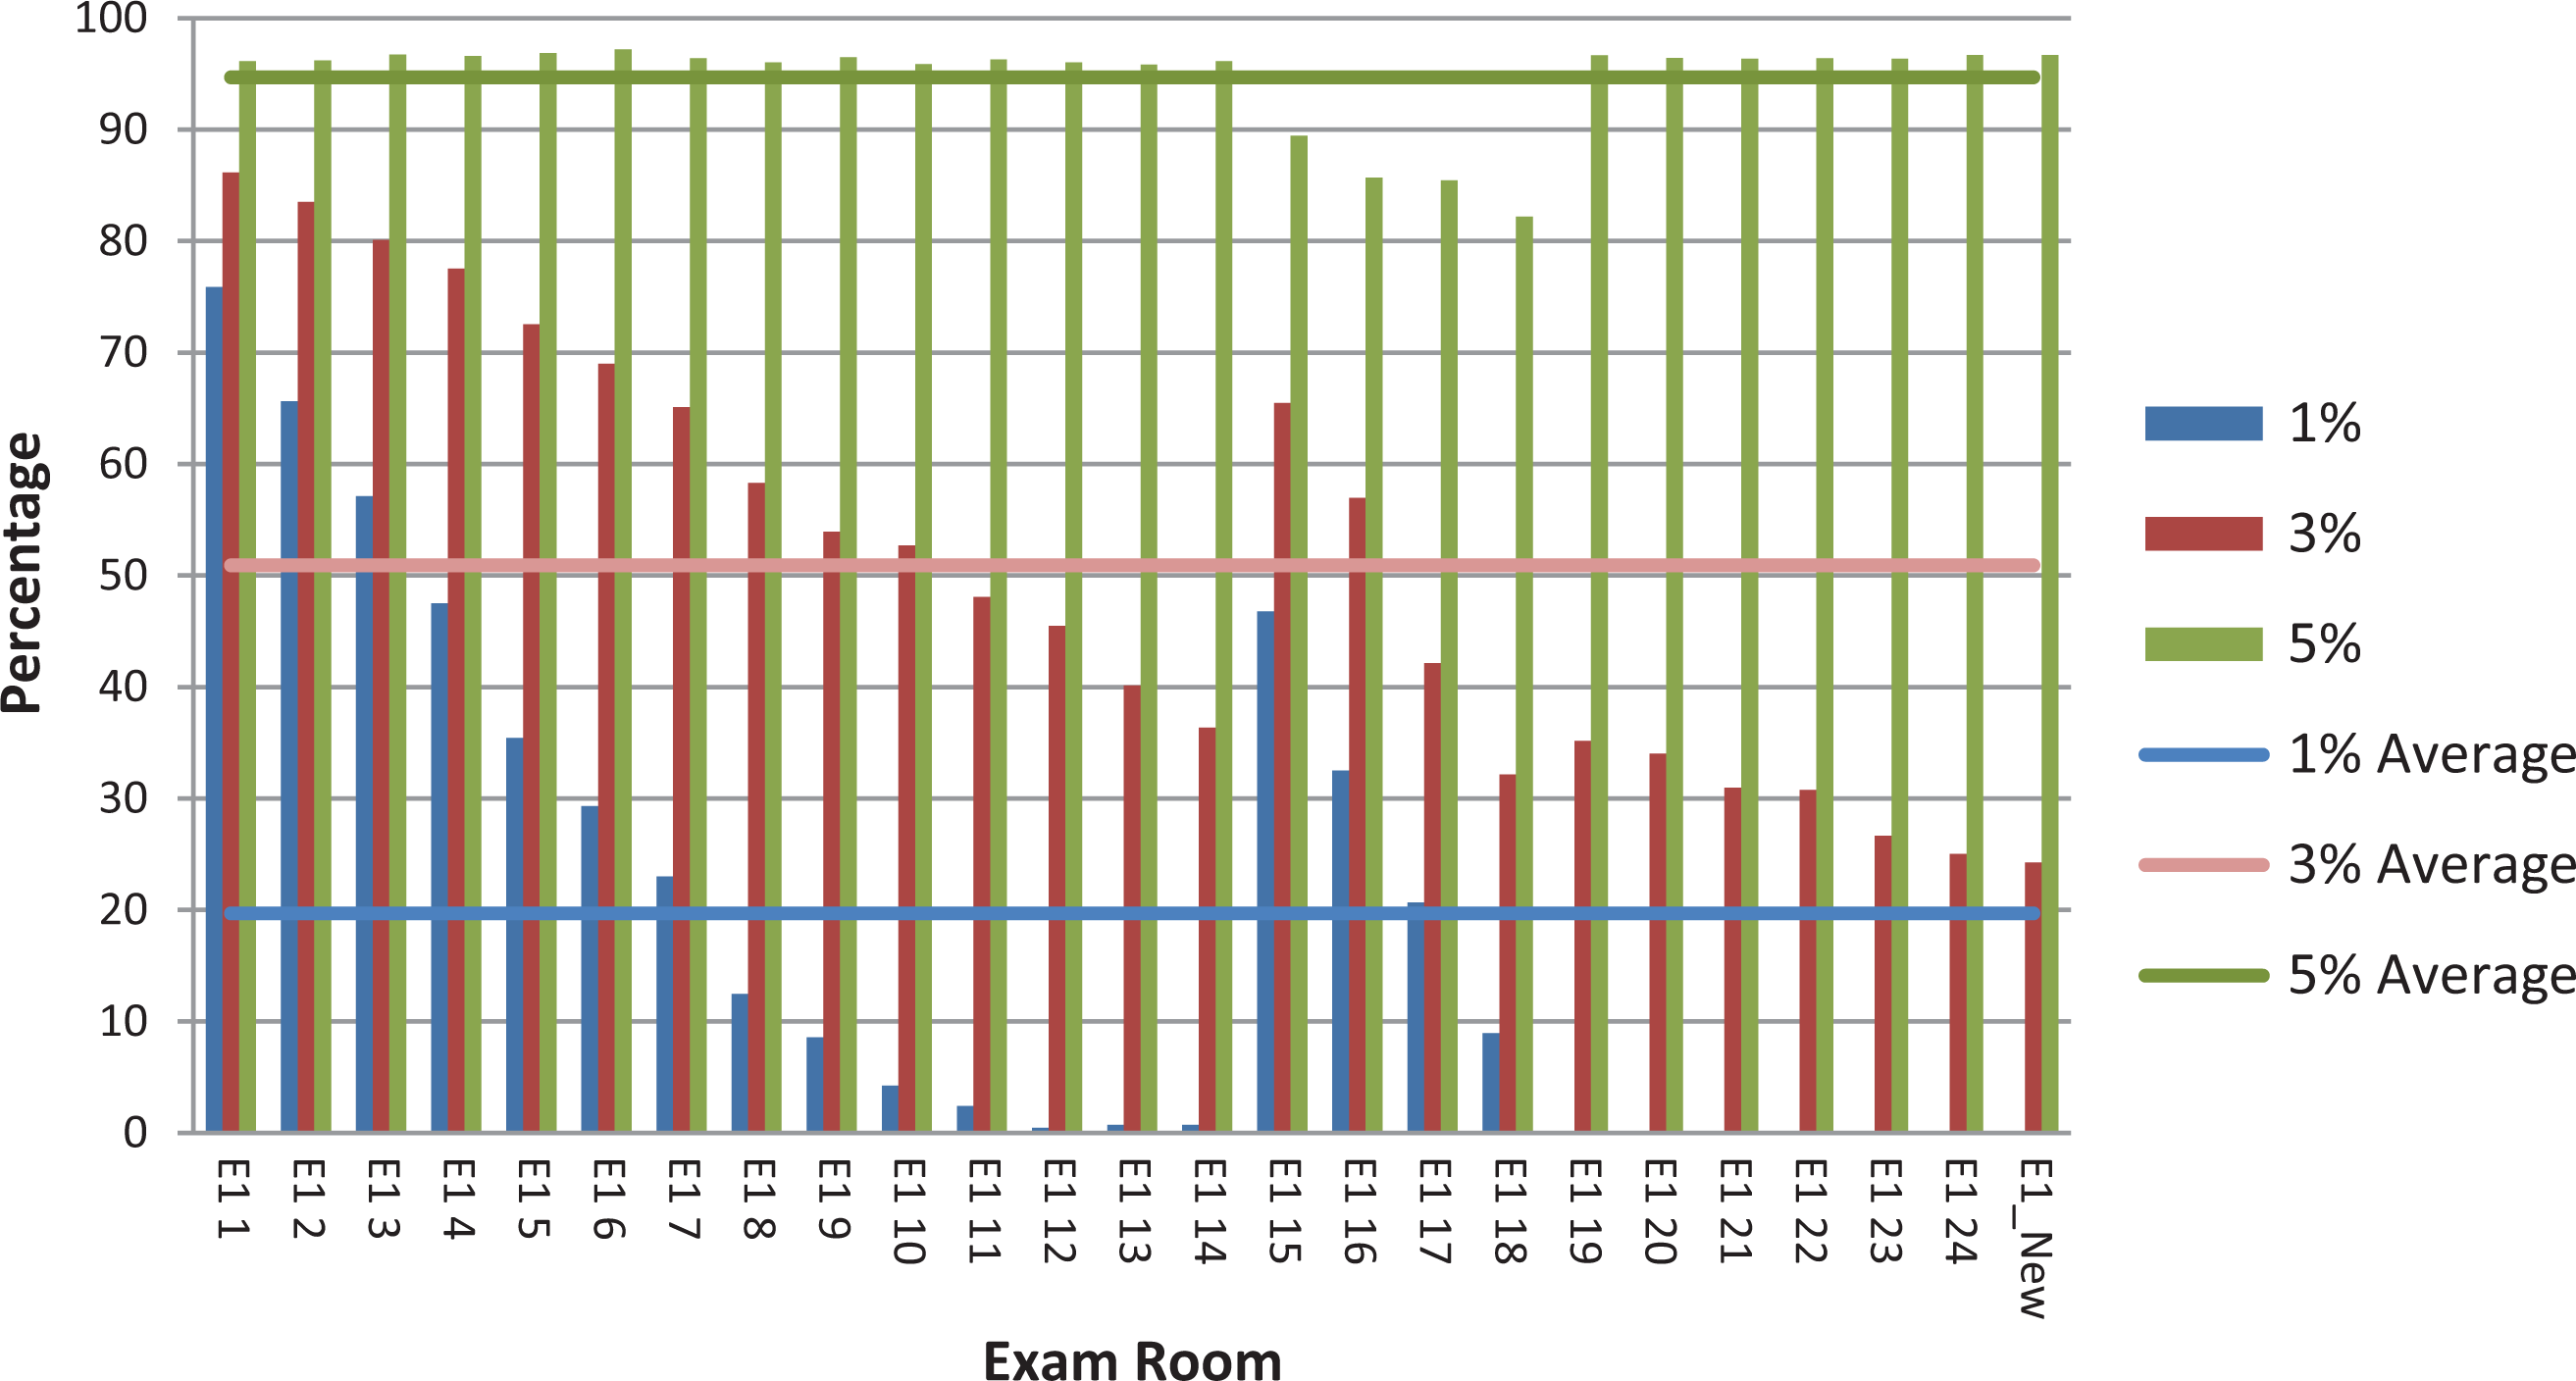
Average exam room utilization for 2036 winter peak volume with 1%, 3%, and 5% growth rates.
Applying SSA to analyze the new design
As the size of the unit drastically increased from 18,010 sq. ft. (37 beds) to 50,330 sq. ft. (78 beds) in the new design, there were concerns about losing the overall awareness of the unit and sacrificing effectiveness of surveillance toward patients. In addition, the new design had more pods, which might lead to the isolation of caregivers and reduced team communication and peer support. Even though DES can evaluate the efficiency related to workflow and process, it has limitations in evaluating the impacts of layout on other behaviors such as visual surveillance and staff communication.
Studies in space syntax have demonstrated the attributes of spatial configurations such as visibility impact movement, co-awareness, and interactions in healthcare settings (Cai & Zimring, 2012; Lu & Zimring, 2011). The visibility can be measured using spatial measures such as step depth and integration. Step depth between two spaces is defined as the least number of syntactic steps that are needed to reach one from the other. Integration is computed by calculating the mean depth of one space from all other spaces. It represents how one space is integrated into the overall spatial system (Bafna, 2003). Cai and Zimring (2012) found that spatial metrics such as integration and peer distance based on step depth demonstrated a strong correlation with nurses’ distribution, interaction, and co-awareness. Nurses assigned in alcoves with lower peer step depth have significantly higher interaction ratio and better co-awareness of other patients’ condition and the peers’ location. Hence, SSA was applied in this project to evaluate the impacts of spatial configuration on the effectiveness of visual surveillance, co-awareness, and team communication. Using Depthmap 10, the team calculated the integration value of the entire ED, the integration of each pod, the step depth from each nurse station to key functional areas, and the peer step depth between nurse stations in both old and new layouts. The results showed that the new design had larger average integration than the old ED (1.446 vs. 1.755). In addition, the integration values for all pods increased in the corresponding areas in the new layout (Figure 13). It shows that the design is better visually and physically accessible both at the local and global level. The comparison of the step depth from each nurse station to key functional areas showed that all the exam rooms and trauma rooms had smaller step depth from the corresponding nurse stations in the new layout (Table 3). It means that it takes fewer turns to see/access the trauma rooms and exam rooms from the nurse stations in the new ED, which indicates an improved visual surveillance and can potently improve patient safety and reduce fall risks. In addition, the results showed that the peer step depth between nurse stations all decreased in the new layout when compared to the old layout, which potentially can lead to more team communication and better co-awareness and peer support (Figure 14).
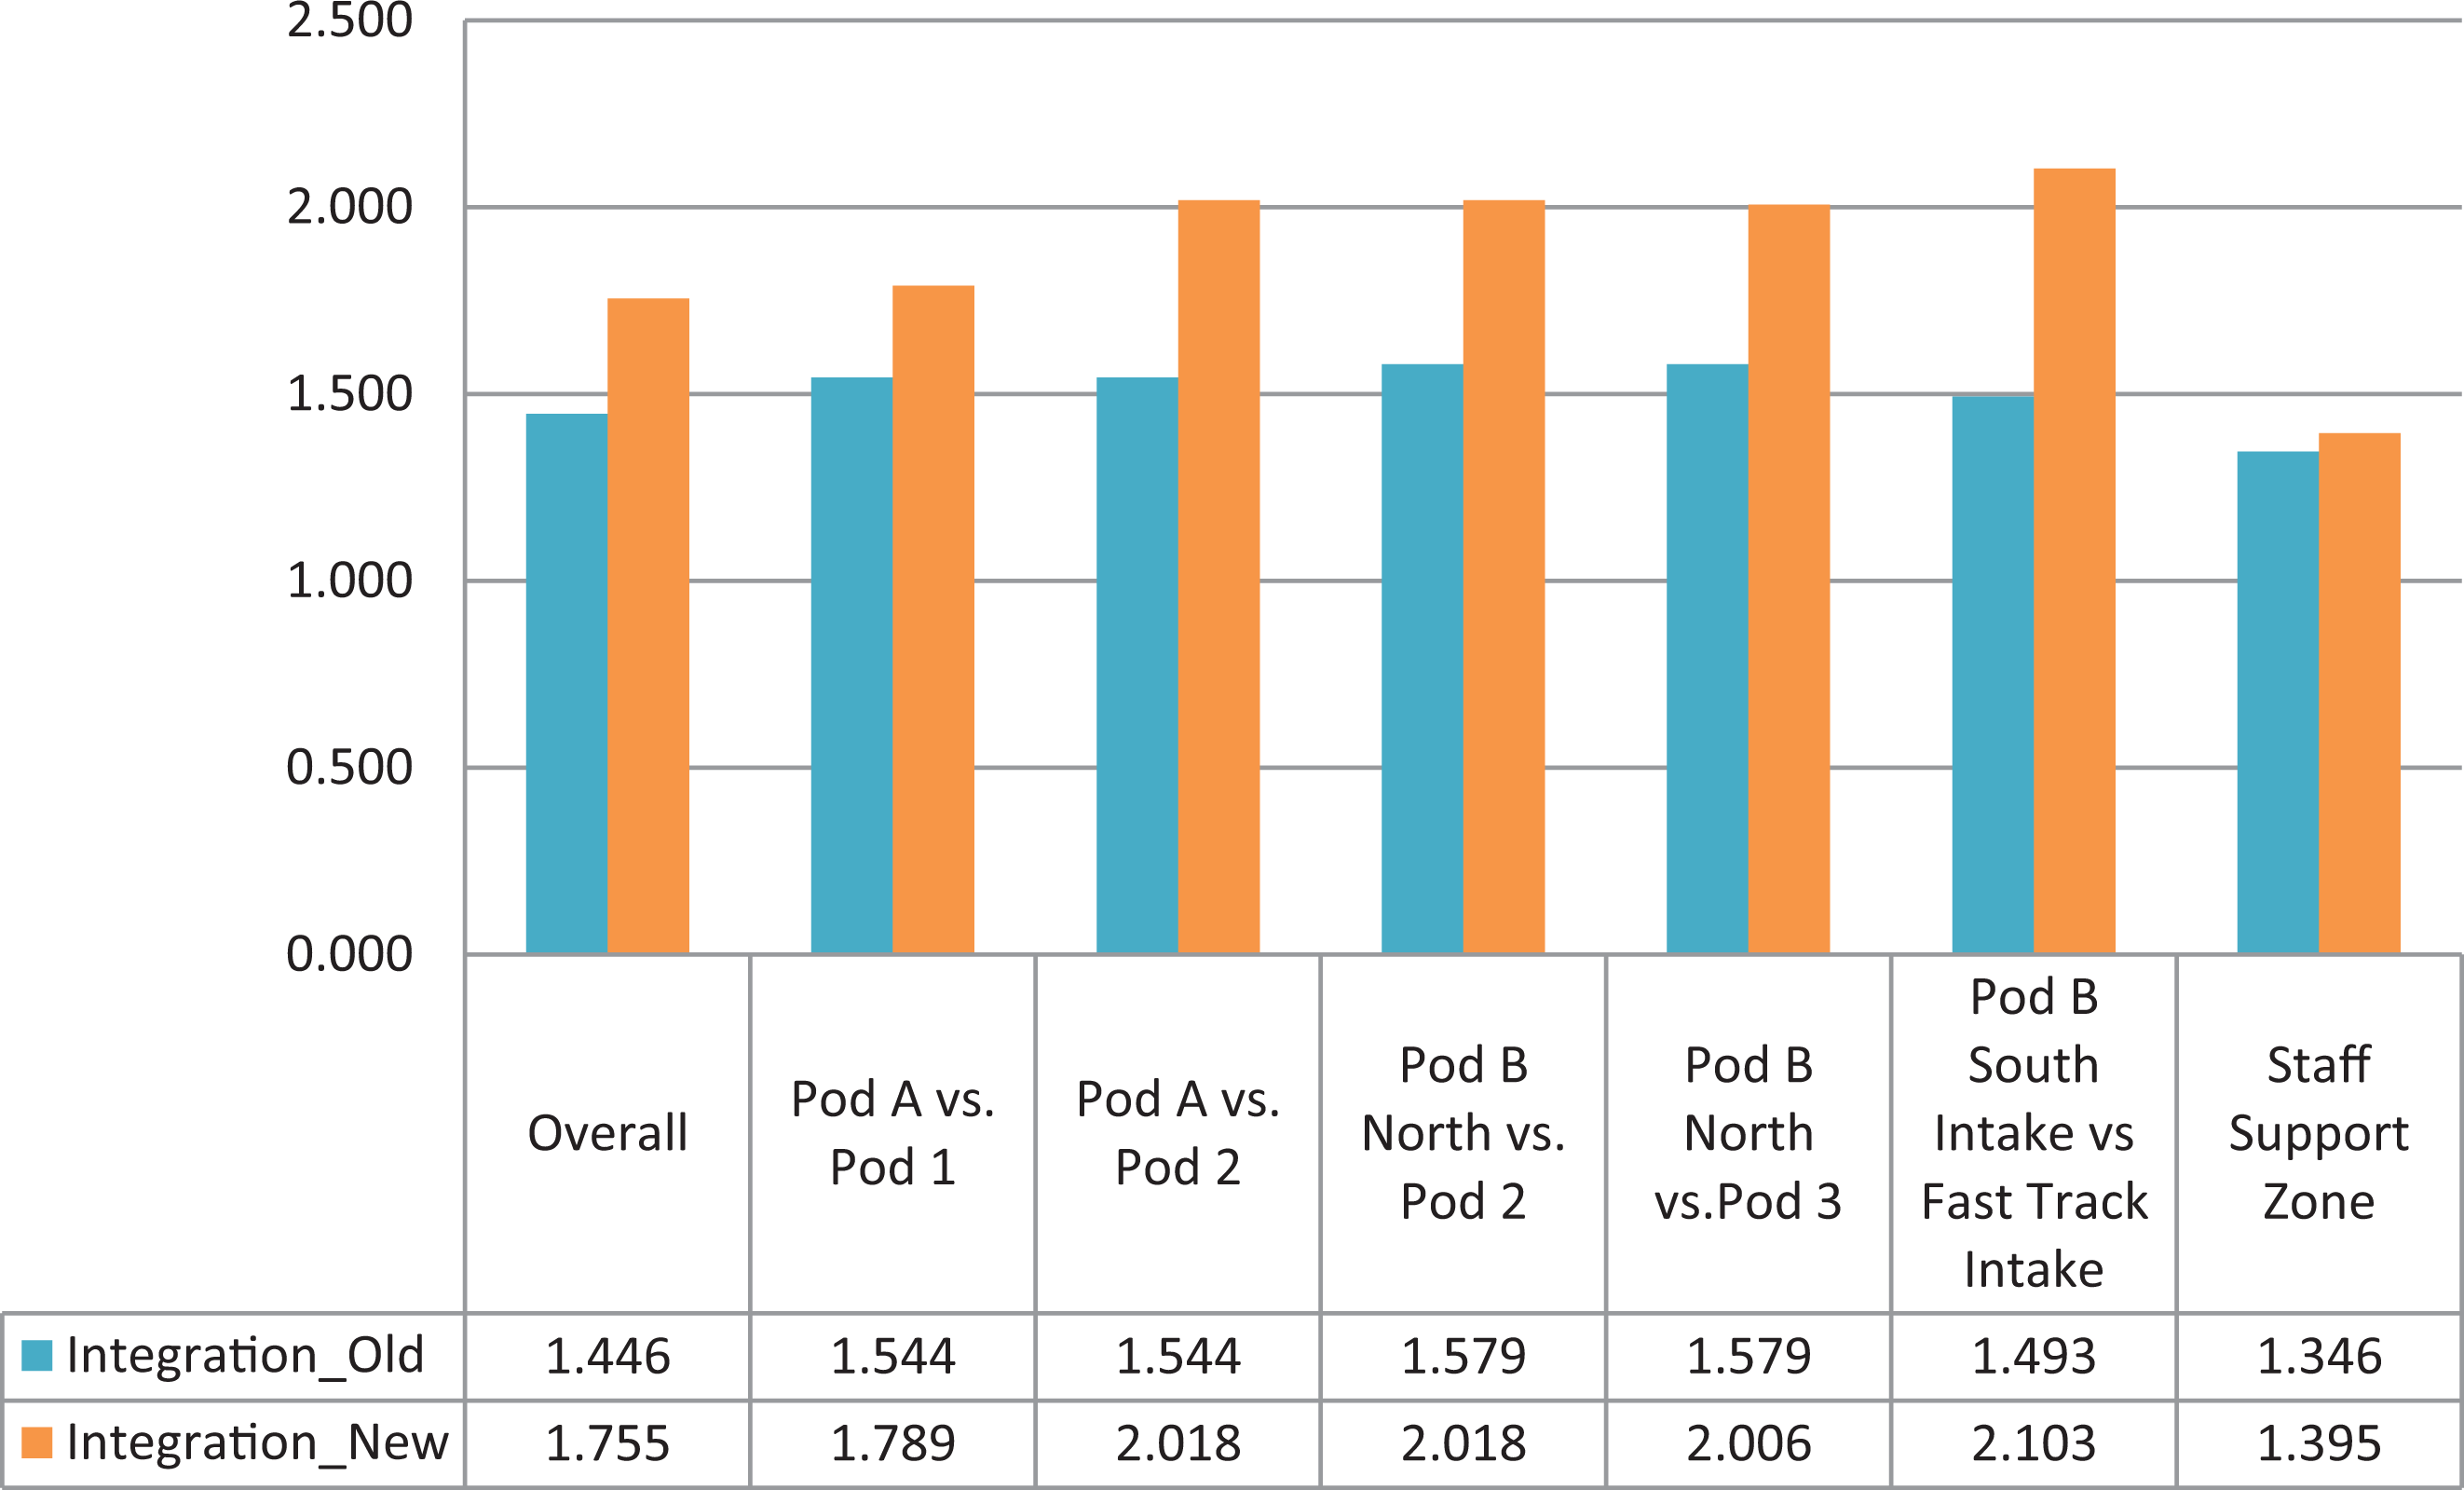
Comparison of integration for key zones between the old and the new emergency department.
Comparison of the Step Depth From Nurse Station to Key Functional Areas in Old and New ED.
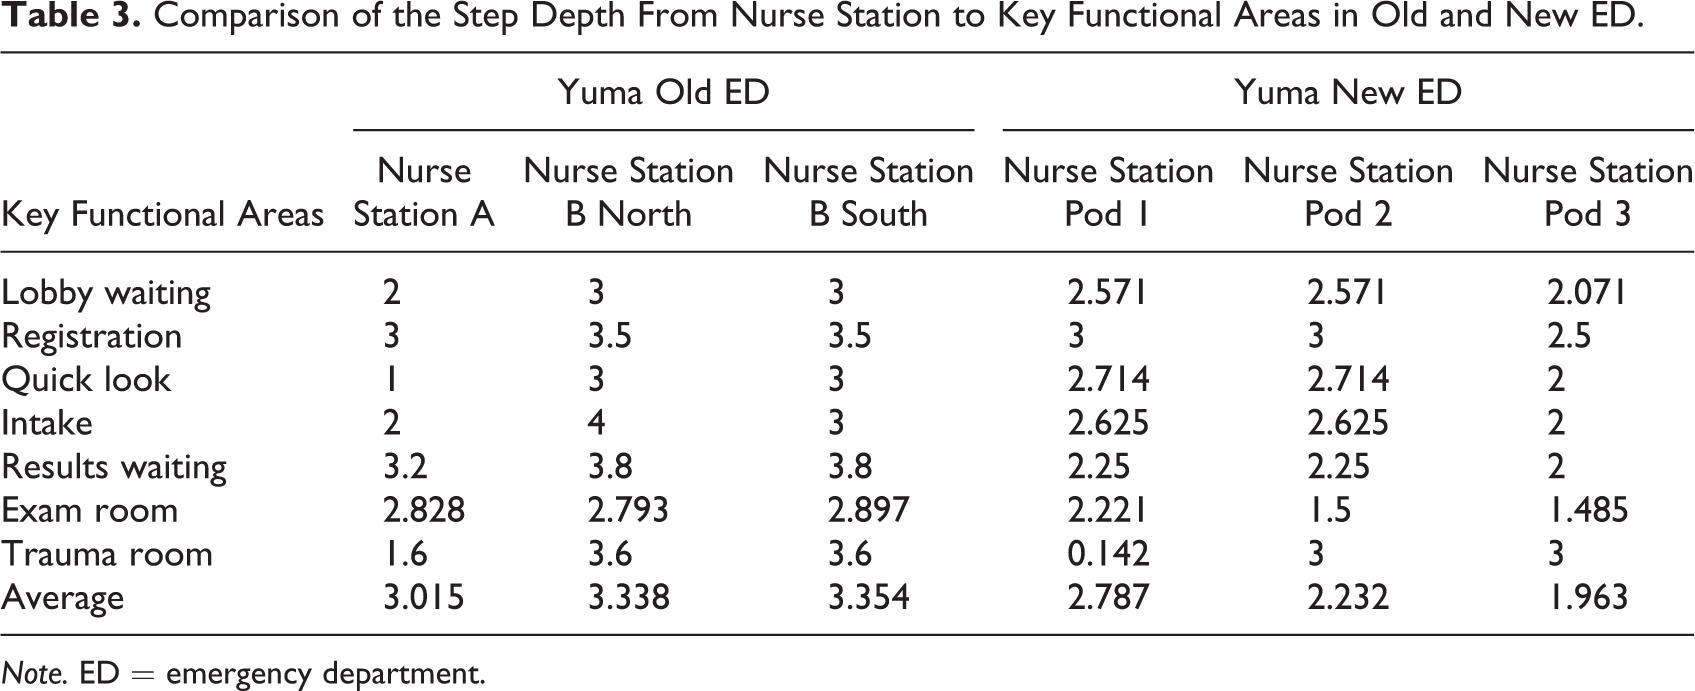
Note. ED = emergency department.
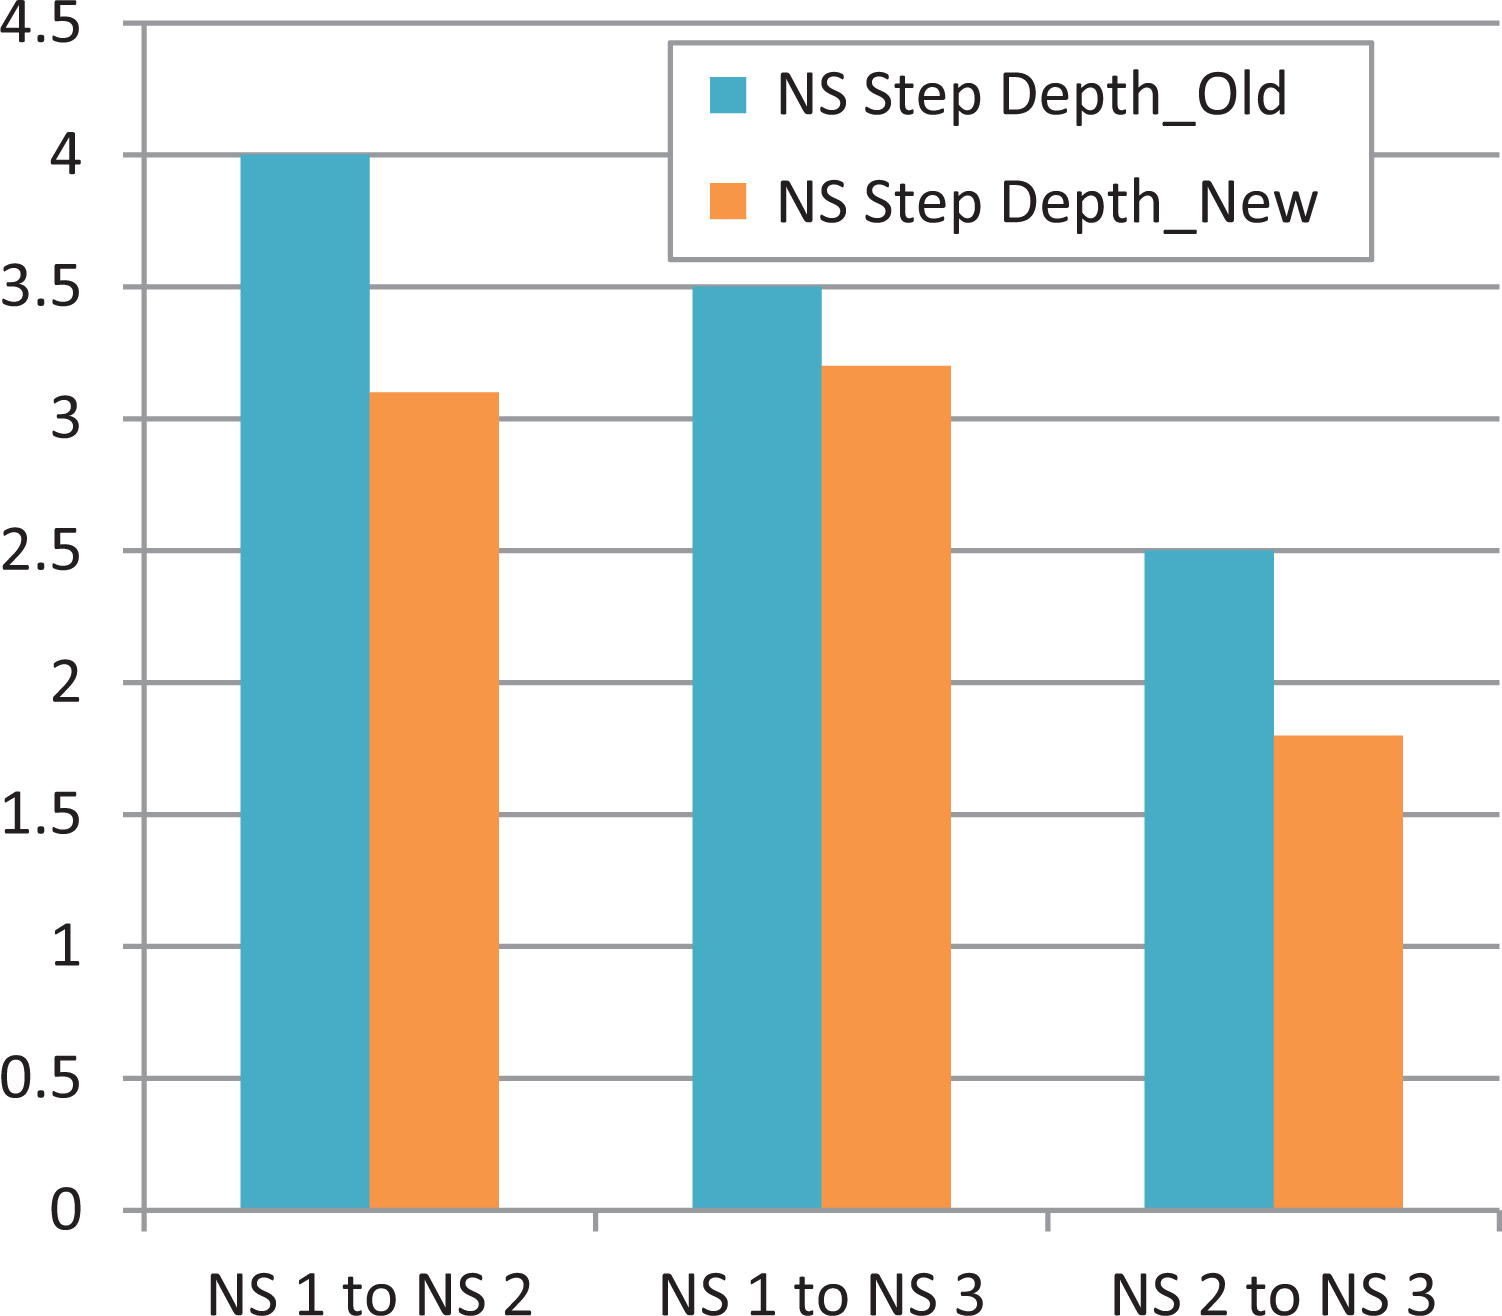
Comparison of nurse station peer step depth between the old and the new emergency department design.
In summary, by combining DES and SSA, the analysis demonstrated that despite the increased number of pods and size of unit, the new ED design has several advantages when comparing to the existing ED: (1) has better operational adjacency relationship with other departments and saves operational cost, (2) supports better staff workflow and patient flow, and (3) offers better visual surveillance for patients and stronger peer-to-peer visual connection that might lead to better co-awareness and team communication. These findings need to be further validated with the on-site observation of the actual performance.
Discussion and Future Work
These case studies have demonstrated the value of DES in facilitating a broad range of design and planning decisions in various clinical settings. DES can be applied at different stages of design, including master planning and schematic design for expansion and new construction. It can be an evidence-based, data-driven design support tool to test capacity, evaluate the impact of new design on workflow and efficiency, compare design options, and identify optimal design solutions. As a stochastic tool, it can better represent the real-life situation. The strength of DES also resides in its capability of testing what-if scenarios without committing the actual design and construction cost. It can help designers and hospital administrators to conduct cost-effective analysis and facilitate design decision-making.
In addition, the process of collecting data and analyzing data can become a good opportunity for user engagement. It can support a truly collaborative and interactive design process. The evidence-based approach makes it easier to reach the consensus in design decisions. DES can also be used as a tool of lean process reengineering to address the system bottleneck. When DES is engaged at the early phase of design and planning, it can help hospital staffs and designers vision both the optimized process and the layout to support the new process.
However, it should be noted that DES is associated with a significant amount of front-end data gathering. The validity of the DES model is highly dependent on the accuracy of the input data. The level of detail for the data collection is often associated with cost and time (Hamrock et al., 2013). Depending on the type of data that the healthcare institutions readily have, and the methods that will be used to collect data, the time and resource that need to commit to data collection can vary greatly. The team needs to be conscious of the appropriate level of detail for the project. The case studies showed that thanks to the rapid development of EMR and RTLS tracking technology, the process of collecting the input variables has drastically speeded up. On the other hand, simulation teams should be conscious about the easily available data in the era of big data. It is important to have clear objectives that the hospital staff, simulation team, and designers agree on, define the scope accordingly, decide on the level of details, and control the complexity of model at the upfront of the project to avoid overbuilding the simulation model for excess time and resources consumption.
It is worth noting that the validity of DES models and simulation results need to be tested and calibrated with actual clinical and operational data and on-site observations. For instance, a simulation study by Pati, Harvey, and Thurston (2012) showed that holding all other factors constant, decentralized configurations had the potential to reduce nurse walking distance by up to 68%; however, when Pati and colleagues (2015) tested this simulation in the real world, they found a significant increase in walking distance between pre- and postmove to decentralized units, even though the overall floor plate was unchanged. It is recognized that human variation might contribute to a large percentage of the disparity between simulation predictions and real-world performance. The social, psychological, physiological, and behavioral needs of the workforce and the physical and organizational environment can all impact the work performance (Baines, Mason, Siebers, & Ladbrook, 2004; Brailsford, Sykes, & Harper, 2006). Human factors should be integrated into DES to better reflect real-life scenarios. SSA can complement DES as it addresses the behavioral aspects of design and provides quantitative measures that indicate how space affects human experiences and organizational performance.
Future projects should use POE to validate the results from the simulation and identify other cultural, psychological, and behavioral factors that can affect the workflow and process. Applying DES together with pre-occupancy evaluation and POE and other simulation tools such as SSA can triangulate the data and lead to more solid evidence for future healthcare design projects. In addition, conducting interviews with hospital staff and architects who have engaged with DES can help learn their experience and inform better ways to integrate DES in the EBD process.
Implications for Practice
DES was introduced as a performance-driven design tool for capacity planning, design evaluation, and optimization based on workflow analysis and reengineering. The explanation of the process, methods, and results of applying DES could benefit hospital administrators and designers who aim to employ DES as a tool for facilitating data-driven design decision-making to gain a deeper understanding of the tool. This study provided detailed descriptions of three case studies on various ways of applying DES in healthcare design. DES can be applied at different stages of design, including master planning and schematic design for expansion and new construction. The DES modeling requires a significant amount of front-end data collection. The EMR and RTLS technology can facilitate the process of data collection. The process of collecting data and analyzing data can become a good opportunity for user engagement and lean process reengineering. It can support a truly collaborative and interactive design process. The DES analysis can address the process and performative aspects of healthcare environments but not the psychological, social, cultural, and behavioral aspects. POE and other simulation tools such as space syntax that can address human factors and behavioral aspects of operations were suggested to complement the DES analysis to provide more solid evidence for future design.
Footnotes
Acknowledgment
The authors would like to acknowledge David Morgareidge for his advice and feedback for these projects while he worked at CallisonRTKL Associates.
Declaration of Conflicting Interests
The authors declared no potential conflicts of interest with respect to the research, authorship, and/or publication of this article.
Funding
The authors received no financial support for the research, authorship, and/or publication of this article.