



Abstract
Background:
Effective rehabilitation should include high levels of physical activity. The impact of the environmental design on activity levels has had minimal consideration.
Purpose:
This study investigates activity levels of inpatients undergoing rehabilitation in a new rehabilitation facility with innovative design and multidisciplinary care, comparing weekday and weekend activity levels, as well as changes over a 12-month period.
Method:
An observational study reporting participants’ location, people present, body position, and activity type on 2 weekdays and 1 weekend day using behavior mapping techniques. Fifteen participants were observed in a mixed rehabilitation unit with neurological, orthopedic, and other health conditions.
Results:
Results were calculated as the proportion of observations participants spent in each location, position, and performing activities (physical, cognitive, social), and time spent alone and inactive. On average, participants were engaged in activity for 86% (standard deviation [SD] = 9) of the day, with physical activity accounting for 51% (SD = 11), cognitive activity 28% (SD = 10), and social activity 42% (SD = 16). There was more physical activity (mean difference [MD] 8% absolute, confidence interval [CI] = [4, 12], p < .01) and less social activity (MD −6% absolute, CI [−11, −1], p = .02) on weekdays compared to weekends. Overall, participants were alone and inactive for 12% (SD = 9) of the day. Participants observed in 2016 displayed similar results to those observed in 2015.
Conclusion:
High levels of activity were achieved in this facility that underwent environmental redesign, construction of new facilities, and implementation of evidence-based strategies.
Physical rehabilitation aims to promote independence by improving functional capacity (Bernhardt et al., 2017). Effective rehabilitation should include high levels of physical activity (Janssen et al., 2014b; Patterson, Blair, Currie, & Reid, 2005); however, most individuals residing in rehabilitation facilities spend a substantial amount of time alone, inactive, or sleeping (Davenport et al., 2015; Janssen et al., 2014a, Patterson et al., 2005). Literature indicates that these behaviors are demonstrated in various health conditions, with individuals with lower limb orthopedic conditions being considerably inactive, with a total of 8 min of walking and 398 steps per day (Peiris, Taylor, & Shields, 2013). Furthermore, individuals in hospital after stroke have been observed to spend substantial amounts of the day alone (median 53%), inactive (median 48%), and in their bedroom (median 56%; West & Bernhardt, 2012). Low levels of physical, cognitive, and social activity in rehabilitation are associated with deconditioning, low mood, and a loss of independence (Patterson et al., 2005; Peiris, Taylor, & Shields, 2012).
A private rehabilitation hospital in Sydney, Australia (Royal Rehab Private Hospital), that provides general rehabilitation (including neurological and orthopedic rehabilitation), recently underwent an environmental redesign with construction of new facilities. This offered an opportunity to create an environment that facilitated the implementation of a number of evidence-based strategies in an attempt to increase activity levels of individuals participating in rehabilitation. Broadly, these strategies included greater utilization of multidisciplinary teams, environmental enrichment, and increasing the amount of therapy by providing additional services and expanding facilities.
Multidisciplinary teams require integration of medical, nursing, and rehabilitation therapists along with social, educational, and vocational services to provide individually tailored care plans (Wright et al., 2012). The redesign of the facility incorporated shared offices for allied health staff as well as communal therapy spaces. These changes to building design aimed to create increased opportunities for communication between multidisciplinary teams. This collaboration between healthcare professionals allows delivery of coordinated therapeutic care and improves rehabilitation intervention (Momsen, Rasmussen, Nielsen, Iversen, & Lund, 2012).
Environmental enrichment refers to the presence of equipment and organization of surroundings to facilitate physical, cognitive, and/or social activity (Nithianantharajah & Hannah, 2006). Following stroke, those who participate in rehabilitation that has implemented enriched environments are more likely to be engaged in an activity and are less likely to be inactive, alone, or asleep compared to those in a nonenriched environment (Janssen et al., 2014b). Within this particular facility, the addition of communal eating and recreation spaces, an outdoor walking track, working garden, and hydrotherapy pool were all intentional design features attempting to promote high levels of activity, which are presented in Figure 1.

Photographs of the interior and exterior spaces at Royal Rehab Private Hospital which have undergone redesign. (A) Working garden encircled by walking track and sporting facilities. (B) Communal dining area. (C) Bedroom. (D) Shared multidisciplinary therapy room.
Increasing the dose of activity and therapy performed by individuals undergoing rehabilitation has been shown to enhance recovery (Scrivener, Jones, Schurr, Graham, & Dean, 2015). After-hours and weekend sessions can help improve activities of daily living and increase the amount of physical activity they perform (David, Price, Price, Sheeran, & Mulherin, 2003; Peiris et al., 2012; Scrivener et al., 2015). At Royal Rehab Private Hospital, the introduction and utilization of group therapy and individualized daily schedules provide a supportive environment, facilitating interaction among peers. Moreover, enabling efficient use of time and therapeutic resources related to group dynamics such as feedback and social reinforcement (De Weerdt et al., 2001). Family members, visitors, and volunteers have been onboarded in this facility to offer similar forms of active encouragement in the engagement of therapeutic activities in addition to routine therapy.
This study aimed to review the behavior of individuals undergoing rehabilitation at Royal Rehab Private Hospital to assess levels of activity and inactivity. Furthermore, as this was a newly renovated facility, the study aimed to review whether behavior changed or was maintained over a 12-month period. This study aims to determine the physical, cognitive, and social activity levels of individuals undertaking rehabilitation at Royal Rehab Private Hospital postredesign, by answering these specific research questions: What proportion of the day do individuals in rehabilitation spend completing physical, cognitive, and social activity and do these values differ between weekdays and weekends? Who is present with individuals in rehabilitation and in what location is time spent, and does this differ between weekdays and weekends? What proportion of the day do individuals in rehabilitation spend lying, sitting, or standing? Are the levels of activity achieved by individuals participating in rehabilitation similar at two time points, 1 year apart?
Method
Design
A cross-sectional observational study was conducted utilizing behavior mapping. This technique involves observation and documentation of individuals sited activity at set intervals, on a predetermined form by marking relevant categories. This method is commonly used to observe the behavior of individuals in hospital (West & Bernhardt, 2012). The categories recorded on the behavior map in this study were location, people present, position, and activity type.
The study was approved by the Northern Sydney Local Health District, Human Research Ethics Committees. All participants provided written informed consent before data collection commenced.
Participants
All individuals admitted to the unit during the observation period were reviewed for study eligibility. Screening was conducted by the clinical team during an initial assessment on admission to the unit. Participants were eligible for inclusion if they were over the age of 18, actively engaged in rehabilitation, living in the community prior to admission, walking independently with or without aid prior to admission, had an estimated stay of 7 days or more, and were able to provide informed consent. Individuals were excluded if they scored less than 24/30 on the Mini Mental State Examination, had a language impairment that prevented them being able to provide informed consent to participate in the study, or were pregnant. Participant data were excluded if they were discharged prior to the completion of the study or had been observed for less than 2 days.
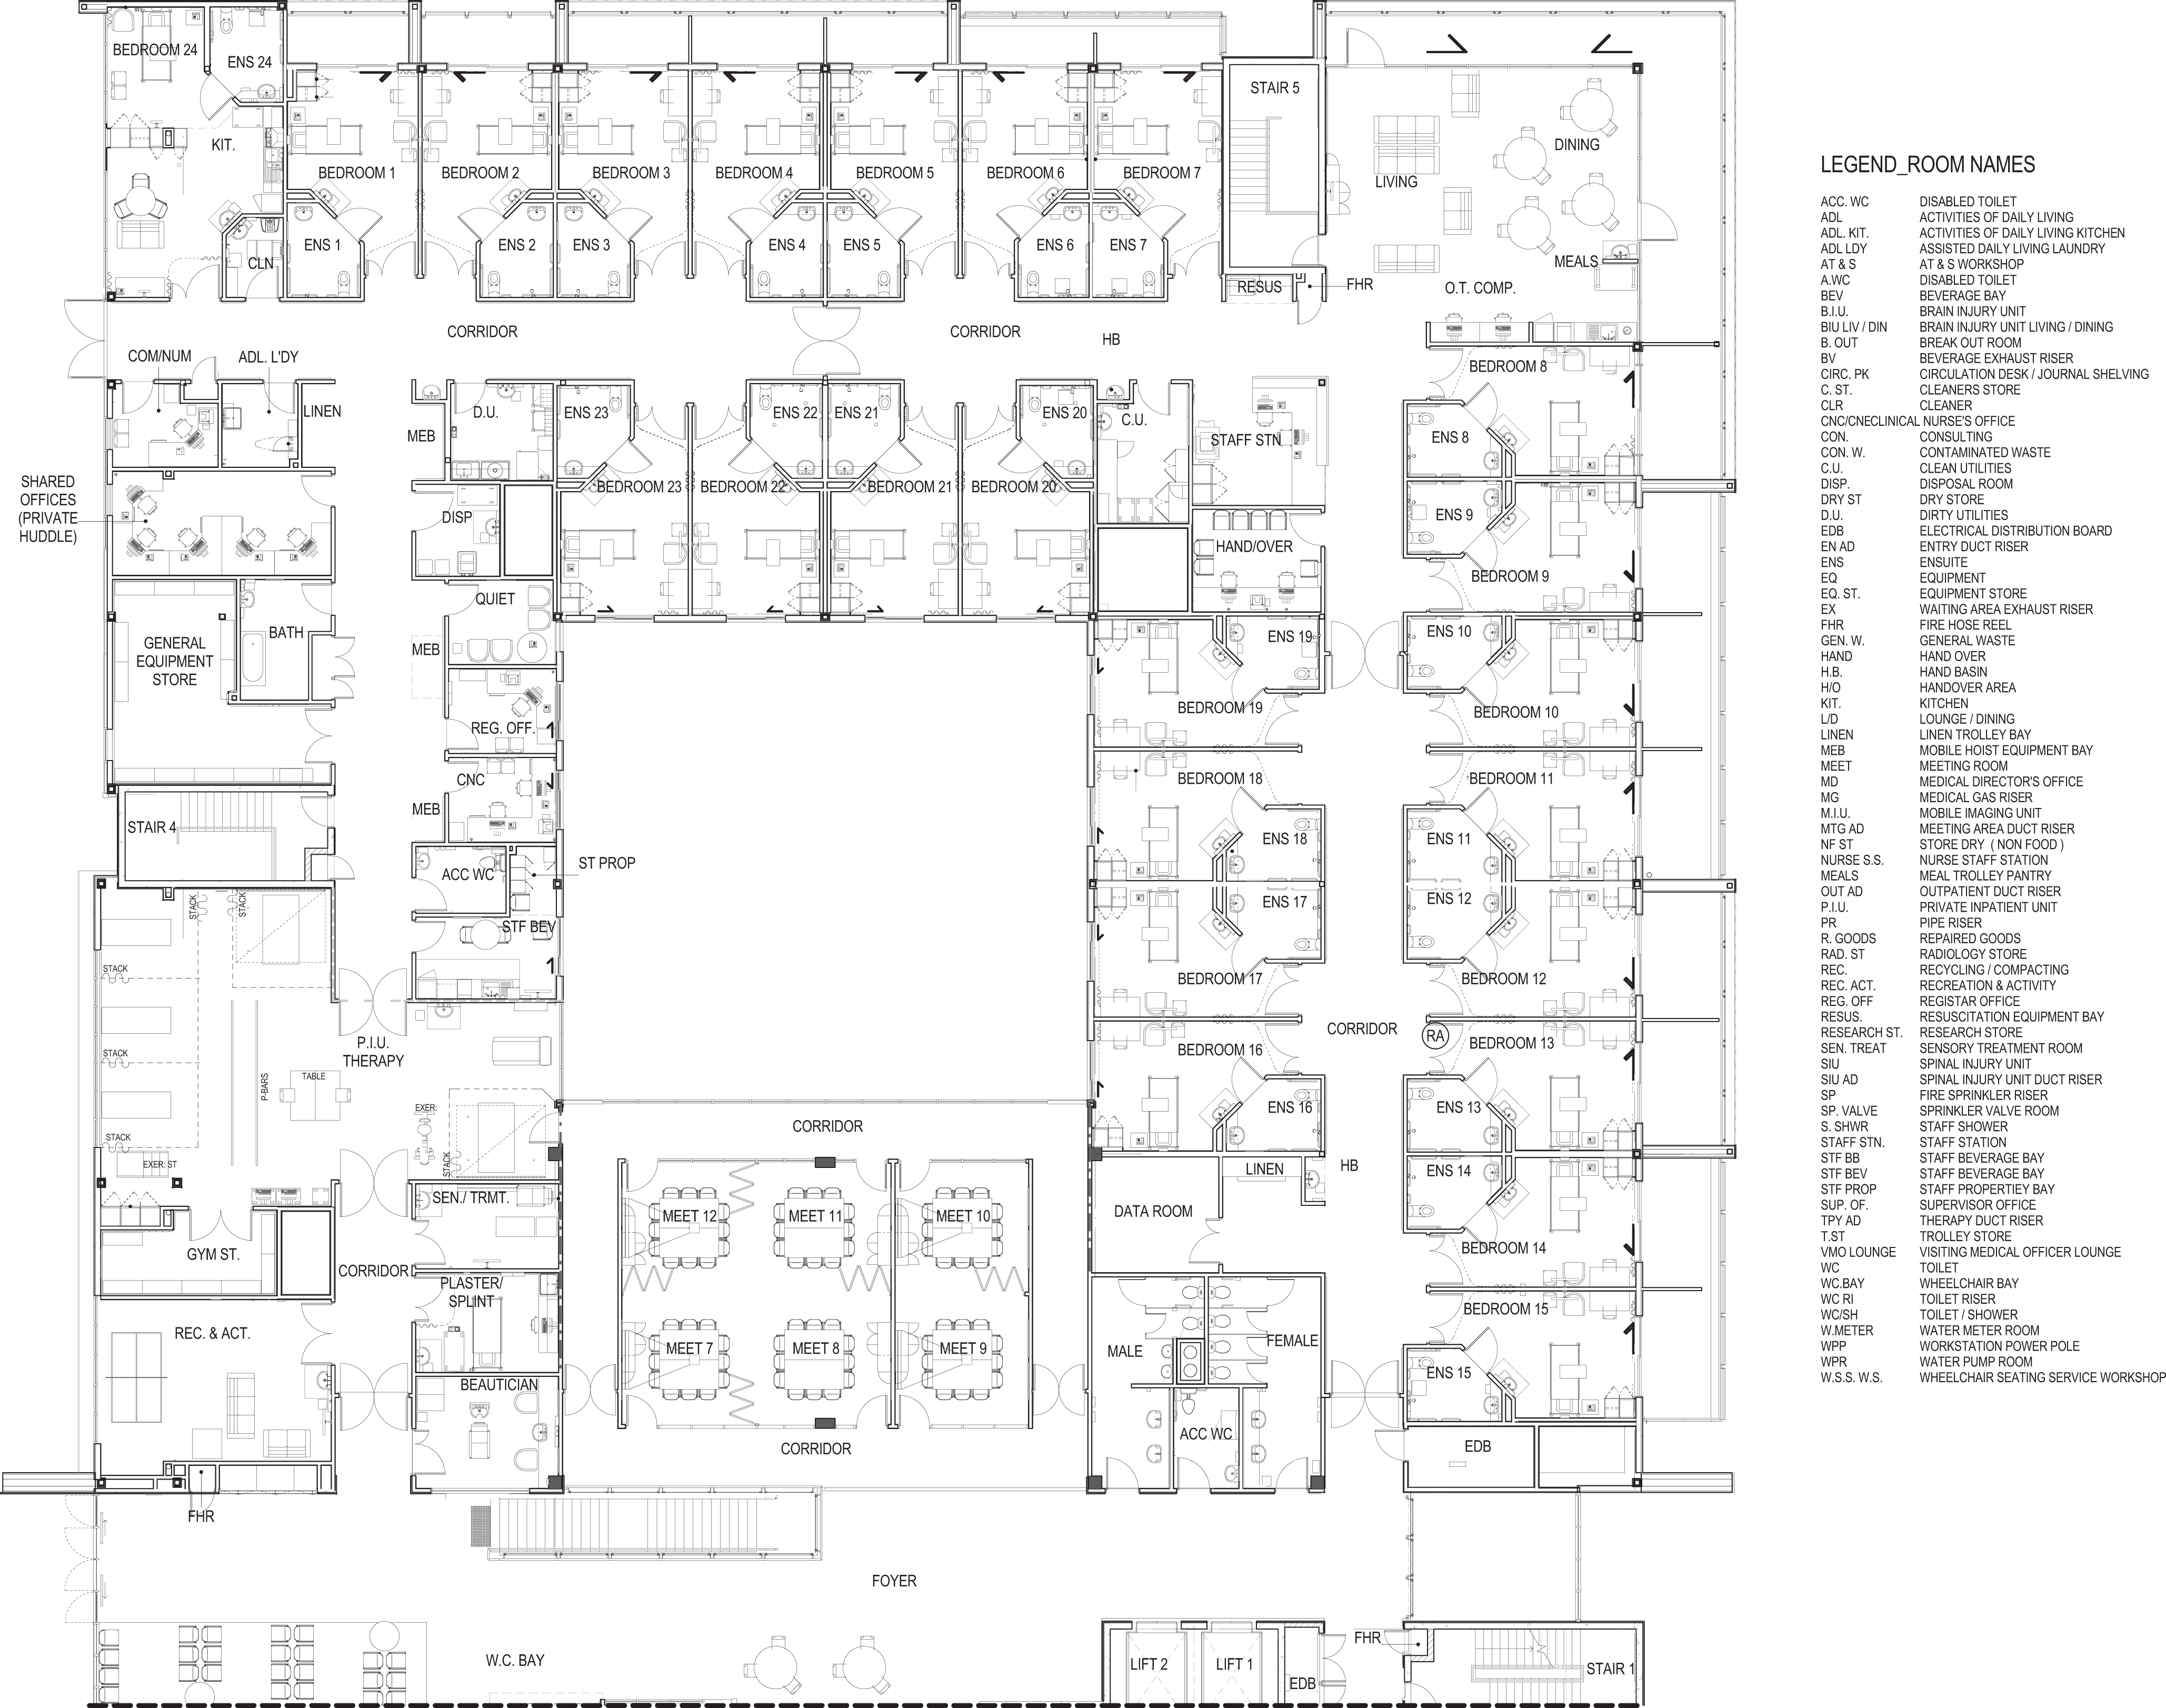
Floor plan of the internal redesign of Royal Rehab Private Hospital. Figure presents communal dining areas, large multidisciplinary therapy room in close proximity to bedrooms and various shared offices and meeting spaces for allied health care staff.
Demographic data were extracted from medical files for each participant. Information obtained included age, gender, health condition, side of body affected, time delay to rehabilitation, length of rehabilitation, day of rehabilitation entering study, aids used before and during rehabilitation, initial functional independence measure score, walking speed, and 6-min walk test scores.
Setting
The study was conducted at a private, inpatient mixed-rehabilitation unit, providing services for individuals with neurological, orthopedic, and other medical and surgical conditions. Inpatient rehabilitation typically refers to physician and therapy services received while staying within a rehabilitation facility, with the focus of assisting recovery and maximizing functional independence.
Royal Rehab Private Hospital relaunched and was operating at capacity by early 2014, with a changed structural design of the building and new models of care. The key architectural features of the redesign included a large communal meal area, wide and well-lit therapy rooms with dual-entry points to facilitate proximity of individuals to therapy areas, spacious corridors and 24 single-bedrooms, hydrotherapy pool, outdoor courtyard with barbecue area, sporting courts, a productive garden, and outdoor walking track with access to public parklands.
Staff within the restructured facility were encouraged to work collaboratively within the multidisciplinary team as well as with the individuals undertaking rehabilitation and close family and/or friends, to plan and implement individualized rehabilitation programs, and create personalized timetables for activities each day, 7 days per week. To facilitate this interaction common, offices were created used by all allied health clinicians in the hospital. Care was coordinated to include additional opportunities for rehabilitation in group settings, including a “walking group” on a purpose-built mobility course and therapy sessions such as “sunrise exercise” and “breakfast group.” These extra therapies were an addition to routine gym-based therapy.
Procedure
Behavior mapping occurred over 3 days in March 2015 (approximately 1 year following the hospital’s redevelopment) and again in March 2016. Participants were observed every 10 min from 7 a.m. to 8 p.m. on 2 weekdays and 1 weekend day. This duration of observation (3 days) was chosen as a practical amount of time, which is similar to the majority of studies utilizing behavior mapping, that typically observe for 1–2 days. The days of the week were randomly selected in 2015, and then the same days were observed in 2016. This totaled 39 hr or 234 direct observation time points over the 3 days. These observations were recorded directly onto a behavior mapping spreadsheet.
The observers were trained, provided with a reference manual, and participated in practice observation sessions to ensure consistency between observers. When mapping, the observer walked a predetermined route starting and finishing at the therapy gym. Hydrotherapy was observed via closed-circuit television, and outdoor areas were observed from a raised balcony that provided a clear and unobstructed view of all outdoor therapy and recreational areas. The participant’s activity at the time of initial sighting by the observer was the activity that was documented. Rosters were developed, so that observers had scheduled breaks.
Behavior Mapping
The behavior mapping process was based on the protocol previously used by Janssen et al (2014a) with minor changes to the activity coding. Participant locations were defined as the area in which the participant was first observed: (a) bathroom, (b) bedroom, (c) verandah, (d) therapy areas, (e) communal areas, and (f) not observed. “Not observed” was recorded if the participant was off the ward or they could not be located within the 10-min block.
The proportion of the day spent alone, with visitors, other patients, medical and/or care staff, therapists, and not observed was recorded. “Alone” described instances where no other person was within a 2-m radius of the participant. “Medical and/or care staff” included doctors, nursing staff, social workers, dieticians, and pharmacy staff. “Therapists” included rehabilitation assistants, speech pathologists, occupational therapists, physiotherapists, physiotherapy students, volunteers, psychologists, and recreational therapists. Not observed indicated that the people present were unable to be determined (i.e., patient was behind closed curtains or in the bathroom).
The participant’s body position at each observation was described as lying, sitting, standing, or not observed. The activities participants were completing were described as physical, cognitive, social, any activity, no activity, and not observed. Physical activity was defined as any purposeful physical movement including eating, drinking, activities of daily living, active participation in transfers, ambulation, and activity during physical, occupational, and speech therapies. Cognitive activity was defined as any nonphysical mental activity in which the participant could be observed to be actively engaged in a mental task including reading a book or newspaper, listening to music or the radio, crosswords, puzzles, games, speech therapist prescribed language exercises, video games, writing, computer use, and playing a musical instrument. Additionally, television viewing was considered a cognitive activity in this study.
Social activity was defined as interaction that involved verbal communication with people present or through telecommunication devices, as well as other nonverbal interactions such as physical touch. Any activity was defined as a general category capturing observations when participants were engaged in any of the previous activity categories, that is, physical, social, or cognitive, and no activity indicated that the participant was not engaged in any physical, cognitive, or social activity (e.g., sitting quietly or sleeping). Not observed indicated that a participant was off the ward, could not be found, or the researcher was unable to determine what activity was being performed. If the participant was observed to be completing two types of activity at the same time, for example talking while walking, then this was documented under both categories.
Data Analysis
Data analysis was completed using IBM SPSS Statistics (Version 22). Mean, standard deviation (SD), and range of proportion of observations spent in each category were calculated. Figures were calculated for the total observation period as well as for the weekdays and weekend. To determine whether there was a difference between weekday and weekend, a paired t test was completed. To determine whether there was a difference between 2015 and 2016 results, an independent t test was completed. Mean difference (MD) and 95% confidence intervals (CIs) were calculated, and statistical significance was set at p < .05.
Results
Seventeen individuals met the inclusion criteria and consented to participate in the study. Fifteen of the consenting participants were observed for at least 2 days and were therefore included in the study. In 2015, seven participants were observed, and in 2016, eight participants were observed. Participant’s baseline characteristics for the 2015 and 2016 intake have been summarized in Table 1. For each participant, there were 78 possible observations daily and 234 observations over the total 3 days. The mean number of actual observations for each day was 74 (95%) and 76 (97%) in 2015 and 2016, respectively, with outcome measures therefore reported on average for 95% of each 13-hr day.
Demographics of the 2015 and 2016 Study Participants.
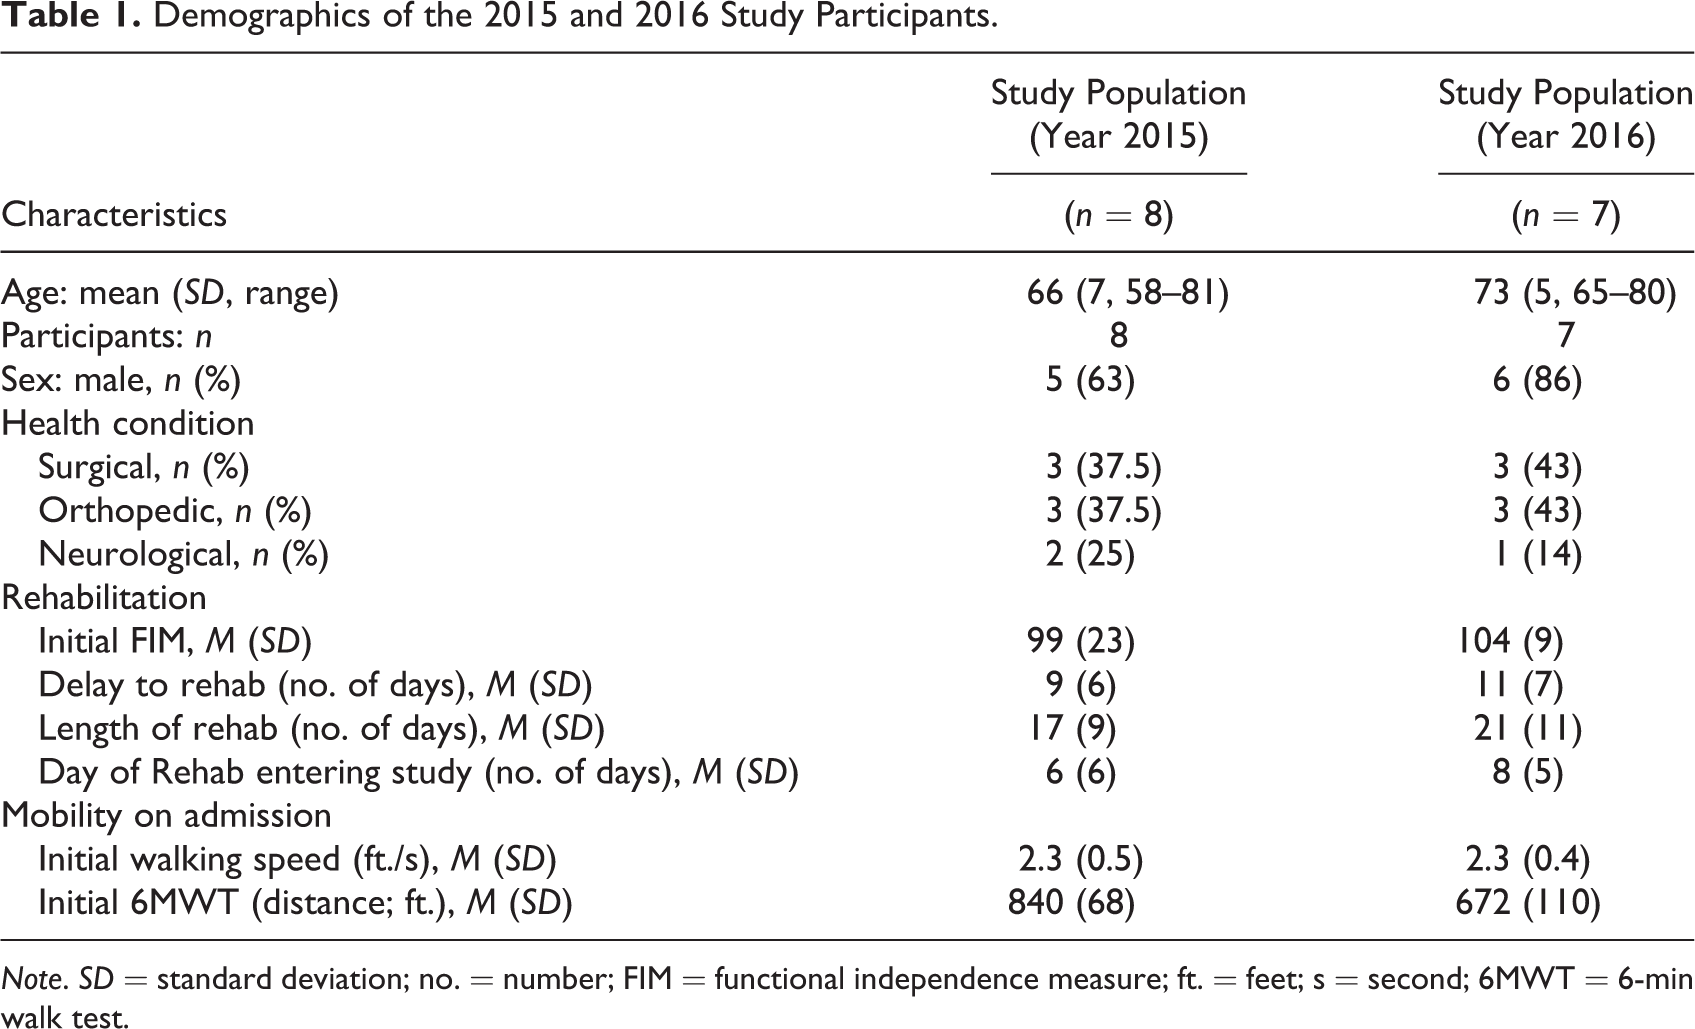
Note. SD = standard deviation; no. = number; FIM = functional independence measure; ft. = feet; s = second; 6MWT = 6-min walk test.
Activity Levels
On average, over the 3 observation days participants were engaged in activity for 86% of the day. Physical activity accounted for 51% of the day, cognitive activity for 28%, and social activity for 42% of the day (refer to Table 2). Interestingly, there were significantly higher levels of physical activity on weekdays (MD 8% absolute, CI [4, 12], p < .01) compared with weekends. However, on weekdays, there was 6% (absolute difference) less social activity (CI [−11, −1], p = .02) than on weekends. On average, participants were both alone and inactive for 12% (SD = 9) of the day. There was no significant difference in the proportion of observations spent alone and inactive on weekdays compared with weekends (MD = 2% absolute, CI [−3, 7], p = .2). A breakdown of activity levels on weekdays compared to the weekend is shown in Table 2.
The Average Activity Levels for Participants (Mean and SD) and the Difference Between Weekday and Weekend (95% Confidence Interval).
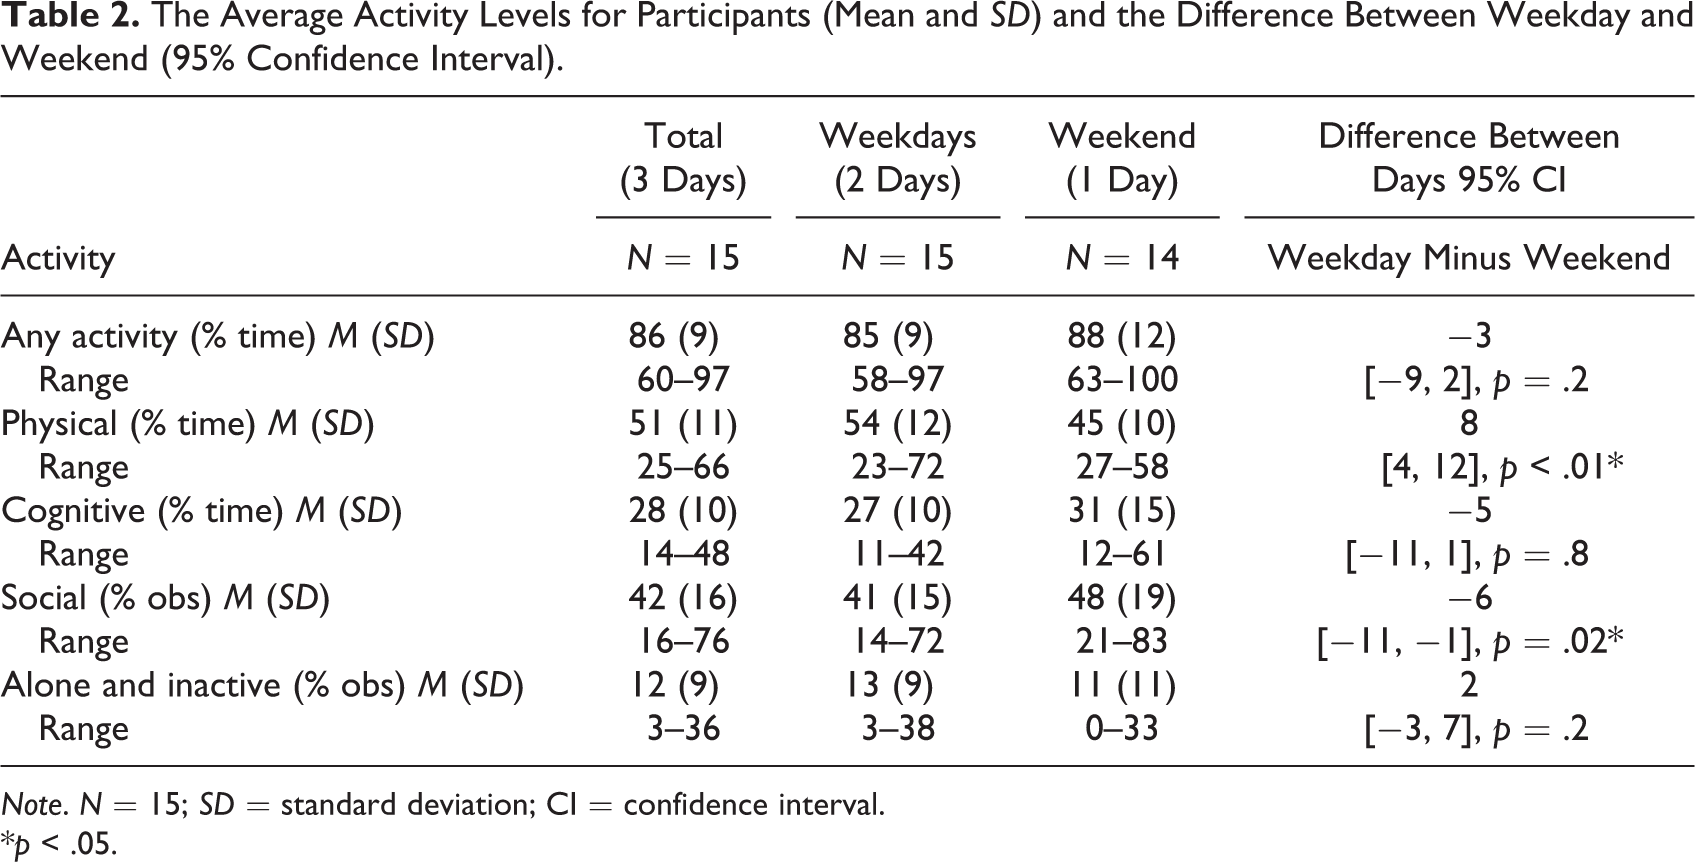
Note. N = 15; SD = standard deviation; CI = confidence interval.
*p < .05.
There were no significant differences found between the 2015 and 2016 observation periods. Participants observed in 2016 were similar to those observed in 2015 in terms of the proportion of observations where an activity was being completed (8% absolute increase, CI [−1, 18], p = .07) and when alone and inactive (8% absolute decrease, CI [−17, 1], p = .08).
People Present
Participants were alone for 48% (SD = 16) of the day, while other patients were present 24% (SD = 9) of the day (see Table 3). Although there were fewer visitors (MD = −7% absolute, CI [−14, 0], p = .04) and other patients (MD = −3% absolute, CI [−7, 2], p = .2) present on weekdays compared to the weekend, this difference was not significant. There were 6% (CI [1, 11], p = .02) fewer interactions with therapists on the weekend compared to weekdays. There were no significant differences found between the 2015 and 2016 observation periods, with all observed differences being less than 5%.
The People Present During the Participant’s Day (Mean and SD) and the Difference Between Weekday and Weekend (95% Confidence Interval).
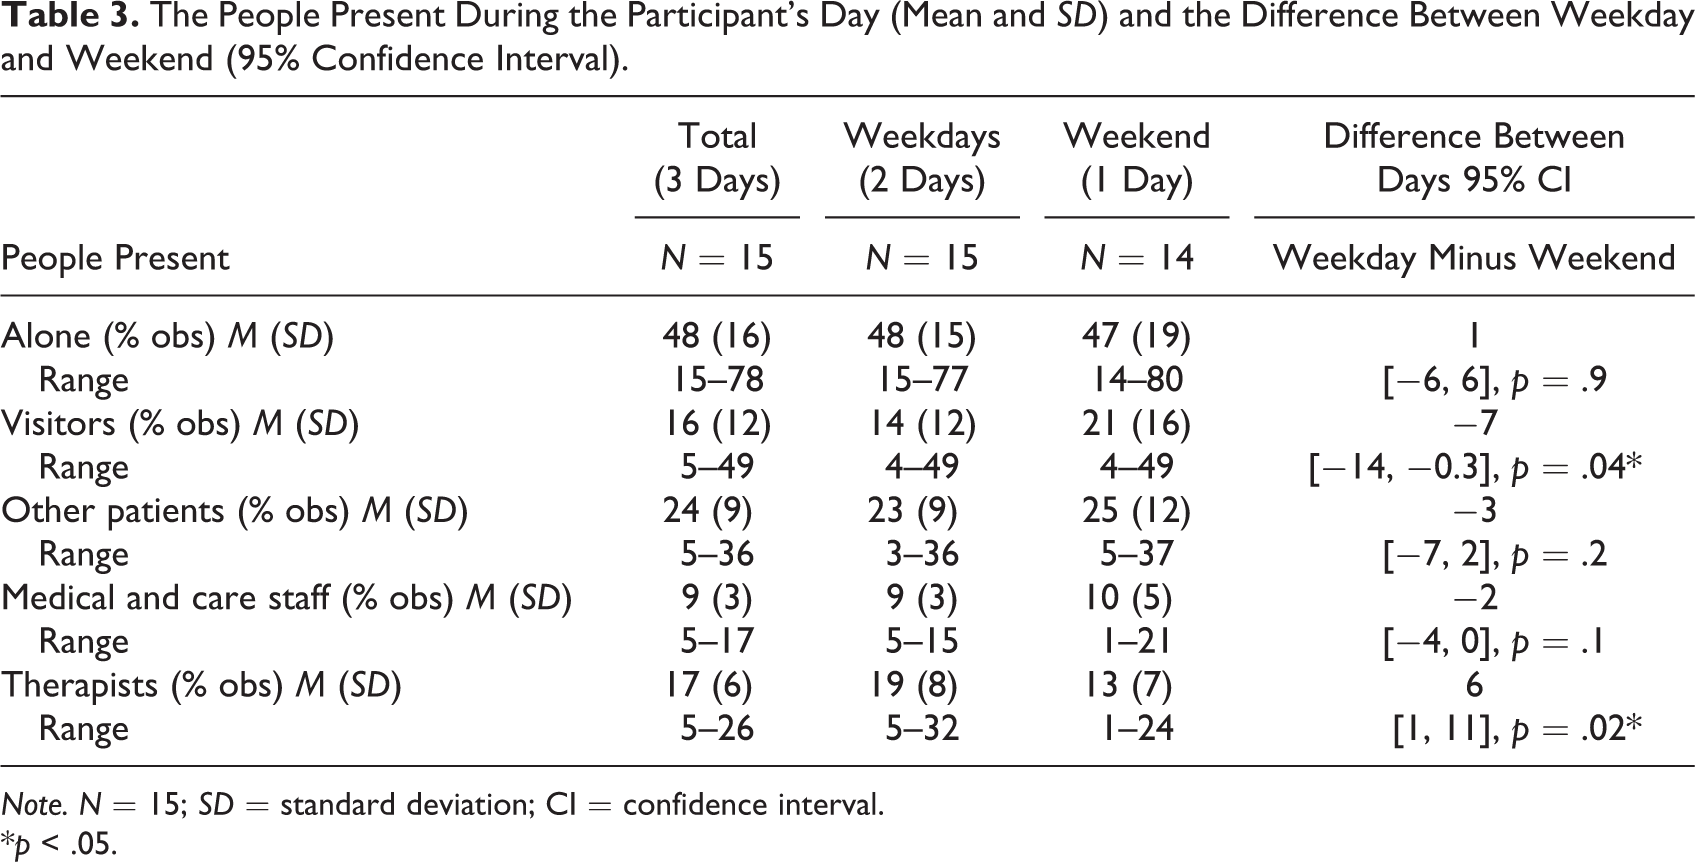
Note. N = 15; SD = standard deviation; CI = confidence interval.
*p < .05.
Location
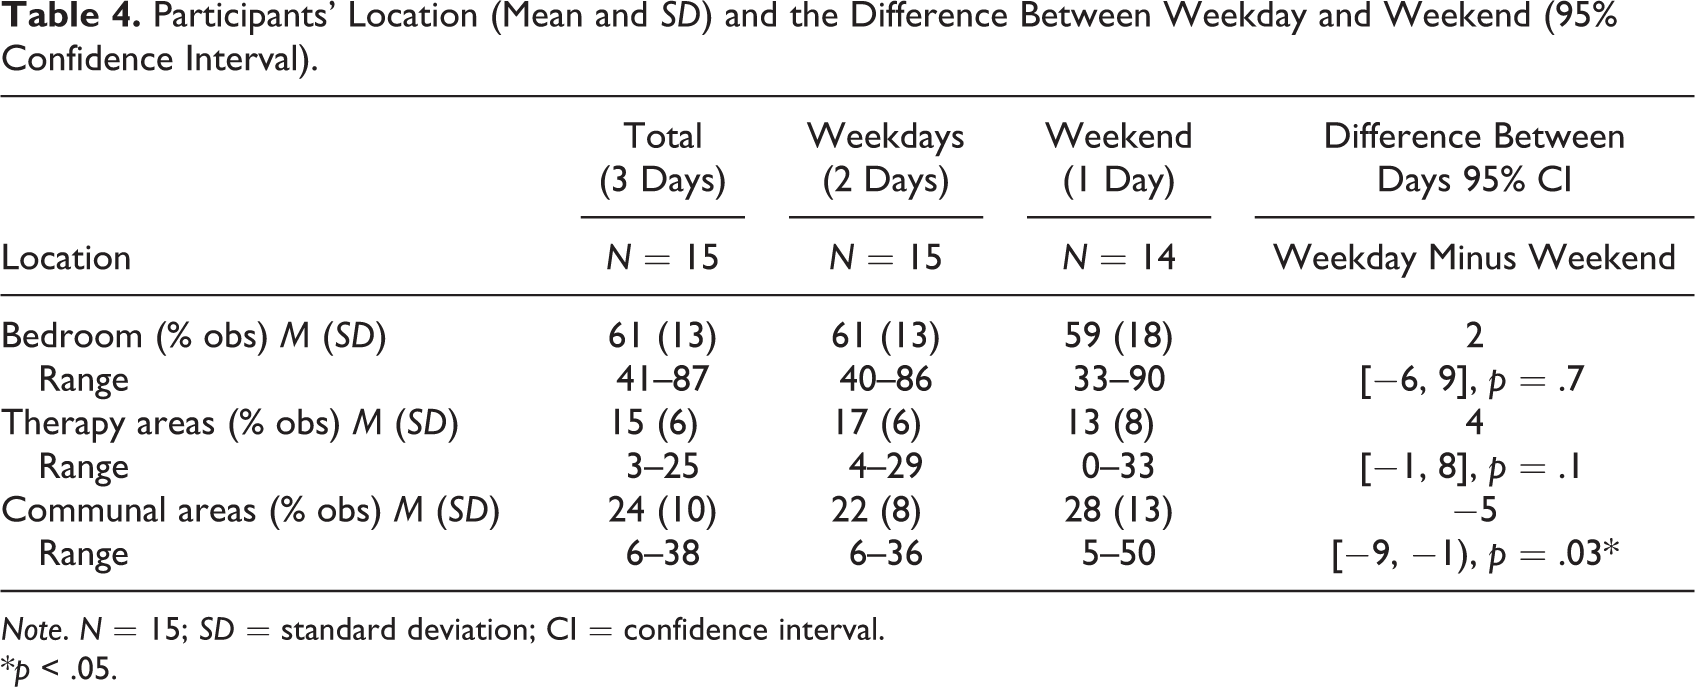
Participants spent 61% of the day in their bedroom, 15% in therapy areas, and 24% in communal areas (see Table 4). Participants spent a small but statistically significantly higher proportion of observations in communal areas (MD = −5% absolute, CI [−9, −1], p = .03) on the weekend compared to weekdays. They also spent slightly less time in therapy areas (MD = 4% absolute, CI [−1, 8], p = .1); however, this finding was not significant. There were no significant differences found between the 2015 and 2016 observation periods.
Participants’ Location (Mean and SD) and the Difference Between Weekday and Weekend (95% Confidence Interval).
Note. N = 15; SD = standard deviation; CI = confidence interval.
*p < .05.
Position
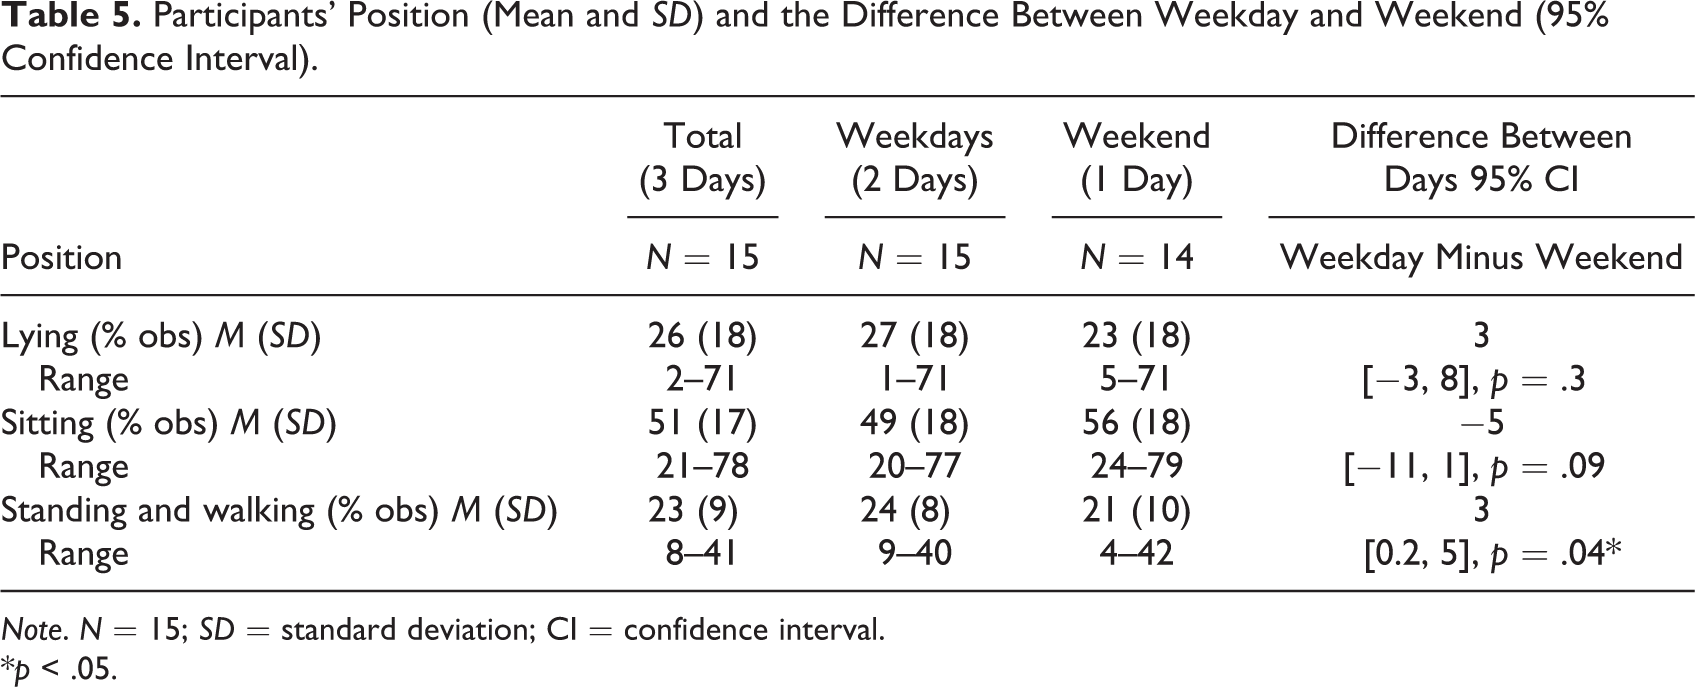
Participants spent 26% (SD = 18) of the day lying, 51% (SD = 17) sitting, and 23% (SD = 9) standing or walking (see Table 5). Participants exhibited lower proportions of observations in lying (MD = −3% absolute, CI [−8, 3], p = .3) and more in sitting (MD = 5% absolute, CI [−1, 11], p = .1) on the weekends compared to weekdays; however, these were not significant findings. When analyzing the proportion of observations spent standing or walking, there was a 3% (CI [0, 5], p = .04) absolute difference between the weekday observations and the weekend. Participants in 2016 spent significantly more observations sitting (19%, CI [2, 36], p = .03) than participants in 2015; however, no significant difference was exhibited in observations spent either lying down (14%, CI [−4, 33], p = .1) or standing or walking (5%, CI [−5, 14], p = .3) across the two time points.
Participants’ Position (Mean and SD) and the Difference Between Weekday and Weekend (95% Confidence Interval).
Note. N = 15; SD = standard deviation; CI = confidence interval.
*p < .05.
Discussion
In this study, participants were found to be engaged in activity for 86% (SD = 9) of the day, including physical activity for 51% (SD = 11), cognitive activity for 28% (SD = 10), and social activity for 42% (SD = 16) of the day. Furthermore, participants were found to have spent 14% (SD = 9%) of the day inactive and were alone for 48% (SD = 16%) of the day.
Current literature in rehabilitation demonstrates disparity in reported activity levels throughout the day (Janssen et al., 2014a; Mackey, Ada, Heard, & Adams, 1996; Patterson et al., 2005). For example, Janssen et al (2014a) utilized a behavior mapping technique in stroke rehabilitation to determine activity levels over a 12-hr day (3 weeks poststroke) and reported engagement in any type of activity for only 49% of the day. While a recent study by Blennerhassett, Borschmann, Lipson-Smith, and Bernhardt (2018) also reported large portions of an individual in rehabilitation’s day were spent inactive and alone when they conducted behavior mapping in a mixed-rehabilitation facility. Difficulties obviously arise in the comparison of findings between studies as there are substantial differences in setting, population, and methodological approaches exists. However, Blennerhassett and colleagues did suggest that design features of the built environment may impact on behavior and levels of activity; however, causality cannot be inferred given the observational methods utilized in these studies.
Most previous literature indicates that individuals who are able to undergo intensive therapy have performed physical activity for an average of 20% of the day (Davenport et al., 2015; Janssen et al., 2014a). The participants in this study were physically active for double that amount of time. This was particularly evident on weekdays where physical activity levels observed were significantly higher (54%, SD = 12) compared to the weekend (45%, SD = 10). This could be related to a greater emphasis on physical activity during the week, with increased staff numbers and more exercise programs offered to facilitate activity.
Social activities were significantly higher on the weekend (48%, SD = 19) than during the week (41%, SD = 15). Due to the greater emphasis on engagement in rehabilitation activities (which involve physical activity) during the week, it is possible that visitors may have attended with more frequency over the weekend; this may also be reflective of the weekend generally being a period of the week when visitors are more freely available to visit. However, the provision of weekend group therapy may have potentially improved engagement and increases the amount of socialization between individuals.
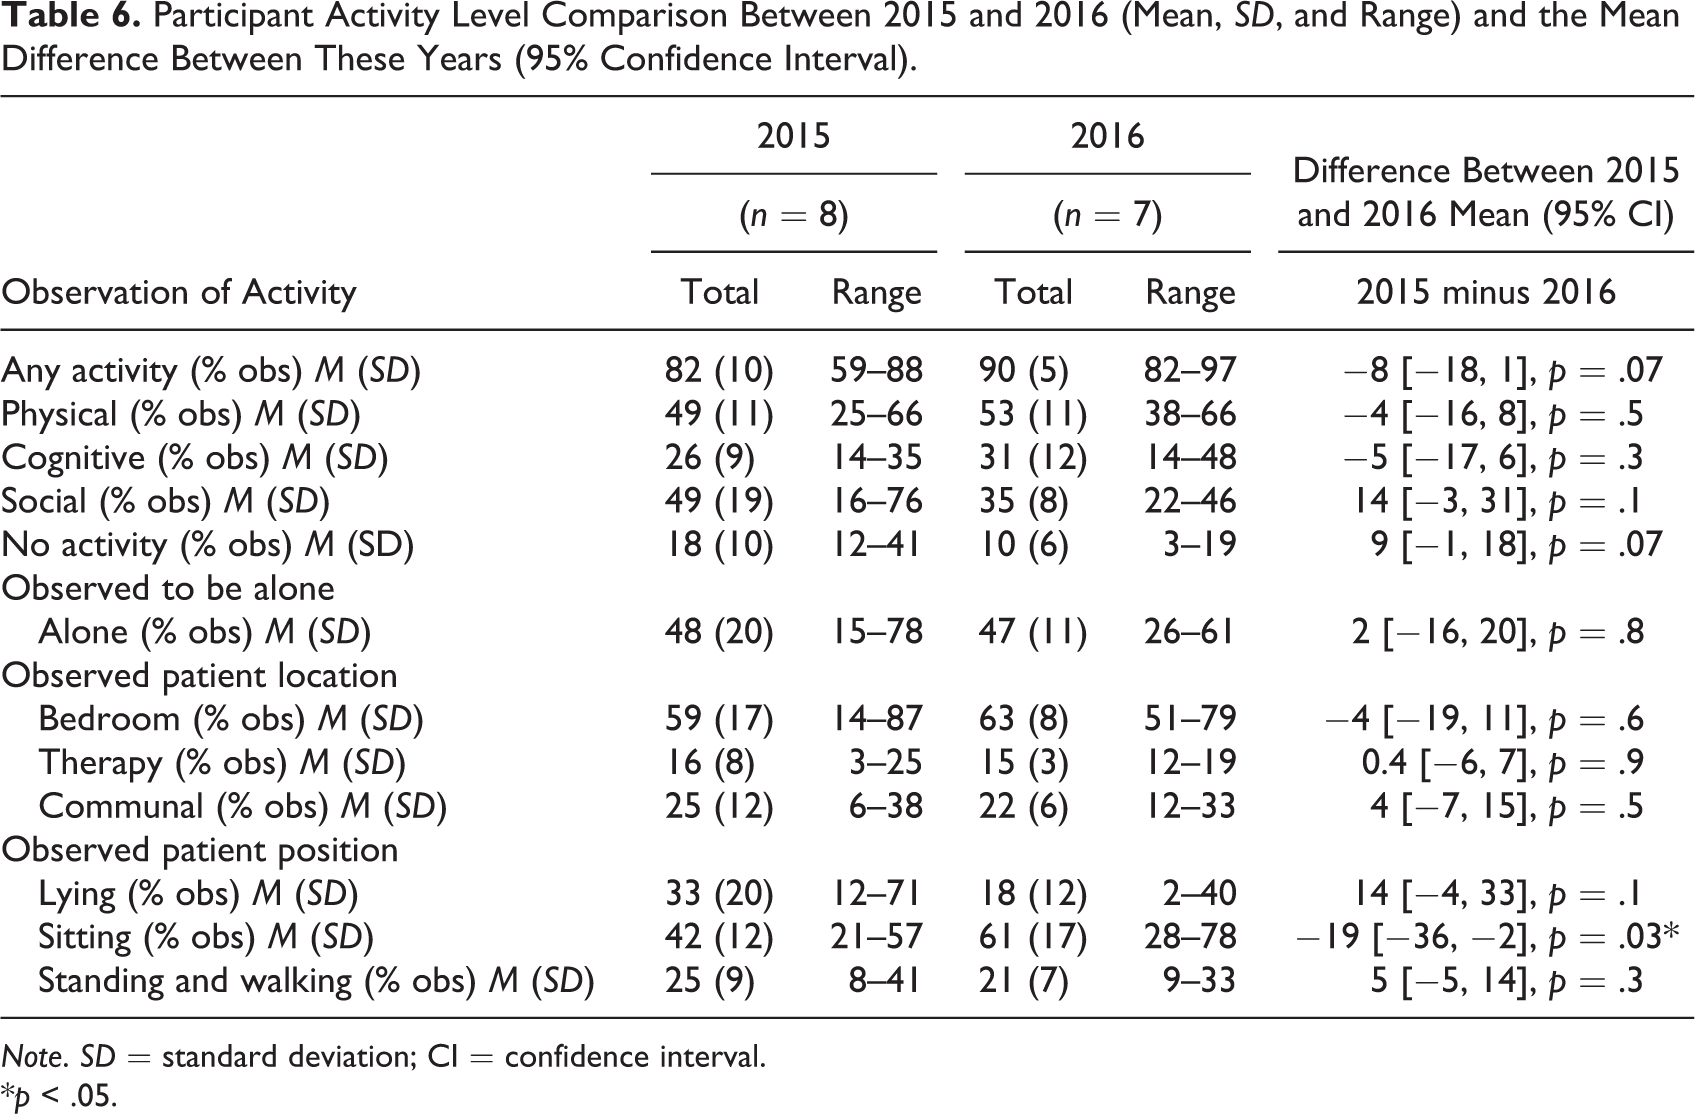
The importance of the environmental context in which the behavior is occurring, and the interaction between the environment and the individual, has been long recognized for years as being crucial to a behavioral outcome (Cassidy, 2013). The purpose of conducting this research over two time points was to provide an indication of the long-term sustainability of activity levels for this population following facility and program redesign. High levels of activity were maintained over the 12-month period in this study (Table 6); however, it cannot be concluded that this was a result of the environmental redesign. It is, however, a positive finding for Royal Rehab Private Hospital to report such high levels of activity within a new facility over two distinct time points, 1 year apart.
Participant Activity Level Comparison Between 2015 and 2016 (Mean, SD, and Range) and the Mean Difference Between These Years (95% Confidence Interval).
Note. SD = standard deviation; CI = confidence interval.
*p < .05.
The implementation of an enriched environment as well as the addition of weekend therapy and evidence-based care has potentially increased opportunities for physical, cognitive, and social activity. Royal Rehab Private Hospital have successfully included a wide range of therapist and student-led group activities and classes that offer more opportunities to increase activity performed and decreased the amount of time patients spend alone and inactive. The addition of communal eating areas, engagement of family and friends within the rehabilitation journey, and presence of volunteers may account for the levels of activity recorded at this facility.
Study Limitations
While findings are in this study are interesting, limitations must be acknowledged. The participants in this project were excluded if they had language or cognitive impairments, so the sample is potentially biased and may not be reflective of a larger sample, as those with a language or cognitive impairment may face additional barriers to being more active and/or social than the participants within this study. Also, our definition of activity was divided into physical, social, and cognitive activity and was not limited to prescribed therapeutic activities. In doing this, we have aligned our work substantially with Janssen and colleagues (2014a, 2014b), which encompasses a broader scope of activities and reflects the holistic nature of rehabilitation. However, one difference to the work of Janssen and colleagues (2014a, 2014b) was the inclusion of watching television and using technology as cognitive activities, which could potentially account for the differences in the amounts of this type of activity between that study and this current one.
Additionally, the process of behavior mapping has a few potential limitations. Although observers were instructed to be as inconspicuous as possible, their presence may have influenced both participant and staff behavior. Also, observations were recorded at 10-min intervals; therefore, it cannot be assumed that the same levels of activity were achieved for the remaining 9 min—hence, the values reported should only be considered an estimate. Furthermore, it should be noted that this study occurred in a single rehabilitation setting, and consequently, the external validity of this study may be limited. Lastly, given the observational nature of this study, we cannot clarify whether the built environment and therapy redesign had a direct impact on the high levels of activity that have been reported.
Recommendations for Further Research
Future research could aim to establish clarity regarding the specific impact of the environment on activity levels observed in rehabilitation hospitals with differing environmental designs (both structural and clinically implicated). Although high levels of activity were observed, we cannot draw conclusion whether the built environment (i.e., walking tracks, communal therapy and meal areas, outdoor sporting facilities, shared therapist offices, etc.) or changes to clinician practice (i.e., weekend services, breakfast exercise group, individualized calendar/scheduling of activities, etc.) were contributing to these levels. Additionally, qualitative research involving all key stakeholders (architects, clinicians, individuals undertaking rehabilitation, and their families) querying the barriers and enablers to activity within a facility may provide contextual appreciation of results obtained from behavior mapping.
Conclusions
Royal Rehab Private Hospital has provided an enriched environment with the aim to facilitate physical, social, and cognitive activity to individuals within inpatient rehabilitation. The facility hosts open-planned communal environments, coupled with evidence-based multidisciplinary practices and person-centered care over a 7-day week. The results indicate that high levels of activity were achieved in this facility, with proportion of the day spent alone and inactive observed to be less than 15%.
Implications for Practice
When designing new facilities consideration must be given as to how the built environment can enhance activity levels within rehabilitation. Individuals in rehabilitation can decrease time alone and inactive to less than 15% of the day. This is likely due to the built environment and implementation of evidence-based strategies. Activity levels observed in this study were maintained over a two-year period. This suggests behaviour change was successful and supported by the built environment.
Footnotes
Authors’ Note
The Northern Sydney Local Health District, Human Research Ethics Committees approved the study (HREC reference: HREC/14/HAWKE/357). Site-specific ethics was obtained from Royal Rehab (14SSA09) and external approval from the ethics secretariat at Macquarie University. All participants provided written informed consent before data collection commenced.
Acknowledgments
The authors would like to thank the physiotherapy department of Royal Rehab for their contributions to this research.
Declaration of Conflicting Interests
The authors declared no potential conflicts of interest with respect to the research, authorship, and/or publication of this article.
Funding
The authors received no financial support for the research, authorship, and/or publication of this article.