



Abstract


I am an advocate for evidence-based design (EBD) financial evaluations. Earlier in my career, I was challenged by decision makers about how much design contributed to the bottom line. I knew design mattered, but I had no way to quantify the results. It became my professional goal to figure out how to answer the question “What is the contribution of design to return on investment?”
Buildings and the Bottom Line
My first business case (BC) project considered how choices for brand-focused design features might influence perceptions and ultimately purchase decisions. My first paper, “High Profile Architecture Considering the Bottom Line,” was written for Design Intelligence (Taylor, 2004). Interestingly, at that same time, many of the luminaries in healthcare design published a now seminal paper that reimagined how we think about designing for outcomes by creating the Fable Hospital (Berry et al., 2004). The authors described healthcare as an inseparable service—one in which facility design “tells a story about the service that the service cannot entirely tell by itself” (Berry et al., 2004, p. 5). They used the Fable Hospital as an idealized template to convey a story with a moral. In this fabled world, leadership had visionary goals that were addressed by the design team with a series of design strategies that, through the Center for Health Design’s Pebble Program, had been shown to improve results in the areas of quality, safety, and sustainability. The CEO of Fable Hospital was surprised to see that, even with conservative estimates, the increased costs for design innovation were very quickly offset by the outcomes, with a simple payback period of less than 1 year. The EBD BC or economic evaluation can assist teams in making decisions or quantifying results through a financial lens.
The EBD BC Today
Fast forward two decades, and based on the paucity of published studies, it is clear that creating the BC is still a challenge. Some of this is a result of our thought process. A traditional accounting approach for capital expenditures includes an underlying premise that the project is being built for a purpose. Once that explicit cash flow for the purchase has been expended, it will not be recovered; the expenditure is therefore a “sunk cost” and should not be taken into account for future planning purposes (other than asset depreciation). When choosing projects to fund, organizations have the potential to realize (or miss) benefits when selecting one option over another. This is an opportunity cost, and estimating potential returns for competing options can be difficult as the calculations are often intangible and subjective in nature. In healthcare, these benefits can be realized in the form of potential increased revenue as well as cost avoidance (e.g., reducing adverse events). We have a different kind of opportunity. Rather than the project being a sunk cost, the project can be considered an investment, as the beneficial outcomes have the potential to occur over the life cycle of the building.
Start With the Right Questions
As architects and designers, we are trained to find solutions. I often get questions about the latest evidence for a project type or design feature—cancer centers, Neonatal Intensive Care Units (NICUs), lighting, and so on. In EBD, asking about the project type or feature is most relevant when the team is trying to establish what outcomes should be considered. For example, if a team wants to consider sound masking or better lighting, the underlying question should surround the intended outcomes, which will help define the solution to be specified. Is the goal better sleep for patients? Reduced medication errors? Improved Hospital Consumer Assessment of Healthcare Providers and Systems (HCAHPS) scores? All of the above? When considering solutions and outcomes, some combinations may be easier to evaluate than others.
Some design strategies will have a direct effect on operational costs, for example, a change to LED lighting can reduce energy use resulting in a financial outcome of reduced utility costs (Figure 1).

Design choices can have a direct financial impact.
Other design interventions result in mediating variables that influence financial outcomes. Sound masking and dynamic light may be intended to reduce noise and improve light exposure to regulate circadian rhythm. Such mediating outcomes can result in improved sleep. However, reduced noise or improved lighting is not the economic outcome, nor is sleep quality. While noise levels and sleep quality are often reported outcome measures in research, they underlie other health- or healthcare-related outcomes—the outcomes that can be quantified financially. There is no economic value of a poor night of sleep in the hospital, per se, but there may be a measurable change in length of stay, sleep medications, or falls that can be tied to a cost. Similarly, reduced noise may result in fewer distractions which then results in a measurable financial outcome of a medication error (Figure 2).
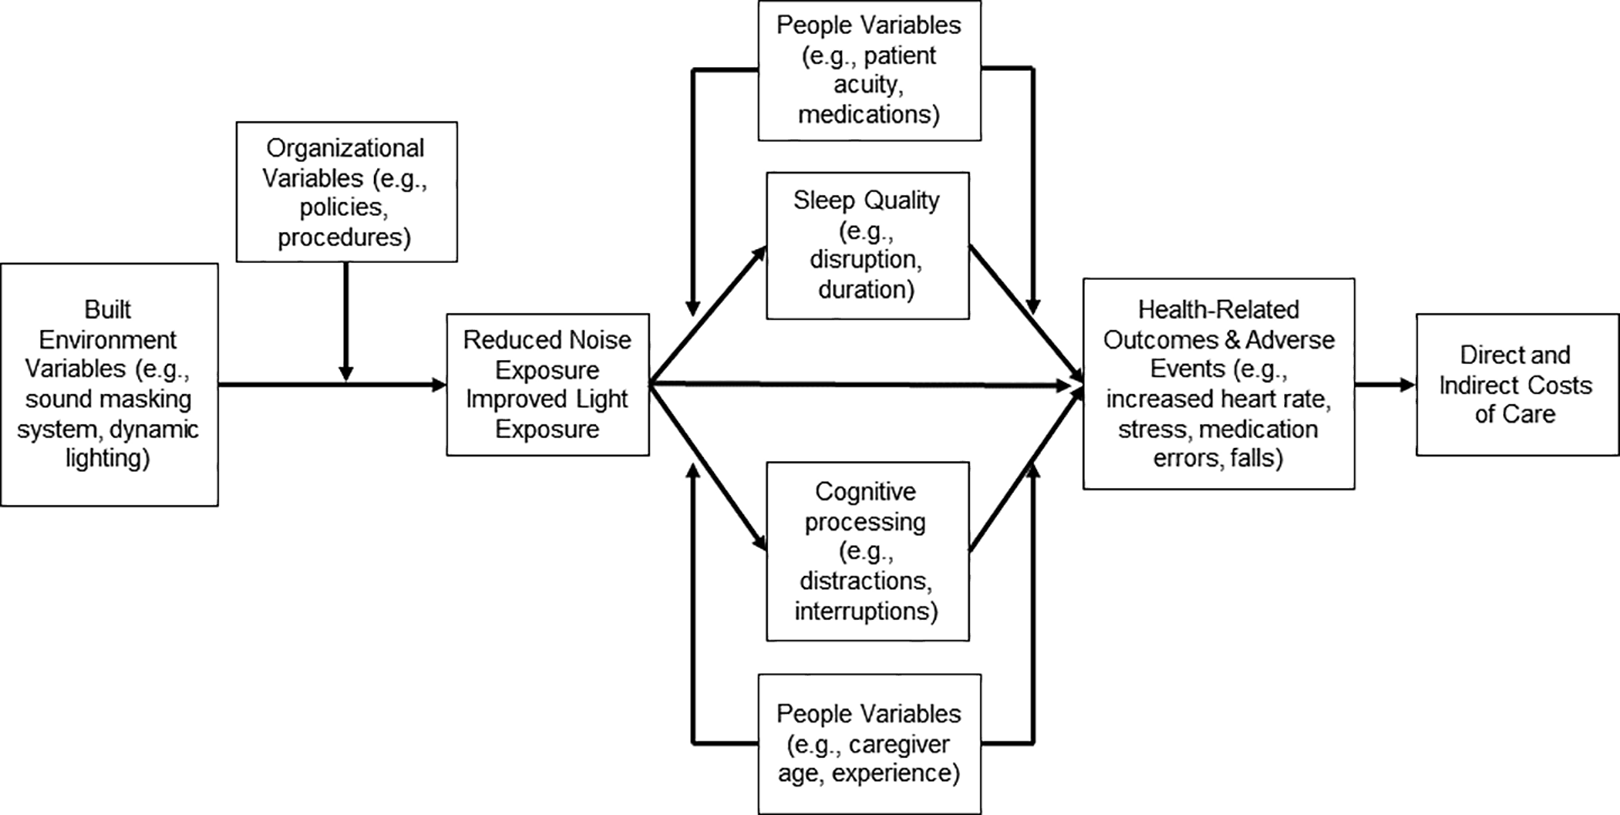
Mediating variables lead to the financial impact of design choices.
In the case of some direct costs, most teams will regularly conduct a benefit–cost analysis (e.g., material selections, energy-reduction solutions, equipment). However, there is no “easy way” for design teams and owners to quantify other types of decisions that indirectly influence financial outcomes (e.g., the role of design decisions on patient falls). Further, attributing an effect estimate from design involves uncertainty and risk, and teams may be reluctant to estimate the cost avoidance of adverse events associated with design. There is always a challenge in measuring something that did not happen. Additionally, the costs may be hard to find (or may not exist). Further, there is rarely a one-to-one relationship between design and outcomes. For example, falls may be influenced by lighting, flooring materials, bathroom location, and visibility, but they are also influenced by patient acuity and health (intrinsic conditions), as well as organizational policies and procedures. Creating the BC requires transparency on the assumptions and a clear understanding that the built environment, by itself, is not the silver bullet.
Levels of the BC
While many published studies may be too daunting as a starting point for the “typical” team to undertake, it is still important to have a grounding in the options. I usually frame the options as course numbers in academia: introductory (100-level) through graduate (600-level) and doctoral (800-level) approaches. Transparency of assumptions (cost avoidance, revenue, incident rates, effect) is essential in any BC evaluation as the estimates will be subjective in most cases.
BC101: Simple Payback
I liken the BC101 to published examples that provide evidence for a hypothetical simple payback period as presented in the 2004 BC by Berry et al. Since 2004, there are at least two examples that have used the Fable framework. The first was the updated Fable Hospital 2.0 (Sadler et al., 2011) and the other focused on the single-family room NICU (Shepley et al., 2014). In these examples, the incremental costs of construction are presented, along with the hypothesized outcomes and associated cost avoidance (e.g., length of stay calculated at $2,500/day). In many instances, financial estimates are used based on the available literature. In Fable Hospital 2.0, Sadler et al. (2011) present a simple payback period of just under 3 years. With respect to the single-family NICU, the authors suggest a simple payback period of just over 1 year, although nonquantifiable benefits that might further improve the ROI were not considered. Shepley at al. (2014) conclude that financial barriers are not a reason to preclude single-family room NICUs.
Another way of creating a BC is the economic evaluation of performance. In a study by Stamy at al. (2021), the authors evaluate pre- and postoccupancy clinical outcomes (e.g., left without being seen/against medical advice, transfers, length of stay). Using financial indicators for the various incremental operating costs and clinical outcomes, alongside the identified capital costs, the authors use sensitivity analysis to estimate a range of financial impacts on revenue for the organization. Although the published analysis was only conducted for 1 year of data, the transparency in calculations allows for the ability to calculate other time frames.
BC201: Time Value of Money
A key component missing from the simple payback examples is accounting for the time value of money, or discounting. In most financial models, discounted cash flows or net present values (NPVs) are used, as a dollar in future time is worth less than a dollar today. This is due to both inflation and the potential loss of revenue that might result from choosing a different option, often referred to as the opportunity cost. Organizations evaluating options for investment and expenditure need to consider the best use of limited resources, and the discount rate (e.g., 5.5%) usually reflects the weighted average cost of capital, the minimum acceptable rate of return, or the cost of debt. There is uncertainty in choosing discount rates, and the present value is influenced not only by the chosen discount rate but the estimated magnitude of outcomes and the anticipated time horizon used to evaluate the project. Discounting might be considered a 200-level course.
NPV has been used in multiple studies, and it is used in conjunction with other financial evaluation methods such as life-cycle cost analysis or cost-benefit analysis. For example, in one study, the authors conducted a life-cycle cost analysis of flooring over time to illustrate that the lowest initial cost (i.e., first cost) does not always represent the lowest cost over the life cycle of the building (Harris & Fitzgerald, 2015). The authors selected a discount rate that reflected the prime interest rate plus 1%, and a 50-year horizon was selected as an estimated life of the building. Life-cycle costs included maintenance, equipment, and replacement costs but did not include the potential impacts on safety outcomes. In another example, the authors used a cost-benefit analysis to evaluate artwork in hospitals (Mozayeni et al., 2020). Based on the literature, the authors estimated that improved mood resulted in shorter hospital stay. With an estimated effect size, they used hospitalization stay data from the American Hospital Directory to calculate the present value of net benefit at specific institutions using a 4% discount rate (2% real interest, 2% target inflation). The results indicated a positive financial benefit of installing mood-lifting paintings based on a conservative reduction in the length of stay alone. (There may be other benefits to staff that are not calculated.)
BC301: Estimating Outcome Costs Through Organizational Data
Some organizations have used advanced techniques to determine the cost of adverse events within their own organization. For example, an oft-cited study established an additional US$13.3K–US$14.4K in direct costs and 6.3–7.3 extra days in the hospital due to a fall (Wong et al., 2011). More recently, a case-control study found that the average cost of a fall was US$64,526, with US$36,776 in direct costs (Dykes et al., 2023). These organization-specific numbers could be used for an evaluation of choices or programs within their own organization (as Dykes et al. used to calculate the benefit of a falls prevention program), but such published outcome values can be used as a point of departure for any other organization creating a BC. Calculating the cost of specific outcomes within an organization comes with a complex set of indicators and limitations, so we might call this a 300-level course. Establishing the financial data is one part of creating the BC.
BC601: Probabilistic Calculations
Using a fixed set of assumptions (e.g., life cycle, discount rate, outcome cost) is deterministic in nature—you use the data you have to determine a single estimated financial outcome. While a fixed number, you can advance the results by creating a range—a high number and low number. Teams can also conduct a sensitivity analysis to establish which parameters influence the most change. A more advanced proposition is creating a probabilistic assessment. With probabilistic assessments, what I would consider a 600-level course, thousands of iterations are calculated using analytic processes such as Monte Carlo simulations. Probabilistic techniques have been used in at least two examples of healthcare design (Sadatsafavi et al., 2015, 2019), one using data from the Shepley et al. (2014) study and the other based on a published case study of an Intensive Care Unit (ICU). An outside expert is most likely required to establish the model parameters for the simulations, but it can be a rewarding exercise to more clearly establish the range and likelihood of possible outcomes.
BC801: Creating Societal Value
The most advanced design-based evaluations to date incorporate methods used in clinical evaluations to establish the social value of the design intervention. One such study conducted a cost-utility analysis with an incremental cost effectiveness ratio (ICER). The ICER method is traditionally used to evaluate treatment options, and such studies take the position that interventions not only have a short-term immediate effect on disease treatment but a long-term impact on the quality of adjusted life years. In a design-related study, the authors used decision trees to calculate the financial benefits of a resilient floor taking into account the nature of hospital falls and the cost of care following discharge (Latimer et al., 2013). As the data were generated from a pilot study to determine the appropriate sample size to evaluate an intervention, the authors do not make a definitive statement about the results but offer the results as a method to more fully evaluate the benefits of a design-based (versus pharmacology-based) intervention. Aligning methods used to create an EBD BC to the methods accepted in the clinical world has value, but the calculations, just like in medicine, come with challenges relative to the availability of data and the complexity of analysis. I classify this as a doctoral-level approach.
The EBD Financial Cases of the Future
There are a range of ways to approach the EBD case, and as EBD continues to evolve, we should advance the use of the financial outcomes to better close the loop on the value of design. Creating the financial case is not easy and requires many members of the interdisciplinary design team—architects and designers, clinicians, administrators, contractors, and others who provide expertise in analysis and modeling. Evidence-based medicine is also evolving, and as stated in a recent paper, “economic evidence is required at all levels of healthcare policy to support decision-making around interventions in healthcare” (Bulamu et al., 2024, p. 1). We can aspire to the same with an aim to express the value of design through bottom-line dollars.
