
Abstract
A study of the online browsing and purchasing habits of some 1,400 outbound travelers in Hong Kong demonstrates the analytical power of weight-of-evidence (WOE) data mining. The WOE approach allows analysts to identify and transform the variables with the most predictive power regarding the likelihood of tourists’ online preferences and decisions. The study found that just over one-third of the respondents browsed hotel-related websites, and about half of those browsers had booked a room on those sites. Browsers in Hong Kong tended to be young, well educated, and well traveled. Those who used the hotel websites for purchases were, of course, part of the browser group, and were likewise relatively well educated. However, one unexpected variable set off those who used the websites for a hotel purchase, the length of their most recent trip. One possible reason is that long-haul tourists want to be sure of their accommodations, or this may reflect hotels’ free-night offers. The convenient use of model-based customer segmentation and decision rules would help hospitality practitioners effectively manage their marketing resources and activities, and enhance information-based marketing strategies to attract target customers.
As hotel websites have become an increasingly important channel for information dissemination and online bookings, researchers have been attempting to analyze the behavior of potential customers and to determine who uses these websites. In that regard, the tourism and hospitality literature contains numerous studies that examined the key determinants of customer behavior, including information searching and buying behavior on travel or hotel websites (Grønflaten 2009; W. G. Kim and Kim 2004; Law and Hsu 2006). These studies were mostly conducted using traditional statistical methods, such as t-tests, chi-square tests, and logistic regression. However, we have found little research in the tourism and hospitality literature that uses the weight-of-evidence (WOE) approach to analyze the variables related to online behavior analysis. As we explain in more detail below, the WOE methodology groups variables according to the likelihood of their occurrence, as part of a logistic regression analysis. The analysis also estimates the predictive power of a given variable, also based on its occurrence. Using the WOE approach for tourism and hospitality data analysis, this study suggests information criteria that transform and adjust the grouping of survey variables for improving overall prediction accuracy. An analytical framework for the predictive modeling process is presented based on a tourism survey. Our focus is the essential research topic of identifying those who browse and purchase from hotel websites. We start by reviewing research on the factors that influence online search and purchase. We will explain the WOE grouping (WOEG) models and the derived online behavior analytical framework, and present the modeling results for a recently conducted tourism survey aimed at predicting the characteristics of browsers and purchasers from hotel websites. Based on our data, we offer managerial implications for hospitality practitioners, intelligent information system considerations, and marketing applications.
Factors Affecting Travelers’ Online Behavior
Research in online travel and hotel information research and buying behavior analysis continues to evolve, along with the internet and its applications (Wen 2009). Studies have examined numerous factors that have significant impacts on travel and hotel searching and buying decisions, most notably consumer demographic information, such as age (Grønflaten 2009; W. G. Kim and Kim 2004), education level (W. G. Kim and Kim 2004; Wong and Law 2005), and income level (Law and Hsu 2006; Wong and Law 2005), as well as a consumer’s online usage patterns or internet experience (Morosan and Jeong 2008; Toh, DeKay, and Raven 2011). Factors relating to travel purposes and planning or travel style preferences also have an impact on online purchase (Grønflaten 2009; Toh, DeKay, and Raven 2011).
Despite these numerous studies that have examined and verified the effectiveness of these factors in explaining consumers’ online behavior or preferences (e.g., online hotel room purchase) in different markets worldwide, we have seen little research that focuses on using novel and practical quantitative modeling techniques that can combine the joint effects of these factors to predict the likelihood of a customer’s being a hotel website browser or purchaser, nor do we see studies that can perform customer segmentation with good interpretation. Therefore, the motivation of this research is to enrich the hospitality literature with an analytical model for discovering hotel websites’ potential users and online buyers.
Existing Research Methods
This section presents an overview of some commonly used statistical techniques for analyzing the factors that can influence website behavior from hospitality and tourism surveys.
The chi-square statistic is used to investigate whether distributions of categorical variables differ from each other. For instance, W. G. Kim and Kim (2004) used chi-square tests to identify the significant factors influencing hotel website users’ intentions to purchase, namely, age, education, browsing preference, and years of internet use.
In the hospitality and tourism literature, t-tests are also widely used to judge whether the means of two groups are statistically different from each other. For example, Law and Hsu (2006) used t-tests to identify the important dimensions and attributes that differentiate purchasers and nonpurchasers on hotel websites.
Logistic regression is one of the most popular predictive models in hospitality and tourism surveys that is used to predict a binomial target variable’s outcome (e.g., purchase or does not purchase) and the associated probability of a decision based on a set of numerical or categorical input variables (Grønflaten 2009; Vina and Ford 2001). For example, Grønflaten (2009) used chi-square tests to select variables and then used those variables to build logistic regression models to predict a traveler’s choice of information sources (in this case, travel agents vs. service providers) and channels (i.e., face to face vs. the internet).
Another type of predictive model is the multilayer perception neural network (MLPNN; Cybenko 1989), which maps sets of input data onto certain output variables. As MLPNNs have a sophisticated multilayer structure and embedded nonlinear activation functions, they are widely used for prediction, and in particular for distinguishing data that are not linearly separable. In the context of hospitality and tourism studies, J. Kim, Wei, and Ruys (2003) used neural networks to determine which survey variables made significant contributions to the decisions of senior travelers. A major drawback is that the modeling process and results of neural networks are usually difficult to interpret.
The Basic Model of WOEG
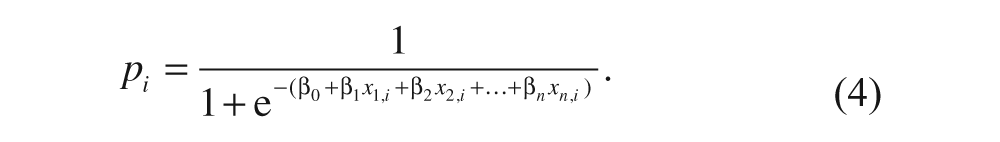
As we said above, we demonstrate the use of a WOEG approach in this study. This is an information-criterion-based logistic regression model intended to establish the relationship between a target variable and consumer demographic and behavioral data. A logistic regression model is a generalized linear model used for binomial regression (Amemiya 1985), which has the following general form:
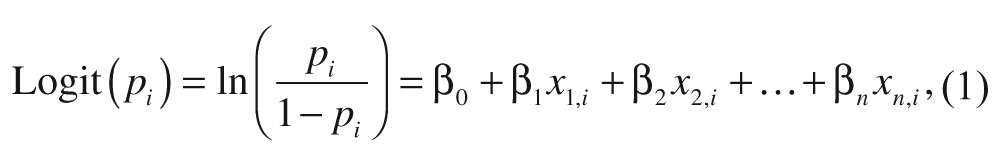
where pi is the probability of a binary event occurring, β0 is an intercept of the logistic regression equation, β j are the coefficients of the logistic regression equation, and x j are input variables (j = 1, …, n).
The innovation here is that instead of using the original variables in the regression directly, they are first grouped to achieve the correct data transformation, as we explain next. The information measures of the regrouped variables are used as input variables for the regression analysis. The purpose of grouping variables is to provide the most informative connections between the predictive variables and the target variable.
Statistical Measures for Variable Grouping and Selection
WOE analysis is used widely in scientific and social science research (Weed 2005), although it is seldom used in tourism research. It measures the difference in the proportion of events and nonevents for an attribute (Good 1950). For instance, “age” is a variable and “age > 18” is an attribute. An event stands for something that has already happened, such as a user browses a hotel website, and a nonevent represents the opposite. WOE is computed by the following:
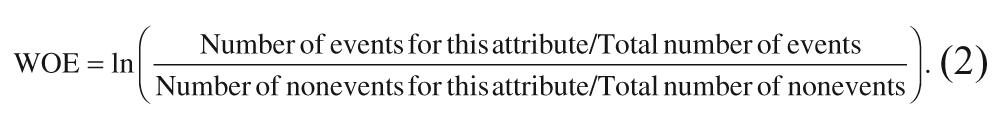
So in this simple example, we would compare the number of browser hits for those above eighteen, divided by total browser hits, to the number of people above eighteen who did not browse, again divided by the total browser hits. In general, a higher WOE indicates a stronger tendency of events occurring for an attribute.
Information value (IV) is another statistical measure used to select variables. It is the weighted sum of the WOE of a variable’s attributes (Good and Osteyee 1974), which is the difference between the proportion of events and nonevents. The IV is calculated as follows:
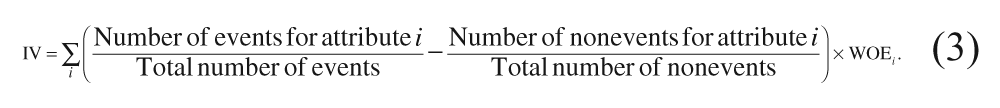
Usually, a larger IV value indicates that a variable has greater predictive power and a variable with IV < 0.1 is considered to have no predictive power.
To select the predictors for the logistic regression, we apply sophisticated statistical and data mining algorithms to select the most predictive variables. The regression then provides results of the prediction tasks. The statistical modeling procedures of the proposed WOEG models are exhibited in the appendix.
There are several advantages of using WOE and IV. First, nonlinear data transformation through WOE grouping largely increases the flexibility with which a model can deal with complicated data patterns. Second, IV variable selection filters out variables without predictive power and only includes informative variables in the model. Third, there is no restriction on the category of input variable type (numerical or categorical), and thus the scale (or unit) of a variable does not affect the modeling results. Finally, samples with missing data and outliers can be included in the predictive models. These features are the merits of WOEG in tourism behavior modeling and prediction.
The WOEG Modeling Framework
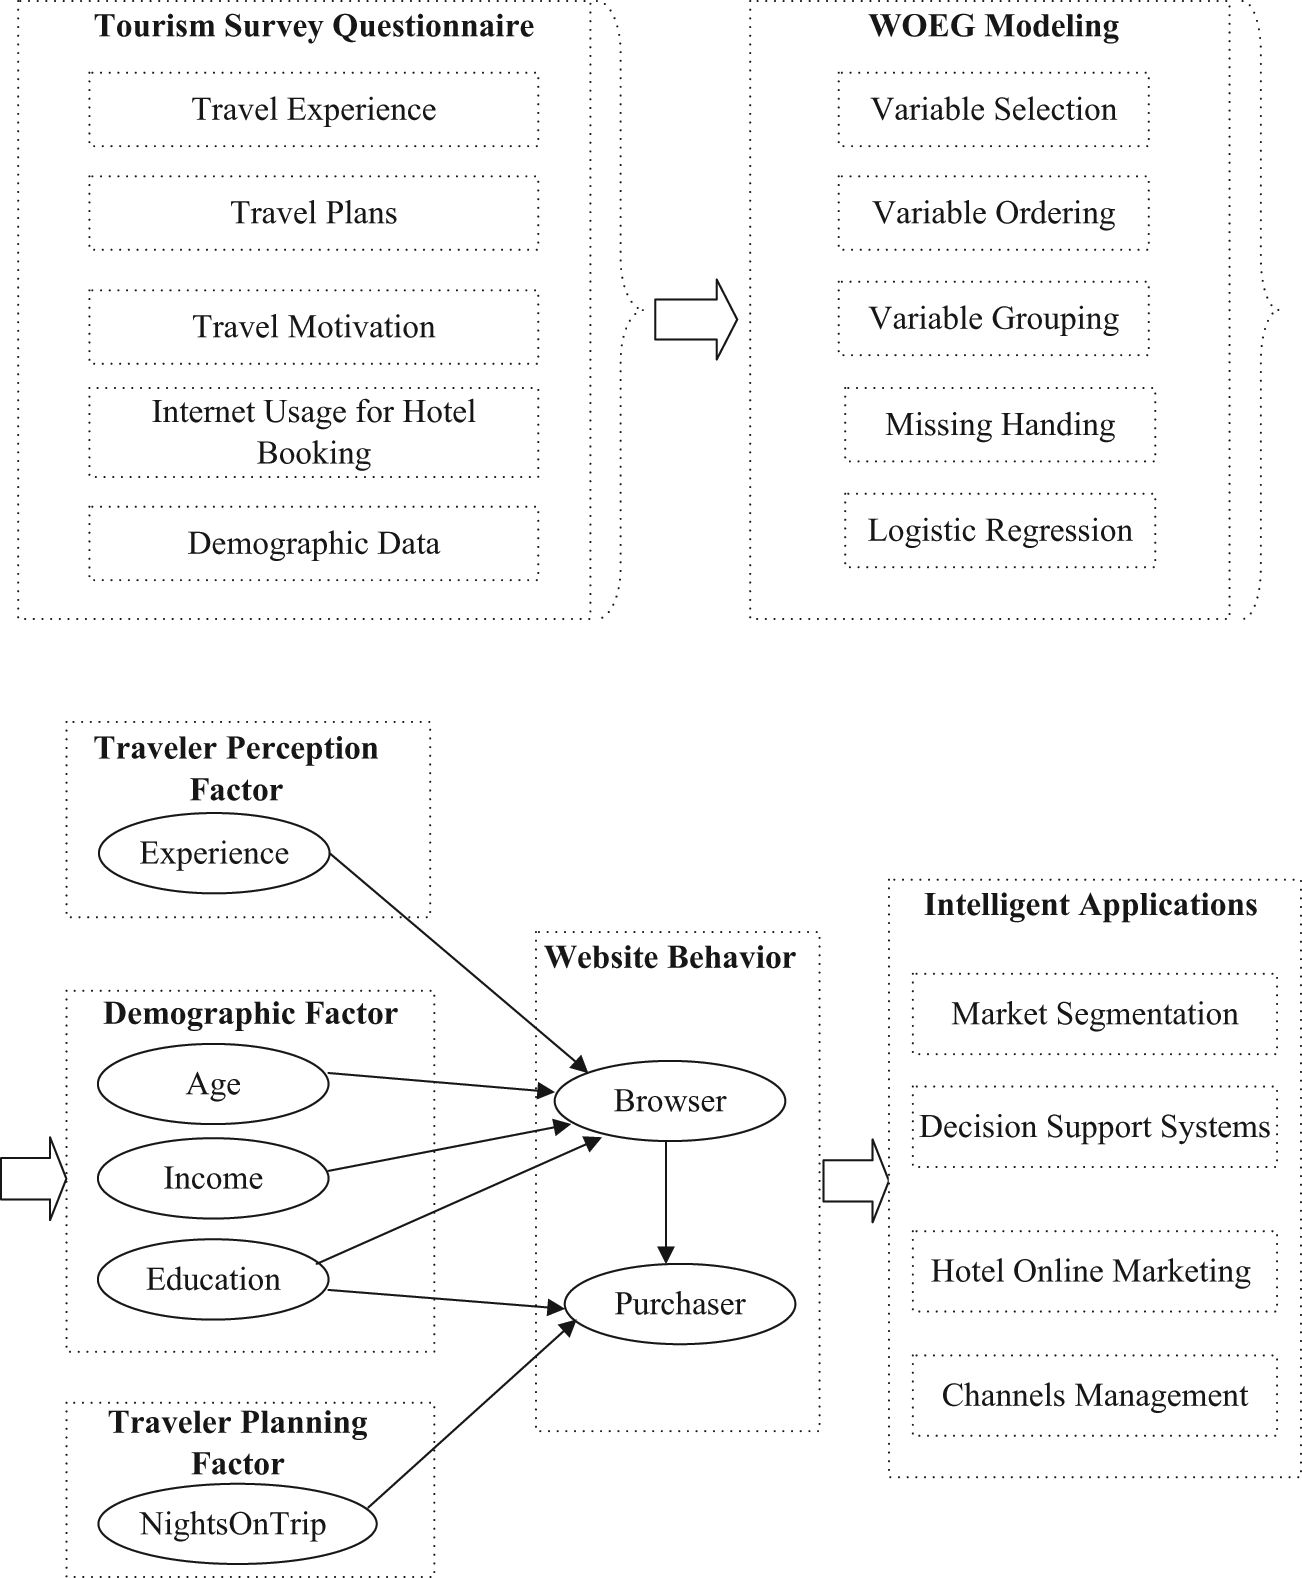
We began our WOEG analysis by collecting customer data from a tourism survey with more than fifty questions in five sections, which was distributed to the target travel population. Although the customer data for this study were all obtained from a tourism survey, we realize that better modeling results could be achieved if more variables of customer online usage patterns are included, such as those collected by hotel marketers’ analyses. If a hotel has well-developed customer relationship management (CRM) or marketing systems, it can use such channels to obtain customer data. Some hotel websites have sophisticated web usage analysis systems that can provide click-stream analysis, which also would be a good source for analyzing customers’ online behavior, including their length of stay on hotel websites, their visit frequency, and the particular website pages and content that they have visited. The framework demonstrated in Exhibit 1 can be easily modified to fit the analyses that are made possible by these data.
The WOEG Model and Framework for Predicting Hotel Website User Behavior
Data Profile of the Tourism Survey
Our survey was conducted recently among 1,401 Hong Kong residents aged at least 18 years through telephone interviews with respondents from randomly generated telephone numbers. Respondents provided their demographic data and hotel website usage experience, particularly whether they had ever browsed or purchased from a hotel website.
Of the 1,401 respondents, just 482 (34.4%) stated that they had browsed a hotel website, and the remaining 919 (65.6%) were nonbrowsers. Just over half of those who had browsed a hotel site, 283 (20.2% of all respondents) replied that they had purchased from a hotel website.
Identification of Predictive Variables
Chi-square tests were first used to identify thirty-three significant factors that influence browsing and twenty-three factors that drive purchasing behavior. Different degrees of missing values were observed in these variables, but the long list of variables with missing data implies that chi-square tests and stepwise regression models are not able to further identify and select variables for building a predictive model.
However, WOEG models successfully identified age, education, travel experience, and income as four key factors that distinguish those who browse hotel sites from nonbrowsers. The survey statistics for these variables are shown in Exhibit 2. We note that 16.2 percent of the income observations were missing values. This high percentage is probably attributable to people’s reluctance to provide information about household income. Consequently, we also developed a reduced three-variable model that excludes income.
Key Variables and Survey Results for Predicting Browsers and Purchasers

The results for Model 1 and Model 2 are shown in Exhibit 3. All of the included variables have a significant IV of greater than 0.1, indicating that they have predictive power. The model estimates in both browser models are significant with p values less than .05 through our experimental results. The original survey questions are simplified to become true-or-false questions for practical convenience. Thus, there are only two choices for each question (variable), and we classified missing records as false, thus allowing the whole data set to be used.
Model 1 and Model 2 Results to Predict Browsers of Hotel Websites

Models 1 and 2: Predicting Browsers with Age, Education, Travel Experience, and Income
The newly grouped variables reveal obvious differences in browsing tendency. Exhibit 3 suggests that people with a higher education level will be more likely to browse a hotel website, which is a common view validated by research (W. G. Kim and Kim 2004). Using an education level of “secondary school” as the new splitting point, 44.8 percent of people at this education level or above are browsers. In contrast, only 9.7 percent of people below this level browse hotel websites.
In terms of age, 41.5 percent of respondents below the age of 55 are browsers. However, above this age, only 11.4 percent are browsers. These results verify the usefulness of the WOEG model in selecting the most influential factors that can optimally differentiate the target variable. The splitting points selected by WOEG can be used as market segmentation rules for marketing purposes. The segments suggested by WOEG models can effectively identify the population of customers with greatest online usage preferences.
Official sources (Hong Kong Census and Statistics Department [HKCSD] 2006, 2008; Hong Kong Education Bureau [HKEB] 2008) show that the ratio of the completion of secondary education or above of the Hong Kong population aged at least 15 is 76.4 percent, 24.5 percent of the population is above 55, and 44.4 percent of local families have a monthly income of at least HK$20,000 (approximately US$2,565). These figures are reasonably close to those of the survey samples, implying that the samples are representative of the population of Hong Kong. These statistics also suggest that the demographic splitting points determined by the proposed model are reasonable classifiers for separating potential customer groups. With this model, a user’s browsing behavior is determined by demographic factors (age, education, and income) and a perception factor (travel experience).
Model 3: Predicting Purchasers with Browser, Education, and NightsOnTrip
Three significant variables are identified as separating the purchasers and nonpurchasers from hotel websites (see Exhibit 4). They are whether a user has a hotel website browsing record (“browser”), education, and the number of nights spent away on the most recent international trip (NightsOnTrip). All model estimates in the purchase model are significant with p values less than .05. Unlike Models 1 and 2, Model 3 determines a purchaser differently: it uses education as a demographic variable that measures an individual’s knowledge and skills, which are crucial to online purchasing behavior. Education level can also reflect an individual’s income and wealth in some senses. Model 3 suggests that 42.2 percent of respondents with college education or above purchase online (see Exhibit 4). In contrast, among people below this education level just 10.7 percent favor online purchasing.
Model 3 Results to Predict Purchasers of Hotel Websites
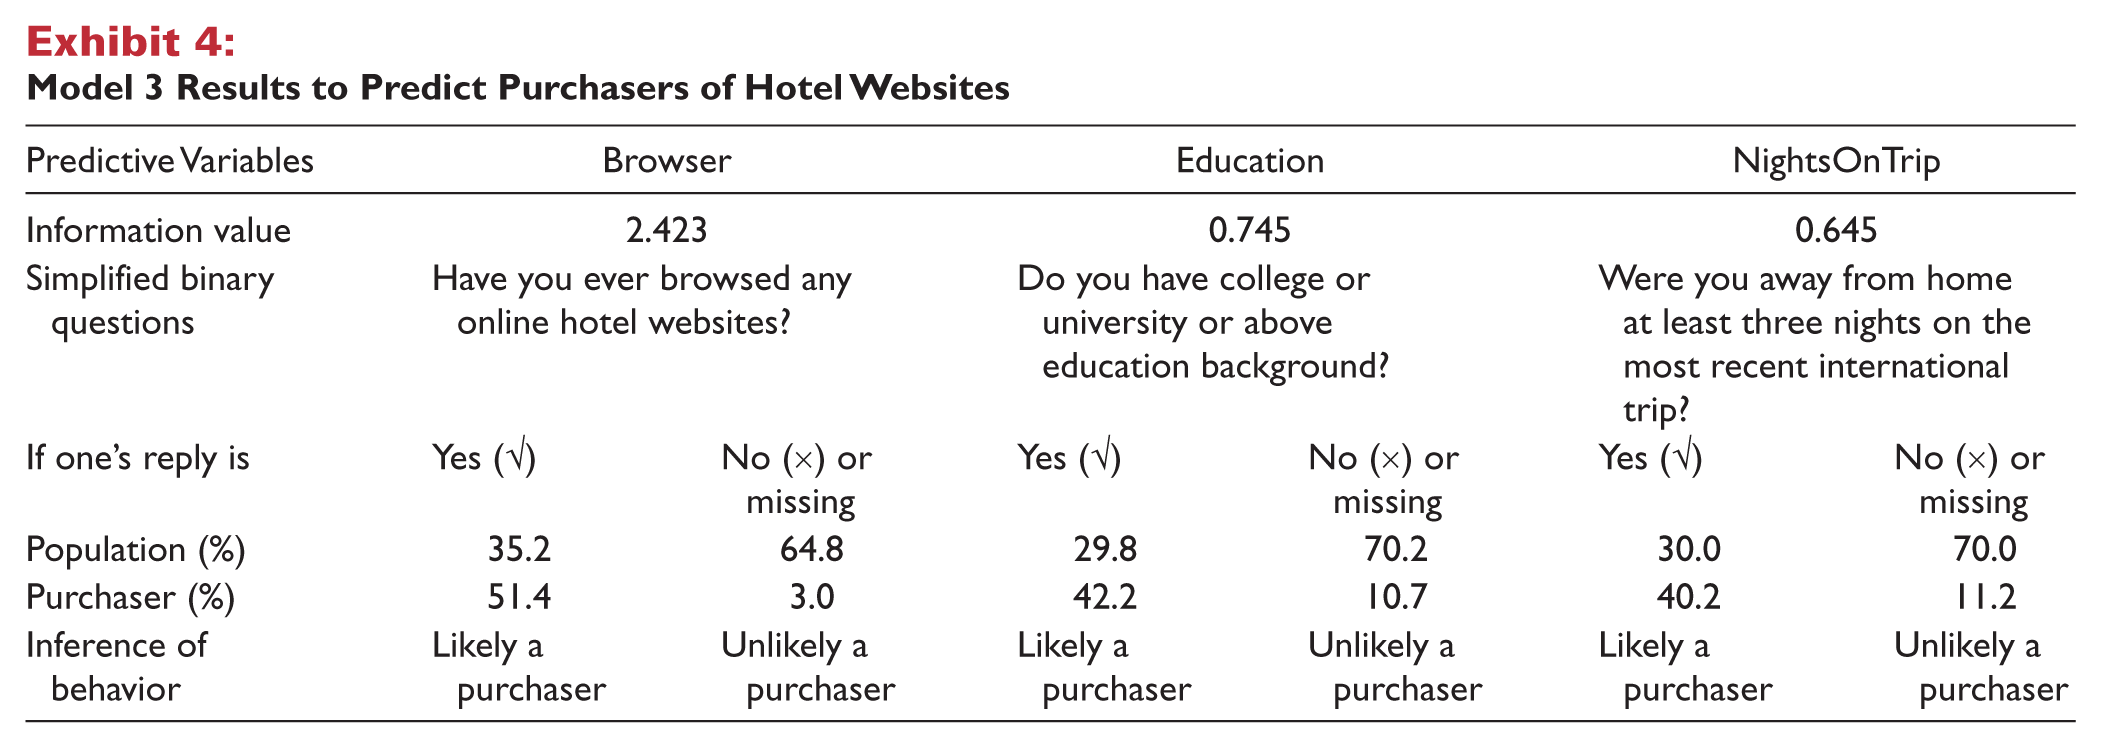
Similar to our browser variable, W. G. Kim and Kim (2004) confirmed that “history of internet usage” is a key determinant of purchase behavior. Model 3 suggests that 51.4 percent of the respondents who browse hotel websites have purchased online from those websites. However, among the group of nonbrowsers, only 3 percent make purchases online. We presume that this tiny group does not frequent the internet, but nevertheless has used a website to purchase their travel. Overall, this finding is sensible as frequent browsers of hotel websites are more likely to engage in purchase behavior.
The identification of NightsOnTrip as a key determinant of purchase is an interesting and unexpected finding. The results of Model 3 suggest that 40.2 percent of respondents who spent at least three nights away on their most recent international trip purchase from hotel websites. However, only 11.2 percent of those who spent less than three nights away or refused to answer show any interest in purchasing online through hotel websites. This finding can be explained by the fact that long-haul travelers may need to engage in careful planning in advance. To reduce, if not to remove, any uncertainties about booking their desired hotels, they tend to make reservations directly through hotel websites. The three-night threshold may also derive from hotel companies’ free-night promotions (buy two nights, get one free), or the use of loyalty points by business travelers. Moreover, missing values in NightsOnTrip have significant prediction power in that people who are not willing to fill NightsOnTrip in surveys are not likely to be online purchasers. This observation is empirical, or it is a data mining pattern discovered, in that if more data are available in the future, one should verify whether this pattern still exists.
Differentiation between Browsers and Purchasers
To investigate the factors that differentiate a browser from a purchaser, we start with Model 3’s finding that 51.4 percent of browsers eventually become purchasers. Thus, we conclude that the difference between browser–purchasers and browsers-only depends on the other two factors of Model 3, that is, education and length of trip (NightsOnTrip). Of those two variables, education is the only common variable in the browser and purchase models (see Exhibits 3 and 4). However, the splitting points for this variable are different in the two models. The splitting point for purchasers (college education or above) is higher than that for browsers (secondary school), implying that purchasers have on average a higher education level than browsers. Looking at the other differentiation factor, NightsOnTrip, short-trip (or no response) travelers tend to focus on browsing the online content of hotel websites but seldom purchase.
Predicting the Probability of Browsers and Purchasers
According to the WOEG model, the probability of being a browser or a purchaser can be calculated based on the information provided and model estimation. The formula for calculating the predicted probability derived from equation (1) is as follows:
The probability estimation results are shown in Exhibit 5. If a predictive variable satisfies a particular segment rule, it is marked as “√”; otherwise “×” is marked, based on the simplified true-or-false questions that are shown in Exhibits 3 and 4. It can be seen that the probability estimations are consistent with the browsing and purchasing tendency indicated by the WOEG model. For example in Segment 16 of Model 2, the group of customers aged below 55, with a secondary school education or above, a monthly income of more than HK$20,000, and confidence in their travel experience has the highest chance of being browsers, with a probability of 64.4 percent. However, if one or more of these conditions are not satisfied, the probability of being a browser gradually decreases. The respondents with a browsing habit, college education or above, and who spent at least three nights away on their most recent international trips have a predicted probability of 74.5 percent of being online purchasers (see Segment 8 in Model 3), which is much higher than that of the other groups of customers. “Actual Target%” represents the actual percentage of such users (online browsers or purchasers) in the survey samples. For instance, in Segment 16 of Model 2, “Actual Target%” of 64.1 percent denotes that about two-thirds of the customers in the survey who belong to Segment 16 are actual online browsers. The “Actual Target%” in the Segment 8 in Model 3 suggests that 71.4 percent of the customers in this group are actual online purchasers.
Predicted Probabilities and Market Segments of Browsers and Purchasers

As a note of caution, if there is a significant deviation between “Actual Target%” and “Predicted Prob%,” the WOE model results may not be valid. Therefore, a Kolmogorov–Smirnov (KS) test is suggested. To judge whether the predicted probability is reliable, a two-sample KS test can be used. The two-sample KS test is a nonparametric test that verifies whether two independent samples of an ordinal variable are significantly different by calculating the differences in both location and shape of the empirical cumulative distribution functions of the two samples (Massey 1951).
In this case, the KS Z-test statistic for Model 1 is 0.5 (p value = .964) and for Model 2, 0.354 (p value = .999). These results suggest that there is no significant difference between the actual and estimated probabilities, and, further, that the predicted probabilities of Model 3 are reliable estimates. Hence, the WOEG models developed here can provide good estimations of the distributions of browsers and purchasers.
Analytical Applications for Hotel Practitioners
Knowing the profile of hotel website users is of great interest to hotel managers in designing tailor-made offers for their internet customers. In the following sections, we suggest some potential hospitality applications of the WOEG models’ findings.
Customer Segmentation by Browsers and Purchasers
Researchers need to be aware that sophisticated model results should be presented in a way that industry practitioners in general can easily understand and use to assist their daily activities, as in the case of the differentiating segment variables shown in Exhibit 5. By creating segments that are sorted based on the likelihood of an individual’s being a browser or a purchaser, practitioners can identify the target segment of customers for advertising, promotions, and cross-selling.
As an example, hotel managers should ensure that their websites are attractive to potential browsers who are young, have a high household income level, have a good education, and are experienced in traveling, such as Segment 8 in Model 1, which accounts for 39.4 percent of the respondents, or Segment 16 in Model 2, which accounts for 26.4 percent of the respondents. In contrast, hotels should also continue to rely on traditional offline channels for marketing and promotion activities for customers who are unlikely to use hotel websites. People in this offline group are generally older, financially not strong, and inexperienced travelers (found in the first few segments of Models 1 and 2). In terms of converting the browsers to purchasers, hotel managers should target customers who browse hotel websites, have a higher level of education, and are interested in or planning long-haul travel. Segment 8 of Model 3 includes such customers, who account for 10.4 percent of the survey respondents.
Decision Support Systems for Marketing Management
The proposed model can be further developed and implemented as a knowledge-based decision support system and integrated into hotel information systems for CRM applications. Each segment can be regarded as a predictive decision rule given that information on the variables is provided. The classification of customers can be performed manually or automatically, as some information can actually be collected from secondary sources, such as hotel website registration information, VIP application forms, and hotel check-in forms.
For instance, hotel managers could tailor a marketing campaign to boost online sales that seeks to target less than 25 percent of customers with at least a 50-percent chance of making an online purchase. Based on the purchase model (please refer to Model 3 in Exhibit 5), respondents belonging to Segments 6, 7, and 8 in Model 3 would be identified as the target customers of the proposed campaign.
Implications to Hospitality Revenue Managers
The proposed WOEG predictive model can assist revenue managers of the hotel industry by targeting groups of loyal and frequent online purchasers. Pricing packages can be adjusted according to the variables that identify the groups.
Implications for Hospitality Online Marketing
The findings from the WOEG analysis can assist managers as they use e-mail marketing (O’Connor 2008). Improving the effectiveness of e-mail marketing is a challenge for hospitality practitioners. Instead of sending numerous e-mail messages to internet users, for instance, hotels can first use the proposed WOEG model to select the target group of potential online hotel purchasers. If hotel managers have stored customers’ preferences into their CRM systems, they can include such factors in the WOEG models for better browsing and sales predictions. For instance, it is worthwhile to find married customers who are more likely to make online purchase of high-quality hotel and dining services during their anniversary and to send them e-mail letters to invite them to experience the personalized services the hotels prepare for them. The indicator of “anniversary date” information can be a useful predictor in determining customers’ online purchasing behavior. The WOEG analysis can also assist hotel firms in optimizing their websites for search engines. In response to the analytical demands of such a large amount of customer data generated from daily operations and market surveys, hospitality practitioners can use the proposed WOEG models and customize their prediction target by incorporating different predictive factors and fully using their customer information and historical records.
Implications for Hospitality Loyalty Programs
In their analysis of loyalty programs, McCall and Voorhees (2010) highlighted the importance of program structure, reward structure, and customer factors in an effective loyalty programs. The WOEG models presented in this research can be used to customize loyalty programs by taking into account predictive factors that are relevant to customer loyalty as identified by prior research, such as reward type, reward frequency, price sensitivity, purchase frequency, and customer advocacy for model development. In this model setting, the prediction target can be whether a customer is a loyal online loyalty program participant. Subsequently, the model results can help identify the segments of loyalty customers by different levels. Likewise, managers can use this analysis to examine and monitor the factors that affect the customer online experience and satisfaction toward a hotel website and to incorporate them into a hotel’s brand development and strategy management.
One of our key findings in the purchasers’ model is that if a traveler plans a longer trip, the traveler would be more likely to purchase hotel rooms online. This echoes the findings of Toh, DeKay, and Raven (2011), who indicated that those who use the internet to search and book hotel rooms may spend more nights in hotels and belong to more hotel loyalty programs. Therefore, hotel managers may consider providing more loyalty points or discounts to their online purchasers to encourage them to stay longer. In this way, the WOEG model can be adopted to effectively identify such customers.
Implications for Hotel Distribution Channels Management
Although this study focused on travelers in Hong Kong, hotel distribution channels must be considered in a global perspective (O’Connor and Frew 2002; O’Connor and Piccoli 2003), as hotels determine the proportions of rooms to sell through the hotel-owned websites (Brand.com) and those via third-party websites. Toh, Raven, and DeKay (2011) recommended several practical suggestions for hotel operators to strengthen their sales on their websites. For instance, a hotel can consider offering discounts or other promotions to customers who make reservations via Brand.com, or giving incentives for returning guests who book on hotel-owned websites rather than other travel agents or third-party websites.
The WOEG model can help hotel managers to implement such strategies. As an example, a hotel can conduct a survey and then use the WOEG modeling techniques as presented in this study to identify their hotel website browsers and potential purchasers. The goal is to accurately target the right customers for online purchase promotions. However, hotel managers can leave travel agents or third-party websites to explore business opportunities from potential customers who have no interest in browsing or purchasing on their websites. Such strategies can reduce hotels’ costs for channel management and maintenance, and thus improve their operational efficiency. Moreover, identifying the key factors separating Brand.com purchasers from those who use third-party websites with the WOEG models would be an interesting topic for future research in hotel channel management.
Limitations and Discussion
The survey that we used for WOEG model development is a general tourism survey that targeted outbound travelers in Hong Kong. Before generalizing this study’s results, the model needs to be verified using data from a different group of customers.
The survey samples did not ask respondents to rate their experience of online searching or buying. However, researchers have conducted successful studies that used customer data to examine their personal web use experiences and then adapted IT tools to generate a truly personalized engagement through online platforms (Murphy, Bennett, and Hofacker 2001; Olsen and Connolly 2000; Verma 2010). This would be a useful prospective research direction for improving the WOEG models’ predictive abilities.
This study also did not take into account the structure of any hotel’s website or its click-stream data. As such, we cannot offer suggestions on how to improve hotel website design, functions, and user interface based on the proposed model, beyond our advice to take into account your customers’ demographic information. However, these would be some promising topics for researchers to investigate in the future by using our proposed analytical model and framework.
In the future, exploring more hospitality intelligent applications based on the WOEG models and analytical framework by using various sources of customer data will be a promising research and development area. Some potential intelligent applications are shown in Exhibit 1. The WOEG-based analytical framework can certainly be extended by researchers for further studies.
Conclusion
This study’s innovative use of WOE data mining applies a logistic regression model to search for the optimal subset of variables for predicting browsers and purchasers of hotel websites. The proposed WOEG model provides some practical research methods for dealing with missing data, and performing variable grouping and selection from hospitality and tourism surveys. Empirical results suggest that the WOEG models are effective for identifying potential groups of online customers. Hotel managers can use the WOEG model to predict whether a potential customer is an online browser or a purchaser based on demographics, and subsequently can formulate appropriate marketing strategies to target potential purchasers. As an innovative IT application for hospitality industry, this approach can be adopted and integrated into hospitality management information systems to improve their hospitality services. This customer-based business analytical model and framework can also benefit the development of hospitality revenue management, online marketing strategies, loyalty programs, and hotel distribution channel management in response to the dynamic and evolving global e-Tourism markets.
Footnotes
Appendix
Declaration of Conflicting Interests
The author(s) declared no potential conflicts of interest with respect to the research, authorship, and/or publication of this article.
Funding
The author(s) disclosed receipt of the following financial support for the research, authorship, and/or publication of this article: The authors would like to acknowledge the funding supports from the Hong Kong Polytechnic University, Sun Yat-sen University, and the Social Science Youth Fund of Ministry of Education (Grant 10YJCZH174).