
Abstract
A survey of 276 restaurant and food-service managers found that, when it comes to seating walk-in guests, just over half maintain a policy of seating the party that has waited the longest. About one-fifth of the respondents seated the largest waiting party and the remainder used some combination of the two approaches. With that in mind, this paper uses an extensive simulation to evaluate the relative revenue outcomes for nine rules for assigning walk-in parties to tables in restaurants, taking into account such variables as restaurant size and matching party size to the table size. I test three variants of each of the “largest party” and “longest wait” rules, along with two rules that blend largest and longest. I also include the outcome of allowing guests to seat themselves. I found that one of the blended rule using party size and waiting time performed the best across all levels of all of the experimental factors, but among the simple rules, the longest wait approach was effective in most cases. Except in the largest of restaurants, allowing guests to seat themselves is the least efficient approach.
Keywords
One of the many front-of-house tasks that are critical to a restaurant’s success is assigning walk-in customers to a table. While a variety of researchers has shown that wait times affect satisfaction in restaurants (Butcher and Kayani 2008; Davis and Vollmann 1990; Gupta, McLaughlin, and Gomez 2007; Hwang and Lambert 2006, 2009), I have found no studies that expressly compare the various approaches to seating guests, either in terms of revenue or customer satisfaction. Despite this research gap, I am convinced that an effective table-assignment rule will enhance a restaurant’s revenue and customer satisfaction. Because tables vary in capacity and customers vary in a number of ways, this matter would fall into the category of a flexible queuing system, which can be complex to analyze (Gurumurthi and Benjaafar 2004).
Bearing in mind both customer satisfaction and restaurant revenue, this paper assesses three types of party-to-table-assignment rules, individually and in combination, from the perspective of managing customer flow and resultant revenue. Based on a survey I conducted (described below), restaurants use three general table-assignment policies: seating the party that has waited longest, seating the largest party, and allowing the customers to seat themselves. From these three policies, I developed nine seating rules, which I evaluate using a large simulation-based experiment. Generally speaking, the simulation finds that the rule most commonly used in practice—give the table to the longest waiting party—outperforms the second most commonly used simple rule—give the table to the largest waiting party. However, both of those simple rules are outperformed by a hybrid rule based on both waiting time and party size. Indeed, hybrid rules based on party size and waiting were used by about one-quarter of my survey respondents, as I explain in a moment. First, however, I review relevant literature and then I will describe my restaurant survey. From this, I define the nine table-assignment rules, describe and present the results of my simulation-based study, and offer suggestions based on those findings.
Literature Review
This paper extends the lengthy thread of studies addressing restaurant revenue management (RRM), a term coined by Kimes et al. (1998), which focuses on applying revenue management concepts to restaurants. Many of these studies examine the relationship of restaurant revenue to table management, including table mix and location. Robson and Kimes (2009) found, for instance, that having empty seats at a table did not affect guests’ spending or satisfaction but having closely spaced tables reduced both spending per minute and satisfaction. One queuing analysis study that I conducted (Thompson 2011a) found that the conditions favoring “cherry-picking” of smaller parties were more viable in restaurants when customers had a lower tolerance for waiting, when the peak demand time windows were longer, and when table sizes were proportional to the number of seats.
In addition to identifying the optimal table mix for restaurants (Kimes and Thompson 2004, 2005; Thompson 2002), a major avenue of capacity-oriented research has addressed reservations policies (Alexandrov and Lariviere 2012; Bertsimas and Shioda 2003; Thompson and Kwortnik 2008). These studies have so far primarily applied a table-assignment rule of seating the largest waiting party that fits the table, with ties broken by longest waits (Kimes and Thompson 2005; Thompson 2002, 2003, 2009, 2011a). I am aware of just two studies that used the longest wait policy—Field, McKnew, and Kiessler (1997) and Hwang (2008).
The table-mix and reservation studies are related to right-sizing, a term coined by Kimes (2004) that refers to matching parties to tables to avoid empty seats. For example, if tables with even numbers of seats are used, tight right-sizing would allow no more than one empty seat per table, while a looser application of right-sizing might allow no more than three empty seats. Field, McKnew, and Kiessler (1997), for instance, used a hybrid of a tight right-sizing approach with just two table sizes. Parties of four or fewer were seated in four-tops, while parties of five and six were seated in six-tops.
My recent study that examined the accuracy of simple calculations designed to identify top-performing table mixes (Thompson 2011b) used the longest waiting and largest party rules, combined with the tight right-sizing and loose right-sizing policies that I just mentioned. That study found that the largest party rule yielded revenue improvement of a little over 1 percent compared with the longest waiting rule, while the looser right-sizing approach yielded about a 1.5-percent revenue bump over the tighter right-sizing.
In this article, I address questions that I left unanswered in that 2011 study. First, I would like to determine whether loose right-sizing is better than no right-sizing at all since I did not address that issue earlier. Second, no one has yet examined the effect of combination rules, which attempt to blend party size and wait duration. Third, given the many restaurants that allow customers to seat themselves, the performance of that unmanaged approach needs to be examined. Fourth, the effect of the different table-assignment policies on the level of service delivered (in terms of length of wait) has yet to be considered. Fifth, the performance of the assignment rules with respect to the restaurant size and table configuration has yet to be examined. Sixth, and most fundamentally, no one has surveyed restaurant managers to identify the industry’s assignment policies. This paper addresses all these issues.
Restaurant Survey
Starting with the basic question of what table-assignment policies are generally in use, I surveyed 276 restaurant managers, drawn from a survey frame of 2,100 people who had downloaded one or more of the restaurant-related studies I produced and posted on the Cornell Center for Hospitality Research site (many of which are cited in this article). After one reminder e-mail, 492 people responded to the online survey but only 276 were employed in a restaurant or food and beverage operation. Thus, the effective response rate was 13.1 percent. The survey respondents covered a wide geographical mix, as reported in Exhibit 1.
Geographical Distribution of Survey Respondents.

Stand-alone restaurants represented 16.4 percent of the qualifying respondents, while the preponderance (72.5%) were located in a lodging property and the remainder (11.1%) were in other locations such as strip malls. The restaurants ranged in size from 26 to 2,000 seats, with a mean of 211 seats and a median of 150 seats (see Exhibit 2). Independent operators predominated in the sample, as just 37.6 percent represented chain restaurants. Walk-ins are important to most of these businesses, as 81.1 percent of the respondents accept walk-in customers, and about one-fourth of those (18.4% of the full sample) dealt only with walk-in customers. On average, walk-in customers represented 49.9 percent of these operations’ business volume.
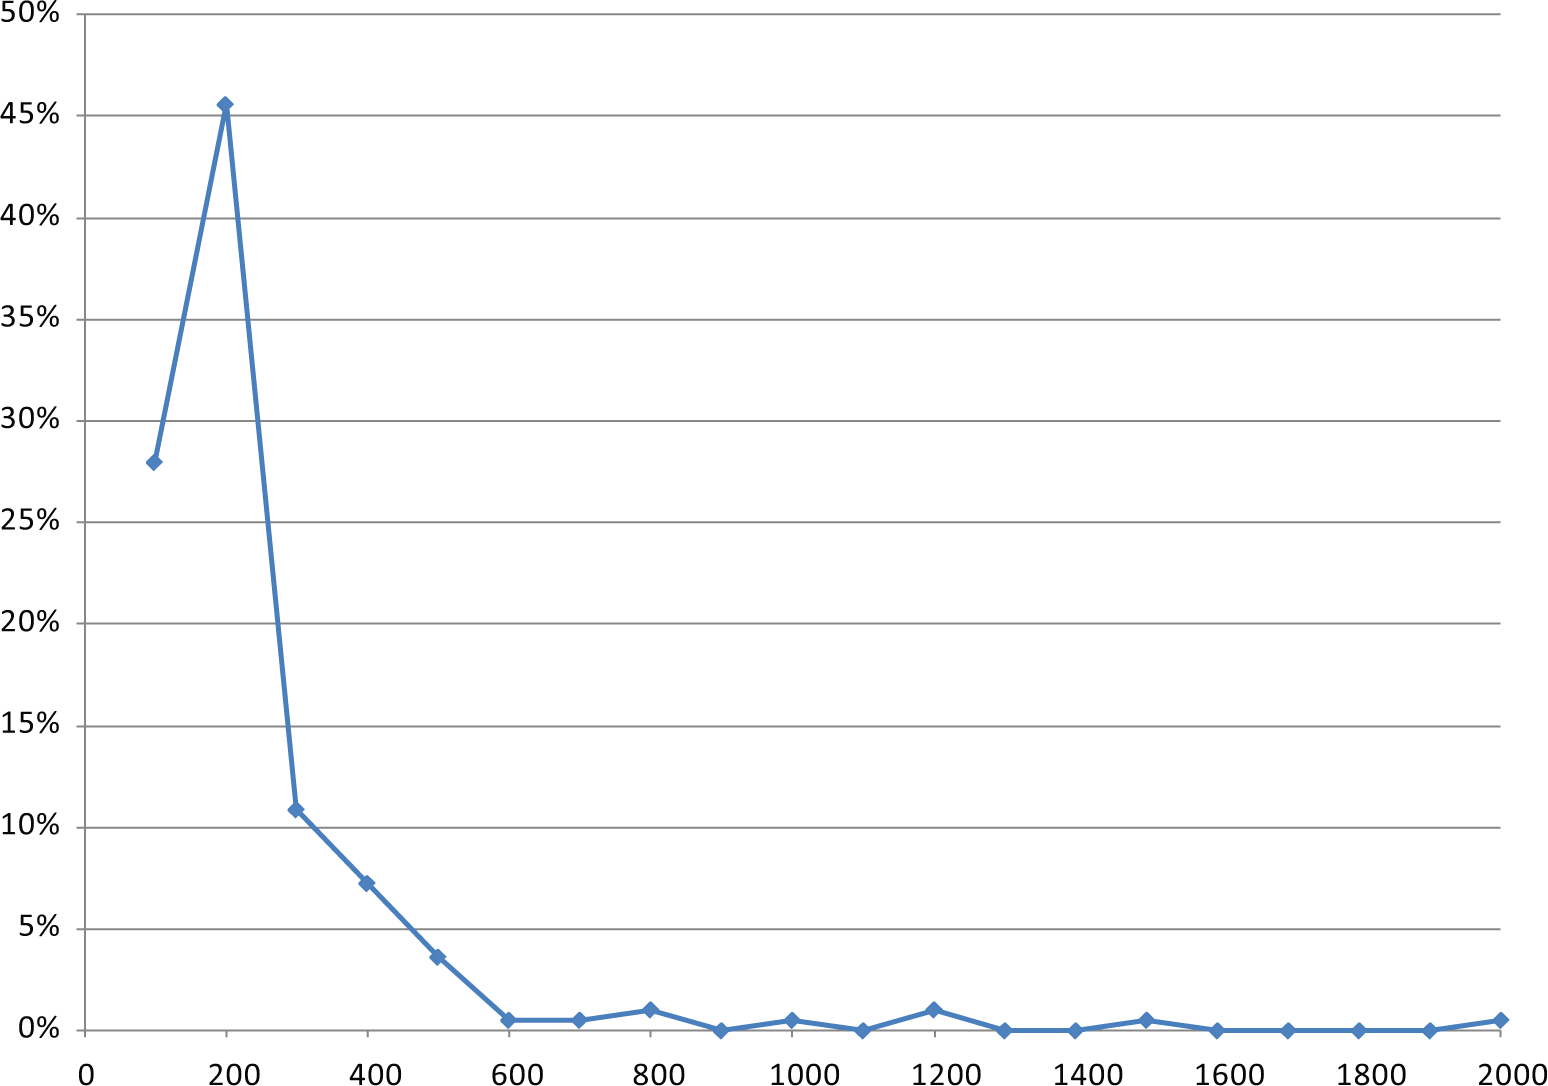
A Relative Frequency Histogram of the Number of Restaurant Seats.
To identify these restaurants’ seating policies, the survey asked the following question: “If you have a wait list for tables, which best describes which party is given a newly available table?” The “longest wait rule” was most common, as shown in the following responses:
The longest waiting party that will fit in the table: 53.9 %
The largest waiting party that will fit in the table, with ties broken by the longest wait: 20.6 % and
Parties are selected based on a combination of size and wait: 25.5 percent.
These respondents were asked to describe the actual rule being used, but there were no dominant approaches in the responses.
Table-Assignment Rules
Given the results of the survey, I evaluated nine approaches to table assignments: three variants of the longest wait rule, three variants of the largest party rule, and two blended rules, as well as allowing customers to seat themselves. The rules I evaluated are as follows:
Longest-pure. This rule assigns a newly available table to the longest waiting party, without consideration of matching party and table size. Thus, there is no limit on the number of empty seats that a table might have.
Longest–loose right-sizing. This rule also assigns a newly available table to the longest waiting party but includes a limit of three empty seats per table.
Longest–tight right-sizing. Once again the longest waiting party is seated, but this time, the limit is one empty seat per table.
Largest-pure. This rule assigns a newly available table to the largest waiting party that fits in the table, with ties broken by longest waits. As with longest-pure, there is no limit on the number of empty seats that a table might have.
Largest–loose right-sizing. This rule also assigns a newly available table to the largest waiting party that fits in the table, with ties again broken by longest waits. By applying loose right-sizing, however, this policy ensures that a table has no more than three empty seats.
Largest–tight right-sizing. As above, the largest waiting party that fits the table is seated, ties are broken by longest waits, and no table will have more than one empty seat.
Blended-SzWt. This blended rule assigns a newly available table to the party that can fit in the table and that has the highest size–wait score, calculated by multiplying the proportion of seats that would be occupied if the party is assigned to the table by the party’s current wait time. This policy puts no limit on the number of empty seats that a table might have.
Blended-ExpLs. To account for the possibility that guests will renege from the queue and walk out, this blended rule takes guests’ tolerance for waiting into account by assigning a newly available table to the party that can fit in the table and that has the highest expected loss score, which is calculated as follows:
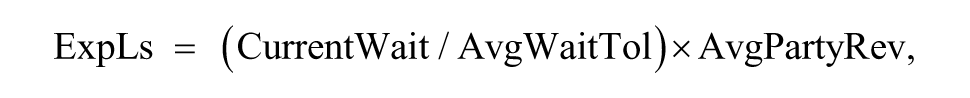
where
CurrentWait = amount of time the party has been waiting for a table;
AvgWaitTol = average waiting time tolerance for parties of the specified size;
AvgPartyRev = average revenue for parties of the specified size.
This rule also does not limit the number of empty seats per table.
Self-Managed. This rule is designed to mimic restaurants where customers can seat themselves in order of their arrival (first-in-first-out [FIFO]). This approach works only when there is no queue since this operates like the “longest-pure” approach when guests are waiting. When guests seat themselves, I assume that some parties prefer to sit in a larger-than-necessary table, with the probabilities given in Exhibit 3. If no queue exists, and if a choice of tables exists, the simulation picks a table randomly, consistent with the probabilities given in Exhibit 3. If a queue exists and a table becomes available, then the table is taken by the party closest to the front of the queue that will fit in the table, consistent with the longest-pure rule.
Assumed Preference Weights for Table Sizes, by Party Size.

Simulation Study and Hypotheses
To test the nine rules, I conducted the simulation-based experiment described here, using the assumptions given below. I have three hypotheses, which originate from the survey of restaurateurs. First, based on the prevalence of restaurateurs’ usage of the simple rules, where the longest wait rule was used more than twice as frequently as the largest party rule, I propose the following hypotheses.
Next, I expect that any managed rule should perform better than the customer-managed approach, given its potential inefficiencies. Thus,
Finally, given that the rationale for choosing a blended rule is that one wants to fill tables without losing customers, noting that the blended rules offer a means of considering both size and waiting time:
Design of the Simulation Experiment
The simulation experiment used a full-factorial design, with nine factors each having two or three levels, as described next and reported in Exhibit 4. The levels of the factors resulted in a total of 2,592 restaurant contexts in which to compare the seating rules. I selected the specific factors and their levels because I believed that the rules might perform differently under various assumptions.
Factors in the Simulation Experiment.
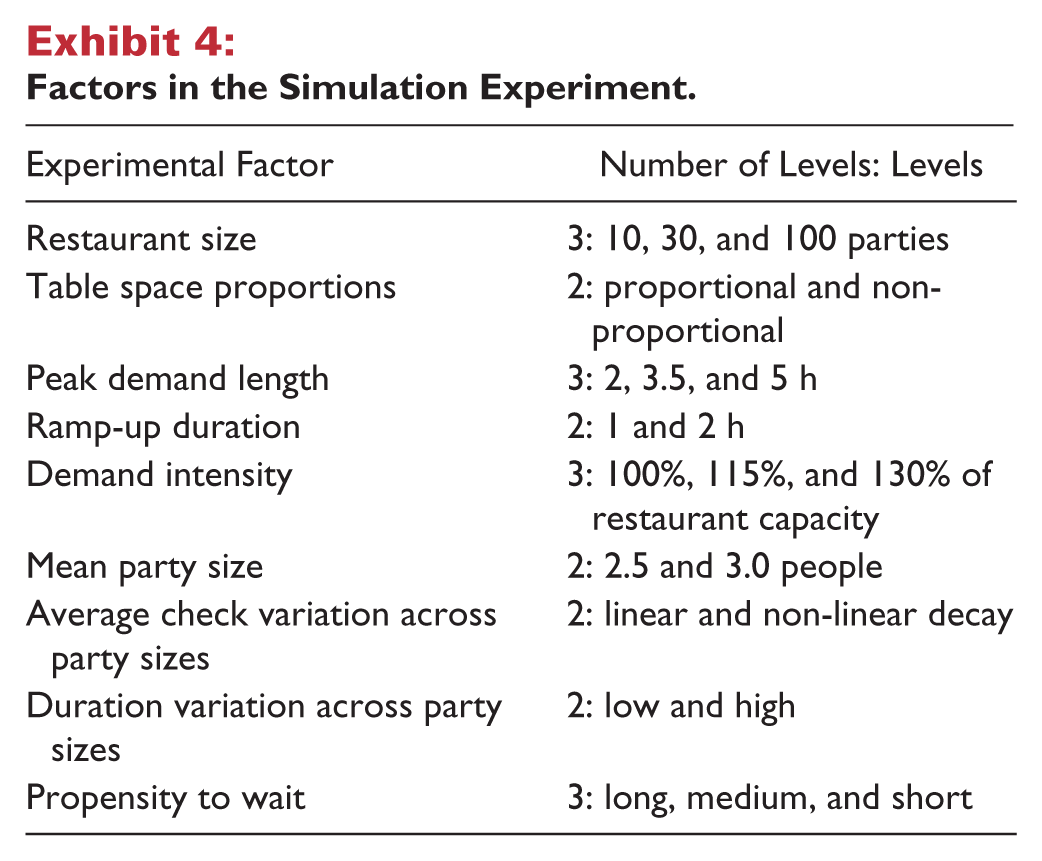
Restaurant size had three levels: average seating capacities for approximately ten, thirty, and one hundred parties. I set capacities based on party size, rather than seats, because of factors that affect the space requirements per seat and the number of customers per party. These three restaurant sizes range from quite small to larger than both the mean and median number of seats for the restaurants in my survey. While simulating even larger restaurants would be ideal, the computational effort in doing so is impractical. I included the restaurant size factor in part because I anticipated that the reduced seating flexibility in smaller restaurants could lead to differences in the seating rules’ relative performance (which did occur, as described below).
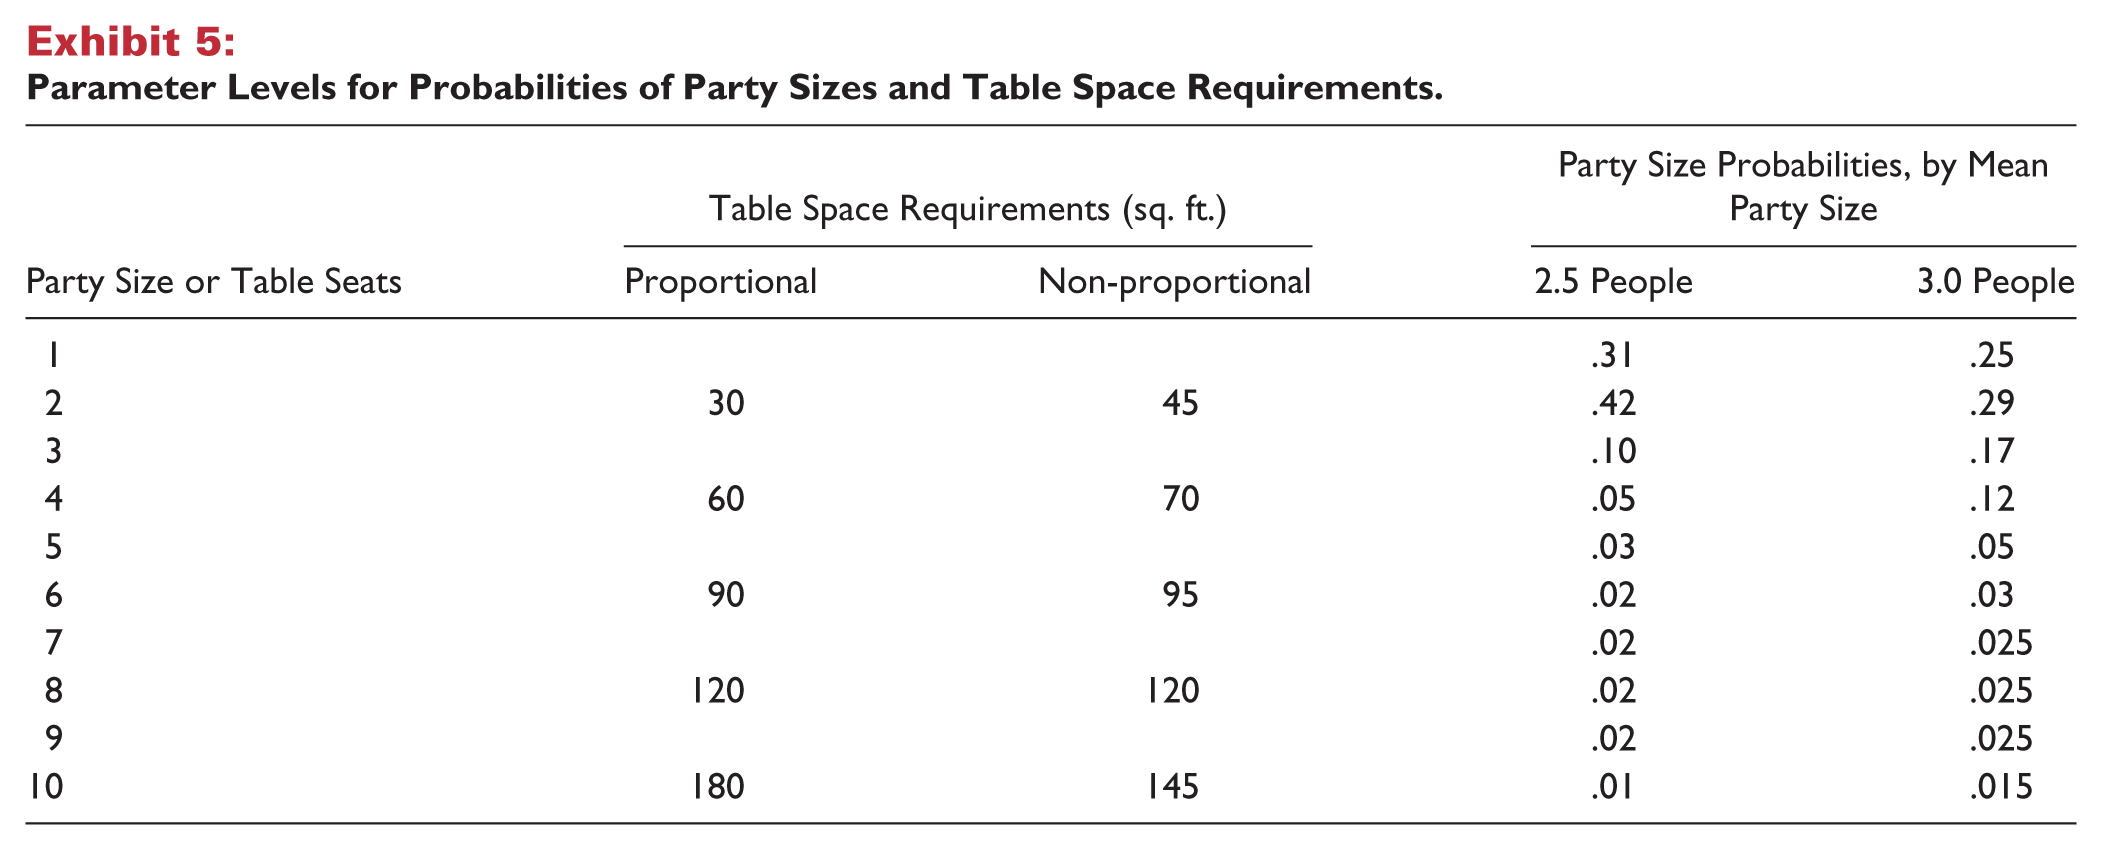
Table space proportions represent the space requirements, per seat, of different size tables. I used two levels of this factor, representing proportional and non-proportional space requirements. Exhibit 5, which reports the actual space requirements for the different levels, shows that with the non-proportional level, the space per seat declines as the table size increases. To my knowledge, with two exceptions (Thompson 2011a, 2011b), all of the published RRM-related research examining capacity issues has assumed proportional space requirements (Kimes and Thompson 2004, 2005; Thompson 2002, 2003; Thompson and Sohn 2009). Nonetheless, I include the non-proportional level because it is consistent with space requirements with rectangular tables that have a fixed space required per person, plus a fixed space requirement along a side of the table for access. The non-proportional space requirements in Exhibit 5, for example, are given by 6.25 ft.2 per person plus 20 ft.2 Another consideration with declining space requirements per seat for larger tables is that replacing a large table with smaller tables results in a loss of seating capacity, which could lead to differences in the relative performance of the assignment rules.
Parameter Levels for Probabilities of Party Sizes and Table Space Requirements.
Peak demand length is the length of time during which the customer arrival rate is at its highest level. I applied three levels of peak duration, 2, 3.5, and 5 hr, to represent a broad range of restaurant environments. Longer peak periods mean the restaurant is stressed (at capacity) for a longer time, and this may cause variations in the rules’ relative performance.
Ramp-up duration refers to the length of the time from when the restaurant opens for a meal period until the customer arrival rate reaches its peak intensity. I used periods of 1 and 2 hr for this factor, and I further assume that the customer arrival rate increases linearly over the ramp-up period. I believe that a rapid ramp-up might provoke greater relative differences in the performance of the seating rules than with a longer, more gradual ramp-up.
Demand intensity represents the level of peak customer demand, measured relative to the demand level that would result in the restaurant operating just at its full capacity. This factor had three levels, corresponding to 100 percent, 115 percent, and 130 percent of full capacity. These factor levels correspond to what occurs during rush times in popular restaurants. My colleagues and I have applied a wide variety of demand intensity percentages in RRM-related restaurant simulations, ranging from a low of 95 percent of capacity (Thompson 2003; Thompson and Sohn 2009) to a high of 300 percent of capacity (Thompson 2011a), with others falling within this range (Thompson 2002, 100%; Kimes and Thompson 2005, 100%; Thompson and Sohn 2009, 105%; Kimes and Thompson 2005, 120%; Thompson 2011b, 130%). I expect to see bigger differences in the relative performance of the table-assignment approaches under higher demand intensity because of the inherent challenge of seating more customers.
Mean party size is the average number of customers per party. I used two levels of this factor, corresponding to 2.5 and 3.0 people. Kimes and Robson (2004) found an average party size of 2.6, and my earlier study (Thompson 2011a) reported 2.55 people per party. Another study in which I participated (Thompson and Sohn 2009) indicated that the mean party size in the restaurant being studied was approximately three people. My factor levels, then, bracket the reported values, with the probabilities reported in Exhibit 5 for the two levels of this factor. I included this factor to see whether the various seating policies performed differently across party sizes.
The factor representing the variation across party sizes in per-person average check had two levels: linear and non-linear decay. Anecdotal evidence suggests that larger parties spend less per person than do smaller studies. I note, however, that there was minimal, if any, decay in the lunch period for the restaurant that I examined with Heeju Sohn (Thompson and Sohn 2009). In many studies, we assumed a linear decline in per-person average check (Kimes and Thompson 2005; Thompson 2002, 2003, 2011a, 2011b; Thompson and Sohn 2009). However, the data reported by Kimes and Robson (2004) and Kimes and Thompson (2004) show a non-linear relationship. Fitting a curve to the data reported in those studies yields the function:

where p = party size.
Equation (1), which I used for the non-linear level, gives an average per-person check of $22.08 for parties of one person, falling to $7.86 for parties of ten people (see Exhibit 6). For the linear level, I simply assumed a linear decline in per-person spending across the party sizes. I included this factor to see whether seating rules interacted with party value relationships.
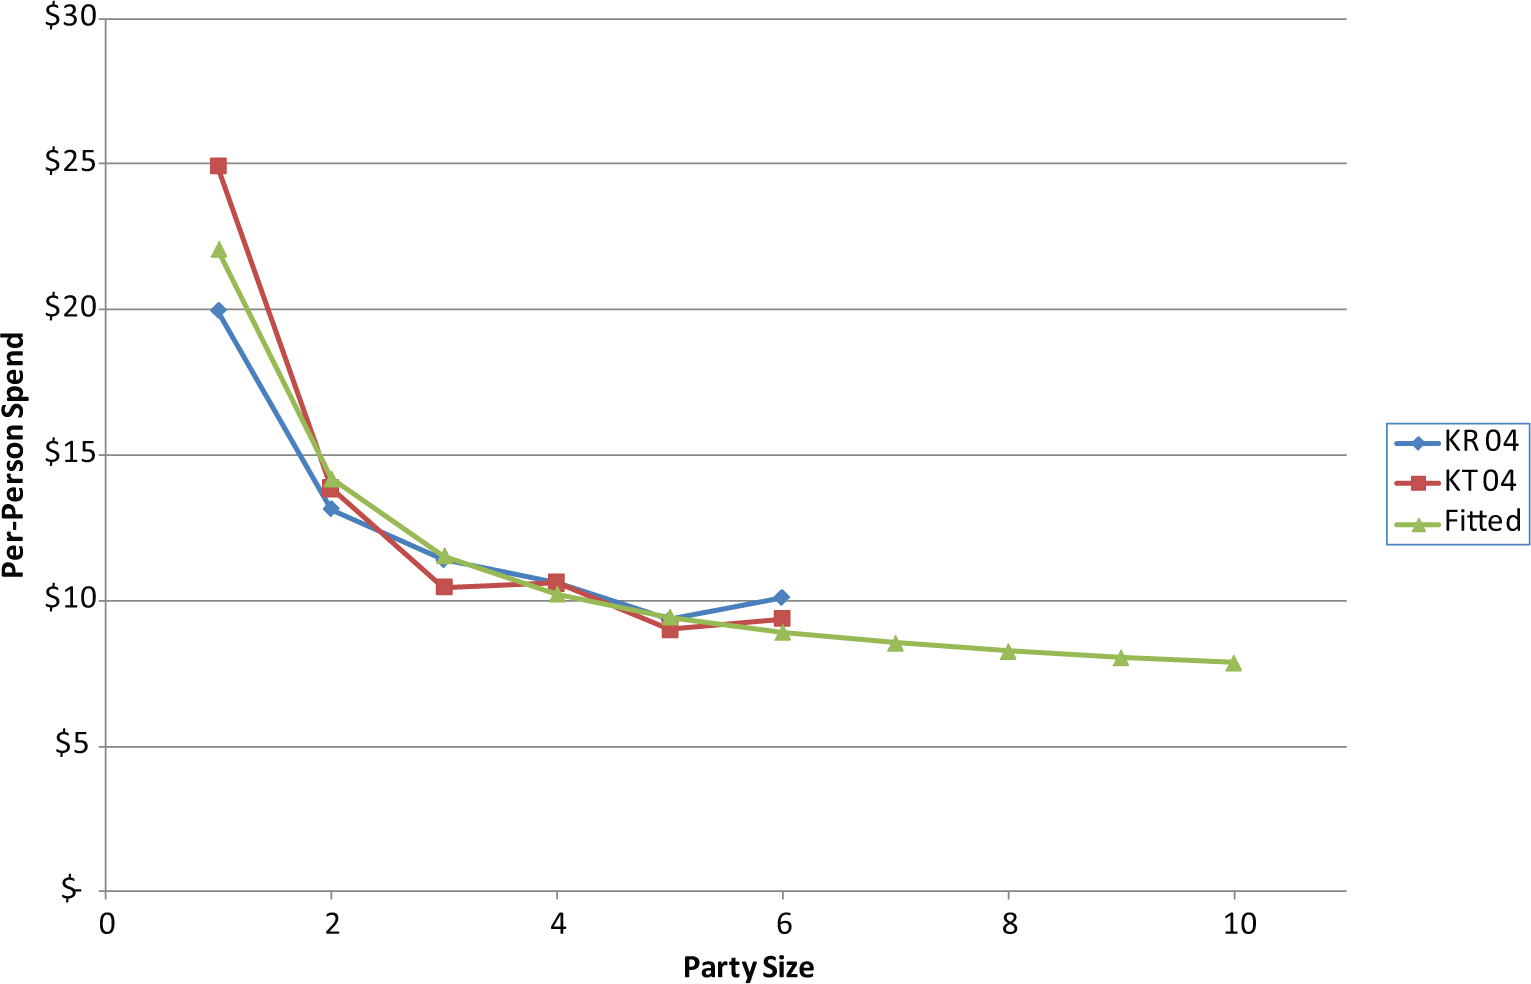
Relationship between Per-person Spend and Party Size.
Several authors have observed that dining duration increases with party size (Bell and Pliner 2003; Kimes and Robson 2004; Kimes and Thompson 2004). As a consequence, I applied two levels of this factor to express the ratio of the dining time for parties of ten to the dining time for parties of one: 1.5:1 and 2.0:1. These ratios are within the range observed in the literature—a low of 1.14 (Kimes and Thompson 2004) to a high of 3.18 (Bell and Pliner 2003). In both factor levels, I assumed that mean dining duration increased linearly with party size. Since the table-assignment policies deal with customers’ wait times, rather than their dining duration, I do not expect to see much difference in the relative performance of the rules across the two factor levels, but I included this factor to be thorough.
Finally, I modeled customers’ willingness to wait for a table. Though I am not aware of published research on the topic, anecdotal evidence suggests that willingness to wait increases with party size. I selected three factor levels that I believed would represent a broad coverage of restaurant environments: willingness to wait of 105 to 120 min, 45 to 60 min, or 15 to 30 min for parties of 1 to 10, with differences in each range linear with party size. My thinking is that restaurants have less flexibility to pursue various seating policies when guests’ waiting tolerance is low.
Simulation Assumptions
The simulation was governed by the following thirteen assumptions:
Parties would be seated at a single table, not split across two or more tables, in keeping with common restaurant practice.
Tables would not be combined. When I compared the effects of combining tables as against maintaining an appropriate mix of table sizes (Thompson 2002), I found that most restaurants are better served with a mix of table sizes.
Tables only had an even number of seats. This is consistent with the use of square or rectangular tables.
All demand was from walk-in parties, since my focus is on rules for selecting customers from the wait list. Restaurants that accept reservations would have set aside the necessary tables for those customers, leaving the remainder for walk-ins.
Parties ranged from one to ten people. Ten is already large for a walk-in party. Restaurants that take large parties generally encourage them to make reservations (26% of the respondents to my survey reported that their restaurants take reservations only for large parties).
Poisson arrival process. Typical of service settings, specific arrival times are essentially random, but the overall arrival pattern for a shift can be modeled mathematically based on the mean of arrivals.
Log-normal distribution of dining times. The log-normal distribution, with a longer right tail, tends to better fit the dining duration data. This skewed distribution reflects the fact that some parties like to linger over their meal.
Following the peak demand period, demand had a ramp-down period of an hour, during which the party arrival rate decreased linearly.
No limit on the number of parties that could be waiting. Under this assumption, any lost business would result from customers’ waits exceeding their tolerance.
Parties would wait up to their individually specified tolerance and then depart if they had not been seated. In other words, the simulation does not allow customers to depart immediately if quoted a wait time that exceeded their tolerance.
Random variation in each party’s willingness to wait for a table, with a mean determined by the party’s size (as described earlier) and a coefficient of variation of 0.20.
Random variation in the spending for individual parties, with a mean given by the party’s size (as described earlier) and a coefficient of variation of 0.25. While I am unaware of any studies that report this metric, the value I use falls within the range of coefficients of variation in spending of 0.15 and 0.30 used in one of my earlier studies (Thompson and Sohn 2009).
Random variation in the dining duration for individual parties, with a mean determined by the party’s size (as described earlier) and a coefficient of variation of 0.30. This coefficient of variation falls within the range of 0.16 to 0.50 reported in the literature (Bell and Pliner 2003; Kimes and Robson 2004).
Simulation Process
The process I followed in conducting the simulation experiment was as follows. For each of the 2,592 combinations of factor levels, I generated and stored simulated customer characteristic information for one hundred days of operation, which is equivalent to a year’s worth of demand data where there are two peak meal periods per week (such as Friday and Saturday evenings). In each scenario, I used the stored data to search for the best table mix for each of the nine seating rules using a heuristic and recorded performance metrics for the best table mix I found. I used a search heuristic because the number of table-mix combinations made it impractical to find the optimal table mixes. In a study with Sheryl Kimes, I found that a properly created heuristic was nearly optimal, that is, attaining revenue within 0.2 percent of the optimal table mix (Kimes and Thompson 2005). Since this simulation uses a similar heuristic, I am confident that the differences I observe in performance are a result of the effectiveness of the a particular seating rule, rather than the search procedure itself.
For each of the nine assignment rules, I recorded the following metrics: average daily revenue, average daily lost revenue (from customers who depart before being served), the best mix of tables, and average wait times by party size. While one could focus on minimizing the amount of business lost, the search heuristic attempts to maximize the revenue achieved (though either approach should, in fact, yield similar results).
Results
The blended rules worked best, as shown in Exhibit 7, which presents the average daily revenue results measured relative to the top-performing table-assignment rule, Blended-SzWt. Following the blended rules, those relating to longest wait were next in revenue and then those seating the largest waiting party. Letting customers choose their own table (self-managed) was least effective and was easily trumped by the best rule (Blended-SzWt), which yielded more than a 1-percent revenue increase compared with a self-managed wait list. However, restaurant size has a great influence here, as I discuss next. Loose right-sizing was better than no right-sizing (pure rules), which, in turn, was better than tight right-sizing.
Overall Performance, by Table-Assignment Rule.

Note. SzWt = size–wait; ExpLs = expected loss.
Relative to the average daily revenue of Blended-SzWt.
Restaurant size affected the revenue outcome for many of the seating rules, as shown in Exhibit 8. Exhibits 8 through 12 illustrate the revenue performance of the nine table-assignment rules at the various factor levels. In all of these figures, the vertical axis is measured relative to the average daily revenue generated by the best-performing rule (Blended-SzWt). There are eight key results illustrated in Exhibit 8. First, most of the rules perform better with larger restaurants. Second, tight right-sizing is affected by restaurant size and performed poorly in small restaurants. Third, the Blended-ExpLs rule was little affected by restaurant size, performing closely to Blended-SzWt in all restaurant sizes. Fourth, of all the rules, longest-loose and longest-tight came closest to matching the performance of Blended-SzWt but only in the large restaurants. Fifth, the self-managed rule performed within 1 percent of the best rule in the largest size restaurant. Sixth, most of the rules performed more poorly with non-proportional table sizes than they did with proportional table sizes and (seventh) that included tight right-sizing but not (eighth) the Blended-ExpLs, which was little affected by non-proportionality of tables.
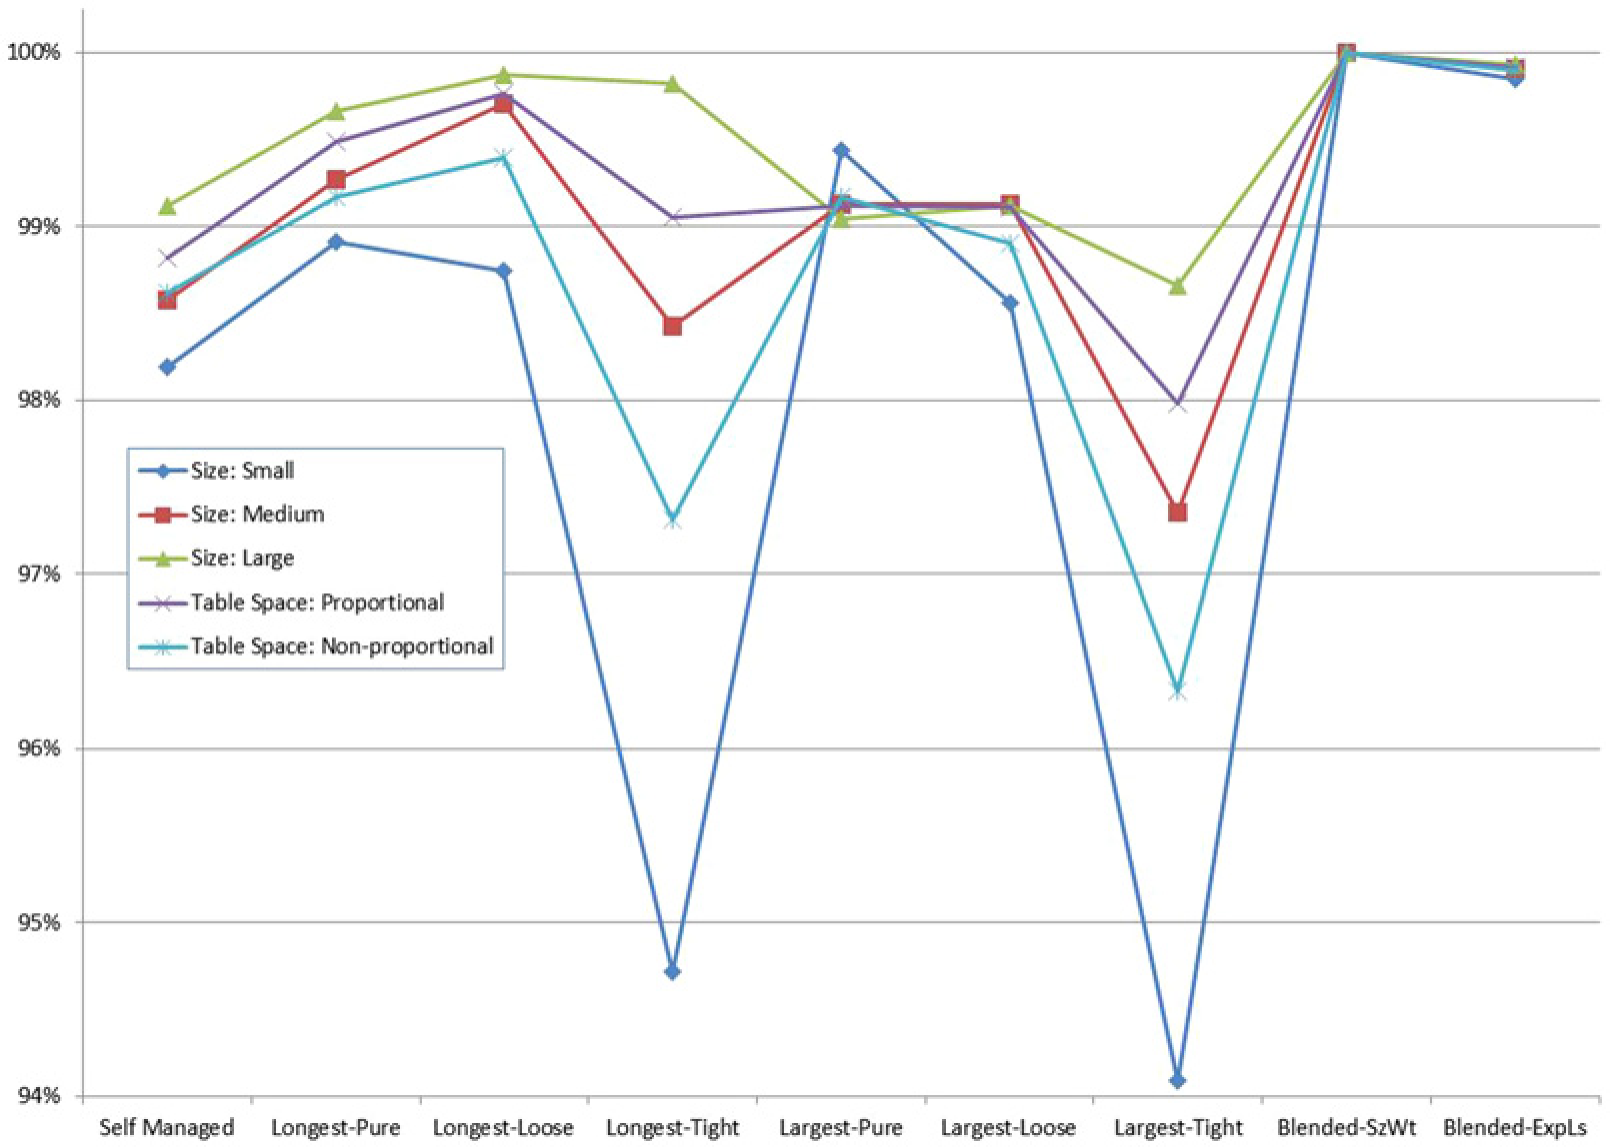
Performance of the Table-Assignment Rules, by Restaurant Size and Table Space Proportions.
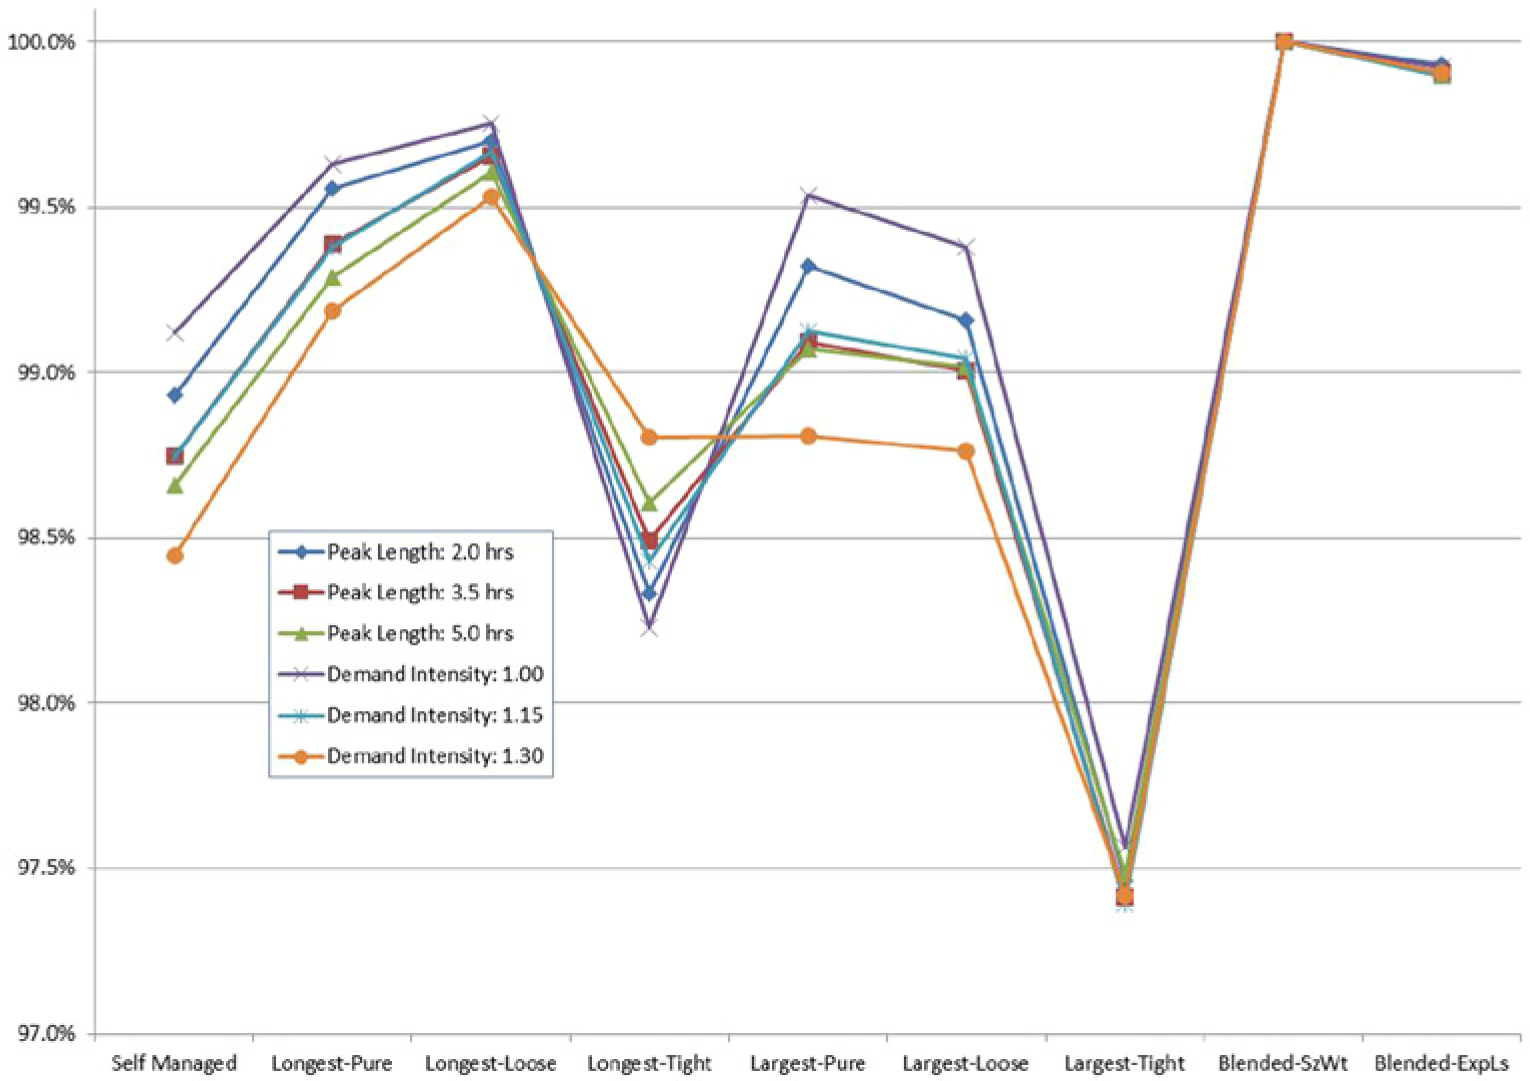
Performance of the Table-Assignment Rules, by Peak Demand Length and Demand Intensity.
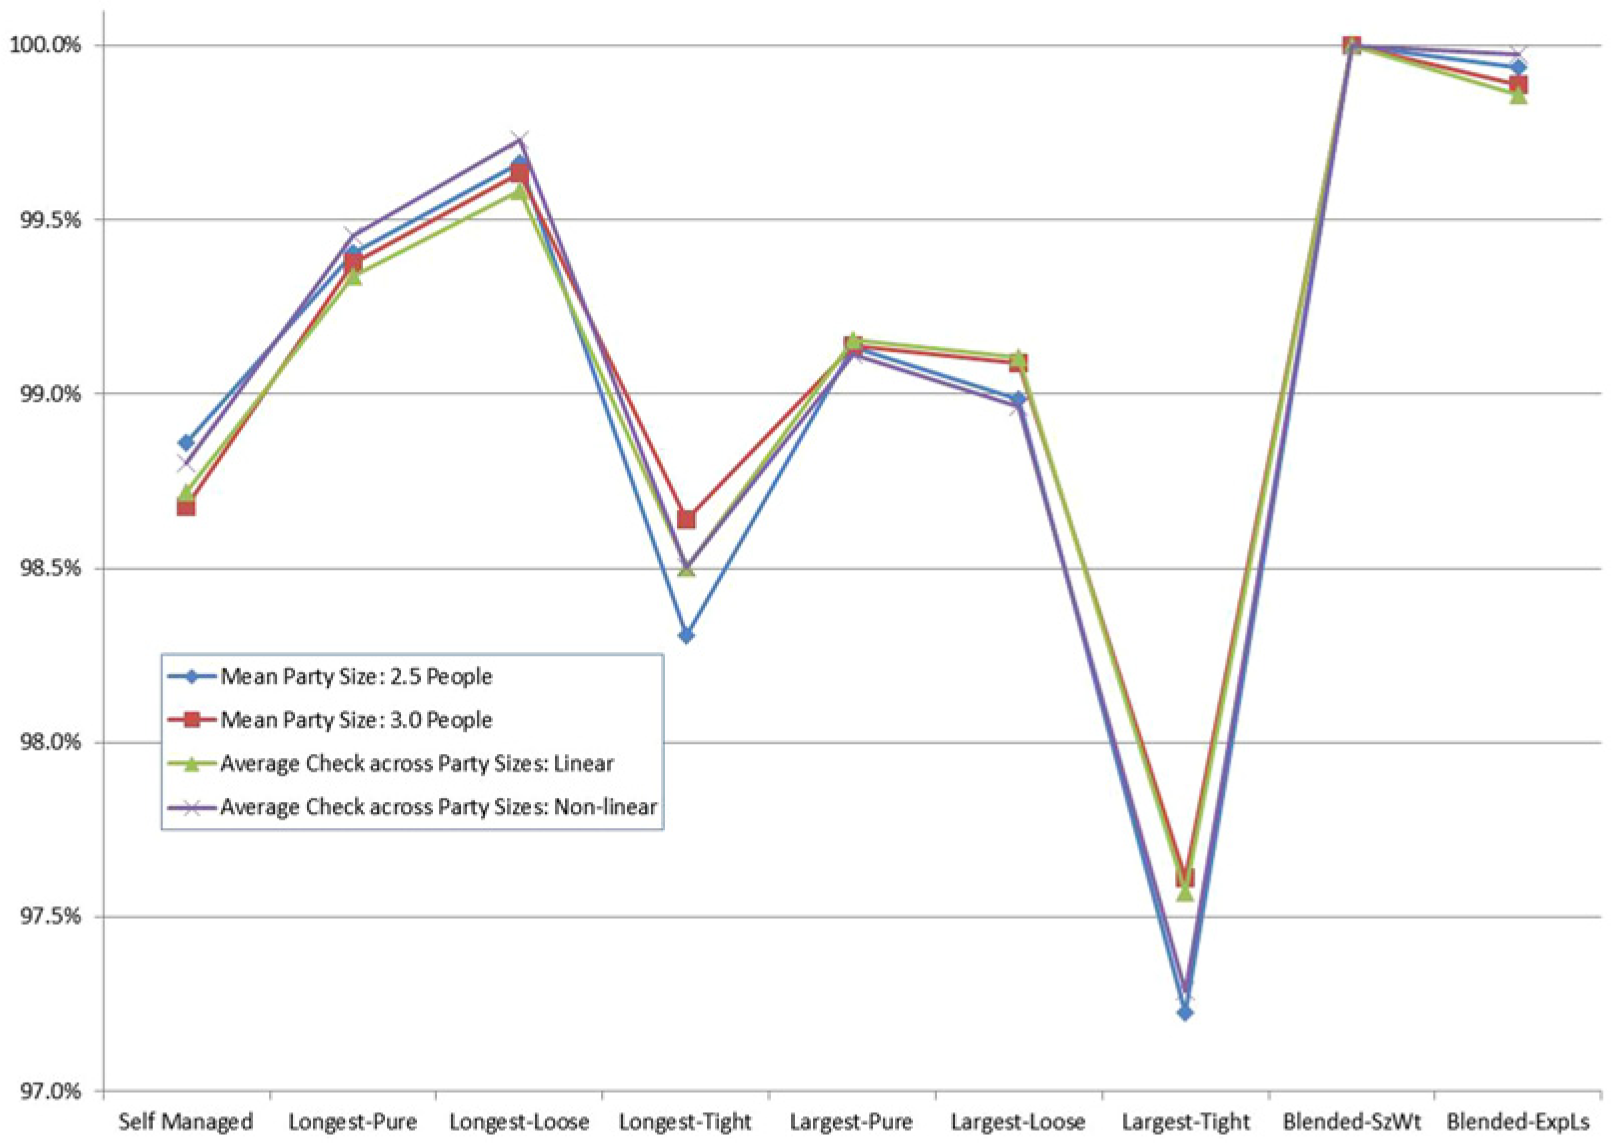
Performance of the Table-Assignment Rules, by Mean Party Size and Average Check Variation across Party Sizes.
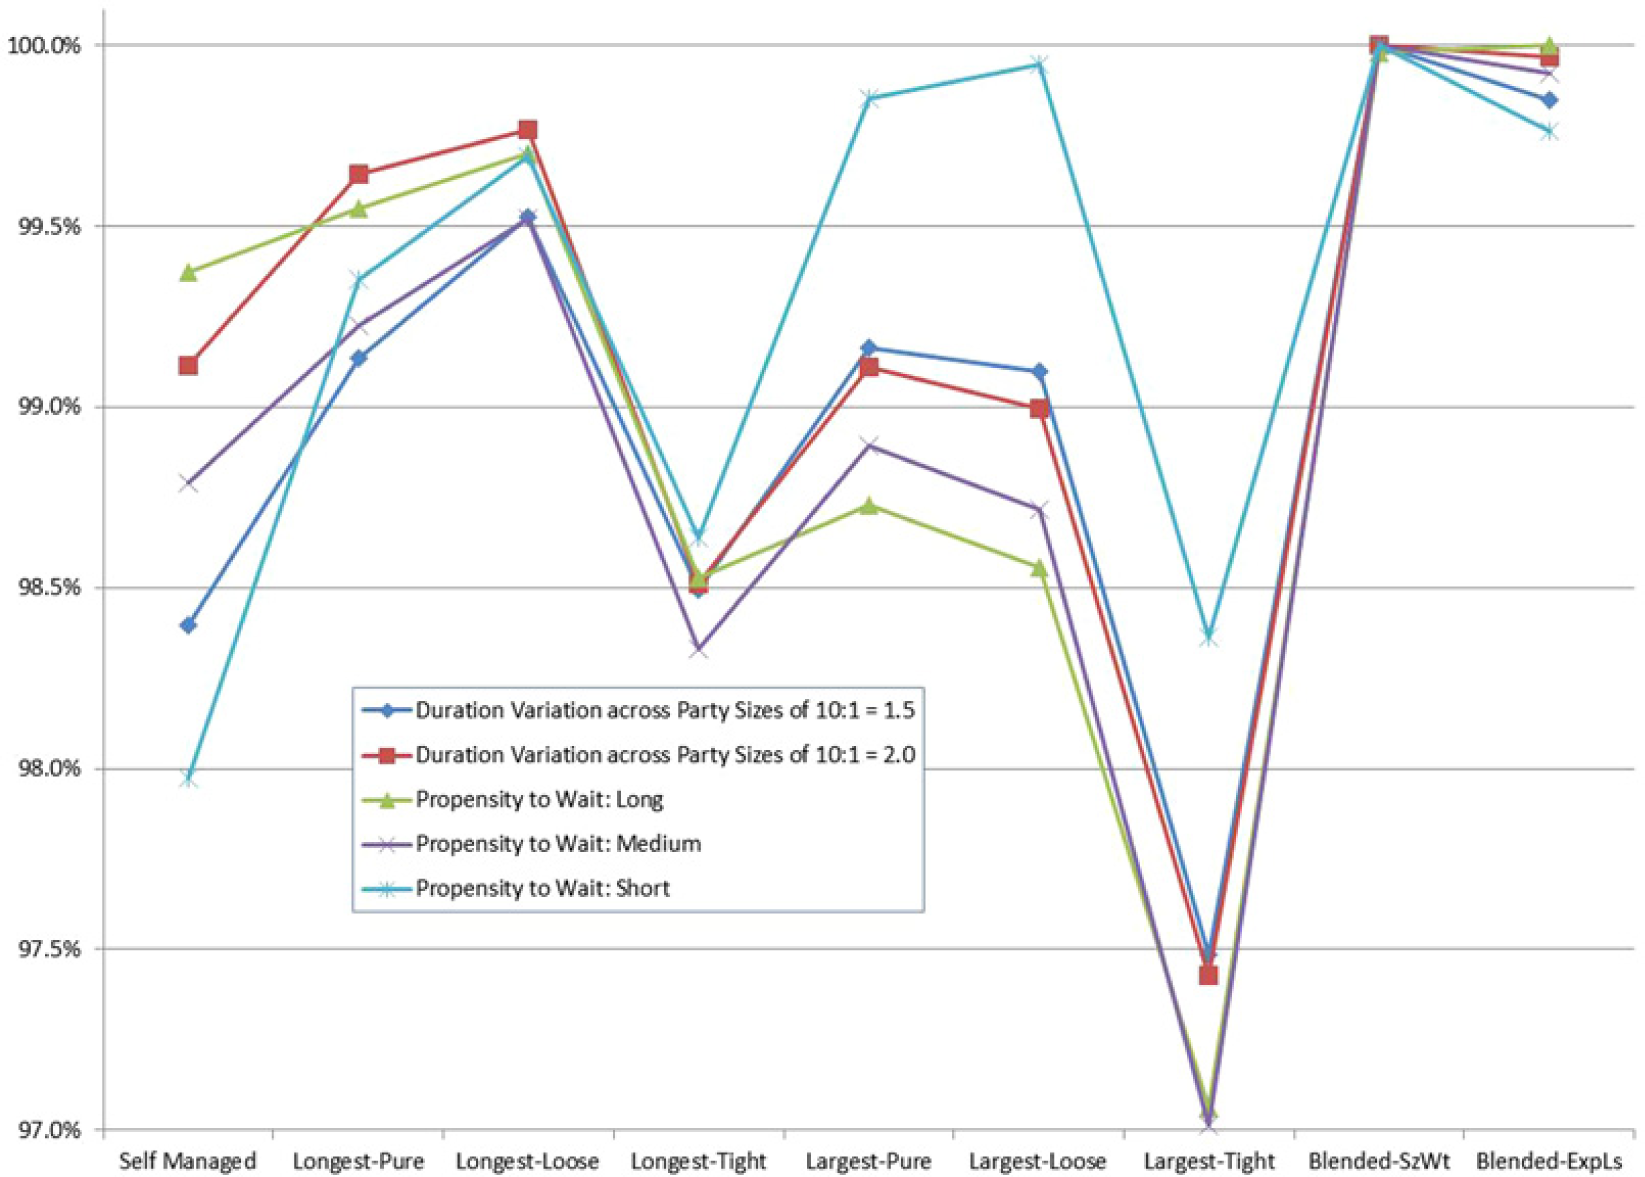
Performance of the Table-Assignment Rules, by Duration Variation across Party Sizes and Propensity to Wait.
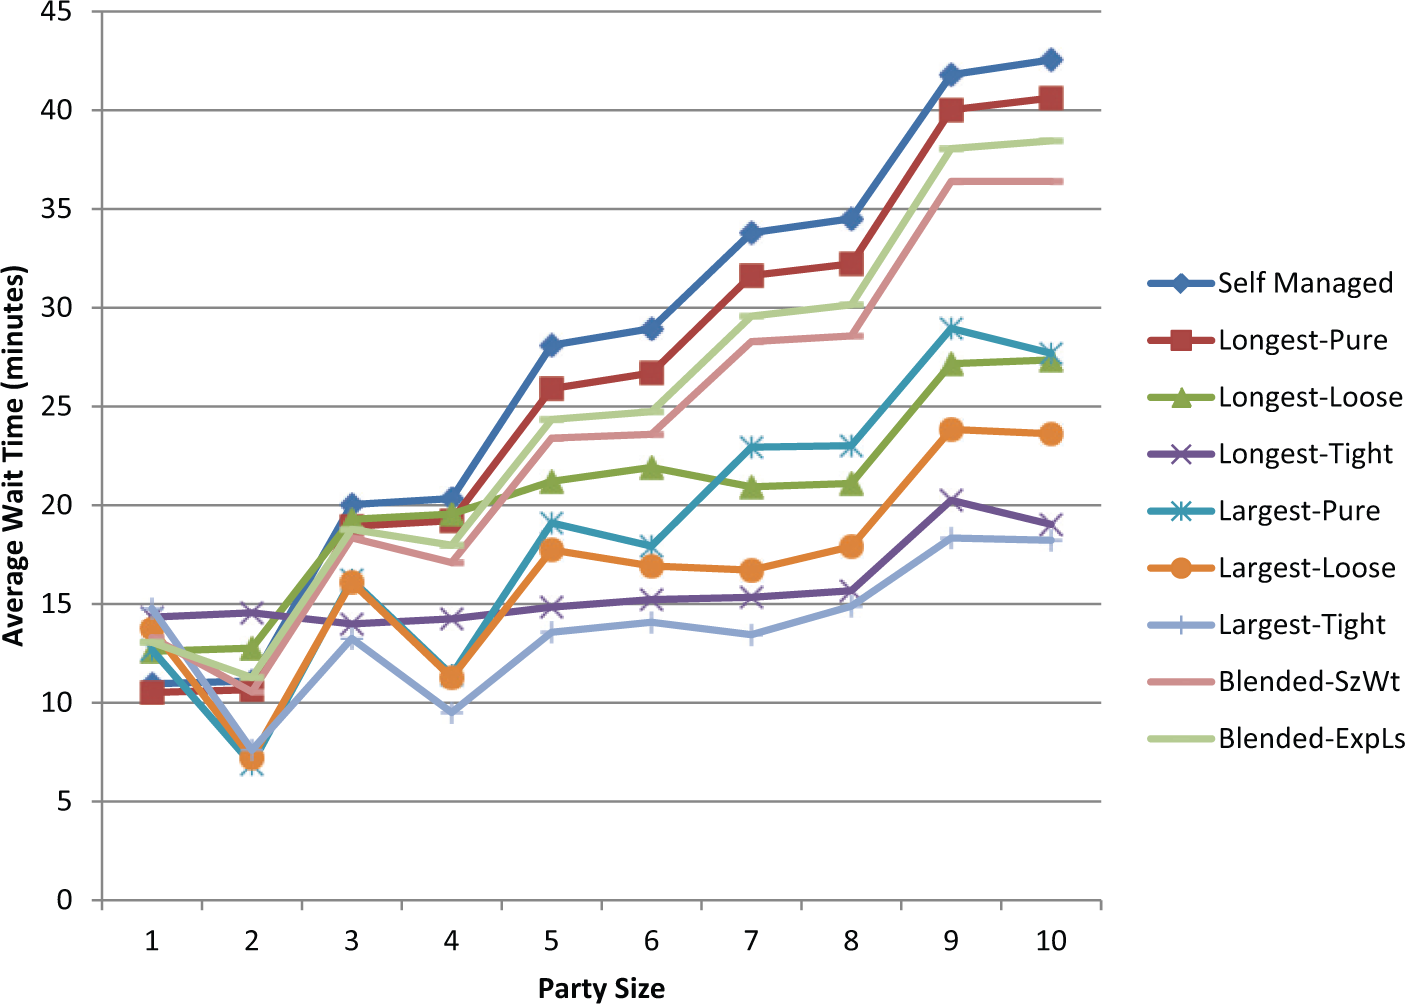
Average Wait Times, by Party Size, for the Table-Assignment Rules.
The results with respect to peak dining length and to demand intensity are mixed, as illustrated in Exhibit 9. Some rules performed relatively better with shorter peaks, others with longer peaks, while the Blended-ExpLs was robust for all three levels of peak demand. Other than longest-tight, all the rules performed better with lower demand intensity than with higher demand intensity. The performance discrepancies across the levels of demand intensity were particularly pronounced for largest-pure, and again for self-managed.
The results for the rules by mean party size and by variation in the average check across party size also were mixed (as shown in Exhibit 10). Large-tight, large-loose, and longest-tight all performed relatively better with the larger mean party size. In contrast, self-managed, longest-pure, longest-loose, and Blended-ExpLs performed relatively better with the smaller mean party size. The largest-pure and Blended-SzWt rules had the most consistent performance for the two party sizes. All three rules based on seating the largest party performed better when the average check declined linearly as party size grew; all other rules performed better with a non-linear decline in average check. The smallest discrepancies in performance were for the longest-tight and Blended-SzWt assignment rules.
Exhibit 11 illustrates rule performance by dining duration variation across party sizes and by customers’ willingness to wait. While the three largest-based rules did better with smaller duration variation, all the others did better with the larger duration variation. The largest-tight and Blended-SzWt approaches performed the most consistently on both levels of duration variation. Willingness to wait shows the most dramatic performance differences for the rules across various levels of any of the experimental factors. The largest-based rules all did much better with short wait tolerance than at the medium or high wait tolerances. Longest-tight was also best under the low wait tolerance, while longest-pure, longest-loose, Blended-ExpLs, and self-managed all did best under the longest wait tolerance. I particularly wanted to note the performance of the self-managed approach, which performed progressively better as wait tolerance increased. As with other experimental factors, Blended-SzWt had robust and consistent performance across the range of wait tolerances.
Average waits by party size for the nine seating policies are illustrated in Exhibit 12. Since some cherry-picking occurs at higher customer intensities (Thompson 2011a), whereby the restaurant turns away the parties of nine and ten, the results in Exhibit 12 reflect only the instances where the parties are being served. Several observations can be made from Exhibit 12. First, average waits increase as party sizes increase. That should not be unexpected, given that the experimental conditions are such that larger parties are willing to wait longer for tables. Second, several of the seating policies provide better service (shorter waits) to even-sized parties than to odd-sized parties—the three largest-based rules are notable in that regard. Third, the longest-tight rule would probably be considered the fairest rule in that the wait increases little as party size increases, and it is little affected by whether the party is even- or odd-sized. Fourth, the self-managed rule shows the greatest increase in waiting time as party size increases. Fifth, the top-performing seating rule from an economic perspective—Blended-SzWt—shows notably increased wait time across party sizes but provides better service to parties of two (rather than one) and four people (rather than three). This is the result of the way this rule calculates the priority of parties.
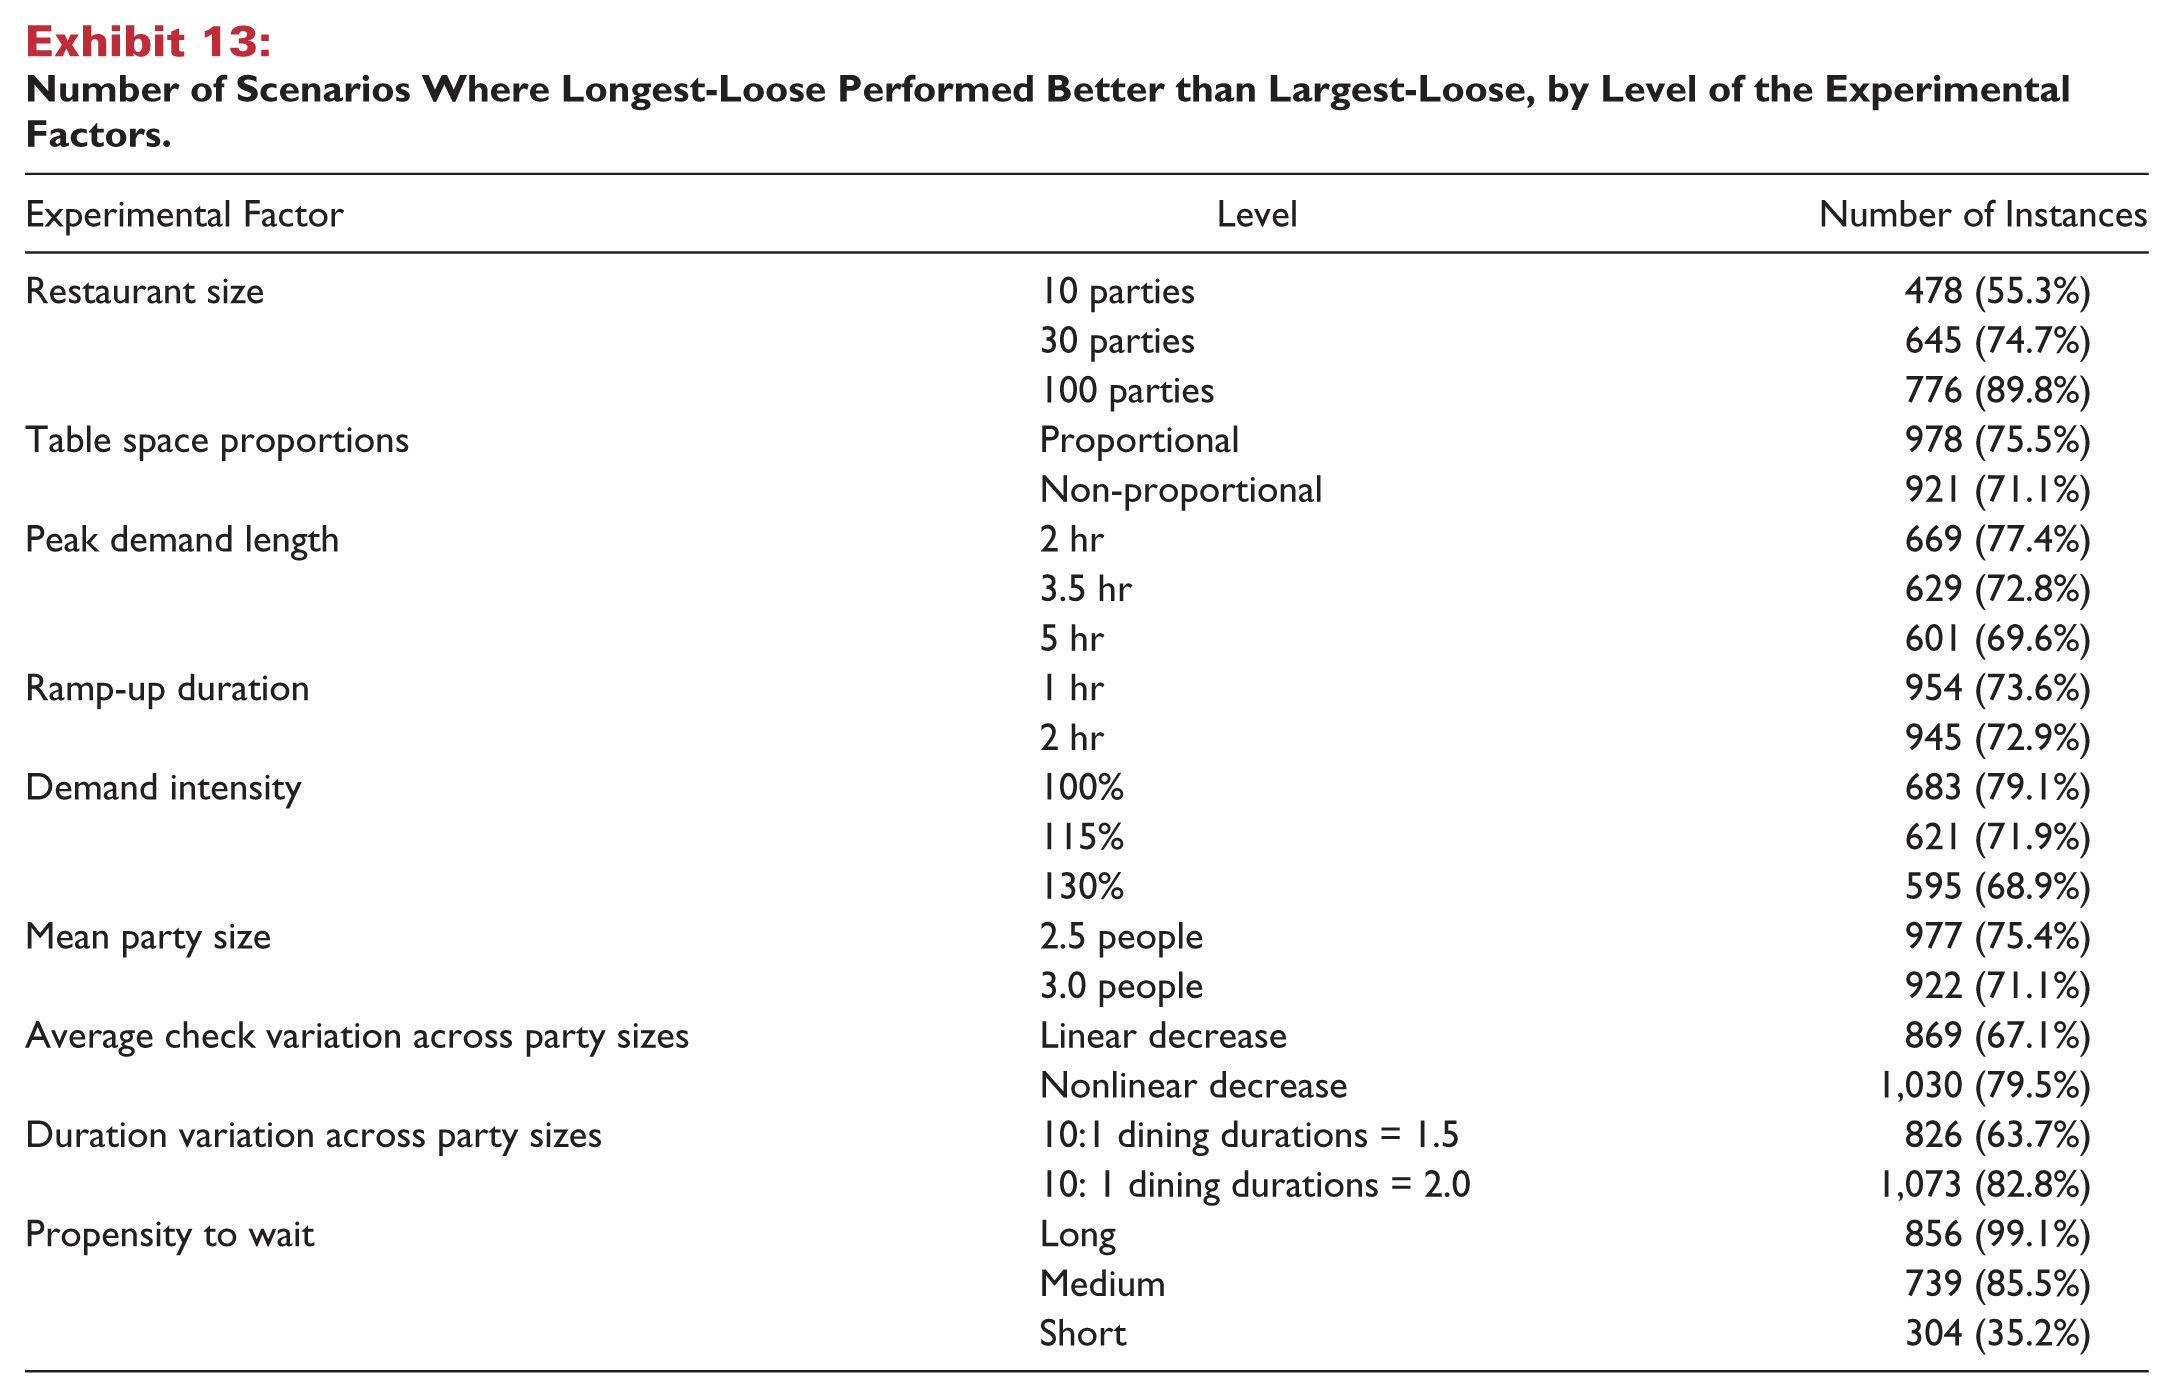
The results reinforce the approach of the majority of surveyed F&B managers who use a “longest” rule, since longest-loose yielded the highest revenue in 73.2 percent of scenarios, as compared with largest-loose, which was reported by about one-fifth of responding restaurateurs. Exhibit 13 provides details by level of the experimental factors. Longest-loose more frequently generated higher revenue than largest-loose, across all levels of all factors except for the shortest propensity to wait. Longest-loose’s advantage was higher with the following factor levels: larger restaurants, proportional space requirements for tables, shorter peak demand periods, shorter ramp-up durations, lower demand intensity, smaller mean party size, the non-linear decrease in average per-person checks across party sizes, greater variation in dining durations across party sizes, and longer propensities to wait. However, the opposite conditions returned a different result, as the largest-loose policy yielded higher revenue than the longest-loose rule in 140 of the 144 scenarios with the smallest size restaurant, as well as lower variation in dining durations across party sizes, and lowest propensity to wait.
Number of Scenarios Where Longest-Loose Performed Better than Largest-Loose, by Level of the Experimental Factors.
To test my hypotheses, I ran a regression model, with a dependent variable of the revenue yielded by each table-assignment rule measured relative to the revenue of the self-managed rule. The results of this regression, which had an adjusted R2 of .499, are presented in Exhibit 14. Hypothesis 1—that longest would be better than largest—was generally supported, with longest-loose and longest-pure both performing better than either largest-pure or largest-loose, and with longest-tight performing better than largest-tight. Hypothesis 2—that largest and longest would be better than self-managed—was also generally supported, with the exception of longest-tight and largest-tight, which both performed more poorly than self-managed. Finally, Hypothesis 3—that the blended rules would be best overall—was supported.
Regression Results for Revenue Measured Relative to the Revenue of Self-Managed.
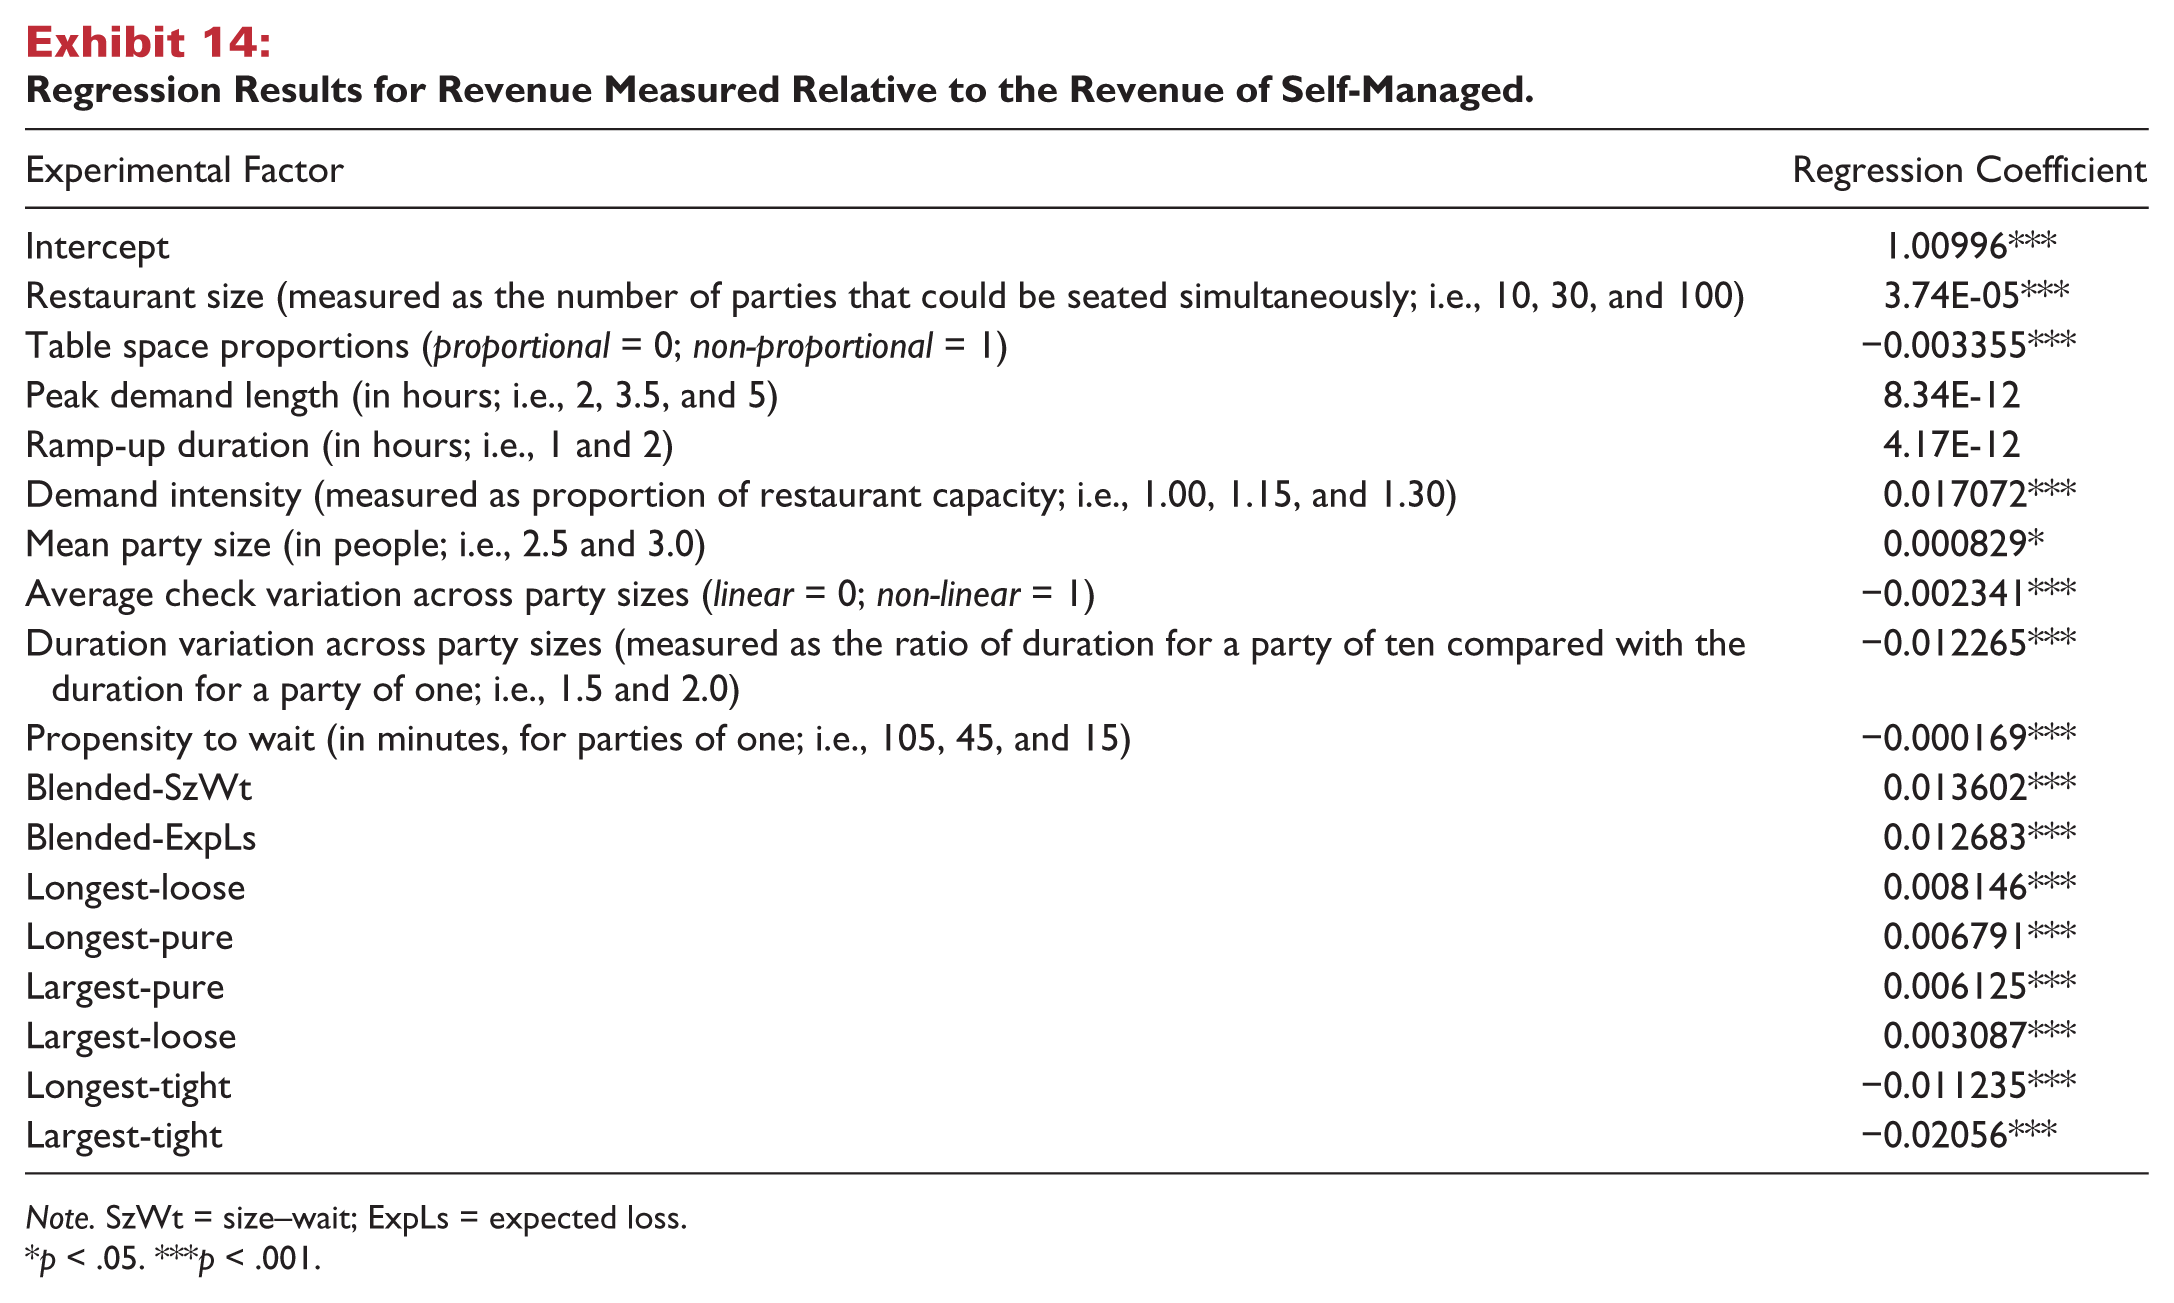
Note. SzWt = size–wait; ExpLs = expected loss.
p < .05. ***p < .001.
Discussion
My finding that tight right-sizing was not as effective as loose right-sizing confirms my results in an earlier study (Thompson 2011b). Apparently, a requirement of no more than one empty seat per table is just too restrictive, given the variation in customer demand. This explanation is consistent with the steep decline in performance of the tight right-sizing seating rules as restaurant size shrinks (see Exhibit 8). My earlier study (Thompson 2011b) did not examine pure right-sizing, as I have done here, and I think these findings are of merit. These results showed that loose right-sizing was as good as pure right-sizing for a largest party rule and better than pure right-sizing in a longest wait approach. My explanation is that while some flexibility is good (i.e., loose right-sizing is better than tight right-sizing), too much flexibility can be counterproductive in that it allows parties to be seated at tables with too many empty seats.
As I outlined above, the approach of blending party size and wait time (Blended-SzWt) performed the best throughout the simulation, yielding higher revenue than the other eight rules under every level of every experimental factor. This supports the approach reported by more than one-quarter of my survey respondents. Comparing the two simple rules used most commonly in the industry, that is, longest wait and largest party, seating the longest waiting party proved better close to 75 percent of the time. As I noted, however, there are conditions under which it is better to assign parties by size (particularly when customers have a low propensity to wait), which may well explain the use of that rule in practice.
There are interesting implications for allowing customers to seat themselves. Across all wait tolerances, there was about a 1-percent revenue bump from using Blended-SzWt over self-managed approaches. Using some simple assumptions, and the average increase in revenue given by Blended-SzWt compared with the self-managed rule, the revenue bump provided by using a host or hostess to assign parties to tables is not large (Exhibit 15). The modest revenue increase would mean that restaurateurs should use considerations other than incremental revenue in making the decision to control table assignments. Such considerations would include whether having customers select a table is consistent with the overall service level provided by the restaurant. Since restaurants that provide high levels of service also typically have much higher average checks, the economics may also favor managed table assignments in these restaurants. Obviously, this revenue analysis would be different if customers had other likelihoods of selecting particular party sizes (i.e., different probabilities than reported in Exhibit 3), or with different values of the parameters reported in Exhibit 15.
Incremental Revenue of Blended-SzWt Relative to Self-Managed across All Wait Tolerances and the Low Wait Tolerance Case. a

Note. SzWt = size–wait.
For a party size of 2.5 people, two table turns, an average check of $10.00 per person and a contribution proportion of 0.333.
Since the performance of having customers seat themselves was notably affected by their willingness to wait (see Exhibit 11), I repeated the calculations in Exhibit 15 for only the case where customers had a low wait tolerance. Here, the revenue bump of using Blended-SzWt was more than 2 percent compared with the self-managed approach. As reported in Exhibit 15, the economic benefit of managing table assignments is more positive, even with the low average check used in the calculations. Certainly with large restaurants, the economics would favor managed table assignments.
As an extension to this study, it would be interesting to evaluate the performance of a rule that applied loose right-sizing to the Blended-SzWt, since the loose right-sizing was effective in both the largest and longest rules. I expect any improvement to be modest, however, given the overall effectiveness of the Blended-SzWt rule.
Conclusion
This paper examined different approaches for assigning walk-in parties to tables in restaurants. My survey of restaurateurs identified two prominent, simple rules: longest—assigning an open table to the party waiting the longest and largest—assigning an open table to the largest party that fits. However, when I tested variations of these two rules in a broad simulation-based study, the best rule proved to be a blended rule that considers both party size and waiting time. Interestingly, as I noted above, over one-quarter of my survey respondents were using blended assignment rules that considered both party size and waiting time.
There are several implications for practice from my findings. First, if one wishes to implement the best rule, it clearly is Blended-SzWt. However, applying such a rule would require a real-time ranking system for parties, because a party’s rating moves up as the length of wait increases. The requirement of a real-time calculation may be impractical for many restaurants. Second, if one wishes to apply a simple, yet high-performing rule, one should select the longest-loose, except if customers’ wait tolerance is low, when largest-loose is the better rule. Clearly, fairness is higher with longest, as that follows a FIFO queue protocol, while the largest rule can lead to different service levels across party sizes, with even-sized parties being seated more quickly than odd-sized parties (see Exhibit 11). Third, loose right-sizing—allowing a party to be seated in the smallest table that fits or the next larger table—proved better than tighter right-sizing and also better than no right-sizing at all. I believe the reason for this is the reduced flexibility that comes with tight right-sizing. As reported by McGuire and Kimes (2006), restaurant patrons generally view right-sizing favorably, though some education of customers as to the restaurant’s policies may be warranted.
Based on some back-of-the-envelope calculations, in many restaurant environments, the economics may favor a customer-managed table assignment, rather than an employee-managed queue. However, self-managed table assignment is only congruent with lower service levels. It is hard to envision customers picking their own tables in a Michelin three-star restaurant, for example.
I see several implications of my work for future research. First, as I noted earlier, I think it is likely that applying loose right-sizing to the Blended-SzWt would result in a modestly superior rule. Second, because Blended-SzWt has some elements of unfairness in customer service (for small, odd-sized parties), it is possible that a modified version of the rule could still yield superior economic performance but increase fairness. Third, having established a top-performing table-assignment rule, it is possible to tackle the issue of being able to estimate waits for customers. Fourth, given that about 60 percent of restaurants in my survey took both customer reservations and walk-in customers, more research integrating seating policies for these two customer types is desirable.
Footnotes
Declaration of Conflict of Interest
The author(s) declared no potential conflicts of interest with respect to the research, authorship, or publication of this article.
Funding
The author(s) received no financial support for the research, authorship, or publication of this article.