
Abstract
An analysis of financial ratios for 601 hotels finds that room revenue, rather than occupancy, is the strongest driver of both departmental expenses and revenues for food, beverage, and other income. The study, which provides updated benchmarks for projecting fixed and variable components of hotel financial performance, finds that hotels generally became more efficient during the study period, 2001 to 2012, with the result that the fixed portion of many expenses declined. These lower fixed expenses appear to be reflected in lower capitalization rates for hotels because expenses are a factor in the risk level of an investment. While hoteliers may wish to use this regression methodology to develop their own analysis, the benchmarks presented are in many cases substantially different from past findings. As examples, the analysis found fixed departmental expense percentages as follows: rooms, 36 percent; food and beverage, 29 percent; and other income, 25 percent. Surprisingly, certain undistributed operating expenses that were considered to be largely fixed also have a substantial variable aspect. Thus, just 33 percent of administrative and general costs were fixed for this sample, as were 29 percent of marketing costs and 33 percent of utilities expenses.
Keywords
To project the future operating performance of an existing or proposed hotel, most prognosticators want to analyze both fixed and variable costs (Rushmore and Baum 2001). This approach makes sense because most expenses have two components, one that remains relatively stable regardless of operating volume and the other that moves almost directly with the operating volume of the facility (Rushmore and Baum 2001). It is important for hoteliers to understand the extent to which revenues, expenses, and net income are fixed versus variable because such quantities are used to project future performance. For example, in the spreadsheet models used by most major international hospitality consulting firms, the fixed and variable portion of each line item (i.e., expense) is an item of required input.
Despite the importance of understanding fixed and variable costs in hotels, little empirical research has been conducted to determine the extent to which different costs tend to be fixed and which are variable. The goal of this study is to address that gap by improving existing heuristics and offering a more scientific, contemporary calibration of a well-used hotel revenue and expense forecasting model. We will provide practitioners with actual figures that they can apply when forecasting the future financial performance of hotels. In so doing, we hope to improve the accuracy of projections of financial performance of proposed hotels. Also, by using the largest available database of actual hotel financial statements, we provide benchmarking information to practitioners allowing comparison of the performance of actual hotels to similar properties. As a result, operators and analysts can use the information contained in this article to analyze how the performance of a given hotel varies from typical performance.
Literature Review
Cost behavior is considered one of the most important pieces of profitability analysis for managers to understand. The traditional model of fixed and variable costs is integral to cost-volume-profit (CVP) analysis in the managerial accounting literature (Garrison and Noreen 2002). Given the importance of incorporating cost behavior in predicting performance, it is surprising that few empirical studies have examined the forecasting ability of models that are established to recognize the relationship between cost and sales. One of the exceptions to this gap in the literature was conducted by Banker and Chen (2006), who posit that a model that is based on cost behavior is a better predictor of performance than models that consider only the line items in the financial statements. Other studies examined the effectiveness of forecasting earnings from external reporting measures such as earnings forecast models that use line items from the income statement (Fairfield, Sweeney, and Yohn 1996; Lipe 1986), on accounting signals that are produced from financial statements (Ou and Penman 1989), or on accruals and earnings of cash flow components (Sloan 1996). Banker and Chen (2006) used an approach inspired by the management accounting tradition, which suggests that earnings consist of components proportional to sales trends. The method that was used by Banker and Chen (2006) was motivated by cost behavior models, as those models recognize sales as being the largest factor driving both profit and variable costs and assume variable costs should move with sales.
According to Cooper (2000), fixed costs are set in the short run. However, overhead may fluctuate over time as product lines or customer bases expand and diversify. Increasing customer segments increases operating costs but not always at a rate that is comparable to the additional revenue of the new customers (Enz, Potter, and Siguaw 1999). Hotel type can also influence the ratio of fixed to variable costs; for example, budget motels often operate with above average fixed costs (Rushmore and Baum 2001). Rushmore (1997) suggested that the fixed to variable cost ratio is important to determine the break-even point for hotel performance, and he also articulates that profitability grows rapidly with occupancy beyond that break-even point. Rushmore’s argument is that occupancy raises profitability at a rate that increases faster than the variable cost rate, so every occupancy point that is achieved beyond the break-even point produces larger gains for the hotel than the previous occupancy point achieved. Rushmore and Baum (2001) and Rushmore illustrated how important it is for hotels to understand the fixed to variable cost ratios. Hesford and Potter (2010) also called for more empirical research to be conducted to determine how costs behave at particular hotels.
Budgets in hotels have not historically been highly flexible, and they typically are not adjusted throughout the year even as conditions change (Kosturakis and Eyster 1979; Schmidgall and DeFranco 1998). However, there is a lack of recent research evaluating this concept. Many hospitality financial managers believe that the budget should be a benchmark to determine how the property is being managed (Schmidgall and DeFranco 1998). In addition, hotel accountants view budgets as a planning tool. Chan and Au (1998) observed that product costs are often inaccurate, and they suggest that more research should be conducted in the cost area of hospitality operations. A better understanding of costs could be a way for accountants and others to use budgets as both a planning tool and as a way to measure the hotel’s performance.
Labor costs are both large and highly variable. Hotels operate under conditions in which the variability in demand greatly influences labor needs (Baum 1995; Guerrier and Lockwood 1989). Labor has also been identified through the Uniform System of Accounts for the Lodging Industry (American Hotel and Lodging Educational Institute 2006) as a major expense. One managerial tactic to lower labor costs is through flexible work arrangements, which are particularly common in housekeeping departments and match their paid labor force to changing market conditions (Gramm and Schnell 2001; Voudouris 2004). Hotel managers perceive this flexibility in workers as a variable cost (Soltani and Wilkinson 2010). Hotel managers view flexible work arrangements, as defined by Rimmer and Zappala (1988), as the ability to hire and terminate staff to meet market demand conditions and as a cost-effective control mechanism for the large variable cost in hotels (Soltani and Wilkinson 2010).
For hotel managers to be able to project their labor needs and for them to be able to address anticipated reduced business volume with reduced labor costs, they need valid mechanisms for estimating the extent to which such costs are fixed and variable because labor comprises both fixed and variable cost components. The Shamrock Organization (Handy 1989) argues that labor can be divided into three segments like the leaves of a shamrock. One of the leaves represents the core staff (permanent and full-time), while the second represents contractors, and the third is flexible workers (part-time or temporary). Using Handy’s (1989) Shamrock Organization as a framework, one can see how a housekeeping department would have both fixed and variable costs in its labor expense. For example, regardless of occupancy, a hotel would staff a minimum number of housekeepers, supervisors, and public space attendants, which represent the fixed cost. The variable labor cost becomes evident in the additional staff that is scheduled due to occupancy above what the minimum staffing levels can service. Many expenses in hotels incur both this fixed and variable component. For example, the fixed and variable aspect of electricity consumption is easy to visualize as the lights in the lobby, corridors, and other public spaces must always be on, but guest room lights would generally only be on when the rooms are occupied. Chan (2005) posited that the two significant factors explaining the variability in electricity costs for hotels are occupancy and outdoor temperature.
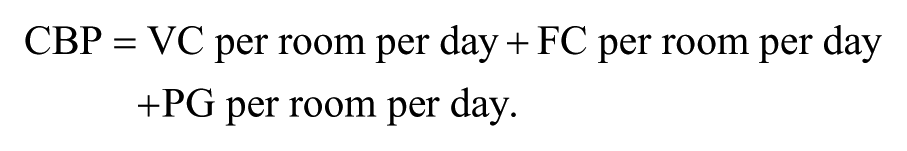
As David Chilton (1997) expressed, a dollar saved is two dollars earned. In general, Marn and Rosiello (1992) found that a 1 percent reduction in variable costs contributes to profit improvement of 7.8 percent and that same reduction in fixed costs contributes to a profit improvement of 2.3 percent. In addition to improved profit margins due to reductions in costs, recent pricing strategies in hotels are considering the cost component of the sale. One of the simplest models (cost-plus pricing) adds a profit goal to the cost of the product (Kotler, Bowen, and Makens 2002). Kim, Han, and Hyun (2004) suggested a pricing model for hotels that is consistent with the CVP logic that Banker and Chen (2006) used and that is based on fixed costs (FC), variable costs (VC), and the profit goal (PG) for the day as a cost-based price (CBP) formula as follows:
Understanding the ratio of fixed and variable costs in each department of a hotel can be effective in projecting the hotel’s performance. Rushmore and Baum (2001) were able to index the typical ranges of the fixed and variable cost percentages of hotels based on their professional experience; however, there is no evidence that empirical tests of these ratios have been carried out. It is important to understand what are fixed and what are variable costs, given that Enz and Potter (1998) claimed that many hotel operating costs that have traditionally been viewed as fixed are actually variable and influenced by occupancy. The ratio of fixed and variable expenses is critical to hotel forecasting spreadsheet models that are used by appraisal firms, hotel companies, investors, lenders, and developers (Rushmore and Baum 2001).
Summary of Research Project
The method for this research project was to analyze actual hotel financial statements by running multiple regression analyses resulting in formulas as a starting point for forecasting future financial performance of hotels using the fixed and variable approach.
Summary of the Problem
When conducting a discounted cash flow analysis on a hotel asset, each of the line items of the financial statement must be projected for the holding period (typically ten years). The fixed and variable forecasting approach is suitable because revenue and expense items tend to vary with operating volume as measured by occupancy, food and beverage revenue, other income, or total revenue.
According to Rushmore and Baum (2001), the fixed and variable ranges that should be considered for hotel financial projections are presented in Exhibit 1.
Historical Estimates of Fixed and Variable Expenses.

As can be seen from the table, the range can vary up to 40 points for a given line item, yet a prognosticator needs to select a single number. What differentiates 50 percent fixed food revenue from a decision to use 10 percent? What is needed is a reliable indicator to narrow the range.
The Fixed and Variable Approach
A fixed and variable component model projection can be made by taking a known level of revenue or expense and calculating its fixed and variable portions. In the approach used by most analysts, the fixed component is then increased in tandem with the underlying rate of inflation, whereas the variable component is adjusted for a specific measure of operating volume, such as total revenue.
Using the fixed and variable forecasting methodology, with the assumption that rooms expenses are linked to occupancy, the following example demonstrates the fixed and variable method to estimate rooms expense in Year 1:

Adding 3 percent inflation to the first projected year:

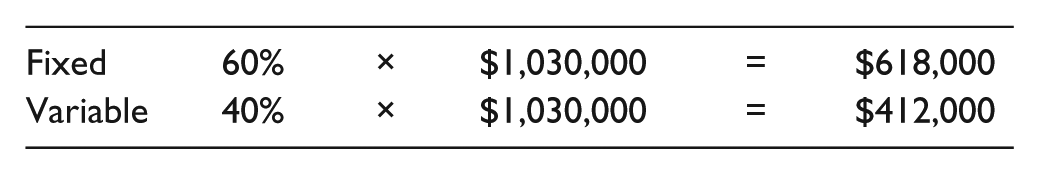
Calculating the fixed and variable portions of the inflated rooms expense using a 60–40 allocation:
Dividing first projected occupancy from previous year to calculate an adjustment index:

Applying the adjustment indexes to each of the fixed and variable components to project the rooms department expense:

This methodology would continue for each of the line items on the financial projections for all the years of the holding period (typically ten years).
Operating History Regression Methodology
We ran numerous regression analyses between two line items on operating histories to calculate both the fixed and variable components on a set of dependent variables. The dependent variables included all the hotel line items discussed by Rushmore and Baum (2001) that were not 100 percent fixed or 100 percent variable. The independent variables included all of the revenue line items, occupancy, and hotel characteristics provided by the data sources as outlined in Exhibit 2.
Variables Studied.

The data set included annual financial statements from 601 hotel properties that had a minimum of seven consecutive years of reporting financial data between 2001 and 2012. Within the data set, 510 of these properties were branded and the remaining 91 were independent.
The following data are reported for each regression analysis:
Dependent variable,
Independent variable,
R-squared (regression coefficient),
Adjusted R-squared,
Standard error,
F statistic,
p,
Slope,
Beta, and
Dependent intercept.
The fixed component of the property was calculated by taking the Y intercept of the dependent variable and dividing it by its mean. Afterward, the regression data set was analyzed and the mean R-squared (regression coefficient), mean fixed component, p, and standard deviation were used to interpret the results. Regressions with a p > .05 were discarded for not being statistically significant. Finally, the average regression coefficient for each of the independent and dependent variable combinations were sorted in a table by regression coefficient to identify the strongest predictor for each of the dependent variables.
Because 601 properties were included in the data set, we could analyze more specific independent variables to consider whether property characteristics such as function space and brand affiliation influence the dependent variables. The following property characteristics were analyzed in a pivot table to determine whether they yielded statistically different results from the larger data set:
Brand affiliation,
Room count,
Meeting space size—square footage,
Number of meeting rooms,
Number of food and beverage outlets,
Food and beverage outlet type,
Corridor type, and
Location.
The number of properties for each hotel brand is presented in Exhibit 3.
Brands Studied.
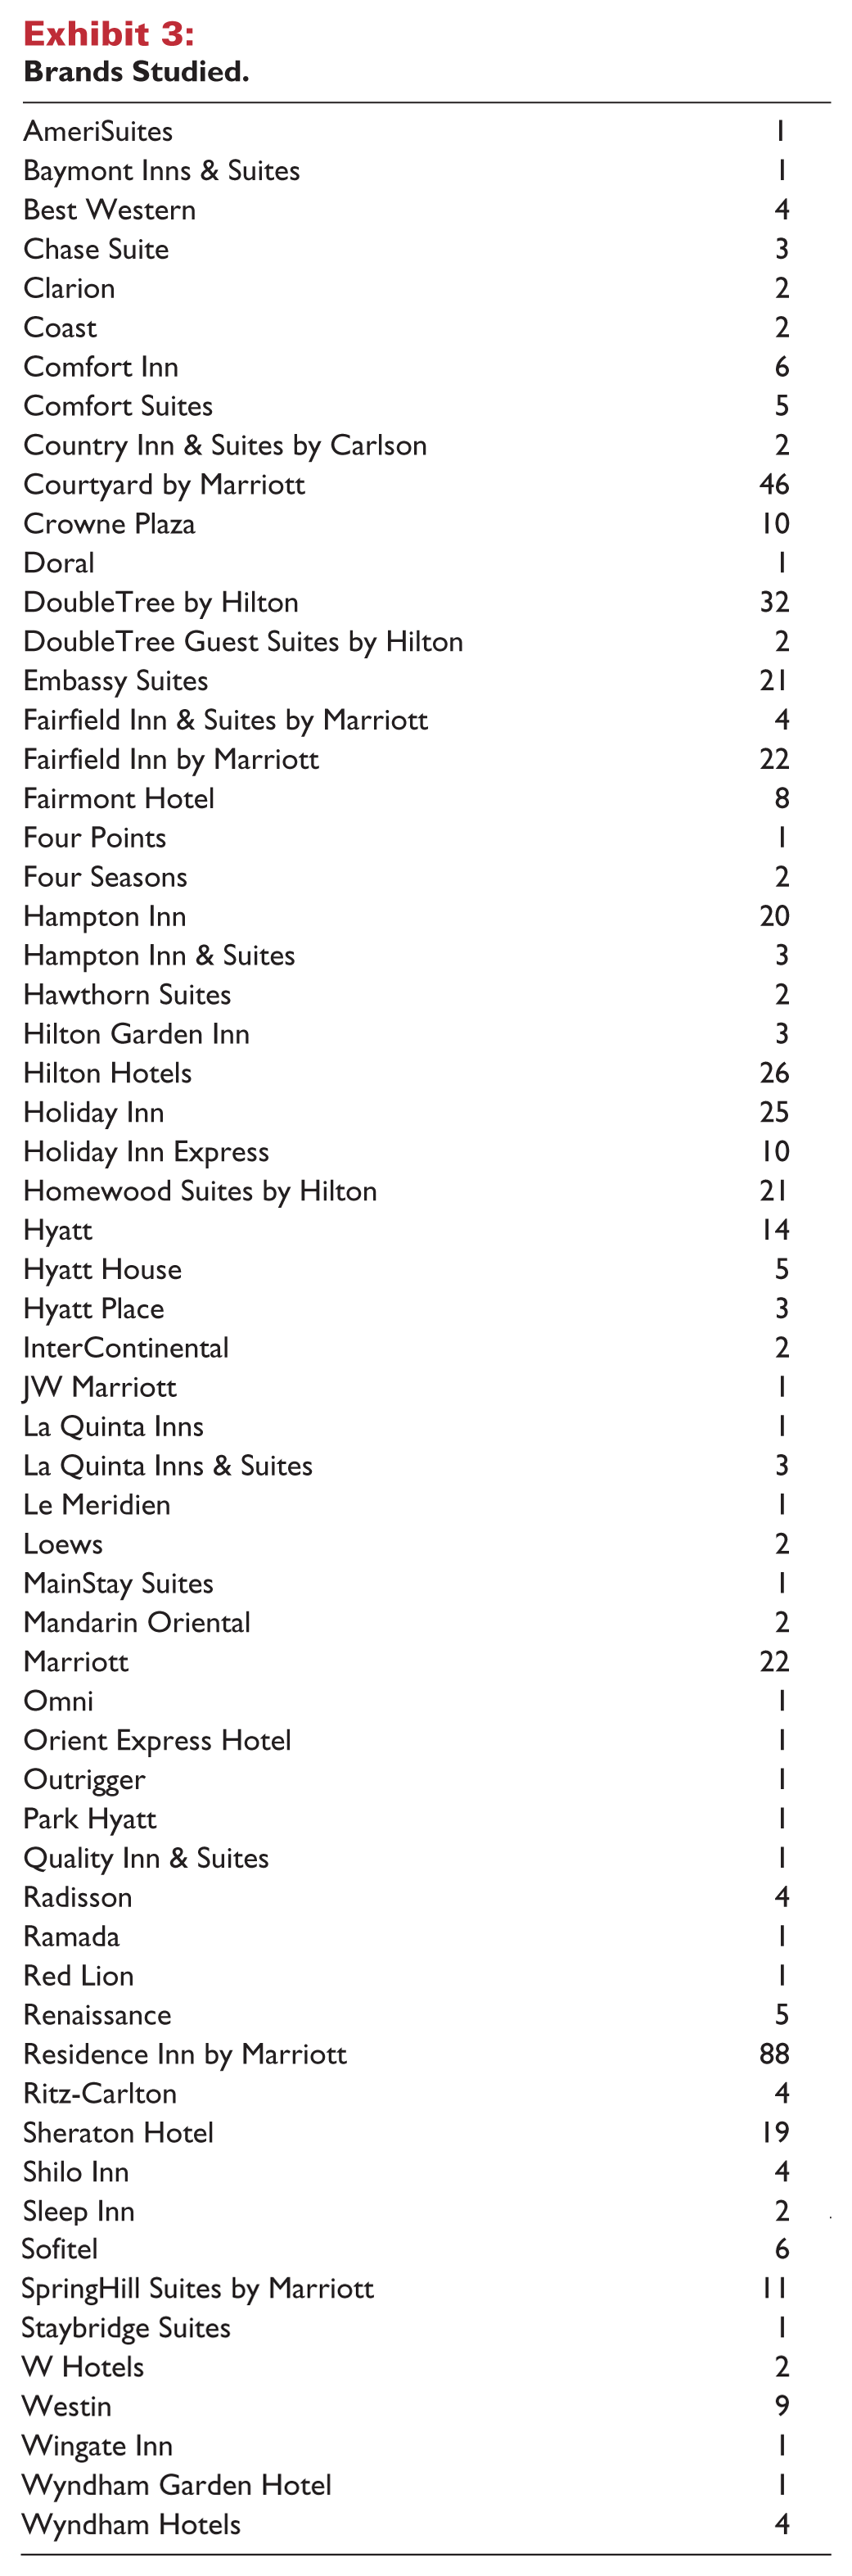
As shown, the hotels are a diverse mix of full-service, select-service, and limited-service properties located throughout the country.
Operating History Regression Results
Exhibit 4 details the results from the regression analyses. The highlighted rows are the recommended dependent–independent variable pair. Alongside the results are the Rushmore and Baum (2001) “Valuation Book” recommendations.
Regression Analysis Results.
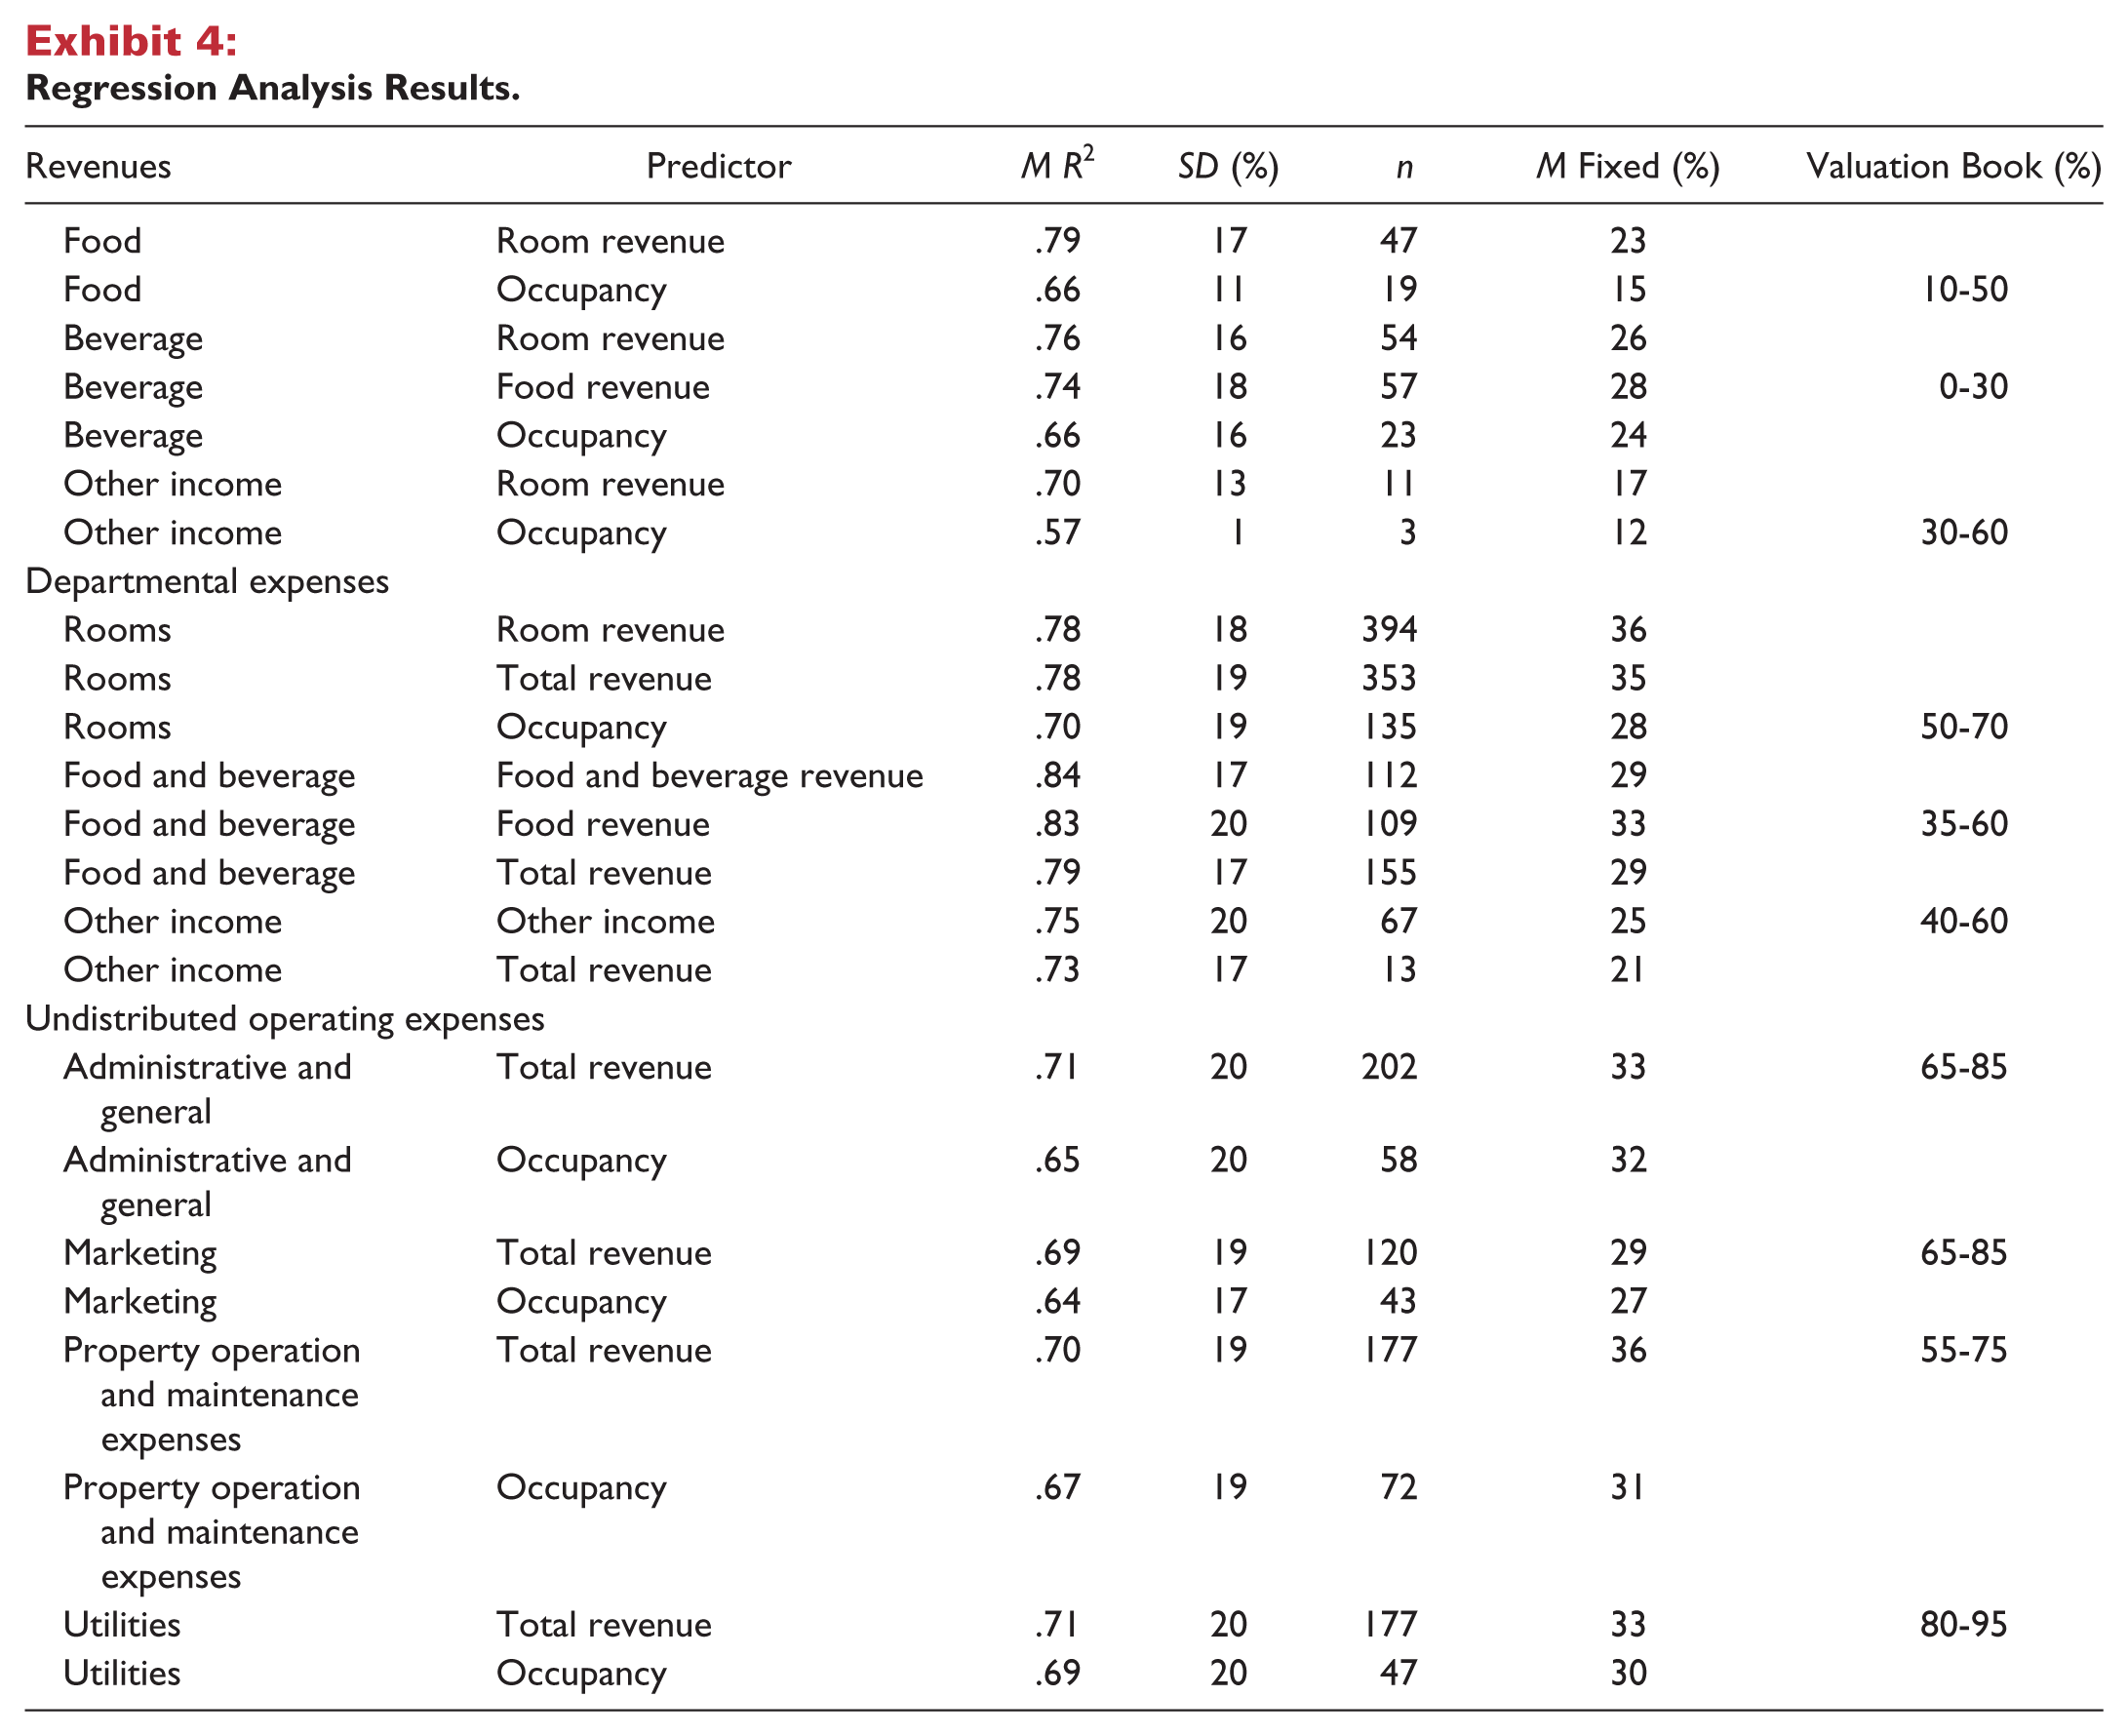
One of the interesting outcomes of the study is that all of the recommended fixed percentages for the expense items are lower than what was previously presented by Rushmore and Baum (2001). It may therefore be concluded that hotel operators have become more adept at controlling expenses with the ebb and flow of seasonality and hotel cycles—particularly during economic down cycles. Revenue and yield management tools are becoming increasingly sophisticated and more widely used, and this trend may have resulted in a reduction in fixed expenses over the past ten years.
Another insight was that all sources of revenue, including food, beverage, and other income, were more closely aligned with room revenue than occupancy, contrary to what has been commonly accepted in the hotel industry.
Regression Results by Segments
We found that these fixed ratios applied across hotel segments. For this analysis, we grouped the properties by various property characteristics: brand affiliation, meeting space size, number of meeting rooms, room count, number of food and beverage outlets, and corridor type (interior vs. exterior). These characteristics were segmented to determine whether the mean regression coefficients from the dependent and independent variables would be higher with the segmented data than with the larger data set.
The segmented approach was expected to yield higher regression coefficients in some scenarios. We thought that the diversity of the total sample coupled with the high standard deviations may result in higher regression coefficients for properties with similar characteristics, such as large conference hotels. Nonetheless, no statistically stronger results were produced as measured by regression coefficients. Therefore, it can be concluded that the fixed ratios presented here may apply to a wide variety of hotels.
Financial Statement Breakdown
The following section provides a detailed breakdown of the regression analysis and an interpretation of the results. The description of the operating statement line items is referenced from the Uniform System of Accounts for the Lodging Industry (American Hotel and Lodging Educational Institute 2006), which is the standard used to aggregate revenues and expenses.
Food Revenue
Food revenue is derived from food sales, including non-alcoholic beverages. When rooms and food are sold at an inclusive price, the appropriate amount is allocated to the food revenue line item.
The results of the regression analysis on the independent variables are presented in Exhibit 5.
Food Revenue Analysis.

The data in this study show there was a significant difference in regression coefficients between room revenue and occupancy as independent variables. The results suggest that when guests are paying more for a hotel room, they will also be more likely to spend more on food.
Conclusion
Room revenue may be the best predictor of food revenue, and approximately 23 percent of this revenue should be considered to be fixed.
Beverage Revenue
Beverage revenue is derived from alcoholic beverages from restaurant, lounge, room service, minibars, and other outlets. Non-alcoholic beverages are included in beverage revenue when the outlet serves no food.
The results of the regression analysis on the independent variables are presented in Exhibit 6.
Beverage Revenue Analysis.

It is not surprising to see similar results as with food revenue because the two are usually paired together. The results suggest that guests are more likely to patronize a hotel bar or room service, which is usually priced at a premium, when they have paid more for a hotel room.
Conclusion
Room revenue may be the best predictor of beverage revenue, and approximately 26 percent of this revenue should be considered to be fixed.
Other Income Revenue
Other income revenue is revenue not obtained from rooms, food, or beverage. It can consist of a variety of different sources including but not limited to
Gift shop,
Business center services,
Telephone,
In-room movie and game changes,
Vending areas,
Space rentals, and
Commissions received from other services.
It is important to note that because of the diversity of items often included in other income, the guidance provided here should be considered general in nature, and therefore the professional judgment of analysts is vital in projecting such revenue. The results of the regression analysis on the independent variables are presented in Exhibit 7.
Other Revenue Analysis.
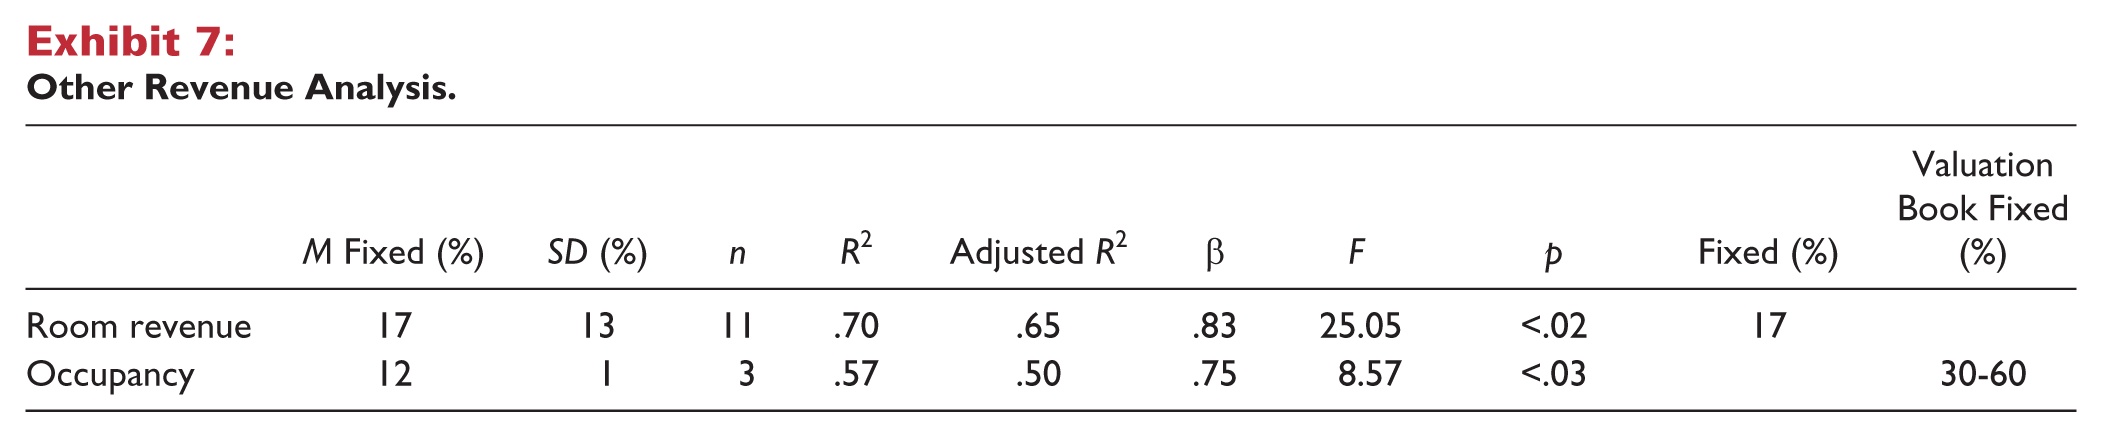
The results were consistent with food revenue and beverage revenue; other income is most closely correlated with room revenue. The results suggest that as guests spend more on the room, they are more likely to pay for other hotel services not obtained from the restaurant or bar.
Conclusion
Room revenue may be the best predictor of other income, and approximately 17 percent of this revenue should be considered to be fixed.
Rooms Expenses
Rooms expenses consist of items related to the sale and upkeep of guest rooms and public space. According to the Uniform System of Accounts for the Lodging Industry (American Hotel and Lodging Educational Institute 2006), rooms expenses include the following:
Salaries and wages including leased labor;
Employee benefits including payroll taxes, payroll-related insurance, pension and other payroll-related expenses applicable to the rooms department;
Cable and satellite television;
Commissions and remuneration paid to travel agents;
Complimentary food and beverage to guests;
Contracted services normally charged to the department but is now outsourced;
Guest relocation costs when they need to be moved to another property because of the lack of available rooms;
Guest transportation;
Laundry, dry cleaning, and linen;
Operating supplies including guest amenities in the rooms, cleaning supplies, printing, and stationery;
Reservation services and a central reservation system;
Telecommunication expenditures directly attributed to the rooms department;
Training materials, supplies, and instructor fees;
The cost of rental, purchasing and cleaning of uniforms; and
Other rooms expenses that do not apply to any of the above.
The results of the regression analysis on the independent variables are presented in Exhibit 8.
Rooms Expense Analysis.
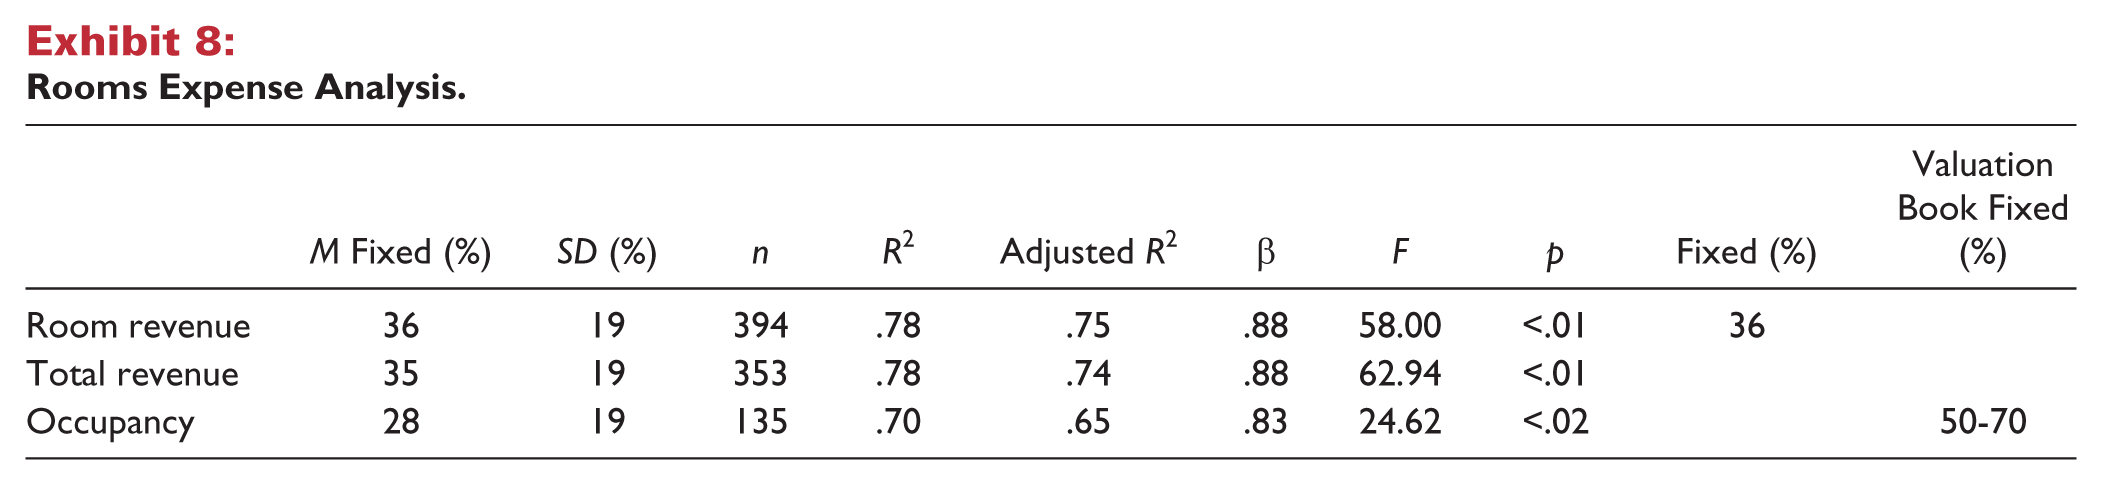
Based on the data used in this study, it appears that room expenses are more closely correlated with room revenue and total revenue than occupancy.
Conclusion
Room revenue may be the best predictor of rooms expenses, and approximately 36 percent of this expense should be considered to be fixed.
Food and Beverage Expenses
Food and beverage expense is associated with the generation of food and beverage revenue in a hotel’s restaurant and lounge outlets, as well as its banquet and meeting facilities.
The results of the regression analysis on the independent variables are presented in Exhibit 9.
Food and Beverage Expense Analysis.
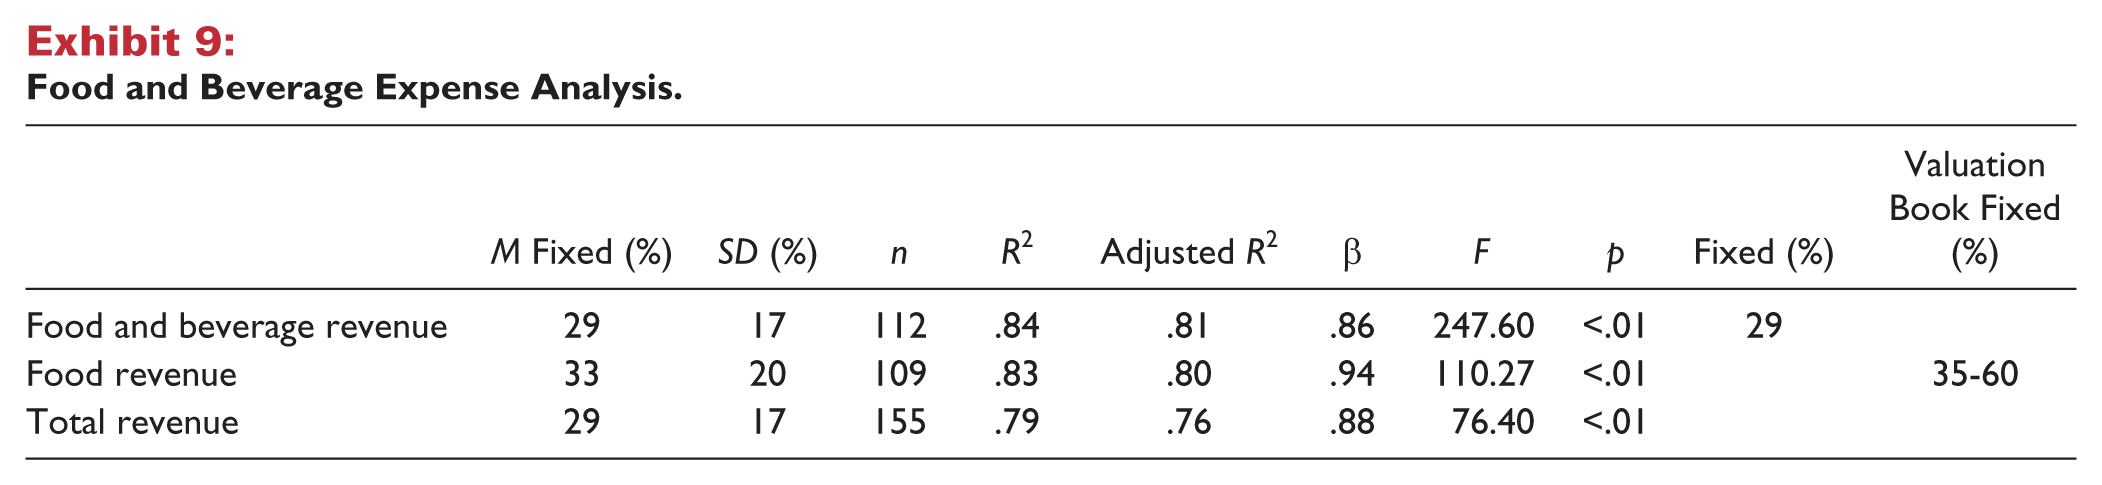
The regression coefficients for food and beverage revenue and food revenue were nearly identical. Because some properties have accounting challenges separating food revenue from beverage revenue, it may be more practical to use the combined food and beverage revenue as a predictor of food and beverage expenses.
Conclusion
Food and beverage revenue is the recommended predictor for food and beverage expenses, and approximately 29 percent of this expense should be considered to be fixed.
Other Income Expense
Other income expense consists of costs associated with other income and is dependent on the nature of the revenue. For example, if a hotel leases its gift shop to an outside operator, the gift shop expenses are limited to items such as rental fees and commissions.
The results of the regression analysis on the independent variables are presented in Exhibit 10.
Other Expense Analysis.
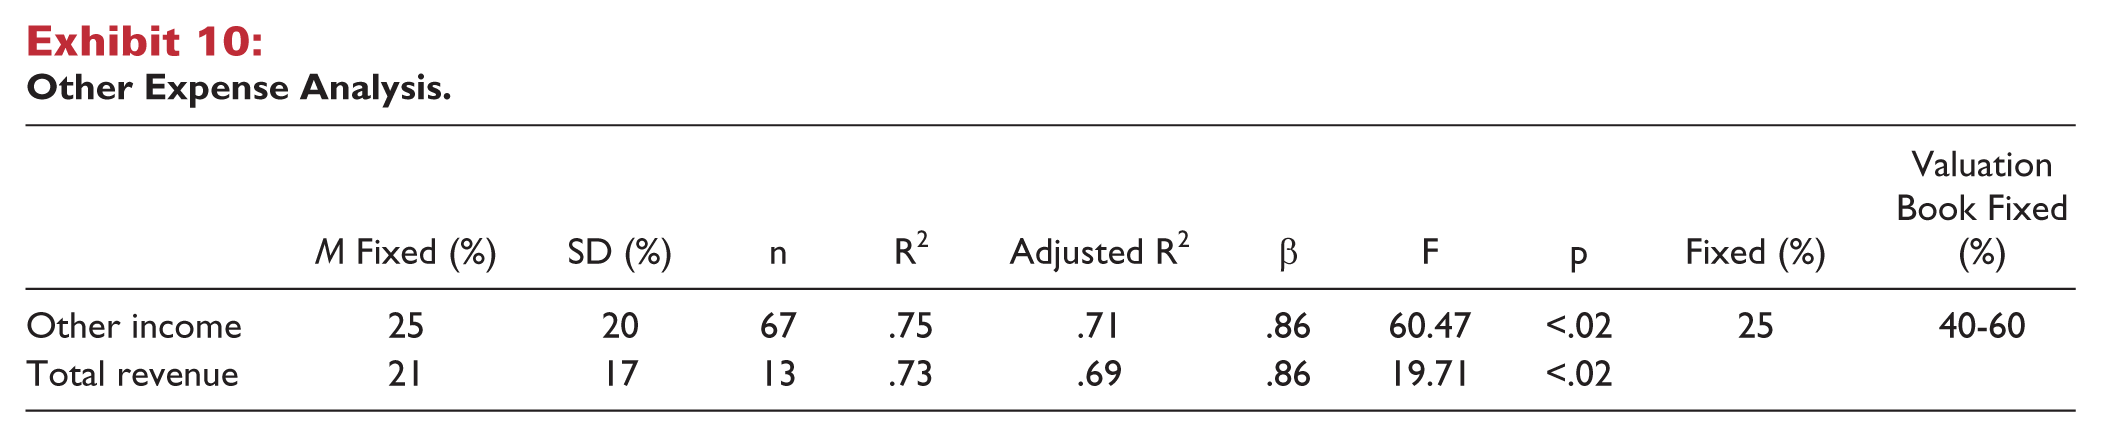
Conclusion
It is logical that other income is the recommended predictor for other income expense, and approximately 25 percent of this expense should be considered to be fixed.
Administrative and General
Administrative and general expense includes the salaries and wages of all administrative personnel who are not directly associated with a particular department, such as general manager assistant general manager and human resources manager. Expense items related to the management and operation of the property are also allocated to this category.
The results of the regression analysis on the independent variables are presented in Exhibit 11.
Administrative and General Expense Analysis.
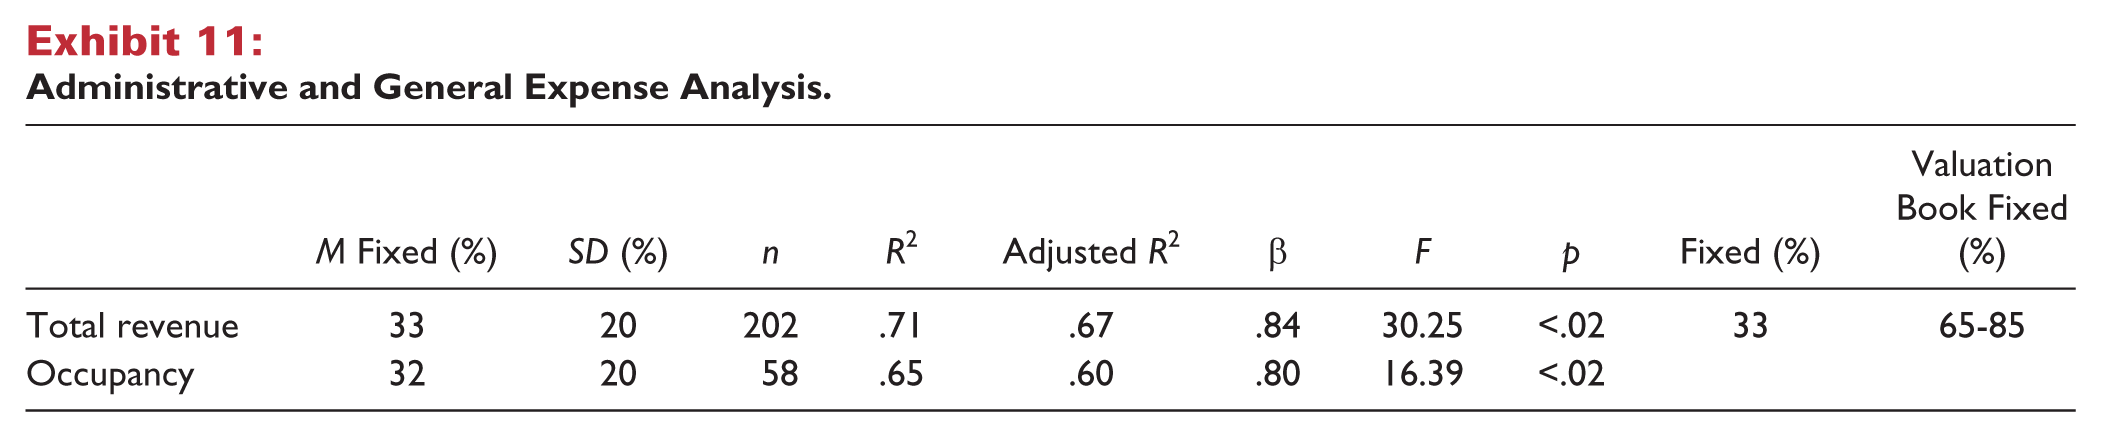
Historically, most administrative and general expenses have been considered to be fixed, but the results of the regression analyses conclude that the fixed ratio is actually below 50 percent. Assuming that the Rushmore and Baum (2001) percentages had historical validity, it can be concluded that hotel operators may be more adept than in the past at controlling administrative expenses with the ebb and flow of seasonality and hotel cycles.
Conclusion
Total revenue is the recommended predictor of administrative and general expenses, and approximately 33 percent of this expense should be considered to be fixed.
Utilities
The utilities consumption of a lodging facility takes several forms, including electricity, gas, oil, steam, water, sewer, other fuels, and utility taxes.
The results of the regression analysis on the independent variables are presented in Exhibit 12.
Utility Expense Analysis.
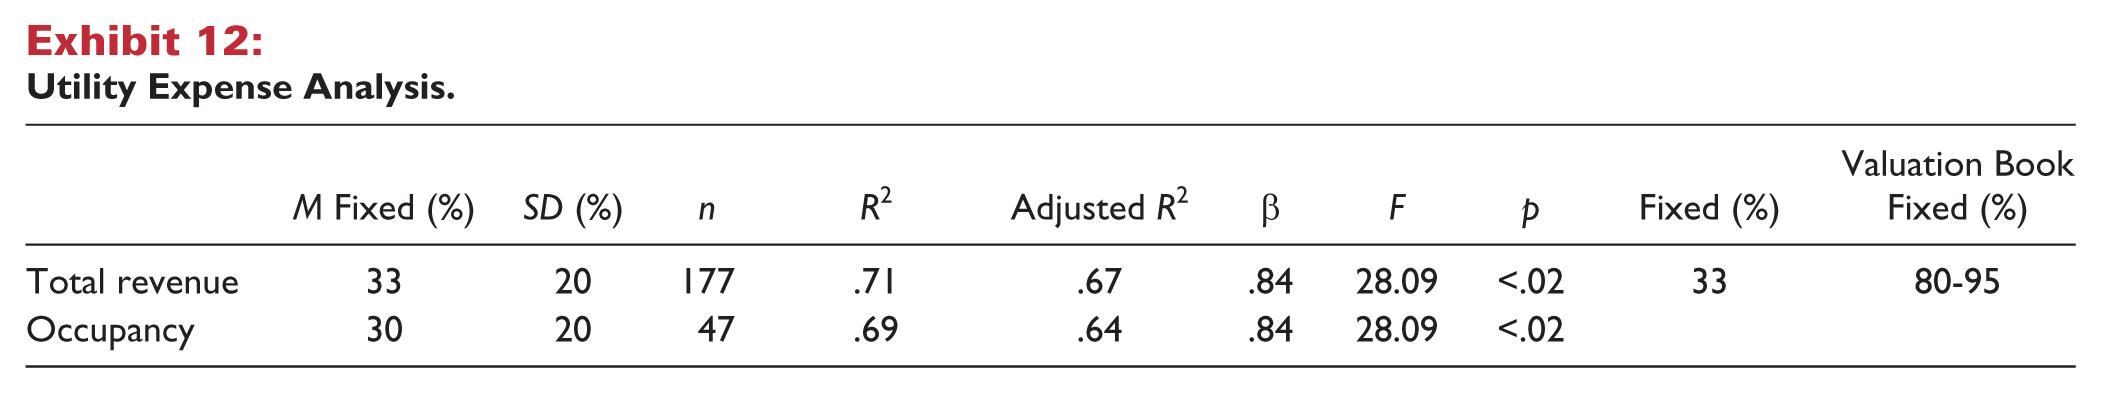
Heating, cooling, and lighting usually represent the largest portion of a hotel’s utilities. Over the past ten years, the hospitality industry has increasingly implemented sophisticated energy-efficient climate control systems in guest rooms, meeting rooms, and public spaces. In addition, many hotel managers have instituted opt-in policies for cleaning linens over multi-night stays and have reduced laundry expenses, in turn, lowering utility consumption. This trend would explain the significant difference in the fixed ratio.
Conclusion
Total revenue is the recommended predictor for utilities expenses, and approximately 33 percent of this expense should be considered to be fixed.
Marketing
Marketing expense consists of all costs associated with advertising, sales, and promotion, including staffing this department; these activities are intended to attract and retain guests.
The results of the regression analysis on the independent variables are presented in Exhibit 13.
Marketing Expense Analysis.
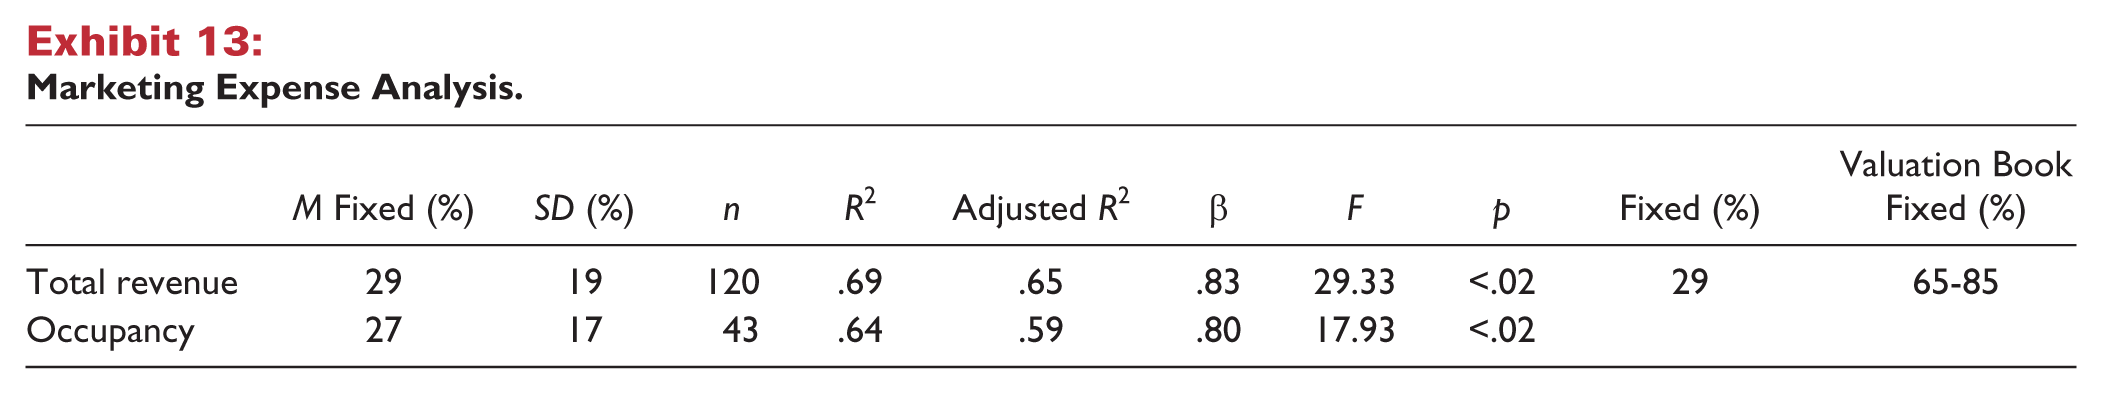
Unlike the other line items on the operating statement, marketing expenses, with the exception of fees and commissions, are totally controllable and should be accurately budgeted. Oftentimes, this budget is calculated with the marketing expenses as a percentage of revenue, which explains why total revenue is the best independent variable.
Conclusion
Total revenue is the recommended predictor of marketing expenses, and approximately 29 percent of this expense should be considered to be fixed.
Property Operations and Maintenance
Property operations and maintenance expense includes the salaries and wages of all maintenance personnel who assist in preventive maintenance and repairs. Expense items related to property operations and maintenance include waste removal, landscaping, snow removal, repairs, lightbulbs, and so forth.
The results of the regression analysis on the independent variables are presented in Exhibit 14.
Property Operations and Maintenance Expense Analysis.

The results suggest that for most properties, property operations and maintenance expenses are more closely correlated with total revenue than occupancy. It may be inferred that these properties have significant meeting and catering or restaurant operations that attract revenue from non-guests, hence the weaker relationship to occupancy.
Conclusion
Total Revenue is the recommended predictor for property operations and maintenance expenses, and approximately 36 percent of this expense should be considered to be fixed.
Franchise Fees
Franchise Fees include all fees charged by the franchise parent company. It is almost always calculated as a percentage of rooms revenue or total revenue. No regression analysis was performed as it is almost always 100 percent variable, and the terms are usually known prior to projecting income and expenses.
Management Fees
Management fees usually consist of a base fee and an incentive fee. The base fee is usually computed as a fixed amount or a percentage of revenues or profit. Incentive fees are triggered upon reaching a predefined set of financial goals, which usually include a profit component. Because management contract terms are known prior to projecting income and expenses, no regression analysis was performed.
Property Taxes
Depending on the taxing policy of the municipality, property taxes can be based on the value of the real property or the value of the personal property and the real property. Because property tax rates are usually known prior to projecting income and expenses and are generally 100 percent fixed, no regression analysis was performed.
Insurance
Insurance for a hotel consists of financial protection against such hazards as fire, earthquakes, weather, flooding, theft, liability. The insurance rates are calculated by a number of factors, none of which are considered to be variable measures, and so the expense is considered to be 100 percent fixed. Therefore, no regression analysis was performed.
Reserve for Replacement
The industry standard for reserve for replacement is usually 3 to 5 percent of total revenue. Because this expense is generally a 100 percent variable expense, no regression analysis was performed.
Conclusion
The fixed and variable regression research project took a new look at the fixed and variable components used in hotel financial forecasting models. Based on the data used in this study, the fixed and variable parameters showed a decrease in fixed costs for all expense items compared with previous studies. A reduction in estimated fixed costs means hotel investments may be less risky than previously thought, which could explain lower capitalization rates, lower equity yields, and lower interest rates. In addition, the analysis of the independent variables suggests that food, beverage, and other income might be projected by room revenue, and not occupancy.
Based on the data used in this study, the findings of our analysis are presented in Exhibit 15.
Summary of Results.

This study was based on a set of historic financial statements during the period of 2001 through 2012 from a sample of 601 hotel properties. Although the regression conclusions were statistically significant, it would not be appropriate to conclude that the recommended percentage of fixed costs or the selection of the independent variables set forth in this article would apply to every hotel in every market at any given point in time. There are many factors that could significantly alter these variables. For example, in markets where occupancies are declining, operators tend to drastically cut costs, thereby decreasing the fixed component. In markets where occupancies are rising, particularly when they exceed stabilized levels, a larger fixed component sometimes develops that enhances a hotel’s profitability as occupancies escalate. Focused-service hotels tend to have more variable costs than full-service hotels. Unionized hotels with strict work rules also will usually have more fixed costs. Center city and airport hotels generally have more fixed costs than highway hotels. In addition to the fixed and variable factors cited above, the period 2001 through 2012 from which the regression data were obtained marked a period of unprecedented economic growth, decline, and recovery that could have affected the study’s conclusion, thereby skewing the results. Hotel consultants and appraisers should therefore consider this article merely as another tool or benchmark for developing an appropriate estimate of the fixed and variable inputs used in making fixed and variable financial projections for hotels.
Existing hotels with multiple years of operating history may find more accurate results by conducting a regression or time-series analysis using their own historical data. The figures provided in this study may have the greatest applicability when little or no operating history exists for a property, that is, for a hotel that is proposed or under construction. These figures also may be valuable to operators and analysts of existing hotel properties for use in comparing the performance of those properties with the figures presented here. To the extent there are differences between the performance of a given hotel and these figures, operators and others can analyze why such differences exist and begin to discover opportunities for improved performance.
Footnotes
Acknowledgements
Special thanks to Christian Buckhout for his assistance in the research of this article.
Declaration of Conflicting Interests
The author(s) declared no potential conflicts of interest with respect to the research, authorship, or publication of this article.
Funding
The author(s) received no financial support for the research, authorship, or publication of this article.