
Abstract
Using mobile tablet technology, this study compared menu selections by millennial-age respondents to test the effects of five different menu nutrition labeling formats for attractiveness, perceived influence, and actual influence on the students’ food choices. Labeling formats presented on an iPad involved combinations of numeric caloric values, traffic-light color coding, and percentage of daily intake presented as a graphic summary. Each participant was asked to select four courses from a fine-dining restaurant menu, and each was shown one of the five nutrition labeling formats (or no information at all). Although there was no significant difference in the calorie count for the six groups, the labeling format with traffic-light color coding combined with a graphic summary of the meal’s calorie count (compared with the daily recommended intake) received the highest attractiveness ranking. This attractive graphic format also showed a significant positive correlation to its perceived influence on food choices. Overall, participants in all labeling groups indicated a strong support for inclusion of nutrition information on restaurant menus using mobile tablet technology.
Keywords
Tablet Menu in Hospitality
The food and beverage industry is expanding its use of mobile technology for queue management, reservations, digital menus, kiosk-based ordering, and payment, among other purposes (Dixon, Kimes, and Verma 2009). Considering this steady evolution of technology, the study described in this article examined restaurant guests’ reactions to presentations of nutrition and calorie information in several different formats, as part of the ordering process in fine-dining restaurant. The respondents, who are college students (often termed millennials), highly valued the detailed graphic presentation of nutrition information on tablet menus, which is not possible using regular paper menus. As explained here, my findings suggest that the use of mobile technology to provide detailed nutrition information on menus is an attractive tool for food and beverage professionals seeking to increase customer satisfaction.
One technology that is growing in popularity for restaurants is the iPad menu, which was used in a hotel restaurant in Australia as early as 2010 (Simpson 2010). The National Restaurant Association’s annual “What’s Hot” culinary forecast based on a 2012 survey of more than 1,800 professional chefs and nearly 200 professional bartenders reported that 27 percent of participants agreed that tablet computers for menus and wine lists would be among the hottest technology trends in restaurants for 2013 (National Restaurant Association 2012).
Despite the increasing use of digital menus in the restaurant industry, this tool has not yet been studied for its use in menu labeling. Digital menus on mobile tablets offer an excellent research tool, as they can be designed to include a number of different labeling formats, with the potential to include graphic representation of nutrition information on menus. This study is the first of which I am aware to analyze the impact of menu nutrition labeling on clients’ food choices using tablet technology.
Menu Nutrition Labeling
The restaurant industry has been the target of recent regulations intended to reduce obesity by providing relevant nutrition information at the point of purchase as a tool to encourage healthier food choices (U.S. Food and Drug Administration [FDA], April 6, 2011). Despite the expense of these menu nutrition labeling requirements (Almanza, Nelson, and Chai 1997), the impact of nutrition labeling on consumers’ food choices has yet to be conclusively established (Swartz, Braxton, and Viera 2011). Studies in quick service restaurants (QSR) have shown no significant impact of posting calorie counts for menu items. For example, a before-and-after study of King County’s (Washington, United States) implementation of menu labeling in a chain restaurant showed no effect on diners’ purchases based on calorie content (Finkelstein et al. 2011). Similarly another QSR study indicated that menu labeling may have a positive effect on what parents order for their young children but not for themselves (Tandon et al. 2010). Based on a systematic review of menu labeling research conducted since 2008, Swartz and colleagues found that only two of seven studies reported a statistically significant reduction in calories purchased among consumers using a calorie-labeled menu (Swartz, Braxton, and Viera 2011). These findings suggest an inconclusive impact of calorie labeling in encouraging healthier food choices or decreasing calorie consumption in QSR restaurant settings.
Insights from literature on nutrition labeling on packaged food products suggest that the effectiveness of nutrition labels on consumer decision processes lies in their ability to provide the appropriate nutrition information to specific consumer segments (Caswell and Padberg 1992). It is also believed that labels are likely to be effective when they address specific informational needs and make sense to their target audience (Verbeke 2005). Similarly, menu labeling studies have shown a strong association between the target audience and the effectiveness of nutrition labeling on consumers’ food choice. In that regard, a QSR menu calorie labeling study found a decrease in calories selected only on the part of non-overweight individuals (Wisdom, Downs, and Loewenstein 2010), suggesting the effectiveness of calorie information for those actively seeking it. Similarly, a study in a fine-dining setting found that menu calorie labeling was most valued by health conscious and older consumers and was effective in reducing their calorie consumption (Fotouhinia Yepes 2011).
The FDA’s (April 6, 2011) menu labeling regulations suggest calorie information as the recommended nutrition labeling format on menus for all chain restaurants, despite the failure of research to show any effect of calorie labeling on food choices (Swartz, Braxton, and Viera 2011). One hopeful development, however, was a recent review study on front-of-package food labels which suggested that a “traffic light” labeling system was most effective in helping consumers identify healthier products, with red, green, and amber traffic-light symbols to indicate fat, saturated fat, sugar, and salt levels according to recommendations (Hawley et al. 2013). These findings suggest that before FDA recommendations for the restaurant industry are formally established and implemented, further research is needed on the effectiveness of different labeling formats on restaurant menus.
The impact of a traffic-light format has been supported by findings from menu labeling studies, in which researchers coded food and beverages in a cafeteria with traffic-light colors and observed increased sales of green-coded items and decreased sales of red-coded items (Thorndike et al. 2012). In another experimental study of different menu labeling formats (using various combinations of kilojoule, percentage daily intake, and traffic-light labeling), respondents most commonly reported using traffic-light labels in making their selections. The groups with traffic-light labeling information selected meals with a significantly lower mean energy content, which constituted a reduction of around 500 kJ (120 kcal; Morley et al. 2013).
Similarly in an online survey study (Liu et al. 2012), four different labels were used (no calorie labels, rank-ordered calorie levels, and red and green circles indicating higher and lower calorie choices). Participants presented with a rank-ordered calorie listing and those shown the colored circles ordered items with fewer calories than those in the no-labels group. The results of these studies suggest that presenting calorie information in attractive and useful formats may increase effectiveness of menu labeling (Liu et al. 2012; Thorndike et al. 2012).
Looking at the meta-analysis by Swart and colleagues, most studies involved a limited number of food categories, as typically found on QSR menus (Swartz, Braxton, and Viera 2011). Similarly, - several studies in quick service settings have indicated that not all consumers or participants were aware of calorie labels due to the speedy QSR ordering process (Finkelstein et al. 2011). In contrast, there have only been a few studies looking at full-service restaurants with many categories of dishes (Pulos 2010; Yepes 2011; Yepes 2013; Josiam and Foster 2009). Studies of full-service restaurants would address the speed of ordering issue by offering more time for food selection and the processing of available nutrition information, as well as allowing guests more food tradeoffs.
Despite all these menu nutrition labeling studies, I believe it is still not clear which nutrition labeling formats are clearest to consumers, which ones actually inspire them to value nutrition more highly, which ones have the power to be the most effective, and why. Such information would be useful for companies that wish to offer such information and for agencies developing nutrition labeling regulations. For these reasons, I offer the study described in this article, which assesses the effects of various labeling approaches for a particularly significant group of consumers—college-age students, often called millennials.
Research Objectives
The use of technology such as digital boards and tablet menus in restaurants offers opportunities for this versatile technology to serve as a research tool for a better understanding of menu nutrition labeling formats and their impact on consumer food choices. Tablets can be used to present nutrition information in graphic and animated formats and in ways that are not possible with traditional paper menus. This research tool can provide more insight into the effectiveness of different menu labeling formats for restaurants.
Using tablet technology for menu presentation, this research aims to explore the attractiveness and perceived influence of different menu labeling formats, while determining the real influence of each labeling format on food choice using total calories selected by participants viewing different formats. The general acceptability of tablet technology as a restaurant menu is also examined on a group of millennial respondents.
Method
Study Population
The millennial generation or generation Y is generally defined as the generation born between the early 1980s and the early 2000s, roughly 1982 through 2004 (Howe and Strauss 2000; Pew Research Center 2010). Both due to the size of the cohort and their sophistication, they are considered to be an important market segment (Lodes and Buff 2009). They have been characterized as being optimistic, confident, and opinionated decision makers, particularly in areas of trends, style, and innovations (Pew Research Center 2010). The millennial generation is an important area for research particularly related to its reaction to brand loyalty (Lodes and Buff 2009) and introduction of technology in areas such as hospitality.
This study’s respondents constituted a convenience sample of undergraduate and graduate students in Switzerland’s Ecole Hôtelière de Lausanne. All participants had either owned or used a smart phone or tablet, all had regular exposure to a full-service, fine-dining restaurant as part of their practical training in hospitality management, and they themselves represent on average a third of weekday lunch clients at the on-campus fine-dining restaurant (Fotouhinia Yepes 2013).
Data Collection
To recruit respondents for this study, an e-mail invitation was sent to all students on campus and posted multiple announcements on the school’s home page and in the student e-newsletters. Participation was encouraged using a draw for a chance to win lunch for two (valued at 120 Swiss francs, or about US$135) at a full-service restaurant in the region. A total of 126 students registered for participation, with a slightly higher proportion of female participants.
The study design included six experimental groups (one control and five treatment conditions). The participants were randomly allocated into each group according to the order in which they registered to participate in the study (i.e., the first woman to sign up was assigned to group 1, second woman to group 2, and so on), until all participants were distributed equally to each of the six groups of twenty-one subjects, each with eight men and thirteen women.
To reduce bias among the menu treatments, the participants were told the purpose of the research was to test the feasibility of using tablet menus in restaurants, with no mention of the nutrition labeling aspects of the study. Each participant was given an individual 15-minute appointment in a meeting room for the completion of menu food selection on an iPad in the presence of a research assistant. The menu in question was that of the restaurant which was used as the prize. The students were asked to make their food selection as if they had won the prize meal. All participants saw the same menu, but the survey question wording was adjusted to be specific to the menu labeling format received by each participant. Following the completion of their food selection process on the iPad, the respondents were asked to complete an online questionnaire on a separate computer.
To control for other factors such as cost, we presented a four-course prix fixe menu that included six choices for each of four courses (appetizer, main, side, and dessert). Each group had an equal number of red, amber, or green options. The individual meetings allowed for the elimination of any possible peer influence on participants’ food selection.
Research Instrument
Taking advantage of the iPad’s capabilities, this study included the novel approach of providing an instant calculation of total selected calories for the four dishes the students had selected, with a graphic summary presenting the total calories as percentage of average daily calorie requirements. This was in addition to calorie labeling and traffic-light color coding (Liu et al. 2012; Thorndike et al. 2012). Thus, this study included the following five combinations of these three labeling formats (in addition to the control group who saw no nutrition info): (1) calories alone, (2) calorie + graphic summary, (3) traffic-light color codes alone, (4) traffic-light color codes + graphic summary, and (5) traffic-light color codes + calories.
The nutrition information for the twenty-four dishes on this menu was calculated using the United States Department of Agriculture’s (USDA) nutrient database for each ingredient, which allowed for the calculation of the calorie information of each menu item. The dishes’ calorie content ranged from 281 to 506 for starters, 422 to 759 for the main dish, 141 to 358 for side dishes, and 211 to 410 for desserts. Thus, total calories for the four-course meal ranged from 1,005 to 2,033 calories (Exhibit 1).
Sample Menu: (a) Study Menu with Calories and Color Coding for Each Item with (b) an Example of iPad Menu Label with Traffic-Light and Graphic Summary.


To present the color-coded calorie information, the USDA reference for the average daily calorie intake was used, which is represented as 2,500 for a man and 2,000 for a woman. The lunch portion of this average daily intake is 40 percent, or 1,000 calories. The meal’s calories were divided between starter (25%), main plus side dish (50%), and dessert (25%). The calories of each dish were used to allocate the appropriate color coding, as follows: items with calories in the upper 30th percentile were red, middle 30th percentile were amber, and the bottom percentiles were green for each dish category. Each of the four courses had an equal number of red, amber, and green options per category to allow an equal chance for each item in a particular calorie range to be selected.
The students entered their selections into an iPad using custom-made applications to allow for different labeling groups. Participants in groups with a graphic summary labeling format saw calculation of total calories they had selected from different categories as a percentage of average adult’s daily requirements. This summary was presented at the end of their meal selection with the exact calories as well the color-coded graphic summary (Exhibit 1b).
Questionnaire
The questionnaire was developed to include assessment of moderating and dependent variables in addition to calculated calories (independent variable). All items were measured using a 5-point Likert-type scale, from 1 = strongly disagree to 5 = strongly agree, except for the demographic questions. The questionnaire was tested on a sample of thirty students and staff prior to use in the study.
The first part of the questionnaire included several demographic questions on age, nationality, alcoholic drinks, and exercise habits. To allow for analysis of any possible association between Body Mass Index (BMI) and calories selected, participants’ weight and height were recorded as part of demographic questions. The self-reported height and weight were used in the formula
The second part of the questionnaire looked into participants’ overall experience with the iPad including previous experience, the interface in the study, and the attractiveness of the labeling format presented, as well as its perceived influence on menu selection process. The final part of the questionnaire dealt with the measures of health consciousness variables, using questions adopted from existing scales (Fotouhinia Yepes 2011; Furham 1994; Gallicano and Van Rheede 2010). Health consciousness questions included areas such as concern toward personal weight and calorie consumption, reading of nutrition labels, and seeking nutrition information. The selection of these specific health consciousness factors was derived from the extensive literature review (Divine and Lepisto 2005; Fen 2009; Moorman and Matulich 1993) suggesting the importance the health motivations in use of nutrition labels. Some minor modifications and rephrasing were made so that the questionnaire could be more suitable for this study’s context (Exhibit 2).
Study Questionnaire with Questions for Each Category.

Note. Likert-type scale of 1-5 was used where 1 = strongly disagree and 5 = strongly agree for all questions except demographic questions.
Data Analysis
Exploratory factor analyses were conducted on survey responses using principal components analysis (PCA) with an orthogonal transformation to convert a set of observations of possibly correlated variables into a set of values of linearly uncorrelated principal components. PCA was selected since some of the survey questions were being used for a first time in this study, and PCA is sensitive to the relative scaling of original variables (Field 2009). Transformation was conducted using a varimax rotation and the number of factors to extract was determined by the Kaiser criterion (Kaiser 1958), with an Eigenvalue above one. Correlation analysis was done using Pearson correlation. Bonferroni correction method was applied to control for the family-wise Type I and Type II errors arising from multiple analysis of variance (ANOVA) comparisons. The internal consistency of survey questions were tested using Cronbach’s alpha reliability test.
Results
Participants
Sixty-two percent of the 126 participants who took part in this study were women. Respondents’ mean age was 22.7 years (SD = 2.615, variance = 6.837), with a range of 18 to 33 years. Ninety percent of respondents were age 26 or younger. Self-reported nationalities of participants showed 73 percent European, 16 percent Asian, and 11 percent American. The BMI range varied between 18 and 30 with mean BMI of 21.9 (SD = 2.44, variance = 5.59). Ninety percent had a healthy BMI of 24.70 or less.
Internal Consistency
In the analysis for internal consistency of survey questions, a good reliability was obtained within test scores for selected health consciousness questions (α = .86), perceived attractiveness (α = .79), and perceived influence (α = .87).
Because studies have suggested a positive association between health consciousness and the use of nutrition labels (Grunert and Wills 2007; Hieke and Taylor 2012; Miller and Cassady 2012), I sought to control for this possible confounding variable by testing the homogeneity of the sample in terms of their health consciousness with a one-way ANOVA using the average responses to all health questions for each individual and no significant difference between six test groups, F(125, 5) = 0.760, p = .554 was detected (Exhibit 4). This nonsignificant difference provides support for the following analysis, such that any difference in attractiveness or influence measured in this study is not the result of sampling difference, in terms of health consciousness of subjects in the various groups.
PCA
Questions relating to attractiveness and perceptions of influence were similar for all groups, except for the wording of each question, which was adjusted to match the specific labeling format received by the participant (Exhibit 2). The measure of constructs between similar items within different labeling groups was analyzed using PCA with a Varimax rotation. Global diagnostic indicators showed adequate factorability of the correlation matrix with the measure of sampling adequacy, Kaiser–Meyer–Olkin, greater than the recommended .50 and the Bartlett’s test of sphericity significant at p < .001 for all factors (Field 2009).
The PCA analysis identified the same two underlying constructs for each labeling group as originally planned in the study design, corresponding to perceived attractiveness and influence of nutrition labeling formats on food choice. In each group, the extracted constructs accounted for more than 55.4 percent of the variance. The questions were then grouped based on their loadings on each of the two extracted constructs; the average mean response was calculated for each individual’s score for perceived attractiveness and influence. Exhibit 3 shows the survey questions and their corresponding PCA outcome for attractiveness and influence for each type of nutrition information presentation. Labeling groups with a combination of formats (e.g., calorie + graphic summary) received both sets of questions corresponding to each format.
PCA Results: The Factor Analysis Outcome of Survey Questions for Attractiveness and Perceived Influence of Different Labeling Groups.
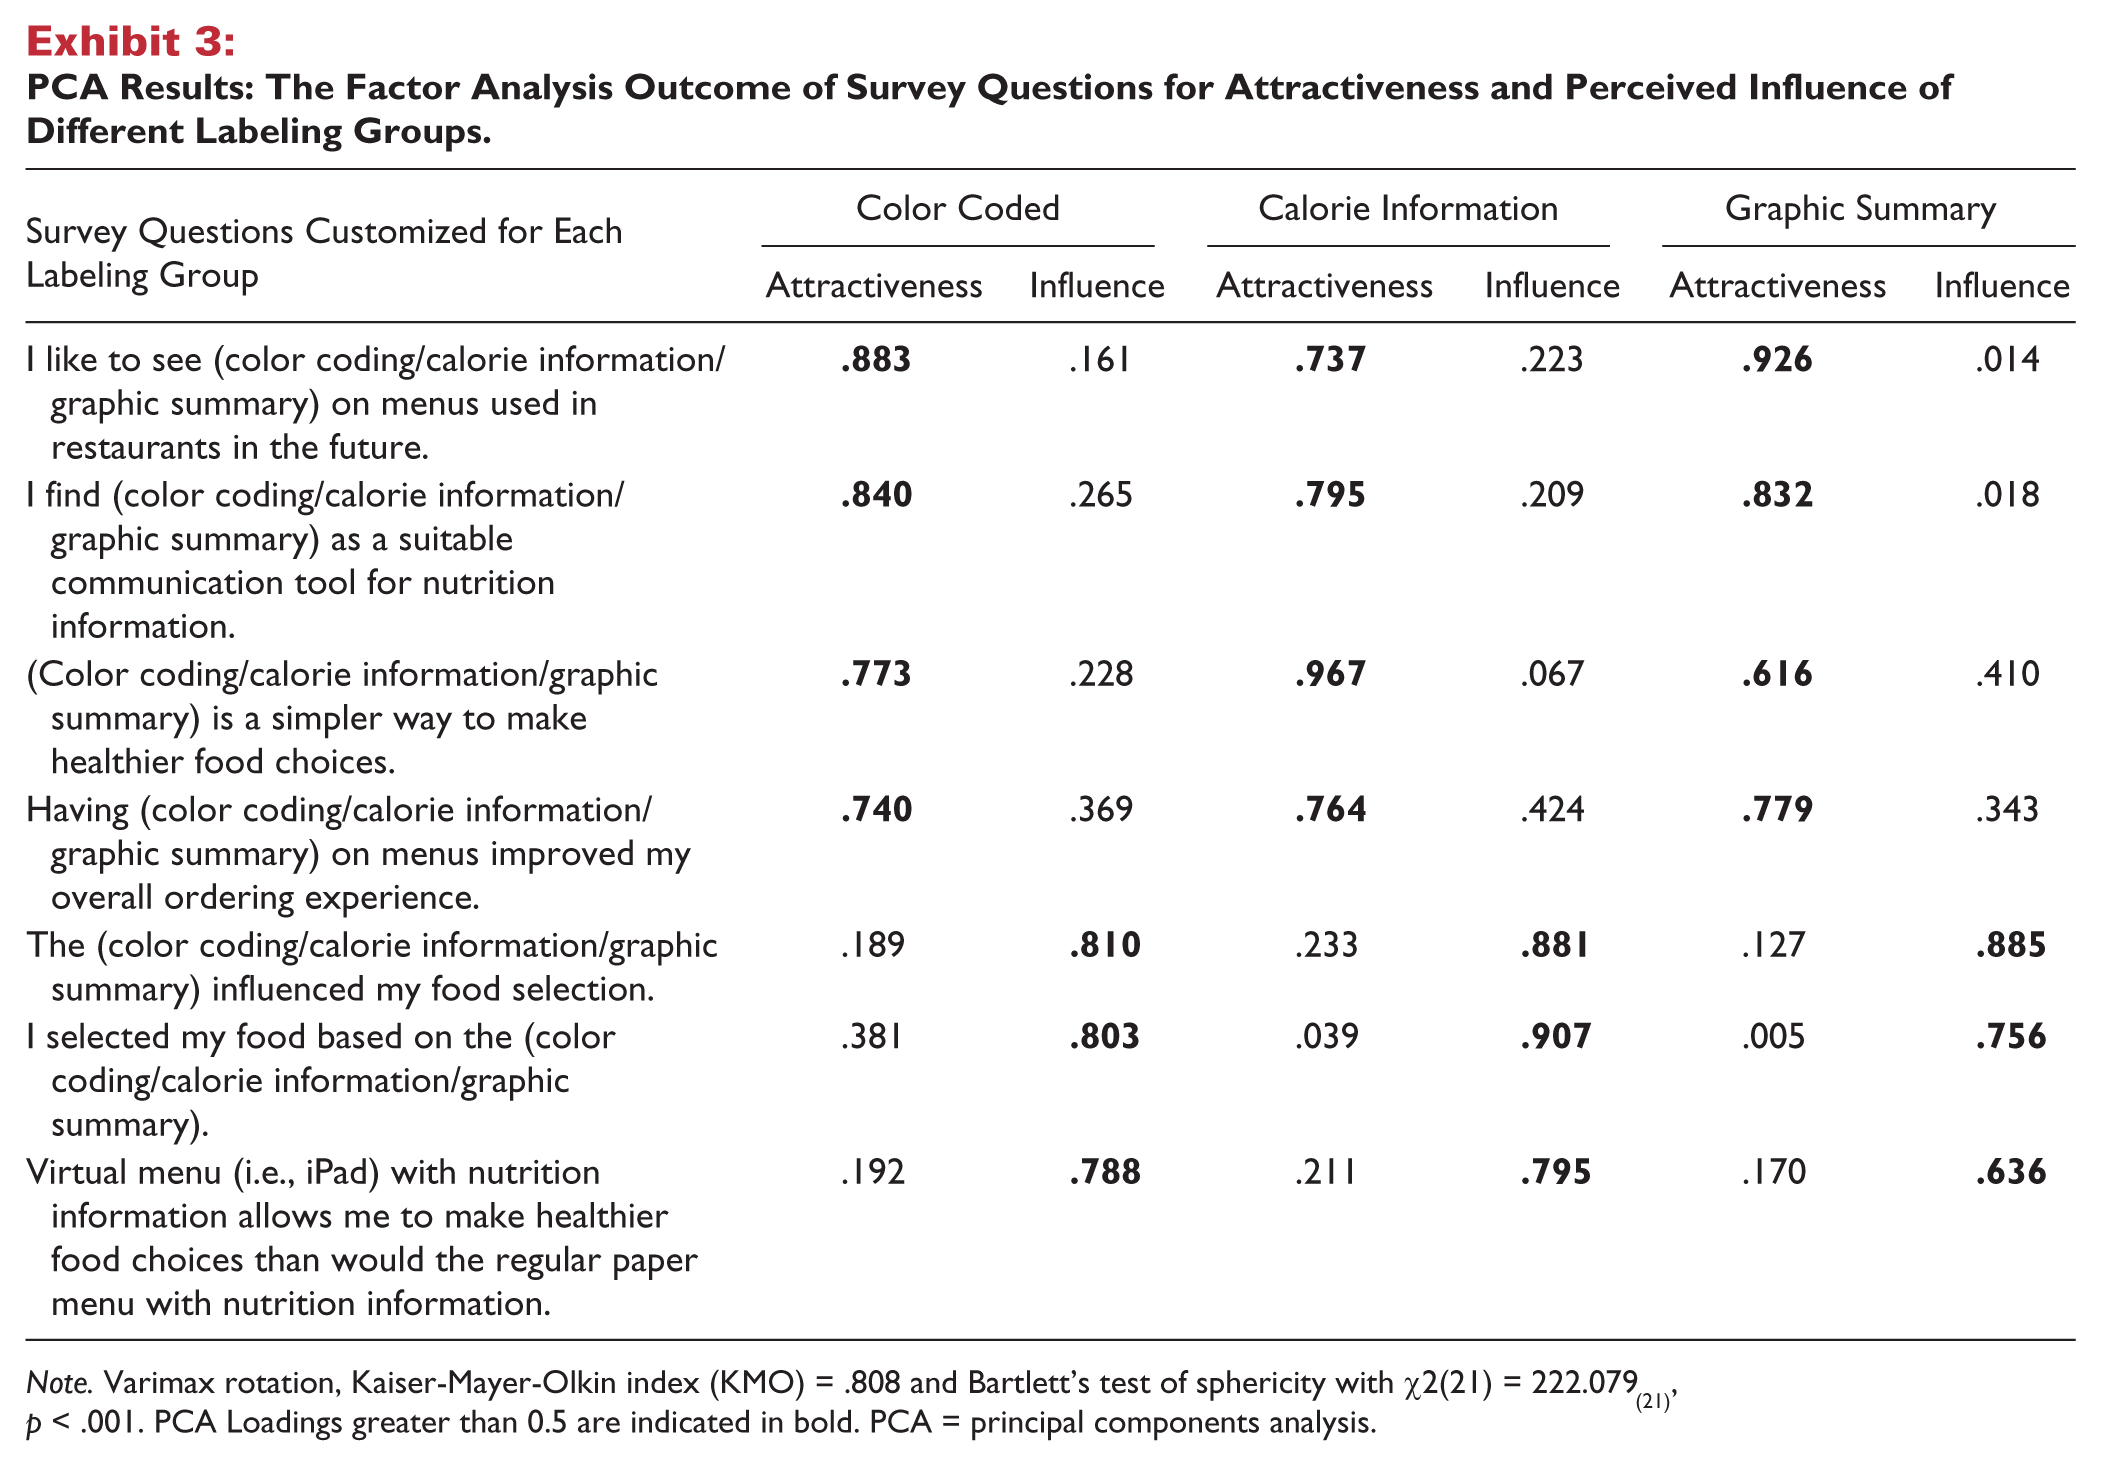
Note. Varimax rotation, Kaiser-Mayer-Olkin index (KMO) = .808 and Bartlett’s test of sphericity with χ2(21) = 222.079(21), p < .001. PCA Loadings greater than 0.5 are indicated in bold. PCA = principal components analysis.
Labeling Comparison
Comparisons of the five different labeling groups using a one-way ANOVA indicated a significant overall difference between labeling groups in terms of attractiveness F(4, 100) = 4.353, p = .003. The two groups with calorie information (that is, calories alone and calories + graphic summary) showed the lowest attractiveness ranking, a value that was significantly different from the three groups with color coding (that is, traffic light alone, traffic light+ graphic summary, traffic light + calories). The response for attractiveness was highest for the group with combined traffic-light color coding plus graphic summary (Exhibit 4).
Labeling Comparison: Overall Summary of Findings for All Labeling Groups in Attractiveness, Perceived Influence, and Calories Selected.

Note. Likert-type scale of 1-5 was used where 1 = strongly disagree and 5 = strongly agree. Different superscript letters (a, b, c; within a row) represent significant differences between means p < .05. TL = traffic light.
I compared respondents’ self-reports of the perceived influence of menu labeling format on their food selection using one-way ANOVA and observed no significant difference between the five labeling formats, F(4, 100) = 0.882, p = .477. The traffic-light color coding plus graphic summary had the highest attractiveness and perceived influence score, but the perceived influence score was not statistically different from that of the other labeling groups (Exhibit 4).
To assess the actual influence of different nutrition labeling formats on participants’ food choices, I compared total calories for selected meals using one-way ANOVA and again observed no significant difference between the total calories selected by the various labeling groups, F(5, 120) = 0.367, p = .870. The traffic-light color with graphic summary group generally chose menus with the fewest calories, but again the difference against other groups was not statistically significant (Exhibit 4). This finding matches that of the reported perceived influence, and it confirms the lack of a significant influence from different menu labeling formats on final food choice in this study.
Format attractiveness was a different story. Pearson correlation analysis found relationships between reported attractiveness and perceived influence on food selection for different labeling groups, as follows. The results revealed a significant positive correlation between perceived attractiveness and influence for color coding plus graphic summary (r = .712, p < .001) and for color coding plus calorie information (r = .697, p < .001). This correlation was not significant for the other three labeling groups (calories alone, calories + graphic summary, and traffic-light color coding alone). This finding suggests that attractiveness of menu nutrition labeling (in this case, with traffic-light color coding in addition to other information, either calories or graphic summary) is positively associated with its perceived influence on food choice.
Tablet Menu Acceptability
The respondents had a favorable opinion of the iPad-based menus, according to a descriptive analysis of the response from participants in all groups. A majority of participants found the iPad menu original (M = 4.02, SD = 0.912), fun (M = 4.02, SD = 0.912), easy to use (M = 4.41, SD = 0.822), convenient (M = 4.10, SD = 1.0), useful (M = 3.56, SD = 1.031), and not time-consuming (M = 2.19, SD = 1.171) or difficult (M = 1.57, SD = 0.889). The findings highlight the attractive components of such technology in a hospitality setting, especially among young consumers.
Discussion
The findings of this study indicated that traffic-light color coding plus a graphic summary was the labeling format with the highest perceived attractiveness. In addition, there was a strong positive correlation of attractiveness with perceived influence of this labeling format on food choice. The combination of calorie information presented through traffic-light color coding, followed by more informative detailed nutrition information, summarizes their selection process. The graphic summary provided participants with a visual, accessible, and easy-to-understand representation of their meal selection, in the context of their overall daily calorie requirement.
Although traffic-light color coding alone has been previously shown to be a highly acceptable nutrition labeling format for consumer choices (Hawley et al. 2013), it appears that the color coding symbol alone does not offer enough information on the overall health impact of combined menu choices (Andrews, Burton, and Kees 2009). Given their evaluation of the attractiveness of traffic-light color coding with a detailed graphic summary at the end of meal selection, the respondents seemed to appreciate this combination. This approach allows diners to evaluate their meal’s contribution in the context of their daily requirement in a simple graphic summary and decide either to maintain their original food selection or change it according to their health or indulgence objective.
The combination of traffic-light plus graphic summary labeling format confirms previous research on the effectiveness of the traffic-light system in providing useful and accessible nutrition information at the point of purchase (Morley et al. 2013). The findings of this sutdy also offer new insights into the value of using tablet technology as a tool to present relevant nutrition information in an attractive manner. The combination of simple visual cues and the facilitated percentage calculation and its graphic representation bring about a combined effect which was found to offer higher value than the simple traffic-light system.
The significant positive correlation between attractiveness and perceived influence for groups with traffic-light color coding in addition to another information (calorie or graphic summary) suggests that such color coding could influence careful food choices, even though this study found that the format had no significant impact on total calories. It is possible that this format might have a noticeable effect on calorie amounts in a different forum.
It has been previously observed that when participants are provided with factual nutrition information on different components of a meal, subjects select fewer sweets and desserts (on a hypothetical food buffet; Bucher, van der Horst, and Siegrist 2013). That principle might explain why study participants in different labeling groups might have used the available numeric information or visual cues to balance their four courses, resulting in no significant differences between the labeling groups. I suspect that the fact that there was also no significant difference with control group on calorie counts can also be partly due to this study’s specific sample characteristics. The student respondents in this study are educated in food and nutrition topics as part of their curriculum, and this previous knowledge may have influenced their choices.
Implications
Research has suggested the need for more creative nutrition labeling formats to achieve the intended health benefit on consumer food choices (Dixon, Kimes, and Verma 2009). This study’s use of iPad technology highlighted the benefits of this medium for drawing customers’ attention to nutrition labeling in restaurants. More researchers should examine this technology for a better understanding of decision processes and consumer behavior.
From the findings of this study, it can also be concluded that although providing nutrition information in an attractive way to draw attention to the information on restaurant menus, it cannot be concluded that it has an effect on total calories selected, at least by twenty-somethings, in a full-service restaurant setting. This is an important industry implication for hospitality professionals who may consider nutrition labeling to be an interference with indulgence or upselling. Our findings seem to indicate that when nutrition labeling is attractively presented, it informs customers without causing significant changes in overall item sales. That said, there is a possibility that presentation of nutrition labeling in this way might increase customers’ sense of empowerment while reducing the guilt factor (as the calorie consumption is established). Thus, customers may choose to eat in such establishments more often and become more loyal to the restaurant.
The findings of this study highlight the potential benefits of using tablet technology to provide useful information to consumers at the point of purchase. This tool can offer more attractive alternatives to menu presentation and design that may not be possible with the traditional paper menus, particularly as the tablet can be set to update calorie information as a person orders. The use of tablet technology to offer visual, animated, and detailed information on menus is an attractive approach to menu presentation that appears to be appreciated by the millennial generation. In addition to menu nutrition labeling, tablet technology allows for considerable flexibility in menu presentation.
The high acceptability of tablet technology by the youthful consumer segment seen in this study suggests important potential for innovative use of mobile tablets in restaurants, as a means for market differentiation, perhaps to attract new young clients and increase customer loyalty.
Limitations
This study measured participants’ intentions rather than actual food choices, as there was never any question that the food selection would be linked to its immediate consumption (and might never be so). Therefore, evaluating participants’ food choices in a real restaurant setting would be a more realistic procedure to assess the impact of nutrition labeling on food choices. However, the findings of this research study could be referenced to indicate some of the impacts to be expected if nutrition information were applied in a real setting with a similar population segment. Also, the choice of research design in this study was an haute cuisine menu; this may have caused participants to put aside their concerns for calorie content of their food choices in exchange for indulgence.
Another research limitation was the population demographic. While full-service restaurants constitute an ideal setting for mobile tablet menu implementation, such restaurants mostly cater to business and older clients, who have shown to value nutrition information on menus more than younger adults (Fotouhinia Yepes 2013). Therefore future studies can assess the possible impact of these labeling formats on a more representative population using a real restaurant setting. Furthermore, a similar study design can be used to provide new findings with respect to other moderating factors such as ambiance, price, and the presence of friends, which may contribute to final food decisions in real restaurant settings and allow for assessing the validity of the factors proposed in this study.
Footnotes
Acknowledgements
I would like to thank the scientific support of Dr. Michael Siegrist of ETH Zurich and valuble research assitance of Ms. Jessica Yen, as well as the anonymous reviewers at CHQ for their constructive comments and contribution to this article.
Declaration of Conflicting Interests
The author(s) declared no potential conflicts of interest with respect to the research, authorship, or publication of this article.
Funding
The author(s) received no financial support for the research, authorship, or publication of this article.
Author Biography
References
Supplementary Material
Please find the following supplemental material available below.
For Open Access articles published under a Creative Commons License, all supplemental material carries the same license as the article it is associated with.
For non-Open Access articles published, all supplemental material carries a non-exclusive license, and permission requests for re-use of supplemental material or any part of supplemental material shall be sent directly to the copyright owner as specified in the copyright notice associated with the article.