
Abstract
Due to the fast growing hotel industry in Taiwan, recent hospitality studies has paid attention to how various factors affect the Taiwanese hotel performance and offered interesting and valuable findings. To expand the financial literature of the Taiwanese hotel industry and the hospitality literature as a whole, this article is the first hospitality study to investigate how board size affects firm performance of publicly traded hotels in Taiwan. Panel regression test results reveal an interesting finding. Specifically, there is an inverted U-shaped relationship between board size and hotel performance in terms of return on assets, return on equity, and Tobin’s Q with an optimal value of board size equal to 10. This indicates that while board size up to 10 has a positive impact on hotel performance (supporting the resource dependence theory), board size can deteriorate hotel performance when it is larger than 10 (supporting the agency theory).
Introduction
The strong expansion of both domestic and international tourism markets in Taiwan for the recent years has created a significant demand for hotels and hospitality services, benefiting hotel sales and fostering the development of the hotel industry (Chen, Hou, & Lee, 2012). Due to the fast growing hotel industry in Taiwan, recent hospitality studies has paid attention to how various factors affect the Taiwanese hotel performance and offered interesting and valuable findings.
For example, Chen, Kim, and Kim (2005) found that economic factors, such as money supply growth rates and changes in unemployment rates, significantly affected the Taiwanese hotel stock performance. Chen (2007) revealed that changes in monetary policy factor, namely discount rate, could have a strong influence on the expected level of future corporate earnings and/or the discount factor used in valuing expected cash flows of hotel companies, leading to a significant impact on hotel stock returns (SRs).
Chen (2010) investigated the effects of changes in the state of economy (GDP [gross domestic product] growth rate) and tourism growth (growth rate of total foreign tourist arrivals) on the corporate performance of hotels in Taiwan. Panel test results in his study indicated that both GDP growth rate and tourism growth are significant explanatory factors of hotel occupancy rate, but only tourism growth could strongly explain return on assets (ROA) and return on equity (ROE). Chen et al. (2012) showed that insider managerial ownership had a significant impact on financial performance of publicly traded hotels in Taiwan in terms of ROA, ROE, and Tobin’s Q (TQ), but not SR. They further divided insider managerial shareholding (IMS) into managers’ shareholding and directors’ shareholding based on two different classes of owners: managers and directors. Among two, directors’ shareholding was found to be more significant in affecting hotel performance.
Note that while prior hospitality studies uncovered some insightful and interesting findings on the influences of various factors on hotel performance in Taiwan, no work has examined the role of board size in influencing hotel performance. To expand the financial literature of the Taiwanese hotel industry and the hospitality literature as a whole, this article is the first hospitality study to investigate how board size affects firm performance of publicly traded hotels in Taiwan based on the resource dependence theory and the agency theory.
In addition, the board size of publicly traded hotel firms varies significantly in Taiwan. During the study period from the first quarter of 1998 to the fourth quarter of 2013, board size ranged from three to seven with a mean of 6.72 and a high variation of 3.68. Note that the board of directors has major functions in advising and monitoring business operations (Nguyen, Rahman, Tong, & Zhao, 2016). The structure and size of boards have been used to ensure that the top management performs in the best interests of the shareholders. Boards also have other important tasks such as mapping out the company strategy and connecting the company with the external environment in which it operates. The multiple functions of the board of directors are expected to affect hotel performance. Accordingly, it is interesting to see how this highly variant structure of board size of hotel firms in Taiwan affects hotel performance and whether there is an optimal board size maximizing hotel performance.
According to the agency theory, the principal (shareholders) and agent (managers) diverge in their interests. The former favors a focused corporate strategy to maximize shareholder value, whereas the latter prefers diversification to spread employment risks (Jensen, 1986). The role of directors is to monitor and assess how the management works and to ensure that the interests of the management are aligned with those of shareholders (Ross, Westerfield, & Jordan, 2008). Many studies of board size have tended to favor smaller boards, with it being argued that larger boards increase obstacles to communication and coordination among directors, and decrease the ability of directors to monitor the top management, thereby leading to agency problems and hence a negative relationship between board size and firm performance (Eisenberg, Sundgren, & Wells, 1998; Jensen, 1993; Liang, Xu, & Jiraporn, 2013; O’Connell & Cramer, 2010; Yermack, 1996).
Based on the resource dependence theory, larger boards may result in diversified expertise (Zahra & Pearce, 1989) and greater external linkages (Goodstein, Gautam, & Boeker, 1994) and hence a larger board is likely to include more experts and increases the advice given to top managers on the operation of the company. Advantages associated with increasing the number of directors on a board are as follows. First, larger boards make a wider pool of expertise and resources available to the corporate body with greater external linkages (Dalton et al., 1999; Zahra & Pearce, 1989). Second, a larger board is more likely to have increased diversity in terms of experience, skills, gender, and nationality (Dalton & Dalton, 2005). Finally, the board of directors has responsibilities to advise, monitor, discipline, and assess the management performance, and to ensure that the interests of top management coincide with those of the shareholders. Adams and Mehran (2012) found that board size was positively related to performance in a sample of 35 publicly traded bank holding companies over a 34-year period.
Other studies that empirically investigated the relationship between board size and company performance in different industries found a nonmonotonic relationship, in that adding new directors initially improved the company performance, but this then started to deteriorate after a certain number of directors had been reached. For example, De Andrés and Vallelado (2008) obtained information on the boards of directors of 69 commercial banks from six Organisation for Economic Co-Operation and Development (OECD) countries (Canada, the United States, the United Kingdom, Spain, France, and Italy) during 1996-2006. They found an inverted U-shaped relationship between bank performance and board size.
To sum up, there are mixed results in the existing literature on the relationship between board size and company performance. This study contributes to the hospitality finance literature by testing both linear and nonlinear relationships between board size and hotel performance. Empirical test results can shed light on whether board size affects firm performance in the hotel industry, and if so, in what forms (linear or nonlinear). The article proceeds as follows. The “Data and Variables” section describes the data and variables. The “Panel Regression Models” section shows panel regression models. Discussion and managerial implications are presented in the “Discussion and Managerial Implications” section. The final section concludes the study and offers future research directions.
Data and Variables
Conducted in 2014, this study uses a set of seven publicly traded hotels with the required financial data from the first quarter of 1998 to the fourth quarter of 2013 (64 quarters). Seven hotels are Ambassador Hotel, First Hotel, Grant Formosa Regent Taipei, Hotel Holiday Garden, Leofoo Corporation, Landis Taipei, and Chihpen Royal. The data of the number of board directors and all financial data are taken from the database of the Taiwan Economic Journal (TEJ). Consequently, 448 quarterly sample observations were available for the main analysis performed in this study.
Following the existing literature, this study used the total number of directors on the board of a company to measure board size (Gani & Jermias, 2006; O’Connell & Cramer, 2010). The hotel performance includes sales growth rate, ROA, ROE, hotel SR, and TQ. Hotel sales growth rate (SG) is derived as,
where sales is the hotel sales revenue for each quarter.
Two popular measures of profitability are return on assets (ROA) and return on equity (ROE) (Ross et al., 2008):
and
Hotel stock performance or SR is computed as,
where sp is the closing hotel share price at the end of each quarter.
TQ is defined as the market value of a company divided by the replacement value of its assets:
where the numerator is the sum of the market value of common stock plus the book value of preferred stock and debt, and the denominator is the book value of total assets. This study also used an approximate TQ proposed by Chung and Pruitt (1994). A higher TQ suggests a greater future growth opportunity.
This study also included four control variables: company size (SIZE), leverage (LEV), IMS, and company age (AGE). SIZE is measured as the logarithm of the average total assets:
where the average total assets is calculated by dividing the sum of total assets at the beginning and the end of the quarter by two. Large companies are likely to have more market power to obtain better performance in a competitive environment with a greater ability to adapt to economic and social changes (Chen, 2010).
The control variable LEV is the hotel company’s debt ratio and calculated as,
where the total debt and total assets are the values at the end of each quarter. When LEV is higher, the company will experience a greater burden of principal and interest payments. This could result in the company being unable to generate a sufficient cash flow for paying back its debt obligations, and so LEV is expected to have a negative impact on financial performance.
Given that IMS, measured as the percentage of total shares held by managers and directors (or insiders), could affect hotel performance (Chen, Hou, et al., 2012), this study also used it as a control variable in the panel regression tests. According to Chen, Hou, et al. (2012), when the interests of managerial insiders and shareholders converge through equity ownership, a positive relationship arises between IMS and the market value of the company. In contrast, the relationship between IMS and company performance is expected to be negative because a larger IMS can entrench and insulate insiders from the market’s influence on corporate control. Thus, the IMS may have a positive or negative impact on financial performance.
The age of company (AGE) is more likely to have an impact on the board structure and ownership structure. Therefore, this study included AGE as one of control variables, which was quantified as the number of years since the company was incorporated. Older companies are likely to have greater experience and learning effects to deal with changes in business conditions. However, older companies can also experience lower sales growth, lower profits, and a lack of innovation. Together, these considerations mean that AGE may have a negative impact on hotel performance.
Table 1 presents the descriptive statistics for all the variables (SG, ROA, ROE, SR, TQ, BS, SIZE, LEV, IMS, and AGE). The mean values for the measures of company performance were as follows: ROA = 1.02%, ROE = 1.38%, SR = 0.01%, and TQ = 191.68%. BS ranged between 3 and 17, with a mean of 6.716 and a high standard deviation of 3.68. The correlation coefficients indicate that none of SG, ROA, ROE, SR, and TQ was significantly correlated with BS.
Descriptive Statistics and Correlations of Study Variables.
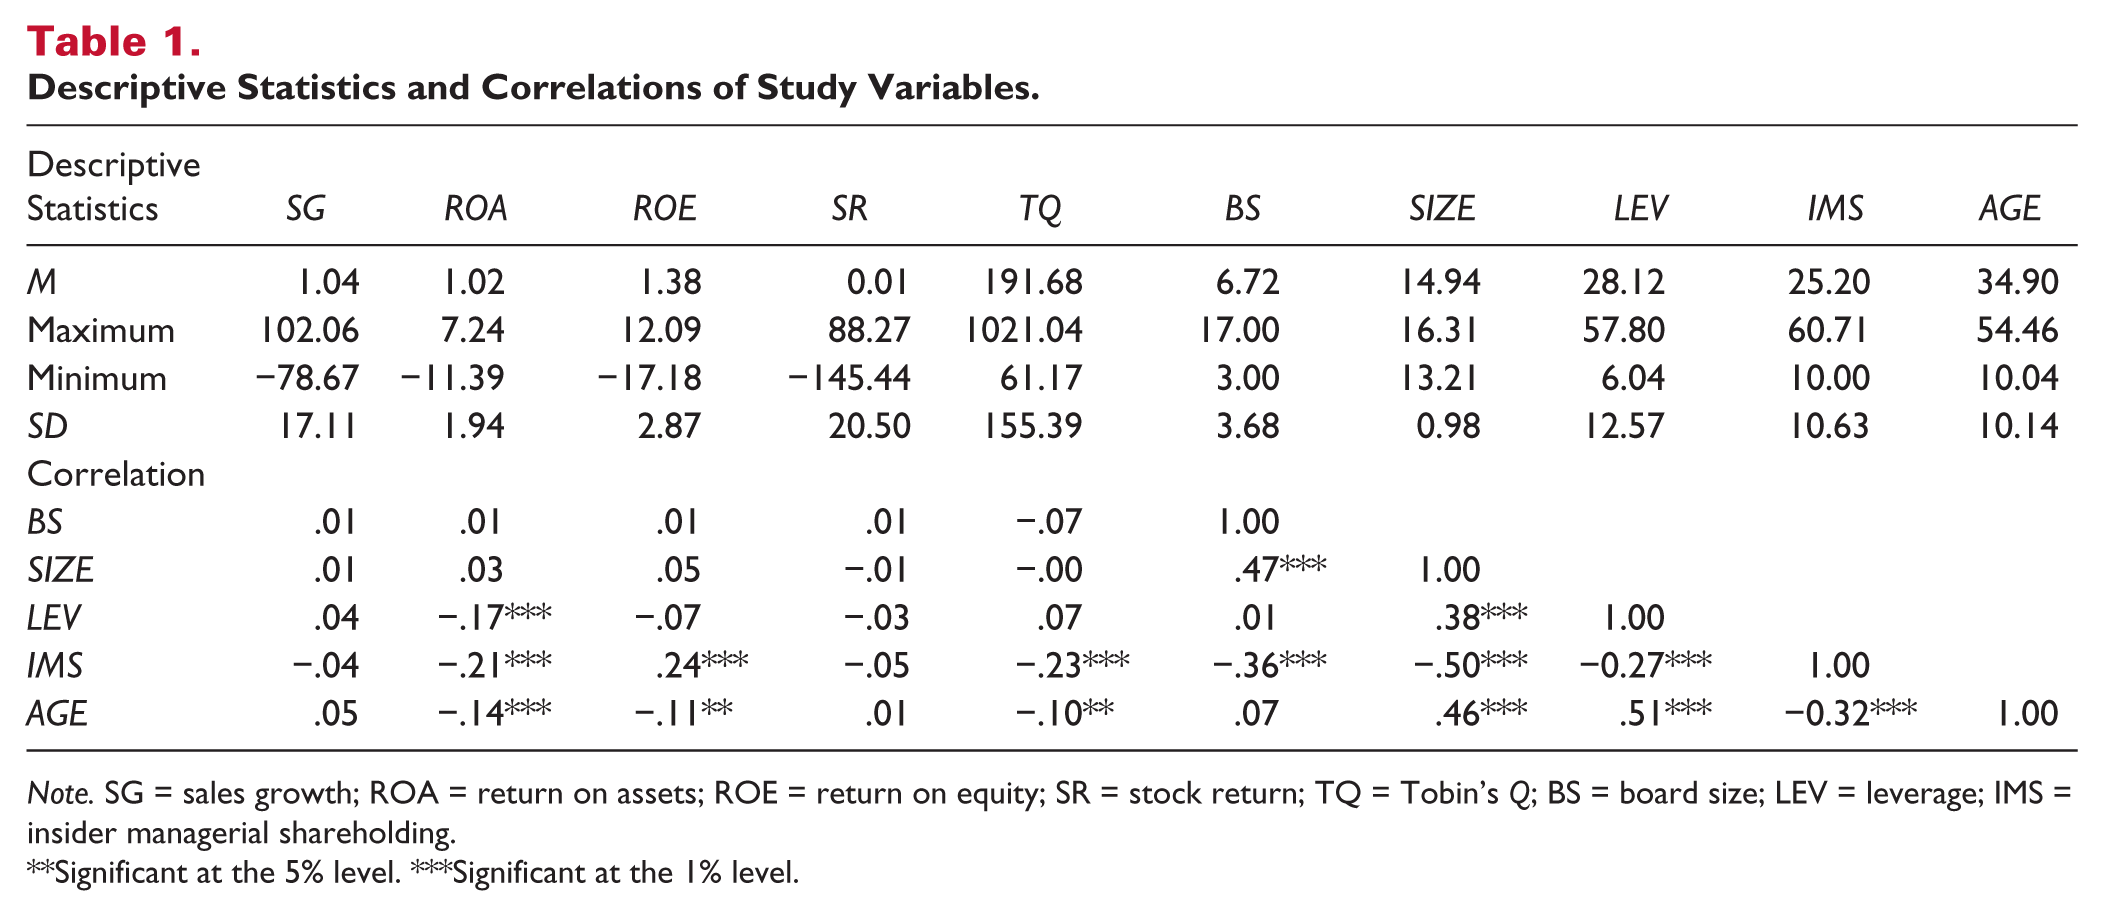
Note. SG = sales growth; ROA = return on assets; ROE = return on equity; SR = stock return; TQ = Tobin’s Q; BS = board size; LEV = leverage; IMS = insider managerial shareholding.
Significant at the 5% level. ***Significant at the 1% level.
Panel Regression Models
Panel data analysis is the most common method applied to data that include both cross-sectional and time-series structures. This analysis can identify differences between cross-sectional information and the variance of a time series. Baltagi (2005) and Hsiao (1986) supported that panel data analysis can control for an individual company’s heterogeneity, mitigate multicollinearity problems, alleviate estimation bias, and specify the time-varying relationship between dependent and independent variables.
Linear Relationship
The study first tested the following linear relationship between board size and hotel performance:
where HP is hotel performance (SG, ROA, ROE, SR, and TQ). Three estimation methods, including pooled ordinary least square (OLS), fixed effects, and random effects, are considered when we performed panel regression tests based on the linear panel data model given in Equation 8a (Dimitrios, 2005).
The pooled-OLS method estimates the common constant for all cross-sections (i.e., there are no differences between the estimated cross-sections). The pooled-OLS estimator may be inconsistent due to board size and independent variables being jointly determined by an unobserved effect. The fixed-effects estimator can deal with this problem. The constant is treated as section-specific (there are differences between the estimated cross-sections) in the fixed-effects method. The fixed-effects estimator, also known as the least-squares dummy variables estimator, includes a dummy variable for each group to allow for the constant to vary between the groups. The difference between the fixed-effects method and random-effects method is that the constants of the random-effects method for each section are random parameters.
According to both F test and the Hausman (1978) tests, the fixed-effects method is found to be the appropriate estimation method. Panel A in Table 2 summarizes the panel regression test results of the impact of board size on hotel performance. The coefficients of BS on SG, ROA, ROE, SR, and TQ are found to be positive, but insignificant at the 10% level. The results imply no linear relationship between board size and hotel performance.
Panel Regression Test Results of the Effects of BS (and BS2) on Hotel Performance.

Note.
Significant at the 10% level. **Significant at the 5% level. ***Significant at the 1% level.
Nonlinear Relationship
Following De Andrés and Vallelado (2008), this study also included both the linear and quadratic terms of board size in the model to test the possible presence of a curvilinear relationship. The model specifically contained the quadratic term of the BS variable to examine the presence of an inverted U-shaped relationship between board size and hotel performance. The following regression tests were performed:
Given the framework of panel regression tests given in Equation 8b, the curvilinear relationship between board size and hotel performance exists if b11 and b21 are significantly different from zero. Particularly, if there is an inverted U-shaped relationship between board size and hotel performance, b11 > 0 and b21 < 0.
Similarly, the fixed-effects method is found to be the appropriate estimation method based on both F test and the Hausman (1978) tests. Test results reported in Panel B of Table 2 show that only the coefficients of both BS and BS2 on ROA, ROE, and TQ are significantly different from zero and b11 > 0 and b21 < 0. In other words, the relationship between board size and hotel performance in terms of ROA, ROE, and TQ is not linear, but curvilinear and more specifically inverted U-shaped.
GMM Estimation
A major concern for the fixed-effects estimation is simultaneity. The fixed- effects method will produce biased results when board size may be affected simultaneously with hotel performance during any particular period. Wintoki, Linck, and Netter (2012) argued that the generalized method of moments (GMM) is a suitable model for dealing with endogeneity problems. Accordingly, this study further applied the GMM method to deal with unobserved heterogeneity and endogeneity when examining how board size affects hotel performance and to provide a robustness check for the empirical findings.
Moreover, based on the fact that there are a small number of cross-sectional units (N = 7 hotels) and a fairly large number of time-series points (T = 64 quarters), it suggests that “large N and small T” methods such as the Arellano and Bond (1991) method is not particularly appropriate. Instead, we use the seemingly unrelated regressions (SUR) estimation, which is well-suited for the “large T and small N” sample properties in this study. GMM (SUR cross-section) estimation results of the effects of BS and BS2 on hotel performance are reported in Table 3.
GMM (SUR Cross-Section) Estimation Results of the Effects of BS and BS2 on Hotel Performance.

Note.
Significant at the 10% level. **Significant at the 5% level. ***Significant at the 1% level.
As shown in Table 3, the coefficients of both BS and BS2 on ROA, ROE, and TQ are still significantly different from zero at the 1% level and b11 > 0 and b21 < 0 (Panel A). Neither SG nor SR were related to BS and BS2 at a 10% significance level. Similar results were found when four control variables were added into test equations (Panel B). These confirm the inverted U-shaped relationship between board size and hotel performance in terms of ROA, ROE, and TQ.
Discussion and Managerial Implications
The study finds that board size had no significant impact on hotel SR. One possible explanation is that stock market participants or hotel stock investors may not consider board size to be an effective strategy to improve hotel firm performance. Test results also confirm the presence of an inverted U-shaped relationship between board size and hotel performance in terms of ROA, ROE, and TQ, implying that both agency theory and resource dependence theory may exist simultaneously in the Taiwanese hotel industry.
More precisely, when new directors are added to a board, the advantages of resource dependence theory seem to be greater than the decision-making problems, and hence hotel performance measured by ROA, ROE, and TQ tends to improve. However, when the number of directors increases beyond a certain value, problems of communication and coordination outweigh the advantages, and so hotel performance will deteriorate. This result is consistent with previous studies finding that it is more difficult for a larger board to reach a consensus, indicating inefficient performance (Liang et al., 2013; O’Connell & Cramer, 2010), and it validates the agency theory in the hotel industry.
The finding of an inverted U-shaped relationship between board size and hotel performance suggests that there is an optimal board size in the hotel industry in Taiwan, with there being a trade-off between advantages (i.e., more experts and bringing more human capital and diversity to advise the top managers) and disadvantages (i.e., problems of communication and coordination). The optimal board size that maximizes hotel performance can be calculated as follows. First, the estimation results of the regression tests are
and
Second, we differentiated ROA, ROE, and TQ with respect to BS to obtain the first-order conditions:
and
By solving the first-order conditions, we obtain the value of BS that maximizes ROA, ROE, and TQ is 9.4, 9.5, and 9.2, respectively (see Figures 1-3). The findings suggest that both hotel profitability (ROA and ROE) and future growth opportunity (TQ) can be maximized when the BS is 10.
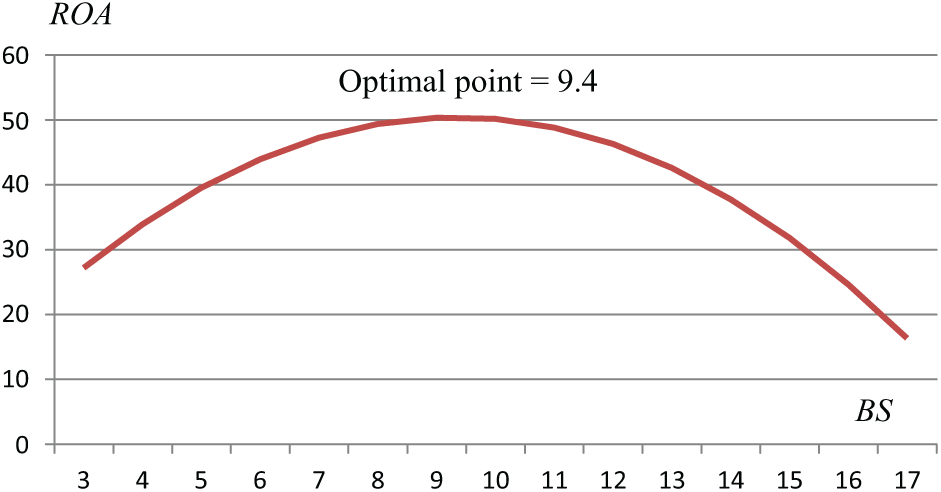
The Relationship Between Board Size (BS) and Return on Assets (ROA).
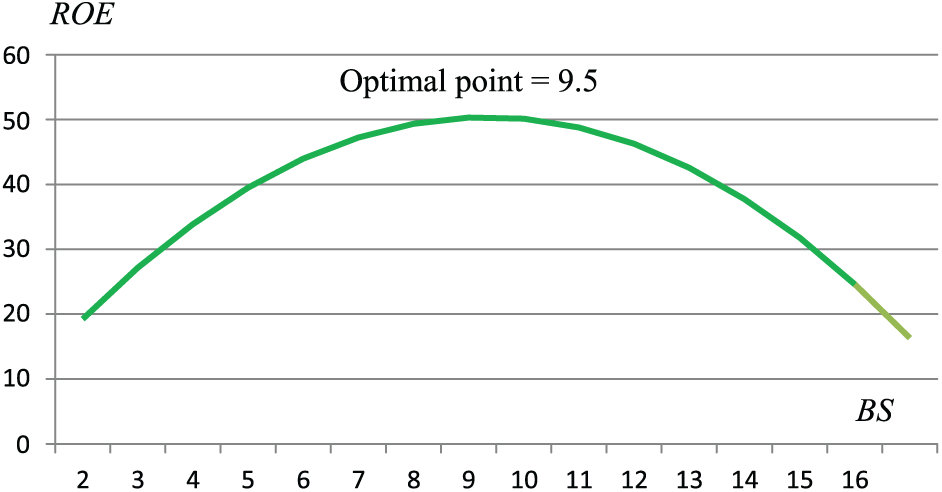
The Relationship Between Board Size (BS) and Return on Equity (ROE).
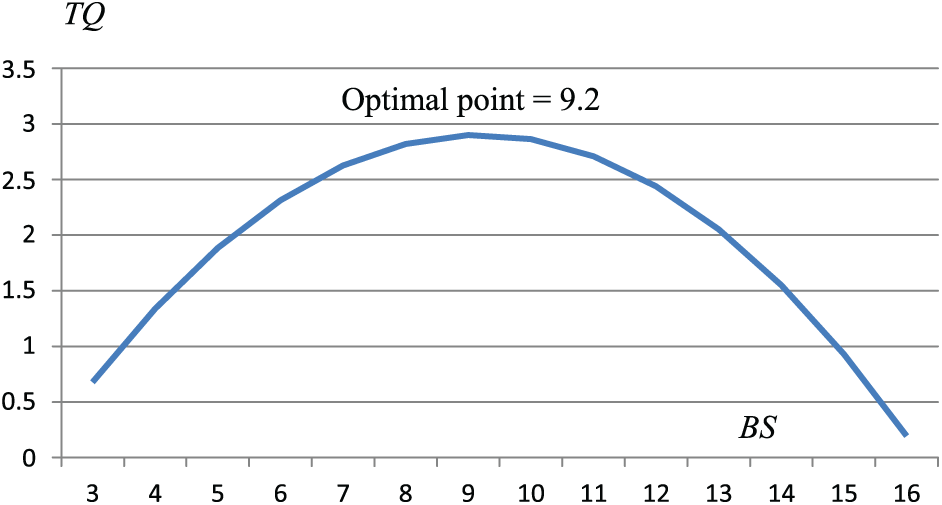
The Relationship Between Board Size (BS) and Tobin’s Q (TQ).
The findings provide valuable managerial implications. Given that board size had a mean of 6.72 in the Taiwanese hotel industry, it implies that board size has a positive effect on hotel performance when the board contained fewer than 10 directors, whereas a negative effect was evident when the board contained 10 or more directors. Thus, while most of the publicly listed hotels in Taiwan enjoyed the advantages of resource dependence theory as the optimal board size that maximizes ROA, ROE, and TQ was 10, they should increase board members to 10 to reap the optimal hotel performance.
The results obtained in the present study also have several useful implications for both practitioners and academic researchers. Hotel owners or shareholders may refer to the findings of this study when developing their own internal governance mechanisms, particularly for ensuring good corporate governance. The reported results can be used by shareholders to decide the optimal board size for a hotel company. Nonetheless, it should be noted that the proposed optimal values represent averaged values for the hotel industry in Taiwan over a long observation period, and hence there could be a range of possible optimal values for each hotel. Each hotel should not only consider the nature and complexity of its operations but also its stage of development.
Hotel investors in Taiwan can use this study’s findings to evaluate their investments in hotels. The proposed optimal board size values are useful as one criterion for creating or re-evaluating their hotel portfolios, but this should be used simultaneously in combination with many other important portfolio-evaluation criteria. In addition, hotel-industry educators may use the results of this study in future research that considers board size as a control factor that may influence the relationship between other explanatory variables and hotel performance.
The Taiwanese government should discuss with hotels how to enact and revise regulations for boards of directors. Because these regulations affect their businesses and operations, hotels should play an important role in such policy dialogues. Managers should ensure that they comply with laws and regulations, and the board should oversee managers to ensure good corporate governance practices are followed.
Conclusion and Future Research Directions
This study examined the linear and nonlinear relationship between board size and hotel performance in Taiwan and found an inverted U-shaped relationship between board size and hotel performance in terms of ROA, ROE, and TQ. The findings imply that the inclusion of more directors should enhance the advisory function of a hotel company and have a significantly positive impact on hotel performance until an optimal board size 10 is reached (supporting the resource dependence theory). However, when board size is larger than 10, the free-rider, communication, and coordination problems outweigh the benefits so as to significantly deteriorate the hotel performance (supporting the agency theory). Therefore, the study has validated that the resource dependence theory and the agency theory both apply to the Taiwanese hotel industry.
The mean board size for the Taiwanese hotel industry as a whole was found to be 6.72, suggesting that the number of board members is below the optimal value 10 and hence fails to reach the optimal value of hotel profitability (ROA and ROE) and future growth opportunity (TQ). Unless the hotel industry in Taiwan anticipates nationwide economic hardship in the short term, it may be desirable to encourage hotel companies to increase the number of directors so as to increase the external linkages. However, this suggestion should be implemented only after carefully considering the unique situation of each hotel. Moreover, it is possible that some difficulties may be encountered when changing board size because certain shareholders hold significant powers in the making of such decisions.
Finally, empirical findings of this article lead to potential avenues for future research. First, as there are not many hotel firms traded on the Taiwan stock exchange, this article can only use a small sample size of seven hotel companies. Therefore, the empirical findings of this study should be interpreted and generalized with some caution. Future research can conduct similar investigation using data from different hospitality sectors, such as airlines, casinos, and restaurants. The difference in the board structure among hospitality industries is also very possible. Therefore, board size is expected to have a different impact on firm performance of hospitality segments. Second, given that the board structure could vary in different countries, it would be interesting to see if studies based on data from other countries would find a significant impact of board size on hotel performance and how different board structure influences hotel performance across countries.
Footnotes
Declaration of Conflicting Interests
The author(s) declared no potential conflicts of interest with respect to the research, authorship, or publication of this article.
Funding
The author(s) disclosed receipt of the following financial support for the research, authorship, or publication of this article: The partial financial support for this project by the National Taiwan Normal University (NTNU), Taiwan, and the Minister of Science and Technology is gratefully acknowledged (MOST 105-2410-H-003-064).