



Abstract
A central theme in much of the franchising literature is that franchising mitigates the Principle–agent problems between the owner of the franchise company and the operator of the local establishment by making the operator the owner-franchisee of the establishment. Despite the centrality of that assumption in the literature, there is little empirical evidence to support it. We use Census of Retail Trade data for essentially all full- and limited-service restaurants in the United States to test whether franchisee-ownership affects performance at the establishment level. We find a strong and robust franchise effect for full-service restaurants but little effect among limited-service restaurants. We argue this difference is consistent with agency costs given differences in work processes and the importance of managerial discretion.
Introduction
Franchise organizations have long been a subject of interest in the management and organizational economics literatures. Neither strictly hierarchical nor purely market-based transactions, franchises perhaps represent the quintessential hybrid form of governance (Ménard, 2004). This interest has led to a large literature on the reasons for franchising and the implications for the structure of franchise agreements (Lafontaine & Blair, 2005). Although alternate theories have been advanced, the dominant theory and the one with the most consistent empirical support is that franchising reduces the agency costs between the franchise concept owner (the franchisor) and the operator of the local establishment (the franchisee; Lafontaine & Blair, 2005; Rubin, 1978).
Franchising also plays an important role in the economy. According to the U.S. Economic Census, in 2012, franchise-related businesses accounted for 16% of retail sales (more than US$1.2 trillion) and 13% of employment across a broad array of 18 economic sectors at North American Industry Classification System (NAICS) two-digit level (U.S. Census Bureau, 2012). While the full-service restaurant industry reflects the national averages, among limited-service restaurants, almost 70% of sales and 73% of employment occur in franchise establishments. Despite the economic importance of franchise organizations and the breadth of academic research on the motivations for franchising, there is relatively little empirical research on the actual economic effect of franchising on performance at the local establishment level. The principal–agent argument for the use of franchising suggests the franchisee-owner has a stronger incentive than does a manager to ensure efficient operation of the establishment. This difference of incentive increases in importance when monitoring is costly and when the relevance of local information dictates greater decision-making authority at the establishment level. Consequently, one would expect that franchisee-owned establishments would be more efficient than manager-operated establishments owned by the franchisor, ceteris paribus. While a few studies have attempted to test this hypothesis, previous research on the franchising–performance relationship has been limited to relatively small case samples using limited data that may not generalize to franchises more generally.
In this article, we use establishment-level micro data from the 2007 U.S. Census of Retail Trade (CRT) for essentially all franchise-related restaurant establishments in the United States to test whether franchise ownership structure is associated with differences in performance. 1 Using a two-stage data envelopment analysis (DEA) method, we find that franchisee-ownership is associated with higher establishment efficiency scores among both full- and limited-service restaurants, although the magnitude of the effect is larger among the full-service establishments. We argue this is consistent with the agency theory of franchising and the nature of full- versus limited-service formats.
Literature Review
The Franchising Relationship
One of the primary reasons for using franchising is to mitigate agency problems between the corporate owner and the local establishment (Brickley, Dark, & Weisbach, 1991; Lafontaine, 1992). Managers of establishments owned by the franchisor do not bear the full costs or benefits of their decisions. As a result, the manager’s incentives are not well-aligned with those of the franchisor. The manager may have incentive to shirk in their managerial duties or to consume perquisites that reduce profitability. Even if the manager is given financial incentives for performance, any measure of store-level performance is likely to be manipulatable by the manager, making the measure itself subject to the manager’s shirking behavior. This problem is amplified when monitoring costs are high (Affuso, 2002). If a company has stores spread out across a geographically large region, it may be hard for the headquarters to know what is happening at the local level. Managers who know that they are not as closely monitored also know that they can get away with nonprofit maximizing activities.
Franchising the establishment to a local owner-manager internalizes the costs and benefits of the owner-manager’s shirking or perquisite-taking behaviors (Brickley et al., 1991; Lafontaine & Blair, 2005). The franchisee becomes the residual claimant of the establishment’s operations, net of the fees due the franchisor. 2 This creates stronger incentives not only with respect to short-term profitability but also with respect to the long-term value of the franchise, since the franchisee may capture the gains from selling the franchise in the future (subject to franchisor approval). Moreover, since most franchises require the franchisee to provide the capital to develop the franchise, the franchisee has an investment incentive that a manager does not.
Although establishment ownership through franchising improves incentives for a franchisee vis-à-vis a manager, the nature of the franchise relationship creates other conflicting incentive structures. Because the franchisee incurs all the costs of operations but remits a percentage of the gross sales to the franchisor in royalty fees, the franchisee may have incentive to underinvest in certain quality- and revenue-enhancing activities. Moreover, franchisees may free-ride off the investments of other franchisees or the franchisor in developing the brand value of the franchise. Likewise, franchisor may free-ride off the investment of franchisees. Franchise contract terms attempt to mitigate these incentive conflicts by granting franchisees territorial monopolies to limit free-riding, requiring advertising expenditures by the franchisee, and requiring advertising and product innovations by the franchisor (Bhattacharyya & Lafontaine, 1995; Brickley, 1999; Lafontaine & Blair, 2005).
Franchising and Performance
That franchising is a potential solution to the principal–agent problem is well documented in the literature, and the assumption of agency underlies much of the research on the decision to franchise (Brickley et al., 1991; Lafontaine, 1992). Moreover, this assumption underlies much research on the design of franchise contracts (Brickley, 1999; Solis-Rodriguez & Gonzalez-Diaz, 2012). However, there is relatively little work that empirically validates the importance or effectiveness of franchising in mitigating the agency problem and improving establishment-level performance. Norton (1989) looked at various problems that franchising is designed to combat, such as monitoring costs due to geographic dispersion and the importance of location-specific knowledge. He examines the impact of franchising by looking at how productivity differs between franchised stores and nonfranchised stores. He finds that each of his measures of agency costs has a negative impact on productivity but that franchising mitigates the effect. In other words, the effect of agency conflicts is lower across the board for franchised stores than for nonfranchised stores. Norton uses labor productivity as his measure of performance because of data availability.
Other papers have also found some support for the idea that franchisee-owned establishments perform better. Shelton (1967) found that franchisee-owned establishments have higher profit. Beheler, Norton, and Sen (2008) used health department scores to measure quality and found that franchisee-owned establishments performed better in health inspections. They conclude that franchisees work harder and achieve better outcomes than franchisor-owned establishments. However, each of these papers use small and geographically limited samples, limiting the degree to which their results might be generalized.
At the other end of the evidence, Kosová, Lafontaine, and Perrigot (2013) examine performance differences across establishments within a particular multinational, multibrand lodging firm. They report that although aggregate data suggest large performance differences between franchised and company-owned locations, those differences were greatly diminished when controlling for other factors. Furthermore, when the authors endogenize the choice of organizational form, the performance differences are insignificant. They argue that the company correctly solves the agency problem in its decision of which locations to franchise. However, it is unclear whether this result is generalizable to all franchises or specific to the large multinational firm they study.
Our study provides a broader analysis of this agency effect by examining performance in a sample drawn from substantially all franchise-related establishments in the U.S. limited- and full-service restaurant industries. Similar to Norton (1989), we use a measure of productive efficiency to evaluate whether franchisee-owned establishments perform differently than franchisor-owned establishments. We use this efficiency measure of performance rather than profits or revenues for a number of reasons. First, profit is rarely used in franchise contracts as a unit of measure. Franchisees almost always pay royalties based on revenues instead of profits (Rubin, 1978). Rubin suggests this is because revenues are easier to monitor and more difficult for franchisees to manipulate than are profits, which could include expenses that effectively represent perquisite consumption by the franchisee. Previous research has also suggested revenue may be a flawed measure of performance because it is greatly affected by demand and local prices. Our sample includes establishments across the entire United States, and we do not want local and regional differences in costs of living and general price levels to directly influence our measure of performance. Therefore, we follow Norton (1989) and use efficiency, which mitigates the effects of consumer demand and local prices and focuses on how inputs are used to generate output. In the following section, we turn our attention to the best means of measuring restaurant efficiency.
Measuring Performance
To examine if there is a performance difference between franchisee-owned and franchisor-owned restaurants, it is necessary to measure each restaurant’s performance. Unlike manufacturing industries, output in retail, and particularly in restaurants, is difficult to measure or even quantify in quality-adjusted terms. Although there have been numerous papers written on the topic of measuring productivity in retail, a commonly agreed on measure has proven to be elusive (Achabal, Heineke, & McIntyre, 1984; Reynolds & Thompson, 2007). Perhaps the most commonly used is a partial-factor productivity (PFP) measure created by computing the ratio of some measure of output to some measure of input. Typically, this takes the form of sales, revenue, or transactions, divided by employees, payroll, or square feet (Reynolds & Thompson, 2007). The PFP approach is popular because it is very easy to compute, and the data are reasonably available. There is also a certain appeal because of its similarity to marginal productivity. For this reason, many companies use this measure to evaluate stores. This approach works well if the research question focuses on a particular input. For example, PFP may work well to determine how a change in technology effects worker productivity. However, our interest is in the efficiency of the entire establishment. Using partial-factor productivity ignores the importance of other inputs to the production process.
Total factor productivity (TFP) accounts for all types of inputs and is widely used in studies of manufacturing industries (Reynolds, 1998). Generally, TFP regresses output on a series of inputs and then measures the estimated residuals. The most efficient establishments are the ones that have the largest positive residuals because they get the most output relative to their “expected” or predicted output based on their inputs and the estimated parameters of the regression function. Despite its popularity for studies of manufacturing firms, TFP is less well suited to the type of data available for restaurants in the CRT. The Census of Manufacturing includes data for a large number of inputs, including data on machinery, equipment, and material inputs, which allow for more robust estimates of the production function and expected output. The CRT contains very little data on inputs, particularly for the restaurant industry—essentially, just employment and numbers of seats. There is no information about capital such as kitchen equipment, cold storage, or even square footage of facilities, nor is there information on the use of other materials (e.g., food inputs). Consequently, there is a lack of data to estimate production function parameters and calculate a consistent measure of TFP (Van Beveren, 2010).
Given the limitations of the data and of factor productivity measures of efficiency, we use DEA for our analysis. DEA is a nonparametric alternative to measuring productivity that has been frequently used in studies of the restaurant industry. Van Biesebroeck (2007) compares alternate productivity measures and argues DEA is the preferred measurement when technologies across firms are different. 3 Although restaurants have similar overall technologies, there is a great deal of heterogeneity in the specific technologies and processes across the range of restaurants and types of food served. DEA is a linear programming technique that allows for multiple inputs and outputs (Donthu & Yoo, 1998; Metters, Frei, & Vargas, 1999; Ray, 2004). Like TFP and PFP, DEA calculates a ratio of inputs to outputs. However, unlike the alternatives, it does so by creating a unique set of input and output weights for each establishment, or decision-making unit (DMU). DEA sets the weight (i.e., the Us and Vs in Equation 1) so as to maximize Θ i subject to the constraint that Θ j must be between 0 and 1 even when establishment i’s Us and Vs are applied.

The result of this iterative process is that the most efficient establishments end up with Θ equal to 1, and all others will be less than 1 in proportion to their relative efficiency. DEA has been used in many studies examining the relative efficiency of retail establishments in the accommodations and food service industries. Joo, Stoeberl, and Fitzer (2009) use DEA to examine productivity of coffee shops around Seattle, Washington. They use a few different model specifications to pinpoint places of inefficiency within the coffee shops. They use only financial data, which they point out as a weakness of their paper.
Hwang and Chang (2003) use DEA to calculate the efficiency of hotel chains in Taiwan. They use a combination of financial and physical measures for inputs and outputs. Their input measures included the number of rooms, number of employees, and operating expenses. Their output measures are revenues from rooms, food, and other. They also employ a special technique to determine how productivity changes over time.
Reynolds and Thompson (2007) use DEA to study how fixed (or uncontrollable) inputs affect restaurant productivity. They calculate DEA scores using only inputs that are beyond the control of the manager in the short run (such as location or the number of parking spaces). They then regress the efficiency scores generated from the DEA process against data on the inputs the manager could control, such as hourly server wage and number of seats, to determine how those discretionary factors affect establishment productivity.
Botti, Briec, and Cliquet (2009) use DEA to examine how franchising affects chain-level productivity of French hotel chains. They use DEA to determine that French hotel chains that employ a mix of franchisee and franchisor-ownership are more efficient than chains that have a single ownership type. Although this is similar to our work here, we differ from Botti et al. in the unit of analysis. They are primarily interested in how an ownership mix influences chain-level efficiency. We are interested in how establishment ownership influences establishment-level efficiency.
Finally, Sveum (2016) conducts a simulation of the type of CRT data used in this paper. He generates a sample of restaurant establishment data using a Cobb–Douglas production function, following the results of Ingene and Lusch (1979). He then adds a known “franchise effect” to a random subsample of the simulated population. He finds DEA robustly generates comparable performance measures to TFP for a variety of known franchise effects.
Empirical Method
To investigate the effect of franchise ownership, we use a two-stage approach in which a DEA efficiency score is computed in Stage 1 and is then used as the dependent variable in a second-stage regression, similar to Reynolds and Thompson (2007). The second-stage regression analysis allows us to test for the effect of franchise ownership, and other establishment and chain-level controls. We break the universe of franchise restaurants into two subsectors: limited service (fast food) and full service (wait-service). First, the two formats have different types of revenue operations, with limited service often dependent on drive-thru and full-service dependent on wait-service. These represent fundamentally different production processes from a customer operations and physical asset perspective. Moreover, Muller and Woods (1994) articulate important differences in managers’ operational and strategic concerns across different restaurant types. Full-service restaurants, which would fall under Muller and Woods’s Midscale, Moderate Upscale, and Upscale typology classifications, require more intensive managerial effort for operations than in limited service, or QSR, establishments, due in part to more diverse and changing menus and greater customer service dimensions. As menu diversity and levels of customer service increase, processes become less task-programmable and require greater monitoring and training by management. Because customer service is difficult to capture remotely, the local-knowledge value of managers is greater in full-service establishments. Because the role of local management is significantly different between the two, and because the agency theory of franchising is based on the incentives of local managers/owners to use their local information efficiently, we treat the two groups separately in our analysis.
For each sector, we calculate DEA scores for establishments in the sector using revenues as the output measure. Our data include sales from different channels, or business lines, of the restaurant, including dine-in, takeout, and drive-thru sales for limited-service restaurants, and wait-service and takeout sales for full-service restaurants. 4 We use the disaggregated sales types as DEA outputs rather than a single total sales value to reflect differences in restaurant formats. For instance, establishments that have very few seats may look very efficient compared with an establishment with many seats, all else equal. However, by using the disaggregated sales data, a restaurant that has few seats and low counter sales but good takeout sales does not necessarily look more efficient when compared with a restaurant with a large number of seats and the same total sales, all of which come from counter service.
For both sectors, the DEA score is calculated using payroll, age of the establishment, and the number of seats as inputs. Payroll represents the level of employment at the establishment. We choose to use payroll rather than number of employees for two reasons. First, using dollar value of payroll helps control for regional differences in price levels assuming input and output markets as fairly competitive. Second, employment data are based on the level of employment during the week containing March 12, which may not be reflective of the annual average employment at the establishment. Age represents the institutional knowledge that the establishment has built up over time. Seat count is a proxy for the amount of capital the establishment has. Together, these three inputs cover a wide range of the resources that the establishment has at its disposal to generate output. A more detailed explanation of the variables is saved for the “Data” section.
The output from the DEA becomes the dependent variable in the second stage. In this stage, we run the following regression:

where
There is some debate in the DEA literature surrounding the correct estimation technique in two-stage DEA. Simar and Wilson (2007) argue that bootstrapping estimations are superior to conventional ordinary least squares (OLS) and Tobit because DEA efficiency scores are generated in a specific way, and are bounded by definition instead of by censoring. They present evidence that using OLS or Tobit will lead to biased results in the second stage under certain conditions. On the other hand, McDonald (2009) argues that OLS is acceptable when the inputs in the first stage are independent of the second-stage variables. This is the case with franchisee-ownership, which is the key second-stage variable of interest. In his analysis of franchise contracts, Emerson (1993) explains standards about the operation of the establishment, including its size, location, and employment levels, are specified by the franchisor. This suggests the essential input requirements are independent of the establishment ownership (by franchisor or franchisee).
To test the relative efficiency of the competing models, Sveum (2016) conducts a Monte Carlo simulation of the two-state DEA process using data generated to mimic restaurant establishment production and applies an independent “franchising effect” to a random subsample of observations. He finds that a two-stage estimation process using OLS regression provides a more consistent and more accurate estimate of the known effect than the bootstrapping process recommended by Simar and Wilson (2007). Consequently, we use a second-stage OLS model for the results reported below. 6
If the agency theory of franchising is correct, then we would expect β1 to be positive. This would signal that franchisee-owned establishments have higher efficiency scores than franchisor-owned establishments. In addition, the magnitude of
Finally, there is a potential problem of endogeneity resulting from the fact that the franchisor decides ex ante whether a particular location will be franchised or corporate-owned. The literature on the franchise decision suggests this decision is made in large part with the agency costs of ownership in mind (Brickley & Dark, 1987; Brickley et al., 1991; Norton, 1988). As noted above, Kosová et al. (2013) found that evidence of a franchisee-ownership effect on performance disappeared when they controlled for this endogenous selection. Therefore, we also test for this endogenous treatment effect for the restaurant establishments in our sample by running the second-stage OLS regression with a simultaneous endogenous treatment selection model. We use a probit selection equation to model the determinants of franchisee-ownership (Maddala, 1983). In the selection stage of the model, we predict ownership with the model,

where distance is the distance establishment, i is from their chain’s headquarters, chain franchisee percentage is percentage of establishments in establishment i’s chain that are franchisee-owned, and county franchisee percentage is the percentage of establishments in establishment i’s county that are franchisee-owned. Distance has often been used as a measure of monitoring costs between the chain owner and the local establishment (Kosová et al., 2013; Norton, 1989). Seats again acts as a proxy for the financial capital required to build the facility (Lafontaine & Blair, 2005). We include chain franchising percentage to control for the fact that chains target specific ownership mixes (Lafontaine & Blair, 2005). Finally, we include the percentage of franchisee-owned restaurant establishments in the county to act both as a proxy for the available supply of potential franchisees and as a measure of local market characteristics that may suggest franchising is an effective organizational form. The predicted value for franchisee is then inserted into Equation 2.
Data
Our data come from the U.S. Census Bureau’s 2007 CRT. The CRT is conducted every 5 years, in years ending in 2 and 7. 7 As part of the larger economic census, the CRT covers all retail and restaurant establishments. Responses to the CRT are required by law, and the Census Bureau takes great strides to assure compliance. In exchange for mandatory responses, Census guarantees the confidentiality of individual responses. Although establishment-level data are available to researchers in a controlled environment, only aggregated summary statistics and regression coefficients can be reported.
To narrow the scope of the data, we limit the sample to establishments in the full-service (NAICS code 72211) and limited-service (NAICS code 722211) restaurant subsectors. There are two reasons for this: First, franchising is very common within the food services industry, and second, more input data are available for restaurants than for other industries. In 2007, 14% of full-service restaurants and 59% of limited-service restaurants were affiliated with a franchise, making it a good sector for analysis. 8 The second reason is one of data convenience. Different types of establishments receive different questions on their survey forms. Restaurants are asked about the number of seats, which provides for an input into production in addition to the number of employees and dollars spent on payroll.
After being restricted to establishments in full- and limited-service restaurants, the sample was further restricted to establishments that are part of a franchise system. The Census survey asks, “was this establishment operating under a trademark authorized by a franchisor in 2007?” Establishments are given three response options:
“yes—franchisee owned establishment,”
“yes—franchisor owned establishment,” or
“no.”
Establishments that responded with the third option are dropped. In addition, some establishments were reported as giving other responses, which are also dropped. This leaves in the sample only establishments that are owned by either a franchisee or a franchisor. 9
Table 1 provides a summary of the variables used and their roles as DEA output measures, DEA input measures, or second-stage control variables. The choice of variables is somewhat limited within the CRT. The best available measure of output is sales revenue. While sales is not ideal due to its inclusion of price, it still provides a measure of the amount of output generated by the establishment. Sales here are measured in thousands of dollars and cover all sales from 2007. As discussed above, the CRT provides data on sales channels. Establishments are asked for either their dollar sales or the percentage of sales coming from a variety of different areas. Of interest to the analysis here (mostly because they account for a large percentage of sales across all establishments) are sales from drive-thrus, dine-in counter service, takeout, and servers. For limited-service restaurants, we use drive-thru, takeout, and counter sales. For full-service restaurants, we use takeout sales and server sales. As discussed above, we use these disaggregated sales streams and multiple outputs in the DEA analysis to account for differences between establishments’ business formats and production types, since we do not have more complete data on nonemployee inputs.
Summary of the Definitions for Each Variable.
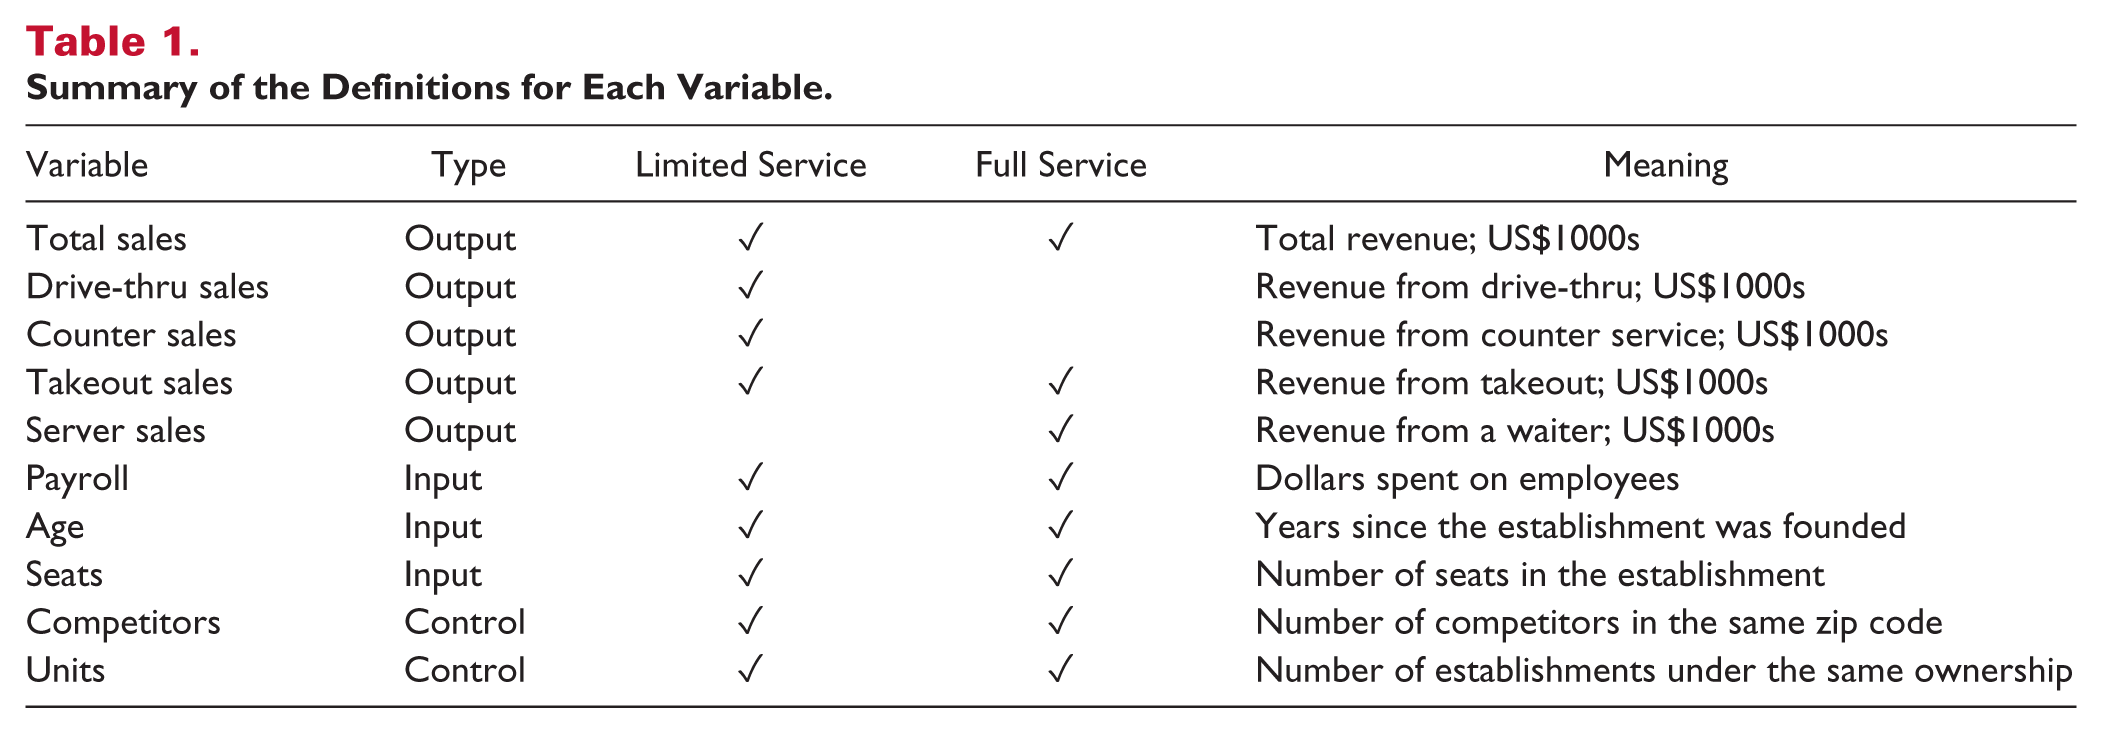
The primary choices for input measures from the available CRT data are payroll, employees, and seats. Seats is defined as the number of seats, including patio and bar seats, within the establishment. Seats acts as a measure of the physical capital available to the establishment. Presuming that most establishments do not want to have large sections of their dining room open without seats, the number of seats is not easily changed by the manager. In other words, the number of seats can serve as a measurement of serving capacity. This is especially true in full-service restaurants. With limited-service restaurants, it is likely that a significant percentage of business is coming from takeout, delivery, or drive-thru. However, even with that being true, the number of seats serves as a measure of expected customer volume and of the amount of capital required to build the facility.
Payroll is measured as thousands of dollars spent on employees during the entire year of 2007. Employment is also a measure of workforce size but is measured as the number of employees during the week containing March 12. This means that employment is a weaker measure of the workforce than payroll because it can be influenced by unique events on March 12. For example, an establishment that opened on April 1 would have positive payroll for 2007 but no employees. We use only payroll in our analysis because of the oddities in the construction of employment. Another reason for using payroll is the frequent use of part-time employment in restaurants. By using payroll, we do not need to worry whether a particular restaurant has fewer employees working more hours or more employers working fewer hours. Finally, because we are using dollar sales as the output measure, using a dollar-denominated input helps control for regional differences in general price levels or costs of living.
We also include as a DEA input measure the age of the establishment, which is defined as 2008 minus the year that the establishment was founded. The data are left-censored in 1976, so the oldest establishments in the data are listed as 32 years old. The age of the establishment serves as a measure of reputation and learning-by-doing. One of the reasons companies franchise is to gain access to local information held by the franchisee. The longer the establishment is open, the more local information is gathered. It also serves as a measure of how well-known the establishment is in the community. A longer existing establishment has had more time to build name recognition among potential customers.
In the second-stage estimation, we include several controls in addition to the franchisee variable of primary interest. The first is the number of other establishments competing within the same area, defined as the number of establishments within the same zip code that share the same line of business. 10 It makes more sense to limit competitors to establishments in the same line of business than it does to include all food establishments. Although a sit down fine dining restaurant and a fast food restaurant are both food establishments, they are not likely competing as directly for customers on a given day. The same people might patronize both establishments, but potential customers are likely not deciding between the two for that night’s dinner. The number of competitors is used as a measure of competition, which indicates how much effort is needed to win customers. Much less effort is needed to woo customers when there are no competing firms than if the establishment is on a crowded main street. However, there might also be network effects going on; a large number of establishments might indicate high consumer demand, which could cause higher sales.
We also include Census tract demographic information from the American Community Survey. These data include the population of the Census tract and the median income. While Census tracts are small, this gives an indication of where the restaurant is located. Higher population and/or higher income shows that the restaurant is in a busy area instead of along a deserted highway. In addition to reflecting potential demand, it also suggests a higher reliance on repeat business and the importance of reputation value at the local level.
We create a variable containing the number of establishments owned by the same owner. This could be the franchisor, a single franchisee, or a corporate franchisee. Bradach (1995) finds that multi-unit franchisees outperform single-unit franchisees in dealing with several management challenges, although establishment efficiency is not a performance measure he addresses. Nonetheless, we control for this possibility in our sample. We also include a measure of the overall chain size as a measure of chain brand awareness.
Because each establishment—both franchisee-owned and franchisor-owned—operates within the prescribed rules set forth by the franchisor, the effect of franchisee-ownership is likely different between chains. To determine the chain to which an establishment belongs, we use administrative data linked to the CRT. Establishments are asked to provide a name for their establishment and are given two blanks. One is intended to be a legal name, and the other a “doing business as.” However, there is a fair amount of variation in the way responses were given. To reconcile this, we identified all chains that have appeared in the Franchise 500 at any point between 2004 and 2014. If either name field contains the name of a known franchise chain, we assign the establishment to that chain. We also added names to the list generated from the Franchise 500 based on observations of trends in the nonmatched data. After searching and then standardizing names, we were able to identify chain names for about 80% of establishments in both subsectors. 11
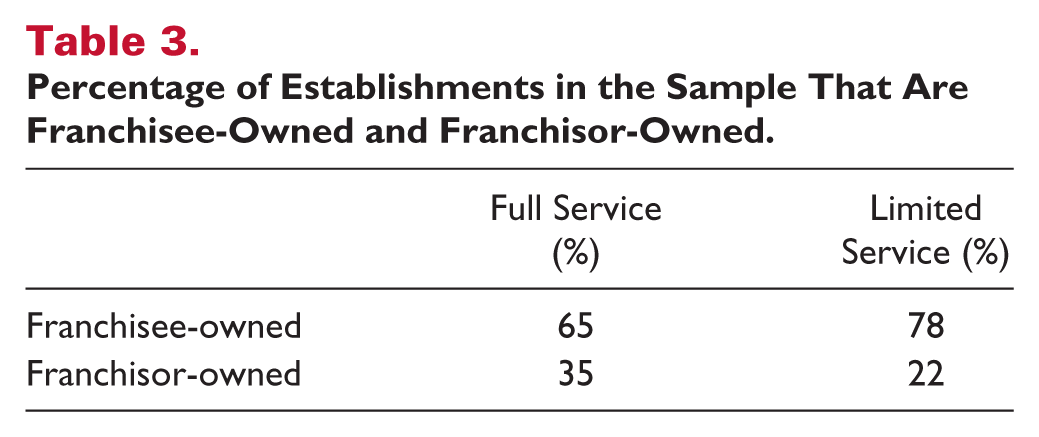
Summary statistics for the sets of variables for both full- and limited-service restaurants are in Table 2. 12 Not surprisingly, full-service restaurants have higher sales, higher payroll, and more seats than limited-service restaurants. On average, both types of restaurants have a similar number of competitors and are the same age. Table 3 breaks down the two sectors into the number and percentage of franchisee-owned and franchisor-owned stores. Both sectors are roughly 70% franchisee-owned and 30% franchisor-owned. This compares well with other documented percentages. Lafontaine and Shaw (2005) report that 78% of establishments in their Franchise 500 data, which is from the 1980s, are owned by franchisors. In addition, Nation’s Restaurant News reports that 73% of franchise-affiliated establishments in their Top 200 are owned by franchisees in 2014.
Summary Statistics for the Input and Output Variables.
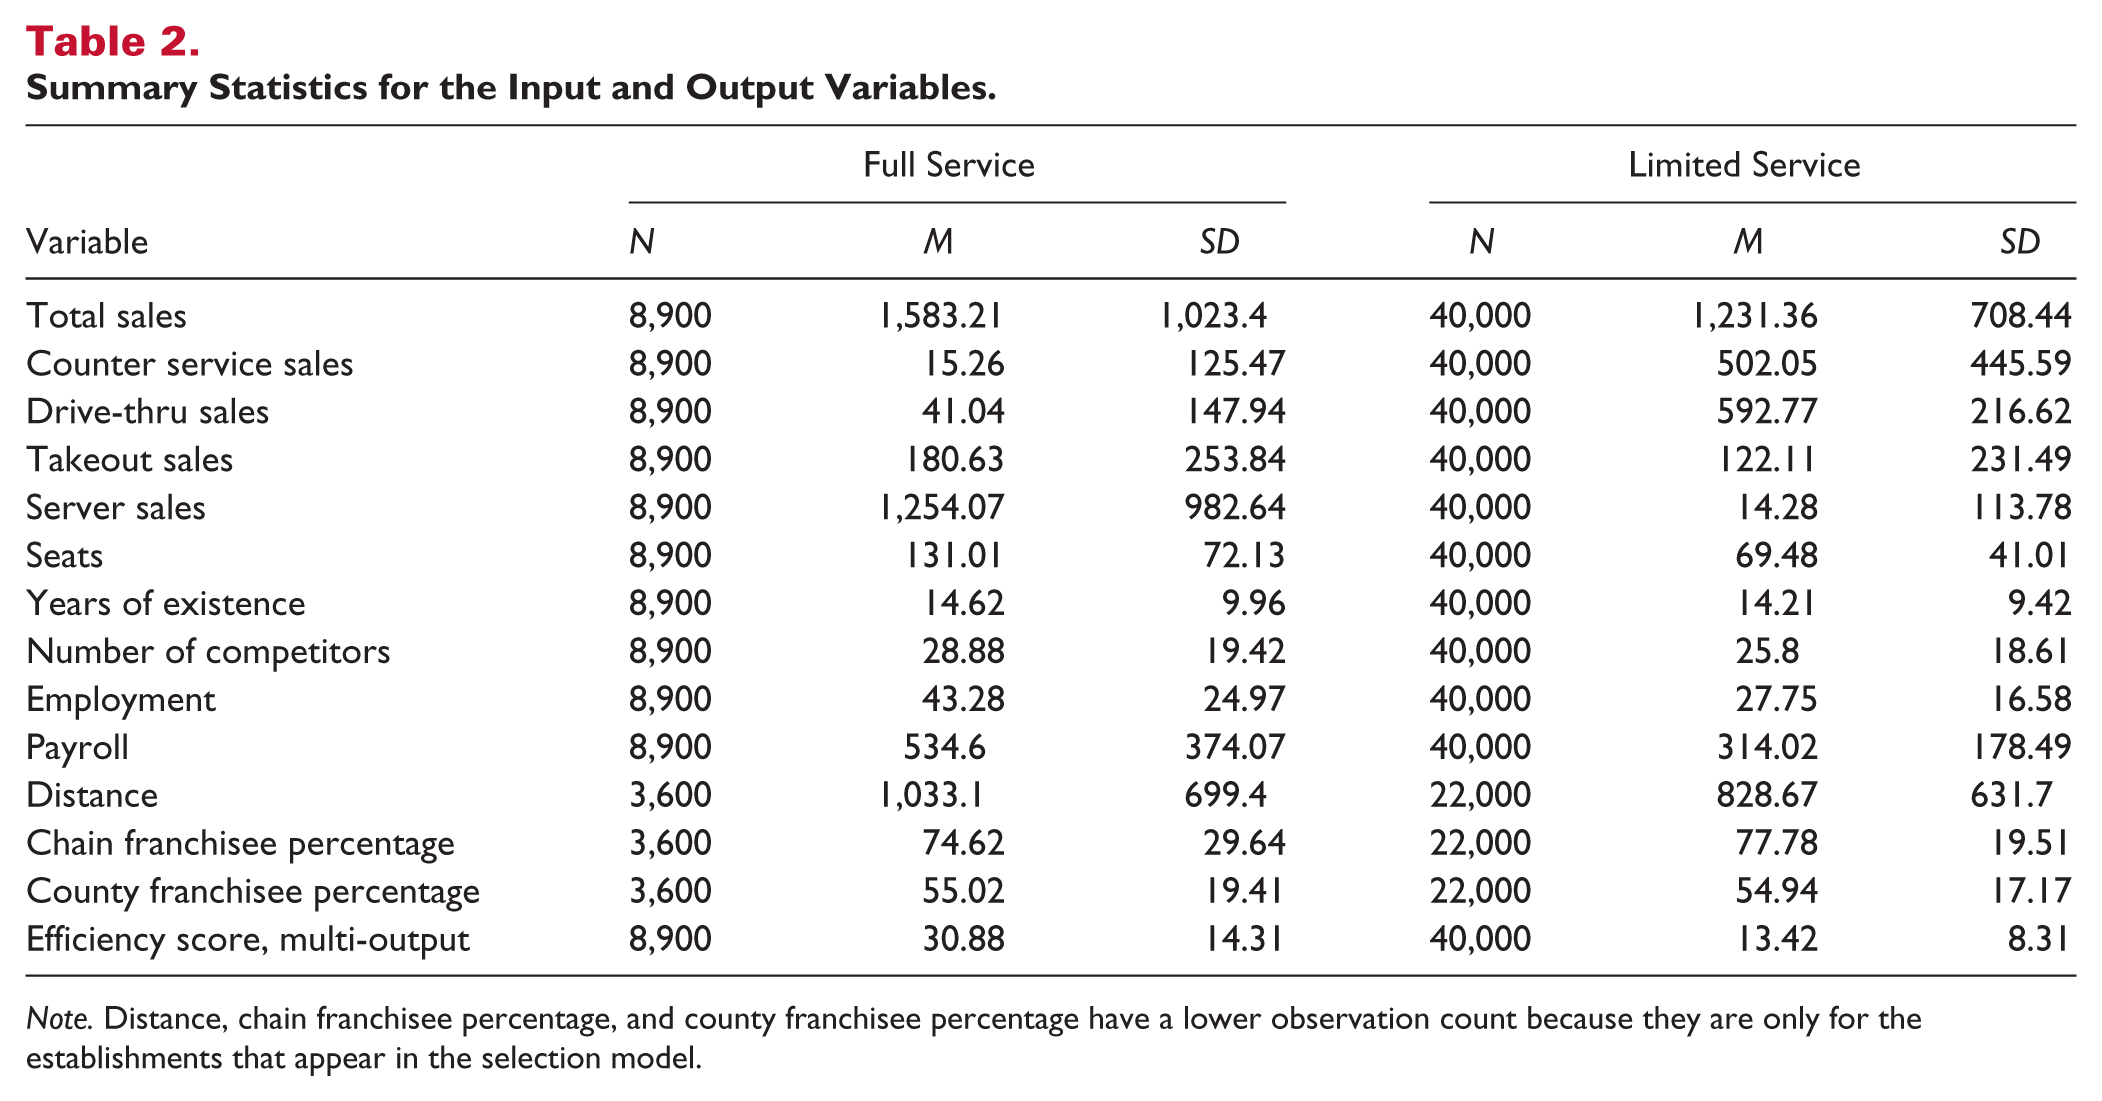
Note. Distance, chain franchisee percentage, and county franchisee percentage have a lower observation count because they are only for the establishments that appear in the selection model.
Percentage of Establishments in the Sample That Are Franchisee-Owned and Franchisor-Owned.
Results and Discussion
Summary statistics for the DEA score results are found in Table 4. These efficiency scores have been scaled so the range is between 0 and 100 rather than the default 0 to 1. The mean efficiency score for full-service restaurants of 30.88 suggests that the average full-service establishment is 30.88% efficient compared with the most efficient full-service restaurants in the sample. Similarly, the mean efficiency score of 13.42 for limited-service establishments suggests the average establishment is just 13.42% efficient relative to the frontier establishments. Because the mean efficiency score decreases as the sample size increases (Zhang & Bartles, 1998), it makes sense that the mean efficiency scores are lower than studies that use very small sample sizes. 13
Summary Statistics on the DEA Efficiency Scores, Which Have Been Multiplied by 100.
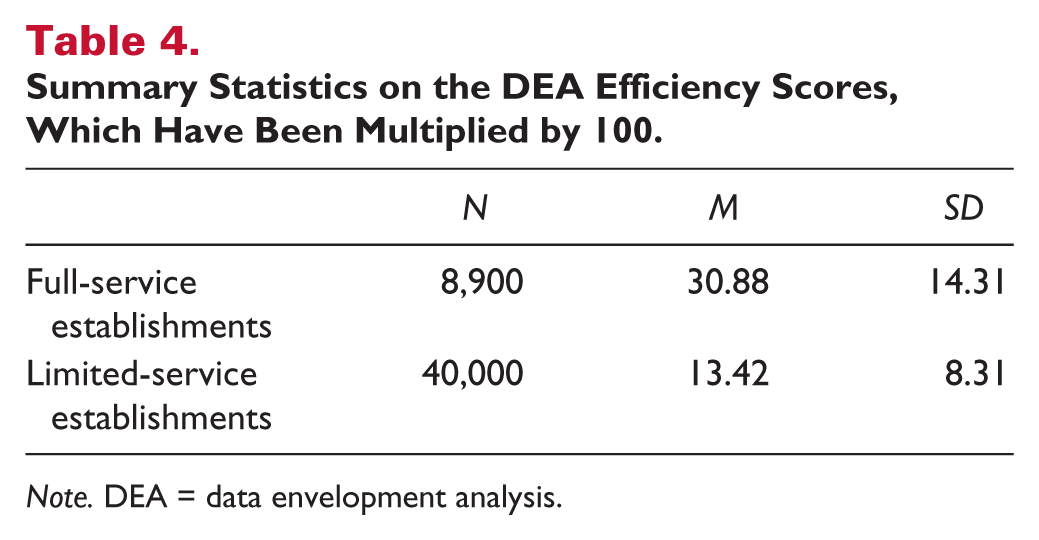
Note. DEA = data envelopment analysis.
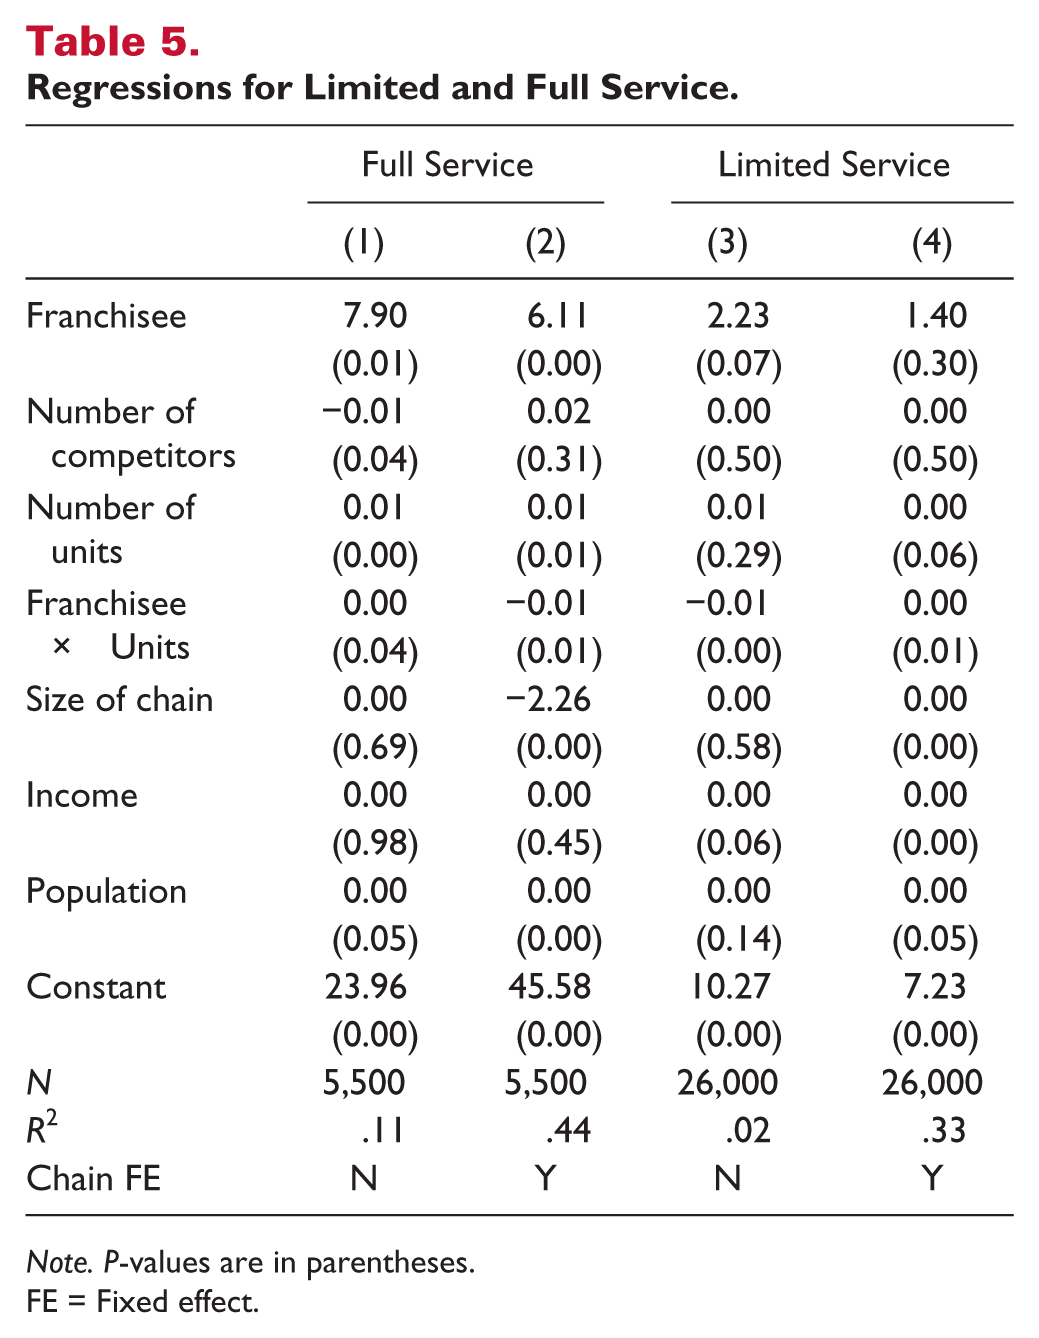
Table 5 contains the results of the second-stage OLS estimation of the effect of franchising on establishment performance. Column (1) shows a positive and significant franchisee-ownership effect for full-service establishments. Column (2) shows the full-service franchise effect is robust to including chain-level fixed effects, although the magnitude of the efficiency effect is smaller. In both cases, however, the size of the franchise effect is more than 20% of the mean performance score for full-service establishments. The number of commonly owned units, the interaction between franchising and unit numbers, and the local population size are all statistically significant, but the coefficient estimates are not of a meaningful magnitude. The coefficient on chain size is significant and negative when controlling for chain fixed effects, suggesting that establishments in larger chains perform worse than those in smaller chains. A possible explanation may be increased costs of monitoring in larger chains.
Regressions for Limited and Full Service.
Note. P-values are in parentheses.
FE = Fixed effect.
Columns (3) and (4) of Table 5 show the results for limited-service establishments. Compared with the full-service sample, the effect of franchising is much smaller in magnitude, although the coefficient estimates range from 10% to about 18% of the mean limited-service efficiency score. However, the coefficient estimate in Column (3), without chain fixed effects, is just weakly significant, and the estimate is insignificant once chain fixed effects are included. The magnitude of the remaining coefficients were very small, although several are statistically significant.
Although the results above show that franchising appears to have some effect on performance, particularly for full-service restaurants, it is possible that this reflects the endogenous nature of franchisee-ownership. Kosová et al. (2013) found a positive relationship between franchising and performance that disappeared once the authors controlled for endogeneity. Therefore, we re-estimated the above model with an endogenous treatment selection model for the franchisee variable. Due to the degrees of freedom at the chain level, we were not able to include chain fixed effects in the selection regression model, but we did still use robust standard errors clustered at the chain level. Results of the selection model for both industry subsectors appear in Table 6.
Selection Model.
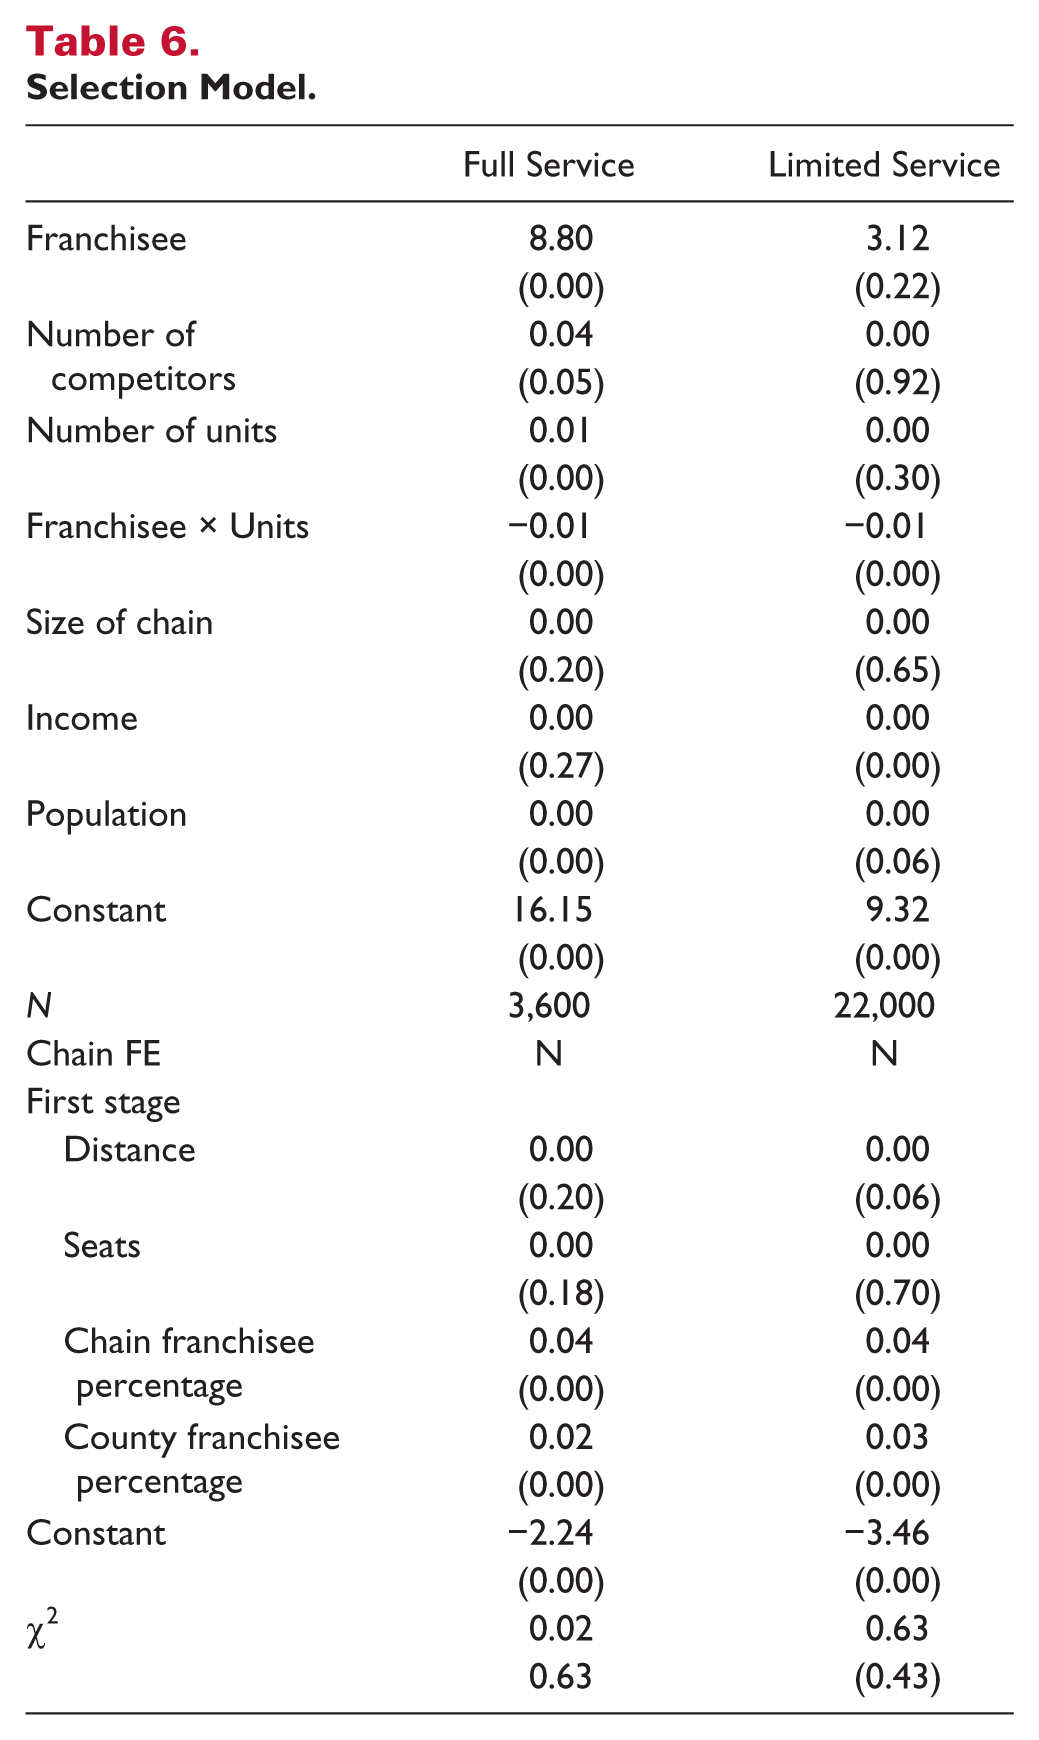
The results in Table 6 are similar to those in Table 5. The coefficient on franchisee-ownership is positive, significant, and a comparable magnitude for full-service establishments. Likewise, the coefficient for limited-service franchisees is a similar magnitude and, as in the chain fixed effects model, not statistically significant. Coefficients on the other control variables are generally similar in their small magnitudes and relative statistical significance. Interestingly, neither selection model can reject the assumption of uncorrelated errors between the selection and primary regressions. This suggests endogeneity is not a significant problem in our original results.
The results presented in Tables 5 and 6 show a positive and significant increase in establishment efficiency for full service, but not limited-service, restaurants. These results are robust to a range of specifications and amount to a roughly 20% increase in efficiency score for the average establishment. The results for the full-service restaurants are consistent with the agency theory argument for the decision to franchise. But what is one to make of the difference in results between restaurant types, particularly as it relates to the agency hypothesis?
The agency theory argument suggests franchising is more valuable when local information is relatively more important and when monitoring costs between the franchisor and the local establishment are high. As noted earlier, the nature of full-service restaurants means they are reliant on interactions between wait staff and customers that may be more difficult to monitor than in limited-service operations where most of the interaction occurs at the order station. Furthermore, full-service restaurants generally have larger, more complex menus and, consequently, greater variety in back-of-house operations that may make remote monitoring more difficult. Because service quality is difficult to measure, and because full service involves greater dimensions of service that are less task-programmable, local monitoring by the manager is arguably more important for the efficient operation of full-service establishments. This would suggest that franchising would have greater value in full-service settings at the margin.
This result is of great importance to managers of chains that franchise or are thinking of doing so. In environments where jobs are not easily task-programmable, such as full-service restaurants, franchising is a good solution to the inherent agency problem. However, the results from limited service suggest that the benefits of franchising diminish as jobs become more task-programmable. As automation moves into full service (such as order-taking tablets built on to tables), much of the training that franchisees can give their employees is no longer relevant. The responsibility of making a sale is transferred from an employee, who can be coached by a motivated franchisee, to a tablet that is controlled at the corporate headquarters. Local knowledge suddenly loses much of its value. Revisiting these results as this trend unfolds will be necessary.
One may also expect that the use of networked point-of-sale (POS) or work flow information systems may reduce the information asymmetry between the chain owner and the establishment (Muller, 1999), and thereby reduce the benefit of local ownership. A worthwhile test would be to control for establishments that use such information systems. Unfortunately, the CRT does not capture information about IT system adoption. A longitudinal study might help identify the effect of technology adoption over time, but Census did not ask establishments about franchise affiliation until the 2002 census cycle, well after POS systems started being adopted by many franchise systems.
Conclusion
In this article, we present results of a two-stage DEA model estimating the efficiency differences between franchisee-owned and franchisor-owned restaurants in the full- and limited-service subsectors. We find little evidence of a franchisee-ownership effect in limited service. However, we find a strong positive, statistically significant franchisee-ownership effect for full-service restaurants. This result is robust to various specifications, including different control variables, such as the number of units the owner owns, Census tract demographic information, and state fixed effects. This positive effect is also robust when controlling for potential endogeneity of franchisee-ownership.
Overall, these results are consistent with the agency theory hypothesis for the use of franchising as an organizational form. While a great deal of research on the pricing and structure of franchise agreements has implicitly assumed the franchisee-ownership effect to be true, this is the first paper to provide empirical evidence to that effect across the breadth of an entire industry.
Although the results themselves are positive, they suggest additional research questions concerning differences in business formats and the implications for monitoring and incentivizing local establishment managers. These include the effect of technology adoption in the industry, such as POS information systems. Finally, our cross-sectional analysis may be limited in its power due to the endogeneity of ownership choice. Further research on each of these margins would help illuminate the role of agency costs in the choice of franchising as an organizational form.
Footnotes
Authors’ Note
Any opinions and conclusions expressed herein are those of the authors and do not necessarily represent the views of the U.S. Census Bureau. All results have been reviewed to ensure that no confidential information is disclosed. All errors are our own.
Declaration of Conflicting Interests
The author(s) declared no potential conflicts of interest with respect to the research, authorship, or publication of this article.
Funding
The author(s) received no financial support for the research, authorship, or publication of this article.
