



Abstract
In this paper, we examine published research in six top-tier hospitality journals to explore response rates for different survey distribution methods across specific characteristics like research context, respondents, and geographical regions. Data were analyzed from 1,389 papers published from January 2001 to December 2019. By looking at a large set of published response rates, distribution and enhancing methods and type of respondents, findings from this study will aid researchers in designing more effective surveys and successfully collecting necessary data. The implications for response rate in hospitality research are also presented.
Introduction
Surveys are the most commonly used data collection method in hospitality research. For instance, Line and Runyan (2012) analyzed 274 articles published in the top four hospitality journals between 2008 and 2010 and reported 66.8% of these studies used surveys as the main method of collecting data. In another study, Yoo et al. (2011) reviewed 570 articles focused on marketing and published in top four hospitality journals between 2000 and 2009, reporting 49.6% used surveys to collect data. Increasingly, the use of survey methods to collect data is justified by its ability to reach a larger population with minimal monetary and temporal costs (Baruch & Holtom, 2008). Using surveys will continue to increase in part because of the emerging internet-based services that collect data, like Amazon MTurk (Shank, 2016), which is making data collection faster and easier than traditional survey data collection. Although it has different advantages, surveys are often associated with low response rates: its key disadvantage (Rungtusanatham et al., 2003) in academic disciplines like business and management (Mellahi & Harris, 2016) and organizational sciences (Anseel et al., 2010).
However, response rate is an important measure to assess credibility of a survey-based study (Baruch & Holtom, 2008). It is also important when considering publication of a study (Mellahi & Harris, 2016). For instance, a survey with editors from the social sciences field reported that 90% of the editors considered response rate an important criterion in publication decisions (Carley-Baxter et al., 2013). Low response rates result in poor data quality, which affects findings, raising serious questions about their generalizability and validity (Schoeni et al., 2013). Baruch and Holtom (2008) stated that “higher response rates lead to larger data samples and statistical power as well as smaller confidence intervals around sample statistics” (p. 1140). Cummings et al. (2001) argued that despite the extensive literature on the subject, no “golden rule” or “rule of thumb” determines an acceptable response rate. Furthermore, we found no clear definition of an acceptable response rate. Consequently, researchers normally decide for themselves a reasonable response rate. At times, this self-interpreted response rate is then justified by citing unrelated research and/or research containing similar or lower response rates (Mellahi & Harris, 2016).
Anseel et al. (2010) postulated that response rates have declined over the past few years in organizational management research. Similar trends have also been reported in business and management research (Mellahi & Harris, 2016). However, for hospitality management research, numerous scholars have briefly mentioned response rate in their meta-analysis papers revolving around sub-disciplines of hospitality management (Line & Runyan, 2012; Yoo et al., 2011). Yet, no one has examined the concept of response rate in hospitality research in detail. Hence, by reviewing 1,389 survey-based papers published in the top six hospitality journals, this study aims to understand the concept of response rate in hospitality research and inspects the adequacy of the practices assumed to increase response rate and decrease abrasion. This study also aims to examine whether there is a relationship between the techniques to enhance response rates and reported response rates in hospitality research. Finally, this study aims to provide a threshold for response rates in hospitality management studies. Findings of this study will provide authors, reviewers, editors, and the hospitality scholarly community with a measure that will help them correctly evaluate the acceptability of survey response rates based on what has been published in recent years.
Literature Review
According to Glaser (2011) the response rate is defined as a mathematical formula computed by researchers into a tool to make sense of the success rate of a completed survey. Moreover, response rate is often named outcome rate and has often attracted great empirical attention by researchers as it points out the nonresponse in a survey and therefore revealing the validity of the survey.
Several academic outlets have provided minimum acceptable response rates (Mellahi & Harris, 2016), but there is no general rule for that standard, specifically in hospitality management research. Although Malhotra and Grover (1998) stated that a response rate lower than 20% is highly undesirable, in textbooks, the standard for an acceptable response rate is variously reported as 50% (Cycyota & Harrison, 2006) to 80% (De Vaus, 2013). Different academic disciplines also have different standards. In the social sciences, an acceptable range for response rates could be from 30% to 70% (De Vaus, 2013). Similarly, in organizational management studies, Anseel et al. (2010) have reported an average response rate of 52% (2037 surveys, published in 12 journals in Psychology, Management, and Marketing during the period 1995–2008), although, Roth and BeVier (1998) in the same discipline reported a rate of 57% in an earlier study (276 surveys, published in six journals in Organizational Behaviour and Human Resource Management during the period 1990–1994). In business management research, an acceptable range for response rates could be 50%–80% (Baruch & Holtom, 2008). Moreover, Carley-Baxter et al. (2013) conducted a survey of journal editors, reporting that journal editors tend to use unwritten standards in evaluating response rates, which vary widely (16%–91%). Rogelberg and Stanton (2007) pointed out that a 100% response rate is rarely achieved because researchers rely on the willingness of respondents to participate in the survey. Moreover, most surveys require voluntary respondent participation, so a full response rate should not even be considered (Demaio, 1980).
According to Mellahi and Harris (2016), response rate is often used as the primary measure of quality and validity for data collected through surveys and questionnaires. Baruch (1999) also explained that a higher response rate is desirable because it proves the dependability and validity of the results. Furthermore, Rogelberg and Stanton (2007) suggested that higher response rates assure the representativeness of collected data and reduce concerns about nonresponse bias. Baruch (1999) stated that a higher response rate results in a larger data set that ultimately results in higher statistical power. All of this leads to higher credibility. Hence, understanding response rates is vital for academic studies (Baruch & Holtom, 2008). Nonetheless, Morton et al. (2012) noted that response rate alone should not reflect the quality and validity of a study because the appropriate response rate has no standard to meet; thus, no rate can be excluded automatically for having less accuracy. They further suggested that authors should disclose more information about the data collection process as well as any attempts to improve participation and the denominators used in calculating the response rate, which should help editors and reviewers assess the validity of a study (Morton et al., 2012).
Response Rate-Enhancing Techniques
The literature focuses on techniques to increase response rates, but these techniques are not tailored to specific industries, but generalized, creating what now is known as a “tailored design method” or “total design methods” (TDM) (Dillman, 2000). TDM uses techniques and procedures in survey administration and data collection, and clearly communicates with respondents over four or five stages. These techniques and procedures, if followed properly, show some promise in increasing the response rate (Chidlow et al., 2015). For example, personalizing the cover letter raises response rates by as much as 9%, and prenotification and follow-ups raise response rates by 7%–17.6% (Chidlow et al., 2015; Helakorpi et al., 2015). Anseel et al.’s (2010) study in organizational science also reported several techniques to increase response rates, including advance notice, follow-up, incentives, matching relevance of the survey topic to the interests of the participants, and personalization. Mellahi and Harris (2016) have provided the following techniques used in business and management research to increase response rate: incentives, design of the survey/questionnaire, and method of delivering the survey. The literature seems to indicate that using incentives to enhance the response rate is a common practice in business management as well as organizational science.
Mellahi and Harris (2016) also noted that some ways of enhancing response rates gave statistically lower response rates than not using response rate enhancements at all. Their study focused only on published articles, so they noted that the results may have suffered from survival bias. They, therefore, declined to draw any definite conclusions. In comparing response rates across sub-disciplines within business and management research, Mellahi and Harris (2016) also noted that response rates reported in human resources management (HRM) journals were higher than in marketing journals. This difference lies in the type of respondents, where the first reports data collected from supervisors and employees and the second reports data collected from customers. Another study suggests that surveying managers and consumers respond at a rate higher than top executives, and those rates are lower than for nonworking respondents and nonmanagerial employees (Anseel et al., 2010). Response rate also increased when a norm of reciprocity was created between participants and researcher. This norm suggests that people treat others as they have been treated, so adding an incentive for completing a survey will positively affect response rate as a norm of social responsibility (Porter, 2004).
Internet and Data Collection
The internet has played a relevant role in the distribution of the questionnaires as well as the response rate (Shank, 2016). Although using the internet speeds up the process and cuts costs (Cobanoglu et al., 2001), it also reduces the response rate because participants worry about security and are overexposed to questionnaires turning up frequently in spam and junk emails (Anseel et al., 2010). In their study, Deutskens et al. (2004) focused on the response rate and quality of internet-based surveys. Faster responses and reduced costs are among the advantages of using the internet for data collection, but the authors still focused on increasing the response rate and the quality of the internet-based surveys. Among their solutions were optimal timing for sending reminders (1 week), monetary compensation, and shorter questionnaires, all of which elicit a higher response rate (Brace, 2018). Cobanoglu and Cobanoglu (2003) and Couper et al. (2001) have pointed out that internet-based surveys are more popular than ever, but little research has been done on increasing response rate. Their research concluded using incentives increases the response rate. Thus, to increase the response rate for internet-based surveys, researchers should implement strategies specific to internet surveys, not just techniques used for any kind of survey (McPeake et al., 2014). Length, design, topic, and formatting all influence participants even before they start the survey, and therefore affect the response rate (Fan & Yan, 2010).
Internet-enabled hand-held devices are rapidly becoming popular and many survey participants are moving toward these devices to complete Web surveys rather than using PCs (Antoun et al., 2017). Brosnan et al. (2015) present in their study that the response rate is highly impacted by the sociodemographic profile of the respondents when it comes to smart devices. Couper (2013) also explains that the optimization of the survey for the smart device had a significant impact on the response rate. Furthermore, the author points out that by not having a smartphone compatible survey, it will negatively impact the overall response rate.
The literature review shows limited and mixed solutions and opinions for increasing the response rate, however, there are no studies conducted on response rate in the hospitality research. As such, this exploratory study examines the issues related to response rate in hospitality research including changes in response rate over last 19 years, across geographical areas, survey types, distribution methods, respondent types and sub-domains of hospitality research. Finally, this study aims to provide threshold values for response rates in hospitality management studies for different situations.
Method
Data Collection
To address the study’s research objectives, data were collected from six top-tier academic journals related to hospitality: International Journal of Hospitality Management (IJHM), International Journal of Contemporary Hospitality Management (IJCHM), Journal of Hospitality and Tourism Research (JHTR), Journal of Hospitality, Leisure, Sport & Tourism Education (JHLSTE), Cornell Hospitality Quarterly (CHQ), and Scandinavian Journal of Hospitality and Tourism (SJHT). All of these journals cover the hospitality management discipline and are included in the Clarivate Analytics’ Social Sciences Citation Index (SSCI). Clarivate Analytics’ database is a leading high-quality database for generating Research Assessment Measures (RAMs) to evaluate the research performance of individual researchers and the quality of academic journals (Chang et al., 2011). Data collection for this study started in mid-2018 when only six of these hospitality journals were indexed in the SSCI, indicating the quality of these journals. Moreover, other scholars like Ali et al (2018) and Gursoy and Sandstorm (2016) have used and ranked these six journals as the top hospitality journals in their studies.
To identify effective current practices of data collection in hospitality research, this study analyzed articles published between January 2001 and December 2019. The 19-year timeframe allowed us to compare response rate patterns over time. Data were collected from articles that used survey methods from every issue of each journal in the sample. The search was not limited to abstract or keywords only, because many academic articles do not describe the research methods in the abstract or keywords. The approach of analyzing data from all papers published in the top hospitality journals over the 19-year timeframe ensures validity of the study findings.
The protocol for the data collection was created based on the literature review and was further refined after a validation test. The protocol included the following categories: journal title, authors, year of publication, target respondents, an industry, the country in which the survey was conducted, sampling type, questionnaire distribution method, sample size, response rate, type of questionnaire, and any method used to enhance the response rate. Moreover, to ensure reliability of our findings, two researchers collected data independently from every article in the sample and then compared the results of the collected data to confirm the final data set for further analysis.
Sample
Overall, 2,218 articles that reported using a survey method (sampling frame) were reviewed. As Figure 1 shows, the number of studies that use survey methods increased year to year. The fewest papers using survey methods were published in 2002 (38 articles) with the most in 2019 (292 articles).

Articles Using Survey Method Published in Hospitality and Tourism Journals in 2001–2019 (N = 2,218).
As Table 1 shows IJHM with 872 articles and IJCHM with 666 articles published more than half of articles in the sampling frame of this research. SJHT and JHLSTE had the fewest publications of research using survey methods.
Number of Articles That Used Surveys in the Journals Published During 2001–2019.
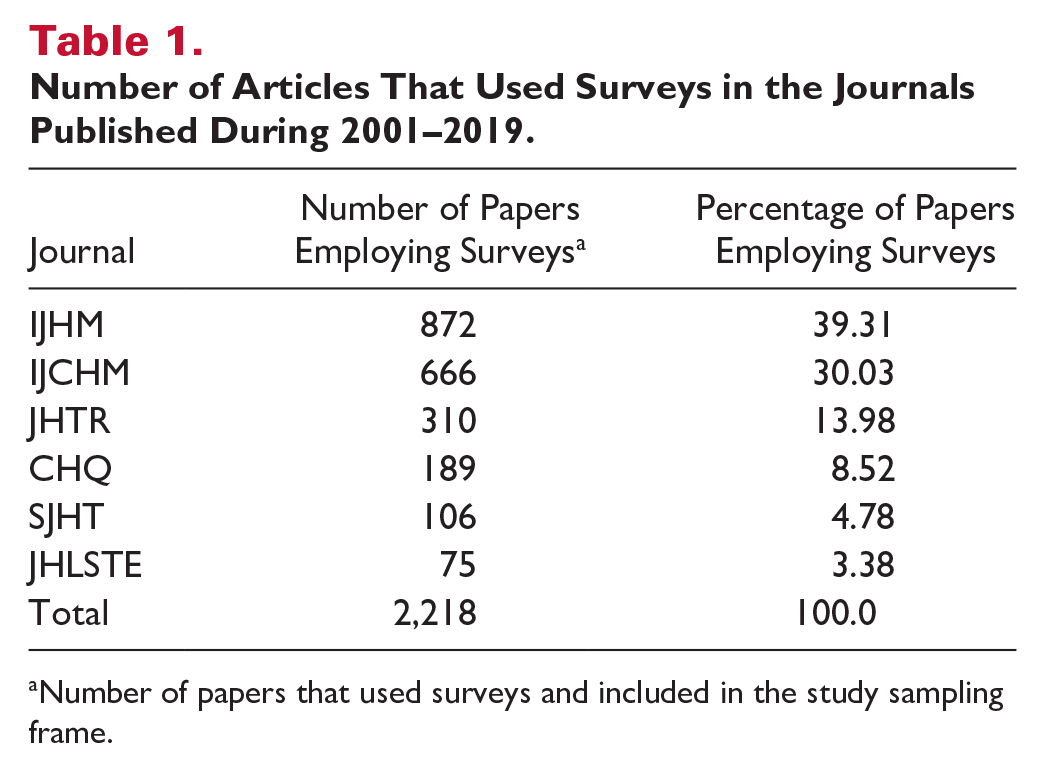
Number of papers that used surveys and included in the study sampling frame.
Papers using survey methods varied across research fields (industries). The research fields were determined based on information in the articles and coded by authors into six fields (industries) (See Table 2). Most of the research using surveys were conducted in the accommodations (904 papers) and food and beverage (533 articles) industries followed by tourism (281 articles), studies in multiple fields (269 articles), and travel and leisure (169 articles) (See Table 2).
Number of Articles With Survey Method Across the Research Fields (Industries).

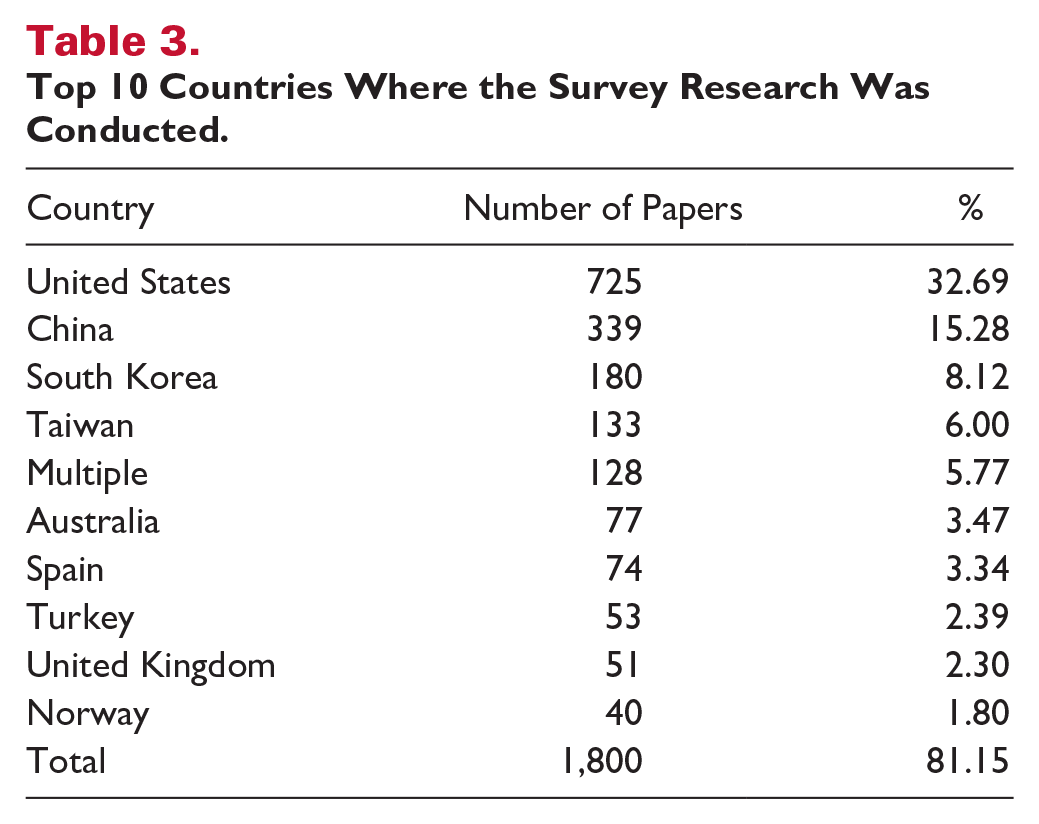
Research based on surveys was conducted in 84 countries. Table 3 shows the top 10 countries used in the research, which account for 81.15% (1,800 articles) of the total sampling frame. The first three countries listed in Table 3, the United States, China, and South Korea, account for more than two thirds of articles with survey design. Also, many studies used survey methodology conducted in multiple countries: 127 articles or 7% of all papers. A total of 77 articles did not mention the country or geographic location where the research was conducted.
Top 10 Countries Where the Survey Research Was Conducted.
A large number of the reviewed articles, 829 articles or 37.38% of the total number of papers with survey methods, failed to state response rate or provide information that would enable readers to calculate the response rate by themselves, that is, number of distributed and completed/returned surveys. Thus, those articles excluded from the sample. More papers that did not report a response rate occurred from 2010 to 2019 (40.3%) than from 2001 to 2009 (20.6%) (See Figure 1). Furthermore, authors who reported response rates often did not describe sampling methods and procedures for calculating the response rate. The final sample included 1,389 articles which reported using a survey method and response rate (or response rate could be calculated based on the information provided in the articles). The sample included articles with mixed-method research. Mixed-method research refers to using multiple methods (including surveys) for data collection. The only details related to survey methodology were retrieved from these articles for further analysis.
Analysis
The data were analyzed using SPSS 25. The independent-samples t test and one-way analyses of variance (one-way ANOVAs) with a significance level of .05 were used to test differences between response rates of the various groups of respondents, countries, industries, and research techniques. The Welch’s statistic was reported as results of the one-way ANOVA when the assumption of homogeneity of variance was not met for the data. Also, Games–Howell post hoc test was employed as it is appropriate test when population variances differ and groups’ sample sizes are unequal (Field, 2009). In addition, the practical importance of the differences was assessed with Cohen’s d for two groups and η2 for more than two groups.
Results
Overall, the average response rate of this study’s sample was 54.44% (SD = 27.74%). The response rate range was from 0.0002% to 100%. The median of the response rate was 58% and mode was 64%.
Response Rate Change During 2001–2019 Time Period
To check whether the response rate practices changed over time, data from articles published in 2001–2010 and those published in 2011–2019 were compared. An independent samples t test revealed statistically significant differences between the response rates reported in 2001–2010 and 2011–2019, t (1,387) = −4.97; p < .001, d = 0.287. The average response rate increased from 49.20% in 2001–2010 (SD = 26.18%) to 57% in 2011–2019 (SD = 28.13%). Furthermore, the number of articles used response rate enhance techniques, such as follow-up, incentives, and advance notice, were greater in 2011–2019 than 2001−2010 (See Table 4).
Response Rate and Enhance Techniques During 2001–2019.

Response Rates Across Countries and Geographical Regions
The studies conducted surveys in Northern Cyprus, Iran, Thailand, Nigeria, and South Korea reported the highest average response rates, more than 70%. Research using responses from Australia, New Zealand, Ireland, and Switzerland had the lowest average response rates, less than 40%. Almost half of the papers in the sample used responses from the United States and China. Average response rates of studies conducted in the United States were 42.94% and in China were 64.63% (See Table 5).
Response Rate Across Countries a .
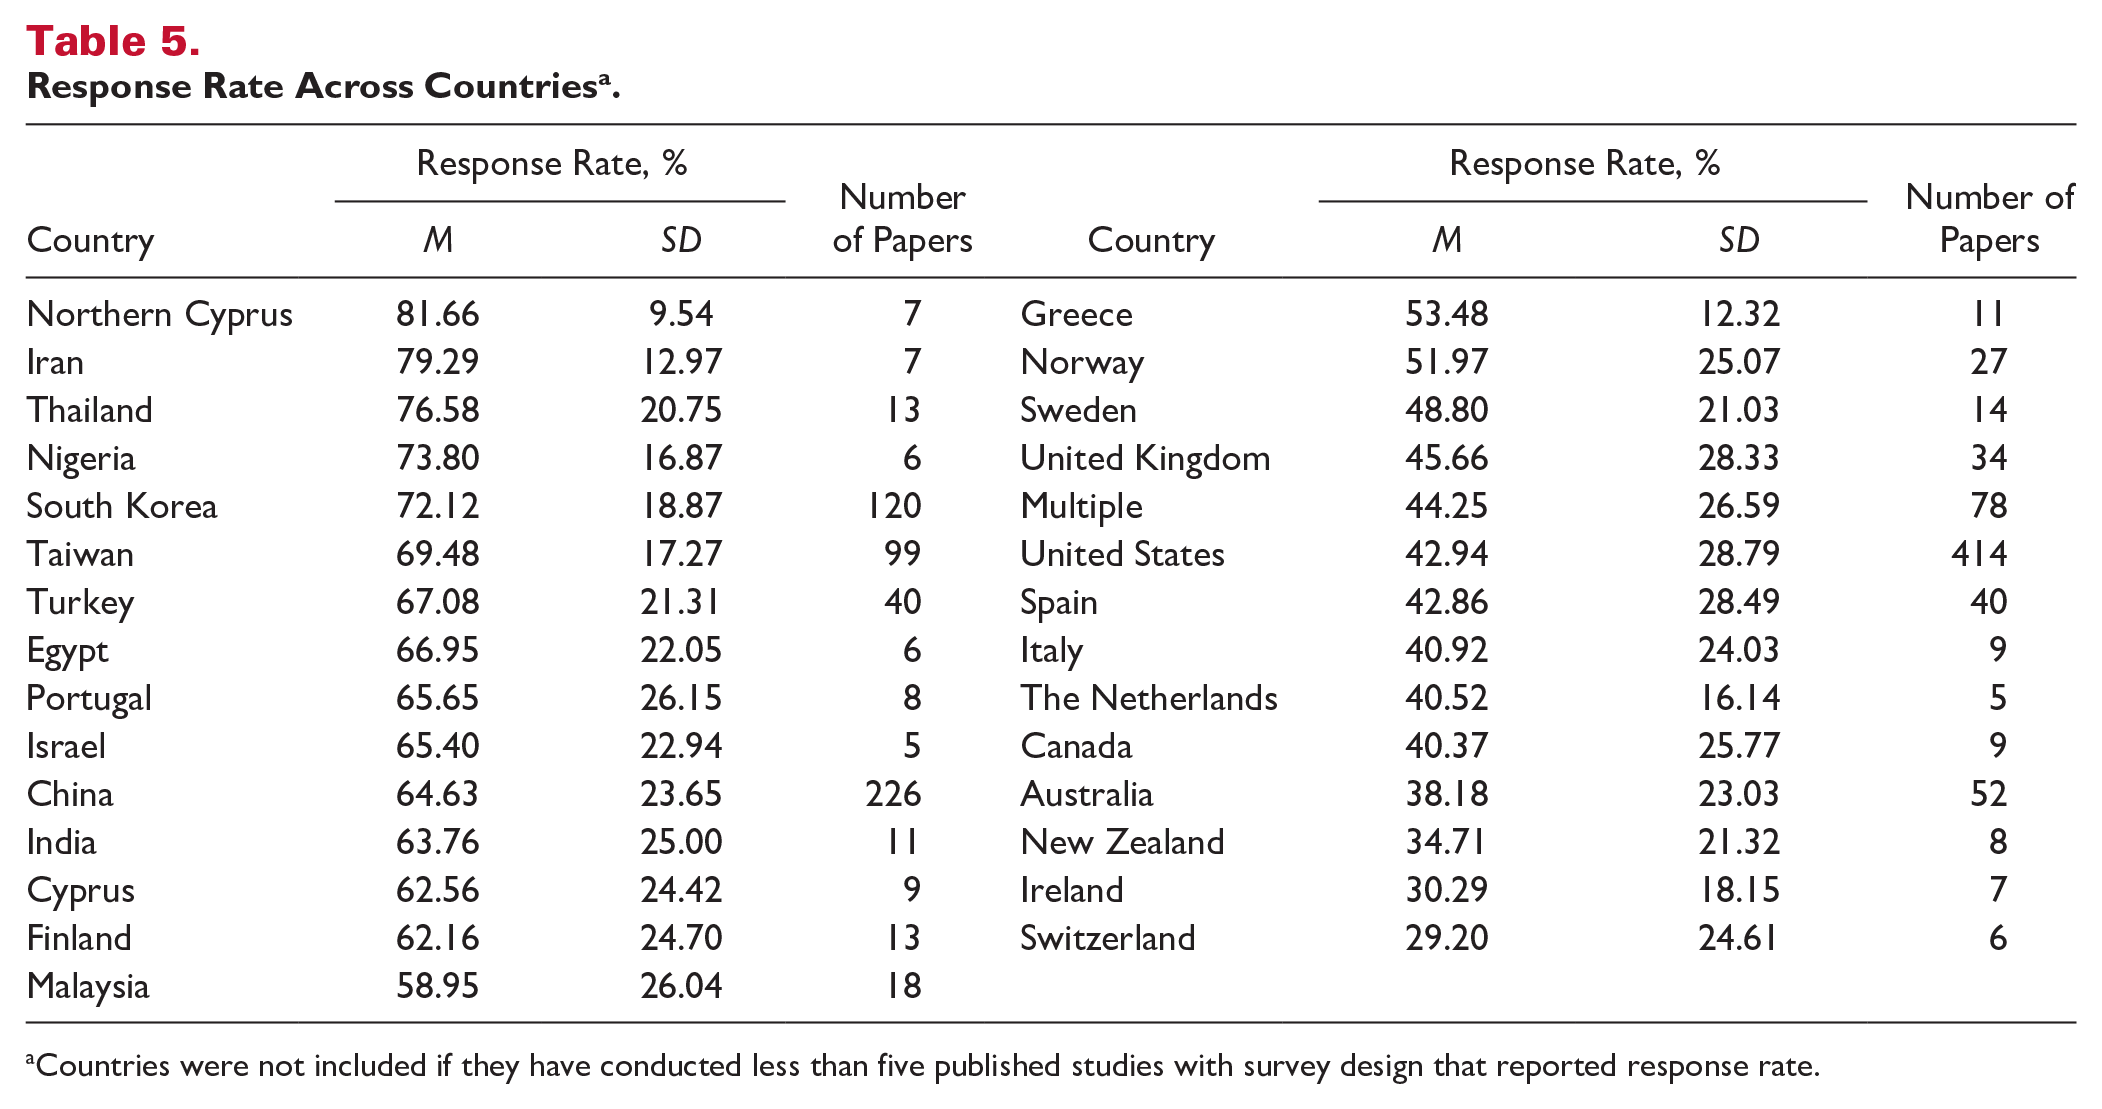
Countries were not included if they have conducted less than five published studies with survey design that reported response rate.
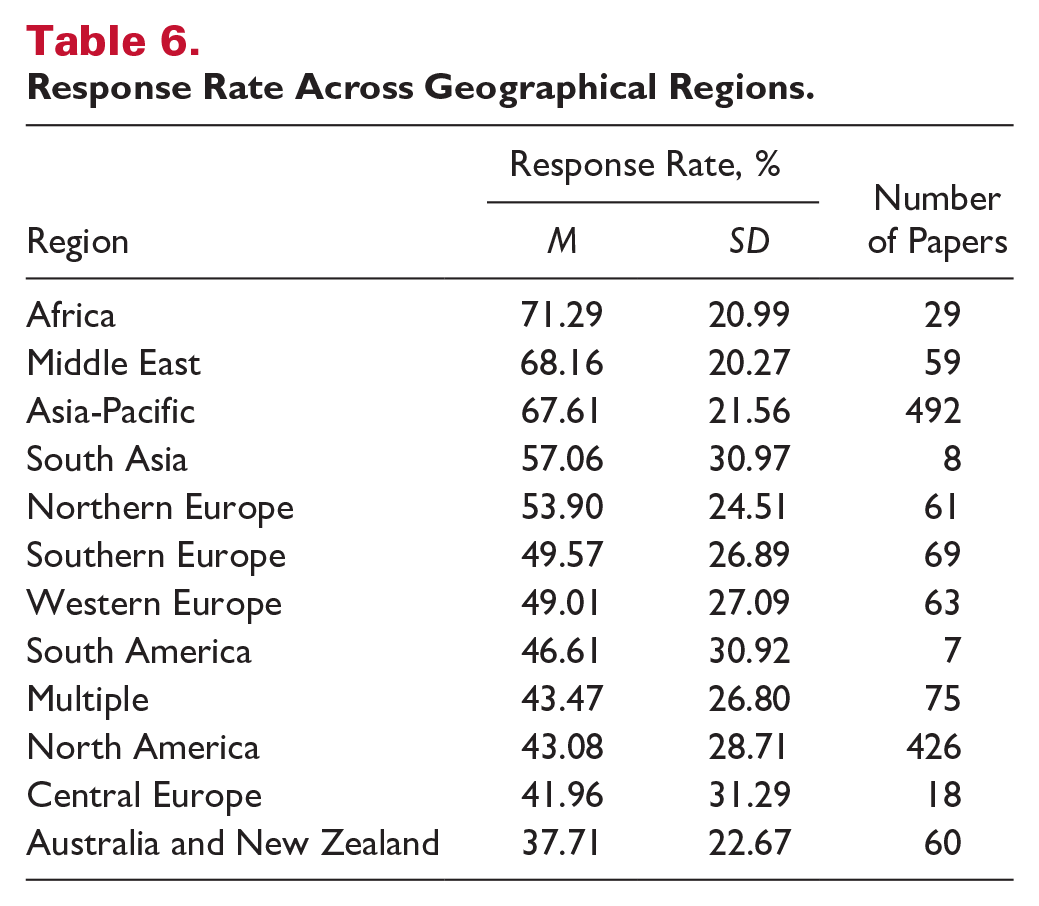
To have a more precise picture of the response rates in different geographical areas, countries were grouped into 12 geographical regions (See Table 6). The highest average response rates were observed in Africa (71%), the Middle East (68%), and the Asia-Pacific region (68%). Research using respondents from South Asia reported average response rates of 57%. The average response rates for studies conducted in Europe ranged from 42% in Central Europe to 54% in Northern Europe. North American studies had response rates of 43% similar to papers using respondents from European countries. The average research response rate for South America was 47%; for the region of Australia and New Zealand, it was 38%. These were the lowest average response rates in the sample (See Table 6).
Response Rate Across Geographical Regions.
Response Rate by Survey Type and Distribution
Based on an analysis of questionnaire type in studies published in reviewed journals, 24% of the papers used online questionnaires (335 articles), and 44% used paper-based questionnaires (611 articles). Thirty-four articles used both online and paper-based questionnaires with average response rates of 46%.
Almost 30% of papers did not report the type of questionnaire used (409 articles). Hence, we cannot determine what type of questionnaire was most popular among articles in hospitality journals. However, according to the one-way ANOVA test results, there are significant differences between the response rate of different questionnaire types (online, paper-based, and mixed both online and paper-based), Welch’s F(2, 91) = 92.40; p < .001, η2 = .168. The post hoc Games−Howell test revealed that the average response rates for paper-based questionnaires (M = 60.72%; SD = 24.96%) were significantly higher than average response rates for online questionnaires (M = 36.11%; SD = 27.75%), p < .001 and mixed questionnaires (M = 45.61%; SD = 22.72%), p = .003. However, there were no differences between the response rate of paper-based and mixed questionnaires.
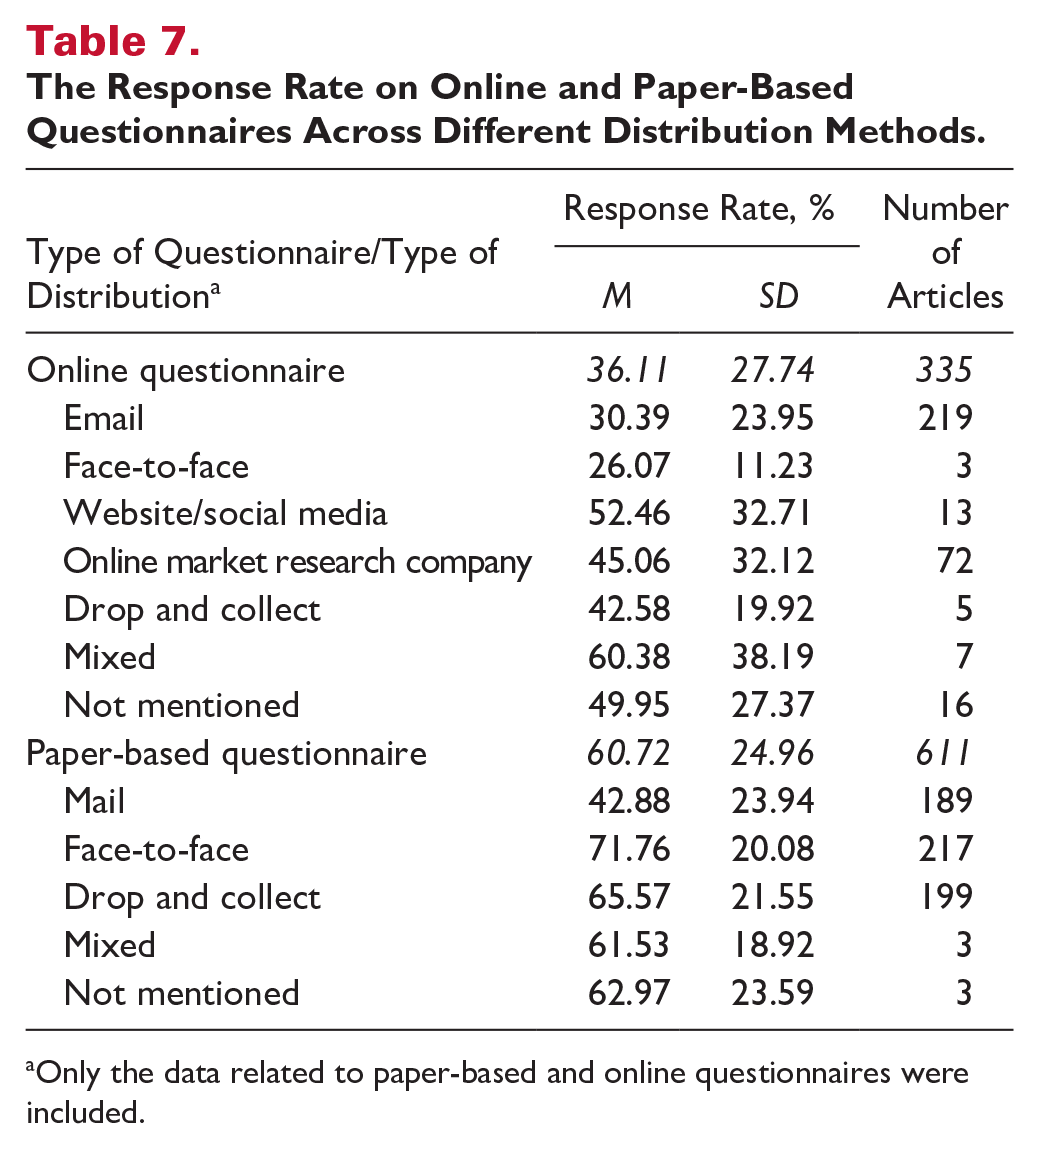
Our extensive review of articles in hospitality journals shows that response rates for online and paper-based questionnaires vary significantly depending on how the survey was distributed. Online questionnaires were distributed through email (in 219 papers), but also by posting a survey link to a website or on social media (in 13 papers), using an online market research company (including distribution through Qualtrics, SurveyMonkey or similar online panels) (for 72 papers), the drop and collect method (in five papers), or face-to-face interactions (in three papers). Paper-based questionnaires were distributed through the mail (in 189 papers), the drop and collect method (in 199 papers), or handed out face-to-face (in 217 papers). Table 7 shows the highest average response rate for a single type of distribution was 52.46% for online questionnaires distributed using websites or social media, followed by online market research companies with average response rates of 45.06% and the drop and collect method with average response rates of 42.58%. Online questionnaires distributed through emails had average response rates of only 30.39%, and in face-to-face encounters had average response rates of 26.07%. The response rates to questionnaires distributed through MTurk were not reported in any articles; thus, the studies with this type of distribution were not included in the sample and analysis. The highest average response rate of 71.76% was reported for paper-based questionnaires distributed face-to-face and the lowest for mail distribution (M = 42.88%). The average reported response rate for drop and collect distribution was 65.53%. Mixed methods of distribution of online and paper-based questionnaires resulted in average response rates of 60.38% and 61.53%, respectively.
The Response Rate on Online and Paper-Based Questionnaires Across Different Distribution Methods.
Only the data related to paper-based and online questionnaires were included.
Overall, as shown in Table 8, the most effective distribution method was face-to-face with an average response rate 70.19%, followed by the drop and collect method with an average response rate of 62.50% and website or social media distribution with the average response rate of 54.19%. The studies used mixed methods of distribution had average response rates of 50.39%. Papers reported a 45.06% average response rate for distribution via online market research companies, 43.87% by phone or fax, and 42.88% by mail. The lowest average response rate of 30.39% was for surveys distributed through email.
Response Rate Across Distribution Methods.

Response Rate by Target Respondents and by Industries
More than 60% of the studies used customers (34.77%) and employees (26.64%) as their samples. Managers participated as respondents in 14.76% of the studies and top managers in 5.18% of the studies. The rest of the studies used student samples (7.20%), other types of respondents (7.78%), and multiple types of respondents (3.67%) (See Table 9). Almost all studies reported volunteer participation in the surveys.
Response Rate by Target Respondents.
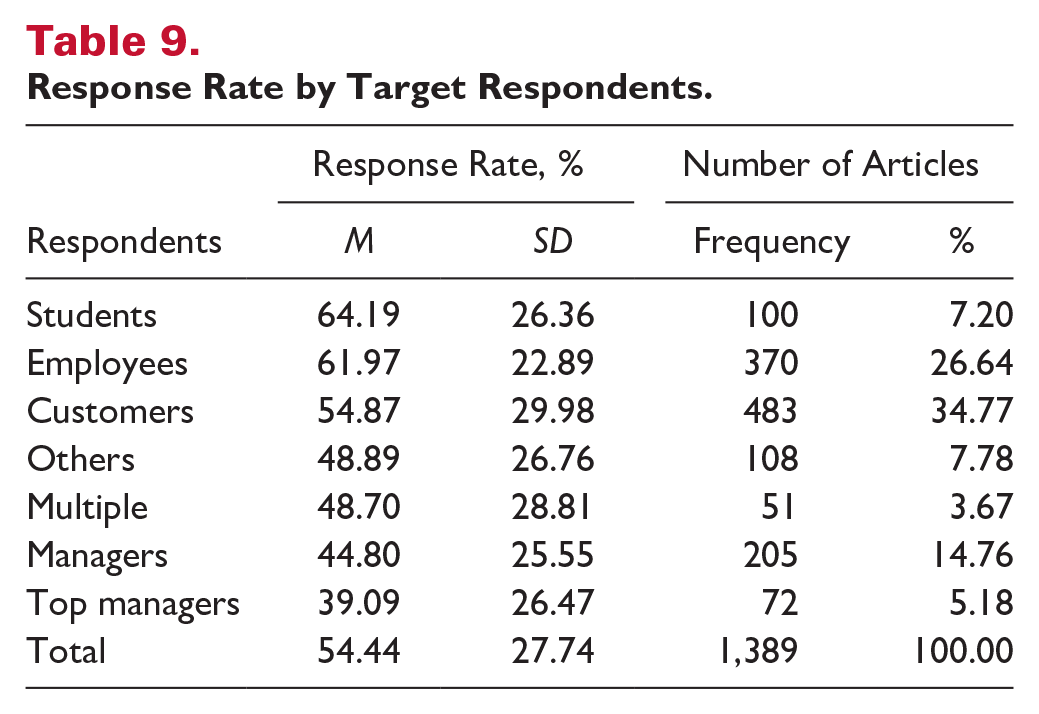
Based on a one-way independent ANOVA test, the average response rates of different types of respondents differed significantly, Welch’s F(4, 302) = 25.87; p < .001, η2 = .07. Games–Howell post hoc procedure was used since the homogeneity of variance assumption was not met. The post hoc test results revealed that customers’ response rate was significantly different from all other respondents (See Table 10). Studies that used students and employees reported the highest average response rates that were not significantly different from each other. Research using managers and top-level managers’ responses reported the lowest average response rate, 44.80% and 37.3%, respectively, that were not significantly different from each other (See Tables 9 and 10).
Response Rate Differences Among Types of Respondents.

Note. Games−Howell Post Hoc Analysis.
The one-way ANOVA results showed no statistically significant differences between industries’ response rates, F(4, 1,196) = 1.764; p = .134. The average response rate for research conducted in tourism was the second-highest average response rate of 58.20% after other industries (e.g., homeownership, sport and recreation, hospitals, retirement community) (M = 61.77%), followed by studies on foods and beverages (M = 56.82%) and travel and leisure (M = 53.66%). Papers on accommodations reported an average response rate of 53.54%, while studies with samples from multiple industries reported a 49.62% average response rate, the lowest response rates of all research areas (See Table 11).
Response Rate by Industry.

Response Rate-Enhancing Strategies
Once the overall response rates were identified, the focuses switched to the effectiveness of three strategies to enhance rates of response: follow-ups, incentives, and advance notice. Almost all papers mentioned that the researchers had guaranteed that their data collection was anonymous, and they notified their respondents of this policy.
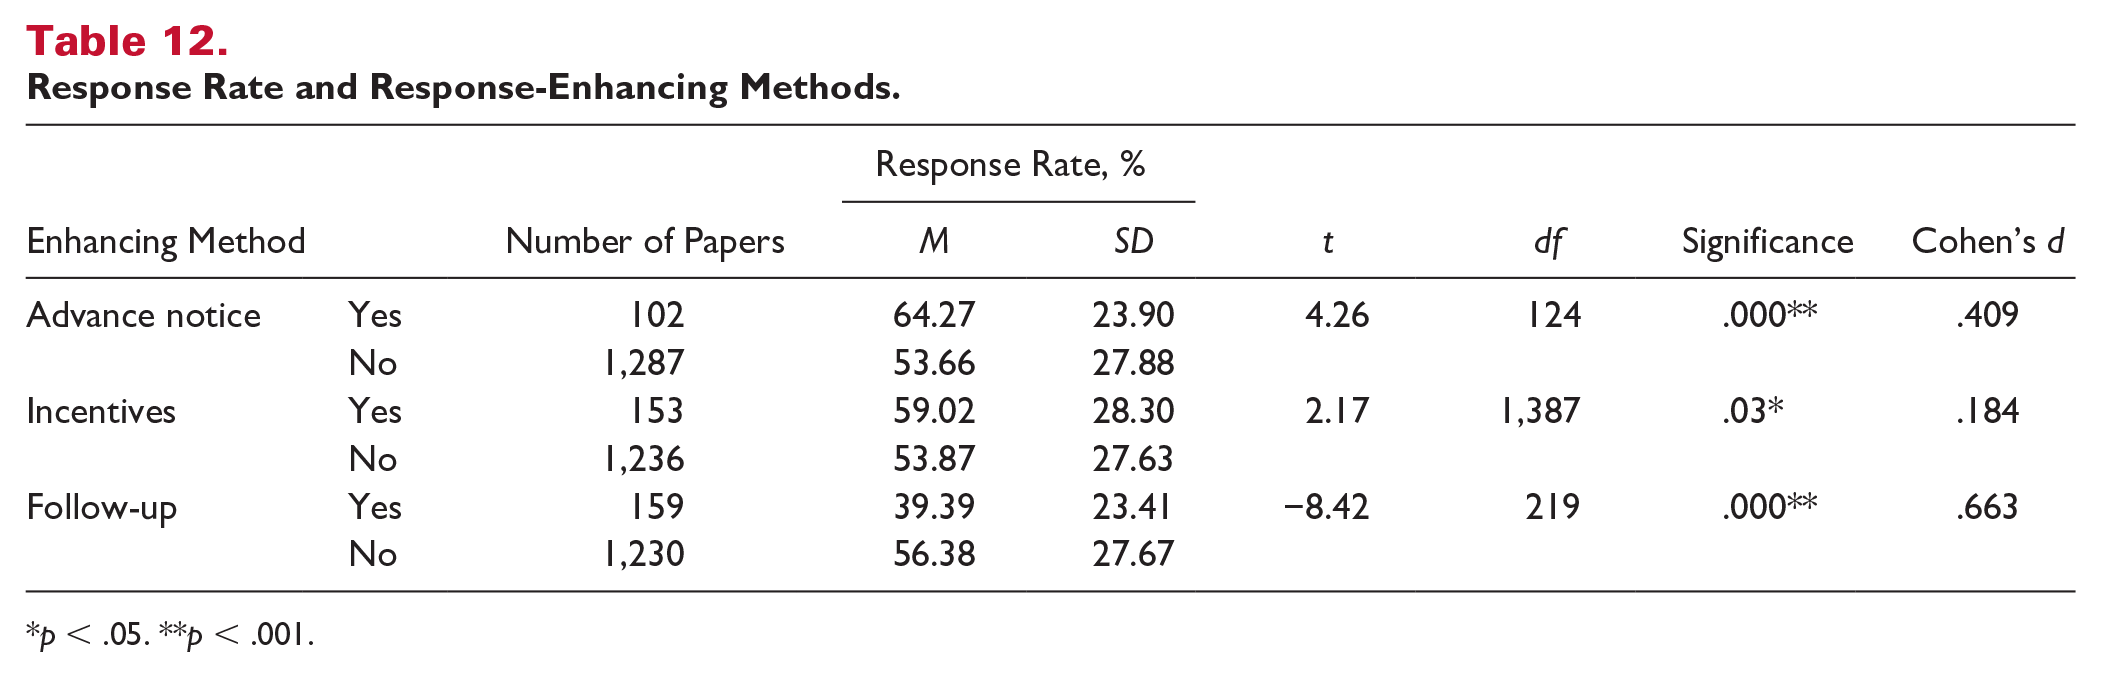
The results of the independent t test showed that using advance notice before conducting a survey significantly improved response rates, t(124) = 4.26, p < .001, d = .408. The studies that used advance notice before data collection reported a 64.27% average response rate, almost 10% higher than research that did not use advance notice (M = 53.66%) (See Table 12).
Response Rate and Response-Enhancing Methods.
p < .05. **p < .001.
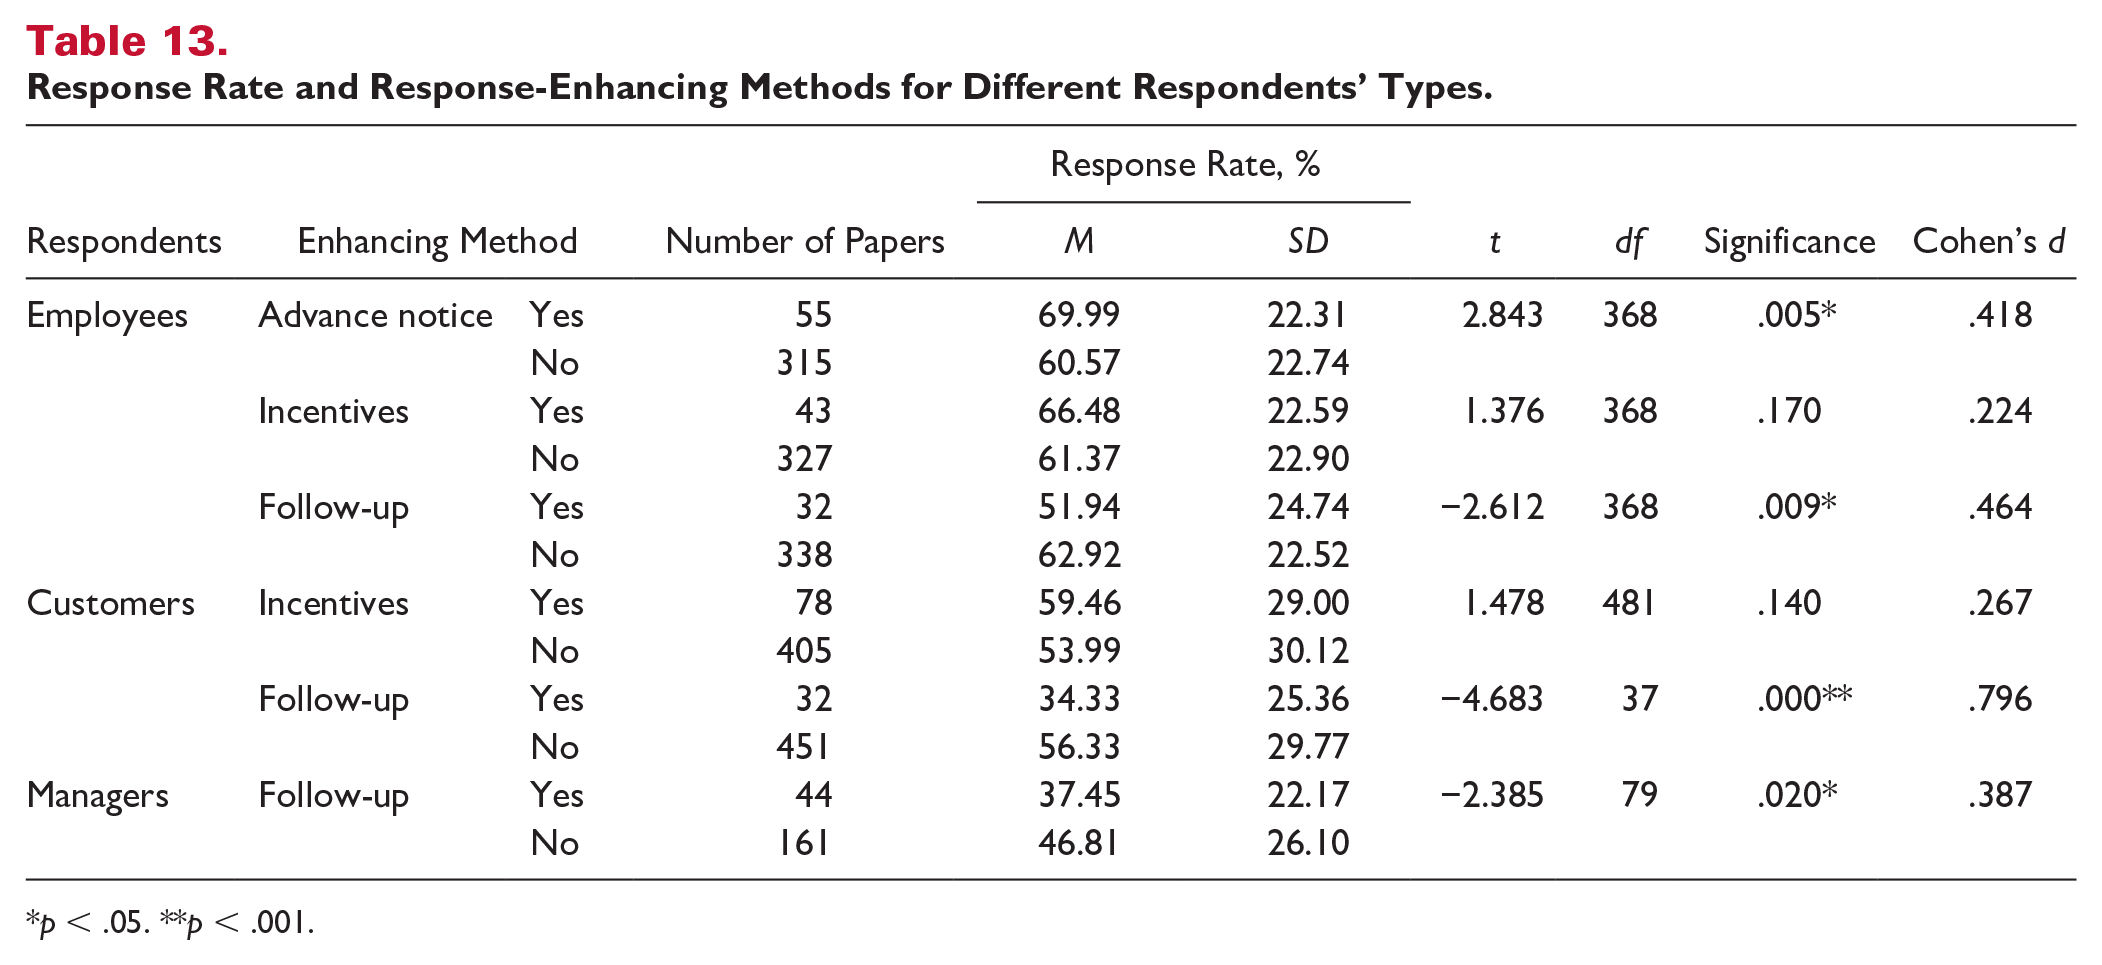
The advance notice was used for managers, employees, and customers in the sample of articles. However, further investigation of advance notice effect on different types of respondents was possible only for employees given the appropriate sample size for the analysis (See Table 13). The independent t test showed that the employee response rate of surveys with advance notice (M = 69.99%, SD = 22.31%) was significantly different from the response rate of surveys without advance notice (M = 60.57%, SD = 22.74%), t(368) = 2.84, p = .005, d = .42.
Response Rate and Response-Enhancing Methods for Different Respondents’ Types.
p < .05. **p < .001.
The results of the independent t test showed that paying incentives for participation changed response rates significantly, t(1,387) = 2.17; p = .03. However, this difference did not have practical importance (Cohen’s d = .184). The average response rates of studies using incentives (M = 59.02%) is only slightly higher than those that did not use incentives (M = 53.87%) (See Table 12).
Most incentives were offered to customers (in 78 papers) and employees (in 43 papers). The response rate of customers was higher when they were offered incentives (59.46%) than when they did not receive incentives (53.99%). The employee response rate was also higher when they received incentives (65.9%) than when no incentives were offered (60.2%). However, as shown in Table 13, the independent t test results showed no statistically significant difference among the response rate of a group with incentives and a group without incentives for both customers and employees (p > .05). At the same time, for both customers and employees, the difference had small practical importance (Cohen’s d = .267 and Cohen’s d = 0.224 respectively); thus, the difference may be statistically significant for a greater sample size of articles.
The independent t test also revealed that studies using follow-up reported significantly lower average response rates (M = 39.39%, SD = 23.41%) than those not using follow-ups (M = 56.38%, SD = 24.67%), t(219) = −8.42; p < .01, d = .66 (See Table 12). Most follow-ups were sent to managers (in 44 papers), employees (32 papers), and customers (in 32 papers). The independent t test results showed that managers demonstrated significantly different response rates in studies using follow-ups (M = 37.45%, SD = 22.17%) than studies that did not use follow-ups (M = 46.81%, SD = 26.10%), t(79) = −2.39, p = .02, d = .39. (See Table 13).
The results of independent t test also suggest that employees’ response rate was significantly lower in studies with follow-ups (M = 51.94%, SD = 24.74%) than in studies without follow-ups (M = 62.92%, SD = 22.52%), t(368) = −2.612, p = .009, d = .46. Moreover, independent t test showed statistically significant difference in customers’ response rate in studies with follow-ups (M = 34.33%, SD = 25.36%) and without follow-ups (M = 56.33%, SD = 29.77%), t(37) = −4.683; p < .001, d = .80 (See Table 13). The differences in response rate in studies with follow-ups and without had from small to large practical importance for all three categories of the respondents (See Table 13).
Discussion and Implications
Surveys are the most commonly used data collection method in hospitality research. In collecting data using survey approach, response rate is important to consider in establishing the credibility of a study since low response rates impact the result in poor data quality, which affects findings, raising serious questions about their generalizability and validity. Despite the importance of response rate, there is argument about acceptable response rate. Therefore, this study aimed at inspecting the adequacy of the practices assumed to increase response rate and decrease abrasion by reviewing 1,389 survey-based papers published in the top six hospitality journals indexed by SSCI. This study also examined whether there is a relationship between the techniques to enhance response rates and reported response rates in hospitality research. Finally, this study provided a threshold for response rates in hospitality management studies. Like other studies on response rate (Anseel et al., 2010; Baruch, 1999), we found significant differences among response rates for different types of respondents. The results show students are the most responsive group of the respondents (the average response rate was 64.19%), which may be because most surveys are distributed to students in classrooms by their professors. Students may want to help their professors in their research and are highly motivated to take part in the research. For hospitality researchers, however, students’ samples can be employed with proper caution. Hospitality researchers should avoid using undergraduate students except where appropriate as they might not possess the requisite knowledge to answer (Bello et al., 2009) unless the study topic involves undergraduate students (i.e., Generation Z traveler study). In addition, researchers who intend to use student samples should conduct the survey in-class setting or in a controlled setting, as it tends to deliver quality responses (Kees et al., 2017). Furthermore, researchers should note that students tend to comply with the authority and cooperate with researchers, who are often teachers in their academic environment, which may skew responses and, thus, findings, raising ethical concerns about the power relation between student and teacher (Jones & Sonner, 2001). Therefore, researchers should use a moderator while using student samples to ensure anonymity of the respondents. Hospitality researchers should ensure the anonymity of the survey and its exclusivity with students’ grades. In some instances, the professors may offer some incentives such as extra credit for taking the survey to the students. Hospitality researchers should also ensure students understand the importance of their participation for the study by making them feel involved in the study. In addition, reminders have also been proven to increase response rate, hence we suggest at least one reminder to be used when the survey is not conducted in a controlled environment. Finally, survey administration is also important, especially the promotion of the surveys on student preferred social media platforms. It is noteworthy that many concerns are raised in using student samples for research studies regarding issues of representativeness, generalizability, and comparability of results (Hanel & Vione, 2016). It appears that there is a need for further research to check the representativeness of student population to the general population.
On the contrary, the response rate of hospitality professionals depends on organizational hierarchy. Employees are the most responsive group among professionals (the average response rate was 61.97%). Employees are usually asked to participate in surveys by their HR department or supervisor, which may influence their responsiveness. Consequently, employees might feel pressured to complete surveys as an authority figure is asking them to do so. Hence, researchers are suggested to employ a moderator (i.e., a third-party research institution or company), independent but endorsed by the organization, who can help in data collection. Although employees may feel pressurized when an authority figure is asking them to fill out a survey, endorsement from management will make them feel secure and safe. It is important to involve the respondents and make them understand the importance of their responses for the research by telling them the potential benefits of the research. Managers responded to surveys for research less often than employees (the average response rate was 44.80%), even though the distribution methods for this group were usually the same as for employees. Similarly, to the studies of Anseel et al. (2010) and Baruch (1999), the response rate among top managers was 39.09%, the lowest of all groups of respondents. This may be expected as the top managers are usually busier and may not have spare time to devote on taking the surveys. It may be suggested that for this group, a clear purpose and benefit (i.e., sending summary results to them promptly) to them and their companies may be highlighted strongly. When they see that there is a clear benefit to them or their company, they may be more inclined to take the survey. Finally, customers were used as survey participants in 35% of the articles.
Our results also show that the average response rate for online questionnaires was 36.11%, significantly lower than the average response rate for paper-based questionnaires 60.72%. Studies using both online and paper-based questionnaires reported an average response rate of 45.61%. However, the response rate for online and paper-based questionnaires varied mostly because of survey distribution methods. For example, distributing online questionnaires through websites/social media, which has become more popular, achieved an average response rate of 52.46%, while traditional distribution through email drew a response rate of 30.39%. At the same time, face-to-face distribution of paper-based questionnaires resulted in a 71.76% response rate while mailing questionnaires had a response rate of only 42.88%. Overall, using face-to-face distribution had the most effective response rate (70.19%), and email distribution had the lowest response rate (30.39%). During face-to-face survey collection, researchers not only have a higher degree of control over the data collection process and the environment but also can interact with the respondent. Furthermore, since the researcher is physically present when collecting data, it is a bit difficult for the respondents to refuse. In this context, however, the survey taker might rush through answering the questions as they feel a psychological pressure. Hence, while approaching the respondents, researchers should ensure to explain the purpose and benefits of the research to the respondent and then keep an acceptable distance not to intimidate or pressurize the respondents. Given the results of this study, one may suggest that distributing surveys via email may be still effective way of conducting surveys as researchers may reach to a larger audience with email much easier, faster and cost efficient (Cobanoglu et al., 2001). However, when possible, these emails should be sent from official email addresses with full title and contact information in the email to develop respondents’ trust and avoid direction of email into the junk/spam folder. Face-to-face distribution of surveys may take more time and cost more money. Researchers may do well by investigating the cost-benefit analysis of each method.
Our findings can be used as relative response rates in survey research because researchers should be aware of the need to explicitly explain the appropriateness and adequacy of the response rates in their studies. Reviewers and editors, considering response rate averages provided in this paper, should also consider the characteristics of each survey and what affects response rates as they write their editorial guidelines. Furthermore, the response rate should not be considered the only measure of the quality and validity of a study in isolation from other important factors (Carley-Baxter et al., 2013; Mellahi & Harris, 2016; Morton et al., 2012). To evaluate the quality of reported results, using the correct distribution method is also important. For instance, if researchers are working on a study related to the behavior of Airbnb guests, distributing a survey through email to a panel of an online market research company, even if that provides a lower response rate, gives more accurate results than face-to-face distribution in a shopping center with a higher response rate.
This study uncovered several interesting facts about the effectiveness of response rate enhancing techniques. The study results suggest that only advance notice (prenotification) improves response rates significantly. Therefore, we recommend that authors send a personalized advance notice letter or email notifying respondents about the importance of participating in the research and asking them to take a survey before the actual questionnaire is sent. Using advance notice, researchers can introduce their research personally and motivate people to help them spend the time to recruit respondents. Some other examples of advance notice are:
Researchers asking visitors during an event whether they would like to participate in their survey. If the visitors agree to participate, researchers record their demographic information and email addresses and send the questionnaire later.
Researchers calling people from a database to ask whether they are willing to participate in the survey. After people agree, researchers send the survey by mail or email.
The general manager or representative of a professional organization encouraging employees to participate in the survey before questionnaires are distributed.
Our results also showed that overall paying incentives can increase response rates. The increase in response rate of customers and employees were approximately 5% higher when they received incentives. However, it is noteworthy that the values of response rate between customers and employees for this increase were not statistically significant. As per the literature, the improvement of response rate via incentives differ in different situations (Ryu et al., 2006). As such, researchers should make sure the type of incentives provided should be consistent to the type of the respondents and are cost effective. For example, coupons may be a good incentive for customers that they can receive after completion of the survey, but for employees, monetary or nonmonetary incentive that is given before the survey completion may be more effective as they feel that their time and opinions are valued. Furthermore, lottery incentives can be effective for increasing response rate of students if the survey is distributed online (Laguilles et al., 2011). Similarly, Cobanoglu and Cobanoglu (2003) suggested that the combination of a small incentive in the form of a gift (i.e., luggage tag, small amount of money) and including them in a draw for a bigger value prize (i.e., smart phone or tablet) yields the most response rate. For managers, incentive in form of results of the study related to their operations is a greater motivator for taking part in the survey than any monetary incentives.
Usually, follow-ups are used for increasing a very low response rate. Because the authors of the papers included in this study did not report the response rate before applying follow-ups, we cannot know how effective this enhance method was. However, we found that the studies using follow-up reported significantly lower response rates (39.39%) compared with those not using follow-up (56.38%). These results do not necessarily suggest that using follow-ups is ineffective in enhancing response rates. One possible explanation is the studies using follow-ups are those that distribute questionnaires by email, mail, phone/fax, which are the distribution channels that, according to results of our study, already had lower average response rates than, for example, face-to-face or drop and collect distribution. Without the response rate before applying follow-ups, we cannot know how effective this enhance method was. However, we found that the studies using follow-up reported significantly lower response rates (39.39%) compared with those not using follow-up (56.38%). These results do not necessarily suggest that using follow-ups is ineffective in enhancing response rates. One possible explanation is the studies using follow-ups are those that distribute questionnaires by email, mail, phone/fax, which are the distribution channels that, according to results of our study, already had lower average response rates than, for example, face-to-face or drop and collect distribution.
One other interesting finding is the difference in response rates across geographical regions. The highest average response rates were observed in Africa (71.29%), the Middle East (68.16%), and the Asia-Pacific (67.61%) (See Table 6). Research using respondents from South Asia reported an average response rate of 57%, but the average response rate of studies conducted in Europe and North America ranged from 42% to 54%. Research conducted in Australia and New Zealand reported the lowest response rates, less than 38%. These observed differences in response rates in different regions are in line with prior research (Harzing, 2000). One possible reason for this trend is the increasing concern about data gathering and privacy issues in western countries or overexposure of western consumers to questionnaires for data collection.
Finally, in this study, we uncovered the importance of reporting all details of research procedures in sufficient detail to prove the validity and quality of the study. Our results showed the number of hospitality related studies that use the survey method had increased consistently. However, during 2011–2019, we saw an increase in papers not reporting a response rate (40.3%) compared with 2001–2010 (20.6%). A significant number of articles (829 articles or 37.38% of revised articles with survey method design) failed to state response rate at all, nor did they provide any information to help readers in calculating the response rate. Moreover, some authors did not describe the sample population used in their studies, their sampling methods, and other important details and procedures of data collection. Some studies even failed to report respondent type or country where the survey was conducted. Researchers are required to provide necessary information about their study, the design, methods, and outcomes, all of which enable readers to assess the quality of the research. Even though some distribution methods (e.g., MTurk) make it impossible to calculate the response rate, authors should show that using such methods provides adequate data. In addition, active response rate should be reported when crowdsourcing platforms are used for data collection (See Table 14).
Recommendations and Guidelines for Hospitality Researchers.

Note. Active response rate = completes (total sample – {not qualified + not contacted}); HR = human resource.
Total response rate = completes/(total sample − not qualified).
Similarly, reviewers and editors have a duty to ensure transparent reporting and standards in the academic publications by asking for such details to be included in manuscripts that are under review. Table 14 summarizes the recommendations for improving the response rate for hospitality researchers and also reports recommended response rates for different circumstances in hospitality and tourism studies. Table 14 also provides some reporting guidelines for studies employing survey research to help with assessment of data quality.
Limitations and Suggestions for Future Research
This study has several limitations. First, the study compared response rates of publications that reported enhancing techniques with those that did not report them. Future research may extend our findings by conducting experiments to determine the effects of these techniques. Also, further research may need to examine response rate enhancing techniques not included in this study (multi-wave questionnaire distribution, length of questionnaires). Future research with the focus from the perspectives of an online survey or student sample might be conducted.
In terms of the limitations, some missing information (e.g., incentives; follow-up) can lead to different results. For instance, many reviewed studies do not discuss incentives. However, it did not necessary mean that they did not provide participants with incentives.
We investigated the response rates of published papers only in six hospitality journals indexed in SSCI. We did not take into account other types of research publications including research reports, conference papers, theses, dissertations, and working paper. Future studies can be conducted with a larger sample of papers from different sources, journals indexed in Scopus and other indexes. An additional limitation of this study is that JHLSTE has published since 2012, while all other journals in the sample had articles for the entire time frame (2001–2019).
Moreover, certain countries and geographical regions are overrepresented or underrepresented in publications. Papers from the United States, China, and South Korea account for more than half of the articles. Less than 1% of the total number of articles were from South Asia and South America. Therefore, we could not thoroughly test differences in response rates due to cultural differences in this study.
Finally, as highlighted in the paper, low response rates may increase concerns about nonresponse bias. It would be interesting for future studies to probe the relationships among response rates, sample size, effect size, and power to research the extent to which the response rates are problematic.
Conclusion
This study aimed to help hospitality researchers improve their response rates by inspecting the adequacy of the practices assumed to improve response rate and decrease abrasion. This study also reported on response rate enhancement practices and guidelines to highlight the linkage between the techniques to enhance response rates and reported response rates in hospitality research. Based on the authors’ knowledge, this is the first study offering a detailed assessment of response rates in the context of hospitality research. This study reviewed 1,389 articles using survey-based research that were published in the top six hospitality journals between 2001 and 2019 to identify the survey response rates in hospitality related studies. The average response rate of this study’s sample over 19 years was 54.44% and was not significantly different across industries. However, further investigation showed that this response rate is not a threshold for all hospitality studies because the response rates varied significantly across different survey types, distribution methods, enhancing techniques, target respondents, and geographical locations. The findings of this study can provide authors, reviewers, editors, and the scholarly hospitality community with a measure to help them correctly evaluate the acceptability of survey response rates based on what has been published in recent years.
Footnotes
Declaration of Conflicting Interests
The author(s) declared no potential conflicts of interest with respect to the research, authorship, or publication of this article.
Funding
The author(s) received no financial support for the research, authorship, or publication of this article.
