




Abstract
Moderation testing through latent factor models is relatively underutilized in hospitality and tourism research. The purpose of this research is to highlight the differences in the treatment of measurements of reflective constructs as composite indices versus latent factors in moderating effect tests in hospitality research. For this research, we build our primer on the investigation of the differences in customer satisfaction with the perceived entertainment experience at a hospitality/tourism attraction, contingent on customers’ personality trait extraversion, borrowed from the Big-Five mini marker inventory. Our findings illustrate the consequences of the measurement conceptualization and the representation of constructs in statistical models with interaction effects. While using composites simplifies the estimation of the regression paths and provides a reasonable sense of the direction of the effect and its statistical significance, it is not always aligned with the theoretical and conceptual underpinning of the employed constructs. A statistical model with composites may underestimate an interaction effect, whereas a model with a dichotomized moderator may overestimate the interaction effect. The findings of this research draw the attention of the hospitality and tourism research community on different representations of reflective constructs in their measurement and statistical models.
Introduction
Consumer behavior research in tourism and hospitality has been increasingly interested in investigating psychological constructs of individual differences among customers, such as personality traits, interests, and identities to facilitate psychographic segmentation (Pitt et al., 2020). Some individual differences are directly observable manifestations of consumers’ characteristics (e.g., their appearance, gestures, verbal and written communication), while others, such as personality traits, are captured via self-reported survey-based inventories with sound psychometrical properties, developed in social psychology and consumer behavior literature. The scores from observed survey indicators are commonly aggregated or averaged into composite indices (composites from here then) and used as moderators in general linear model (GLM) approaches that disregard measurement errors (Aiken et al., 1991; Diamantopoulos & Winklhofer, 2001).
The treatment of personality traits or similar constructs as composites creates a conflict with their theoretical underpinning as reflective measurement models which assume that a common latent factor exerts an effect on the set of observable indicators (Bollen, 1989). In other words, the indicators are “caused” by a latent factor (Diamantopoulos & Winklhofer, 2001). While reflective measurement models are assessed through confirmatory factor analysis (CFA) and employed in correlational research that tests the relationships among variables via covariance-based structural equation models (SEM), their reflective nature is occasionally ignored in designs that go beyond correlational research, namely, quasi-experimental and causal-comparative designs, that are often concerned with proposing moderating or interaction effects (Bagozzi, 1977; Hancock, 2004; Williams et al., 2009).
A review of the recent hospitality literature revealed that out of 815 studies published in the 16 leading hospitality and tourism management journals between 2001 and 2014 that used covariance-based SEM and partial least squares (PLS) techniques for structural model testing, 753 were based on reflective latent factors models (Ali, Kim, et al., 2018). Ro’s (2012) literature review of studies, published in the International Journal of Hospitality Management between 2001 and 2011 that tested moderation or mediation, suggests that SEM was predominantly used to examine mediating effects or a mix of moderating and mediating effects (Ro, 2012). Although both reviews suggest that covariance-based SEM has been adopted for testing of complex latent factor models, it is not clear whether moderators in these studies were categorical variables or continuous variables conceptualized as reflective measurement models.
Statisticians have long employed latent factor structural models to test moderating effects of continuous variables and account for the measurement errors (see Kenny & Judd, 1984; Klein & Moosbrugger, 2000; Klein & Muthén, 2002; Marsh et al., 2004; Moulder & Algina, 2002). Despite the popularity of SEM in hospitality and tourism research, moderation testing through latent factor models is relatively underutilized (for notable exceptions, see Grissemann & Stockburger-Sauer, 2012; Hodari et al., 2017; Kirillova & Wang, 2016; Lei et al., 2020). Models with latent factor interactions could be particularly useful in hospitality research interested in examining individual reflective traits such as need for uniqueness (Chark et al., 2019), status-seeking (Yang & Mattila, 2017), power (Liu & Mattila, 2017), and Big-Five personality traits (Bujisic et al., 2015). Therefore, there is a need to draw the attention of the hospitality research community on different representations of theoretical constructs in their measurement and statistical models.
To address this gap, the purpose of this research is to (a) illustrate the differences in the measurement models of reflective constructs as composites versus latent factors in the context of moderation tests in hospitality; (b) stress the problems with the inconsistent treatment of measurement models in latent factor models; and (c) provide guidelines for using different measurement models in moderation tests. Our illustrative example investigates the differences in customer satisfaction with the perceived entertainment experience at a hospitality/tourism attraction, contingent on customers’ personality trait extraversion, borrowed from the Big-Five mini marker inventory. We also investigate the subsequent effects of satisfaction on word-of-mouth (WOM) and return intentions (RI). While this research does not claim novelty in the development of statistical techniques, it provides valuable implications for hospitality researchers and practitioners on the importance of appropriate conceptualization, operationalization, and representation of reflective constructs in survey research and moderating effects studies.
Literature Review
Composite Indices versus Latent Factors
With the intention to extend and connect social sciences theories, or detect novel relationships in a specific business context, researchers may sometimes detach their theoretical approach to proposing the relationships among constructs of interest from the constitutive and operational definitions of the same constructs. Conceptual constructs denote general ideas about abstract phenomena and serve as a guide for measurement models, or the approaches to the development of observable indicators that measure abstract constructs (Sarstedt et al., 2016). Following the measurement theory, researchers develop measurements for conceptual constructs as multi-item questionnaires following the two basic types of measurement models: reflective and formative. Reflective constructs exert meaning and “effect” on directly observable and interchangeable indicators with measurement error captured on each indicator (Bollen, 1989; DeVellis, 1991; Spector, 1992). Specifically, each indicator reflects the meaning of the common construct and is highly correlated with other indicators in the measurement model. Thus, removing an indicator does not diminish the construct meaning (Henseler, 2017).
Formative constructs are proposed as composite indices of non-interchangeable indicators that contribute to the conceptual construct, meaning that removing an indicator changes the meaning of the construct (Diamantopoulos & Winklhofer, 2001; Henseler, 2017). The composite index is formed by assigning specific weights to formative indicators and applying some form of a linear combination of indicators (e.g., aggregating or averaging). The major difference is that indicators in composite indices do not incorporate error terms (Sarstedt et al., 2016). For example, “attitudes” or “personality trait” constructs are typically conceptualized as latent factors that exert influence on observable measures, whereas constructs that can be explained through a combination of distinct observable indicators, such as “service quality,” are of formative nature (Fornell & Bookstein, 1982). More recent literature considered formative measurement models as causal-formative, and suggested that even formative constructs can never be measured with maximum accuracy and thus recommended the inclusion of an error term at the construct level to account for missed causes and potential measurement errors (Diamantopoulos, 2006; Rasoolimanesh & Ali, 2018; Sarstedt et al., 2016). To avoid misconceptions, Henseler (2017) recommends a clear-cut distinction between the three measurement model types.
Nevertheless, ambiguity among hospitality researchers persists when selecting appropriate measurement models and statistical methods to test moderating effects in their studies (Ro, 2012). Specifically, the continuous nature of the variables that characterizes many reflective constructs may create complications for researchers (Ro, 2012). While some efforts have been made to call on the more nuanced treatment of measures in statistical models (Ali, Kim, et al., 2018; Ali, Rasoolomanesh, et al., 2018), tourism and hospitality literature observed an interchangeable representation of reflective constructs in statistical models as formative composites and vice versa (Mikulić, 2018).
The misrepresentation of measurement models could be attributed to inherited beliefs that specific research designs are aligned with statistical techniques (e.g., experimental and quasi-experimental designs are analyzed via analysis of variance [ANOVA] or regression procedures, whereas SEM is reserved for correlational research that examines relationships among multiple constructs). Although such analyses facilitate inferences about measured constructs in population, they are insensitive to construct operationalization (Hancock, 2004). Many studies employing experimental designs with interaction effects adopt a suboptimal practice of creating composites of reflective constructs or artificial groups at moderator levels to fit those moderators into a commonly used analysis method (Cheah et al., 2020). In the following section, we review common approaches for moderation tests of continuous variables.
Testing Moderating Effects Using Regression and SEM Approaches
Regression approach to testing moderation
The regression approach to testing moderation examines the extent of the influence of a moderator on the effect of the focal predictor on the outcome (Hayes, 2013). In a multiple regression framework, moderation assumes the inclusion of the product of the focal predictor and a moderator in the regression model. Because regression equation requires observed variables, rather than latent variables, it limits the representation of reflective constructs in the model by simplifying them to either composites or categorical variables. Although tools such as Hayes’s (2013) PROCESS macro allow for automatic computation of the interaction product as well as sequential computation of moderating and mediating effects, they are based on ordinary least squares (OLS) regression of observed variables and are susceptible to measurement error bias (Hayes et al., 2017). Despite its drawbacks of not allowing the representation of latent factors in the models, PROCESS is a quick, simple, and widely used statistical macro to test interaction effects in hospitality research.
SEM approach to testing moderation
In the past three decades, latent factor modeling using SEM became a popular method of multivariate statistical analysis to test theoretical relationships in several academic disciplines, including hospitality and tourism (Hair et al., 1998; Schumacker & Lomax, 2016). SEM has two main advantages to multiple regression: (a) it allows for the estimation of multiple independent regression equations simultaneously and (b) it incorporates latent variables into the analysis and accounts for measurement errors in the estimation process (Hair et al., 1998; Klem, 2000). In other words, SEM establishes measurement models and structural models to address complicated behavioral relationships that may take the form of mediating or moderating effects (Ro, 2012). Due to the confusion about the adequate measurement methods to incorporate the interaction terms in covariance-based structural models (Cortina et al., 2001), the operationalization of the moderator in a latent model can alter the approach to statistical analysis.
For example, multi-group latent factor models are the commonly employed techniques for categorical, typically dichotomous moderators such as sex or first-time versus repeat visitation. Once measurement invariance is established, the relationships among the variables in multi-group latent factor models are estimated independently for each group or level of a categorical moderator. With moderators that assume underlying continuous scale, usually conceptualized as reflective constructs such as personal innovativeness, risk aversion, or agreeableness, researchers may experience challenges regarding how to incorporate such moderators in latent factor models (Cheah et al., 2020). A compromising approach is to reduce the reflective construct to a composite via categorization, typically to high and low groups, which results in an underestimation of moderating effect and inevitably Type I and Type II errors (Ro, 2012). An alternative approach is to integrate a reflective continuous moderator in the latent factor model with interaction by computing all pairwise products of indicators of the moderator and the exogenous predictor, with the addition of measurement errors associated with each product term (Marsh et al., 2004). More recent approach is latent moderated structural equations (LMS) method, based on the iterative estimation that does not require creation of product indicators (Klein & Moosbrugger, 2000).
However, latent interaction models are not widely accepted in hospitality research, despite well documented and easily implemented LMS procedures in Mplus statistical package (Cheung & Lau, 2017; Muthén & Asparouhov, 2015). Unlike OLS regression, LMS in Mplus automatically generates a latent variable that represents the interaction between two latent factors, or a latent factor and an observed variable, to account for measurement errors and issues with non-normality, thus resulting in less bias (Cheung & Lau, 2017). Extending the latent factor interactions modeling in hospitality could solve the dilemma of condensing reflective constructs to composites, or further categorizing the composites to fit them into regression or ANOVA tests of interaction effects.
An Illustrative Example: Does Extraversion Moderate the Relationship Between Entertainment Experience and Customer Satisfaction?
For over three decades, the study of the customer experience has been among the most important research topics in hospitality and tourism (Hwang & Seo, 2016; Kandampully et al., 2018; Quan & Wang, 2004). Favorable customer and tourist experiences were shown to elevate satisfaction (Cole & Chancellor, 2009; Cole & Scott, 2004; Hosany & Witham, 2010; Tsaur et al., 2007), which is an important antecedent of loyalty or consumers’ attitudinal and behavioral re-patronage (Hallowell, 1996; Kandampully et al., 2015; Yoon & Uysal, 2005). As a behavioral manifestation of loyalty, satisfaction predicts intention to return to the previously visited establishments and destinations (Choi & Chu, 2001; Prayag et al., 2019; Susskind & Viccari, 2011; Worsfold et al., 2016). However, satisfied hospitality and tourism customers may not return to the attraction, unless their experience is memorable (Zhang et al., 2018). Also, satisfaction leads to an attitudinal manifestation of loyalty, namely, sharing positive WOM about an establishment or a destination with peers (Han & Ryu, 2012; W. G. Kim et al., 2009; Tanford, 2016).
This primer focuses on the relationships among the entertainment experience realm of Pine and Gilmore’s (1998) framework, defined as passive participation experience absorbed by an individual, and the subsequent judgment of satisfaction, RI, and WOM. Taken together, this illustrative example (see Figure 1) seeks to purport the findings that customer satisfaction prompted by memorable experience enhances intentions of hospitality/tourism customers to revisit the attraction as well as their likelihood to recommend the attraction to their peers (Bujisic et al., 2015; J. H. Kim, 2018; Sharma & Nayak, 2019). The following hypotheses are proposed:

The Proposed Model That Introduces a Moderating Effect of Personality Traits on the Relationship Between Guest Experience and Satisfaction.
The moderating role of personality trait extraversion
The value derived from the consumption of tourism and hospitality experiences is contingent on customers’ moment-bound state of mind (Andersson, 2007), and also from consumers’ intrinsic characteristics such as personality traits (Bujisic et al., 2015; Gountas & Gountas, 2007; Leung & Law, 2010). For instance, traits extraversion and agreeableness elevate hotel guests’ satisfaction judgments, whereas neuroticism attenuates satisfaction (Jani & Han, 2014). Specifically, extraversion trait, or an individual’s extent of involvement in interpersonal interactions, is manifested in heightened enthusiasm, assertiveness, activity level, and outgoing behavior (McCrae & John, 1992). Individuals on the higher end of the extraversion continuum (i.e., extraverts) exhibit pronounced engagement with their external environment (Saucier, 1994) and seek active participation in tourism activities, possibly to attract attention from others (Komppula et al., 2016). Unlike introverts who are lower on extraversion trait, extraverts are more likely to partake in sensation-seeking tourist activities and risky behaviors that boost excitement, such as “chasing storms” (Xu et al., 2012).
Drawing from previous findings, the current research proposes that extraversion trait could alter the generally positive relationship between customers’ perceived entertainment experience and satisfaction, such that satisfaction is attenuated among those who self-identify relatively high on extraversion trait, compared with those who identify relatively low. As entertainment experience from Pine and Gilmore’s (1998) model is characterized by passive participation, it may not satisfy the activity-seeking of extraverts who crave for attractions that offer excitement and close social interaction such as sports & wellness, games, or gastronomy (Alves et al., 2020). Consequently, we predict that,
Method
Design, Procedures, and Sample
This research employed survey design and it was distributed using a purposive sampling technique. A 125 hospitality management undergraduate students from a large Southeastern U.S. university were instructed to recruit their family, relatives, and friends who visited a tourism attraction within 6 months before taking the survey in return for extra credit. Each recruiter was asked to share the survey with 5 to 20 participants. Recruiters were not allowed to complete the survey. In total, 1,250 surveys were distributed, and 328 completed responses were received, resulting in a 26.24% response rate. Participants were relatively younger (M = 23.13), mostly female (74.2%) and Caucasian (79%). The majority possessed at least a college degree (82.9%) and 59.5% reported a household annual income of $50,000 and more. Although this sample is not representative of the population of U.S. domestic tourists, it is appropriate to test for the proposed relationships using different statistical methods.
Those who qualified for participation were asked to recollect their last hospitality/tourism experience via three open-ended questions (e.g., describe the type of hospitality/tourism experience recalled, the name/location of the experience, and the approximate date of visit). They also reported the number of past visits (once: 48.0%, 2–3: 23.8%, 4–5: 10.7%, 6–9: 4.8%, 10 or more: 12.7%). Finally, participants were asked to evaluate their entertainment experience and outcome variables of interest. The items were offered in a randomized order of questions, irrespective of their constructs. Following the rating, the participants reported their five personality traits in a randomized order, as well as their demographic characteristics. In total, 252 valid surveys were used in the analysis after 10% of surveys with missing data were removed. The sample size of 252 is deemed appropriate for SEM testing per MacCallum et al.’s (1996) approach for testing the hypothesis of close fit. The minimum sample sizes needed for the desired power level of .08 for our structural models were NModel 2 = 118, NModel3 = 167, and NModel4 = 90.
Instrument
Instruments were adapted from previously developed and validated 7-point Likert-type scales for perceived entertainment experience (Oh et al., 2007), satisfaction (Cronin & Taylor, 1992), WOM (W. G. Kim et al., 2001), and RI (Kivela et al., 1999) (see Table 1). Personality trait extraversion was measured using an 8-item subscale from the 40-item Big-Five personality traits mini marker scale, which employs a 9-point scaling technique (Saucier, 1994). In sum, 21 items that measured two independent and three dependent variables were retained in the analyses.
Constructs Reliabilities and Scales.
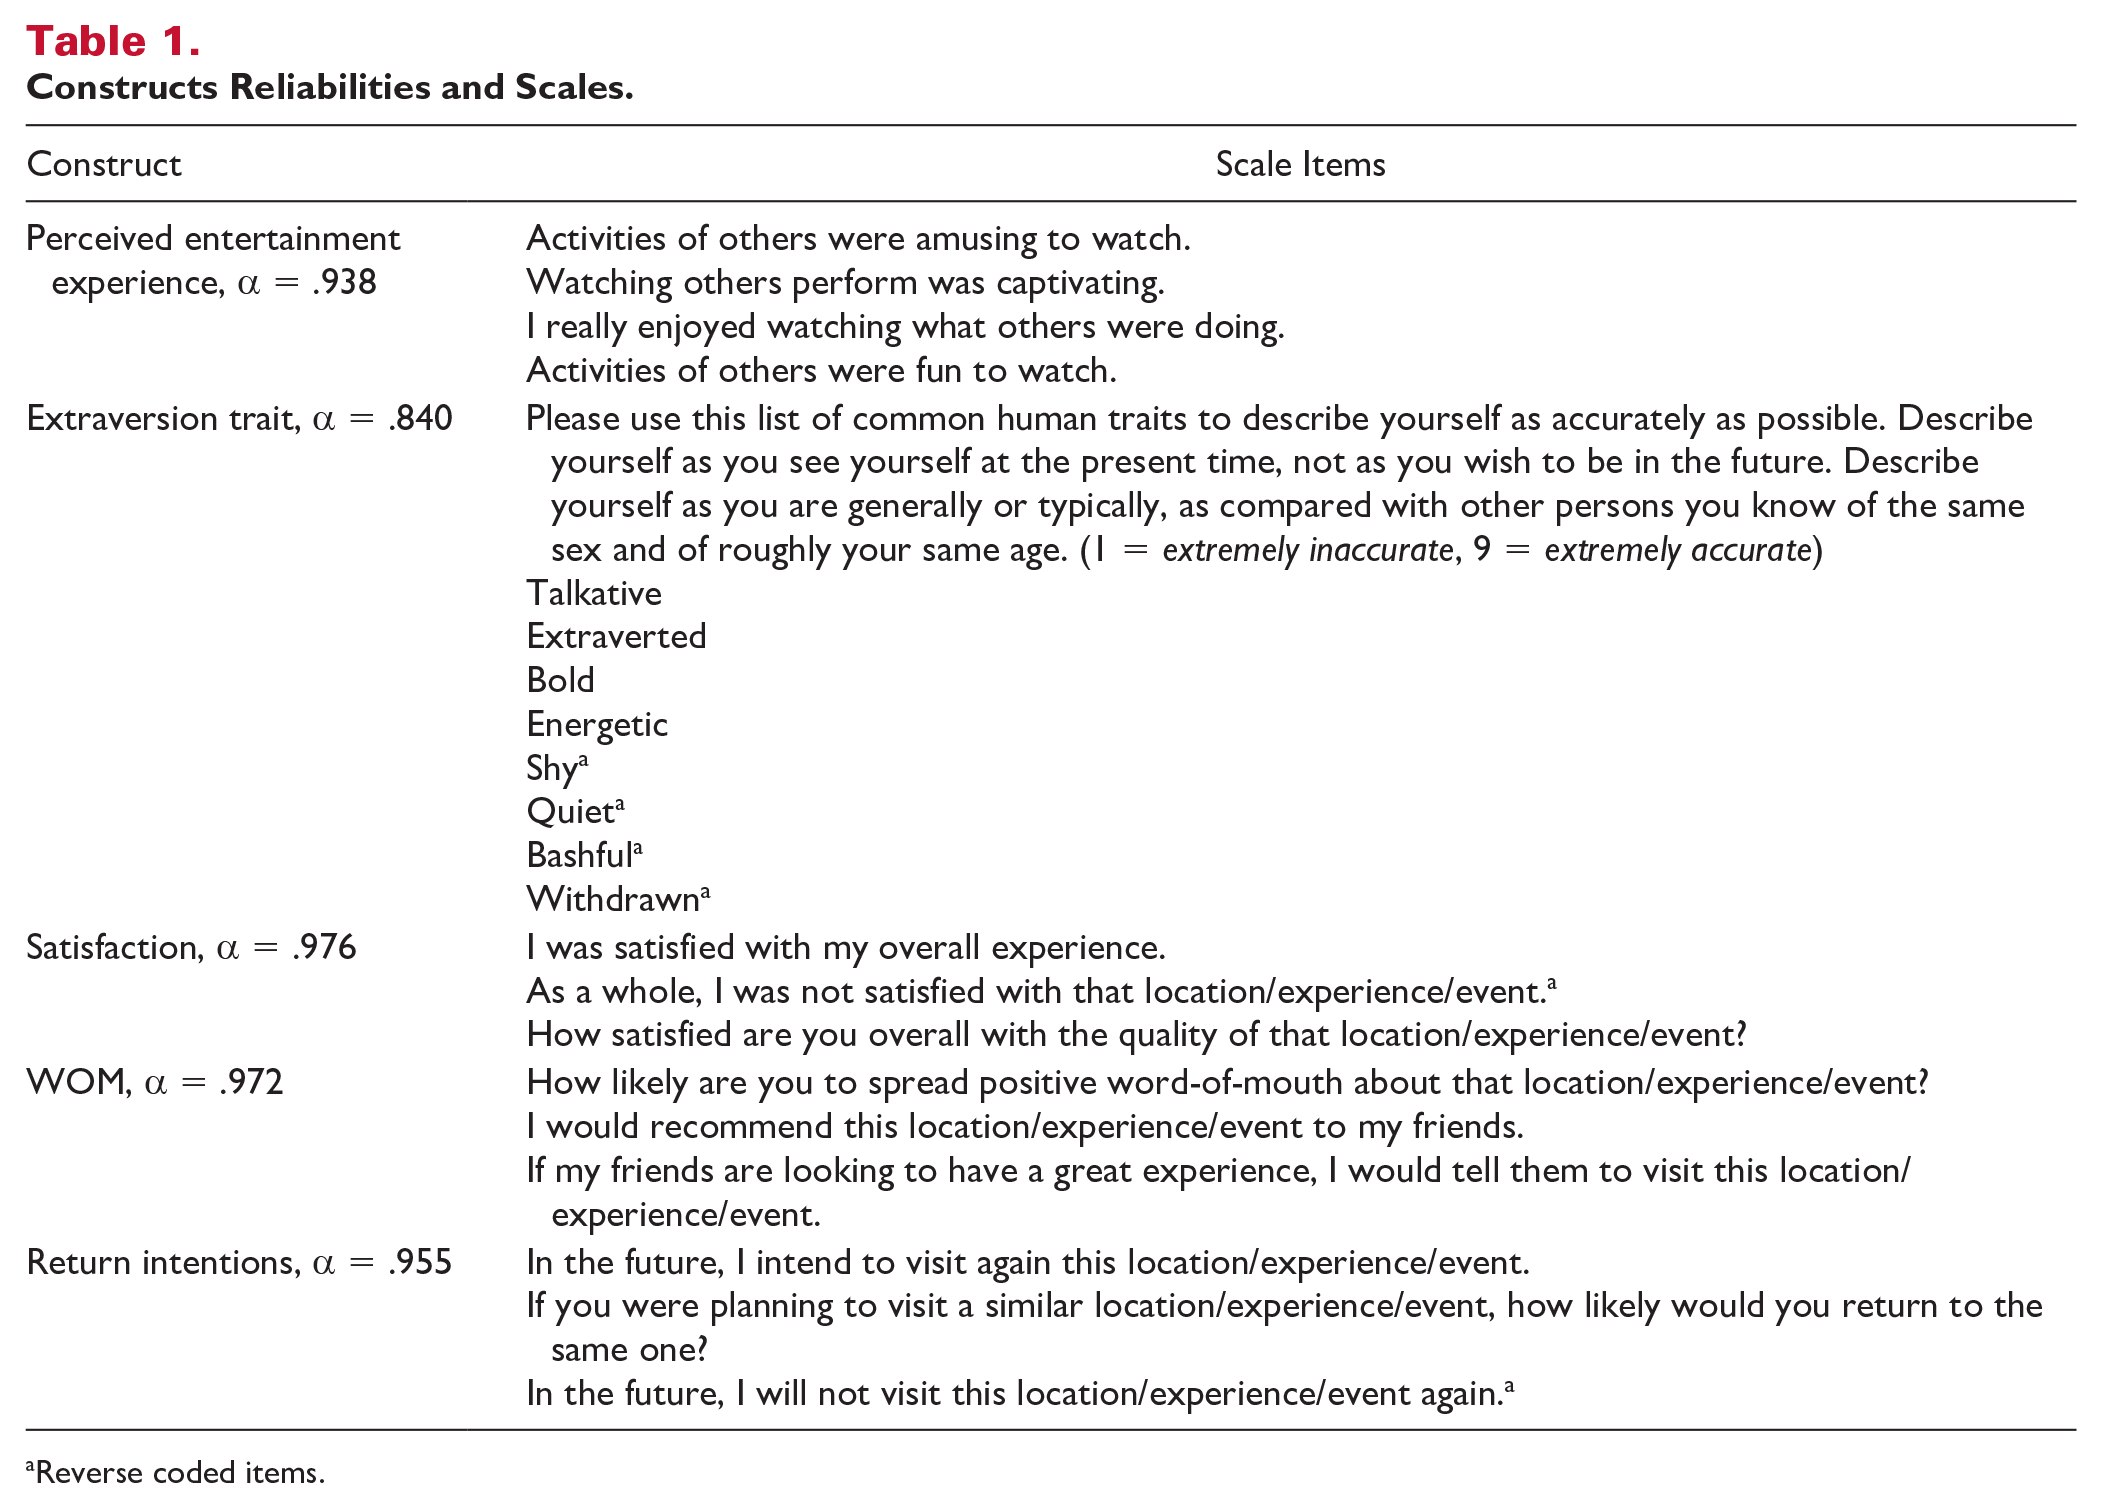
Reverse coded items.
Analysis Procedures
To test the appropriateness of the measurement model types with composites versus latent factors, as well as the moderating effect of the self-reported personality trait, our measurement and structural models were operationalized as follows:
For Model 1, we created composites for all variables of interest, based on the averages of indicators that measured the same constructs. For Model 2, we used latent factors for a perceived entertainment experience, satisfaction, WOM, and RI. The adequacy of the measurement model was tested using CFA. Next, we grouped participants into low (48%) versus high extraversion groups (52%) according to the median split (median = 6.13) of the extraversion composite and conducted a multi-group SEM in Amos. The same extraversion trait grouping variable was introduced in Model 3 as an exogenous observed variable and a moderator of the effect of the perceived entertainment experience on satisfaction. This model incorporated an interaction effect between the entertainment experience latent factor and a binary observed variable for extraversion trait (low vs. high). Finally, in Model 4, all variables of interest, including the two exogenous variables, perceived entertainment experience, and extraversion trait, were treated as latent factors, and their interaction term was generated in the model. Before structural model testing, a new CFA model was validated.
Results
Regression Assumptions
To test assumptions of normality, we examined skewness, kurtosis, residual Q-Q plots, and conducted Shapiro–Wilks’s test for residuals of satisfaction, WOM, and RI. Satisfaction variable met normality assumptions (skewness = −.777 < [−2, 2], kurtosis = 1.283 < [−2, 2]), whereas WOM and RI were more kurtotic (WOM: skewness = −1.309 < [−2, 2], kurtosis = 5.019; RI: skewness = −1.156 < [−2, 2], kurtosis = 2.992).
By observing the Q-Q plots of the residuals, we noticed that the observed data are not deviating much from the straight line, which further provides support that the normality assumption is not violated. Shapiro–Wilks’s test shows that the normality assumption is violated for all three variables (p < .001). All variance inflation factors (VIFs) were close to 1.0, thus ensuring the absence of multicollinearity. Finally, residual terms for all three variables were homoscedastic.
Model 1 Test: A Regression Model With Composites
As our data deviate slightly from normality, a bootstrapping approach was adopted to test the hypotheses using PROCESS macro in SPSS (Hayes, 2013). Bootstrapping method creates a custom distribution from the data and tests the significance of the results against that distribution which waives the normality assumption. Although PROCESS is typically employed to test the indirect effects (i.e., mediation), mediation is not within the scope of this study and thus will not be interpreted.
Hypotheses 1 to 3 were tested via two conditional process analyses with the perceived entertainment experience as the focal predictor, extraversion trait as a moderator, satisfaction as a mediator, and WOM as the outcome in one analysis, and RI as the outcome in the second analysis (Model 7: Hayes, 2013). All variables were added in the model as composites of their measured constructs and were treated as continuous variables. The analyses showed significant main effects of entertainment experience (a1 = .915, t = 4.876, p < .001) and extraversion trait (a2 = .739, t = 4.686, p < .001), and a significant entertainment experience × interaction effect on satisfaction (a3 = −.083, t = −2.701, p < .01).
Furthermore, the path between satisfaction and WOM was statistically significant (b2WOM = .899, t = 31.754, p < .001), as well as the path between satisfaction and RI (b2RI = .846, t = 25.467, p < .001). Thus, all hypotheses were supported. In addition, there was a significant direct effect of entertainment experience on WOM (cWOM = .085, t = 3.114, p < .01) as well as on RI (cRI = .109, t = 3.431, p < .001).
Model 2 Test: A Multi-Group Latent Factor Model
Unlike the conditional process model which relies on composites of the variables of interest, latent factor models account for their reflective nature. A common approach to testing a moderation is to establish the adequacy of the measurement model first using CFA, followed by a multi-group structural model test to detect the differences between the same paths across the two groups.
The measurement model incorporated four latent constructs (entertainment experience, satisfaction, WOM, and RI) reflected in 13 observed indicators and showed a good fit to data based on the pre-specified goodness-of-fit criteria, χ2(59, N = 252) = 84.061, comparative fit index (CFI) = .995 (>.95), Tucker–Lewis index (TLI) = .993 (>.95), root mean square error of approximation (RMSEA) = .041, 90% CI = [0.018, .060] (<.08), root mean square residual (RMR) = .040 (<.9) (Bowen & Guo, 2012; Hu & Bentler, 1999; West et al., 2012).
The standardized loading estimates ranged from .841 to .978 (>.70) (Hair et al., 1998). The inter-factor correlations were relatively higher, particularly among satisfaction, WOM, and RI. Per Fornell and Larcker’s (1981) criteria, the constructs showed acceptable convergent and discriminant validity (see Table 2).
Standardized Loadings and Validity of the Measurement Model 1 and Model 2.
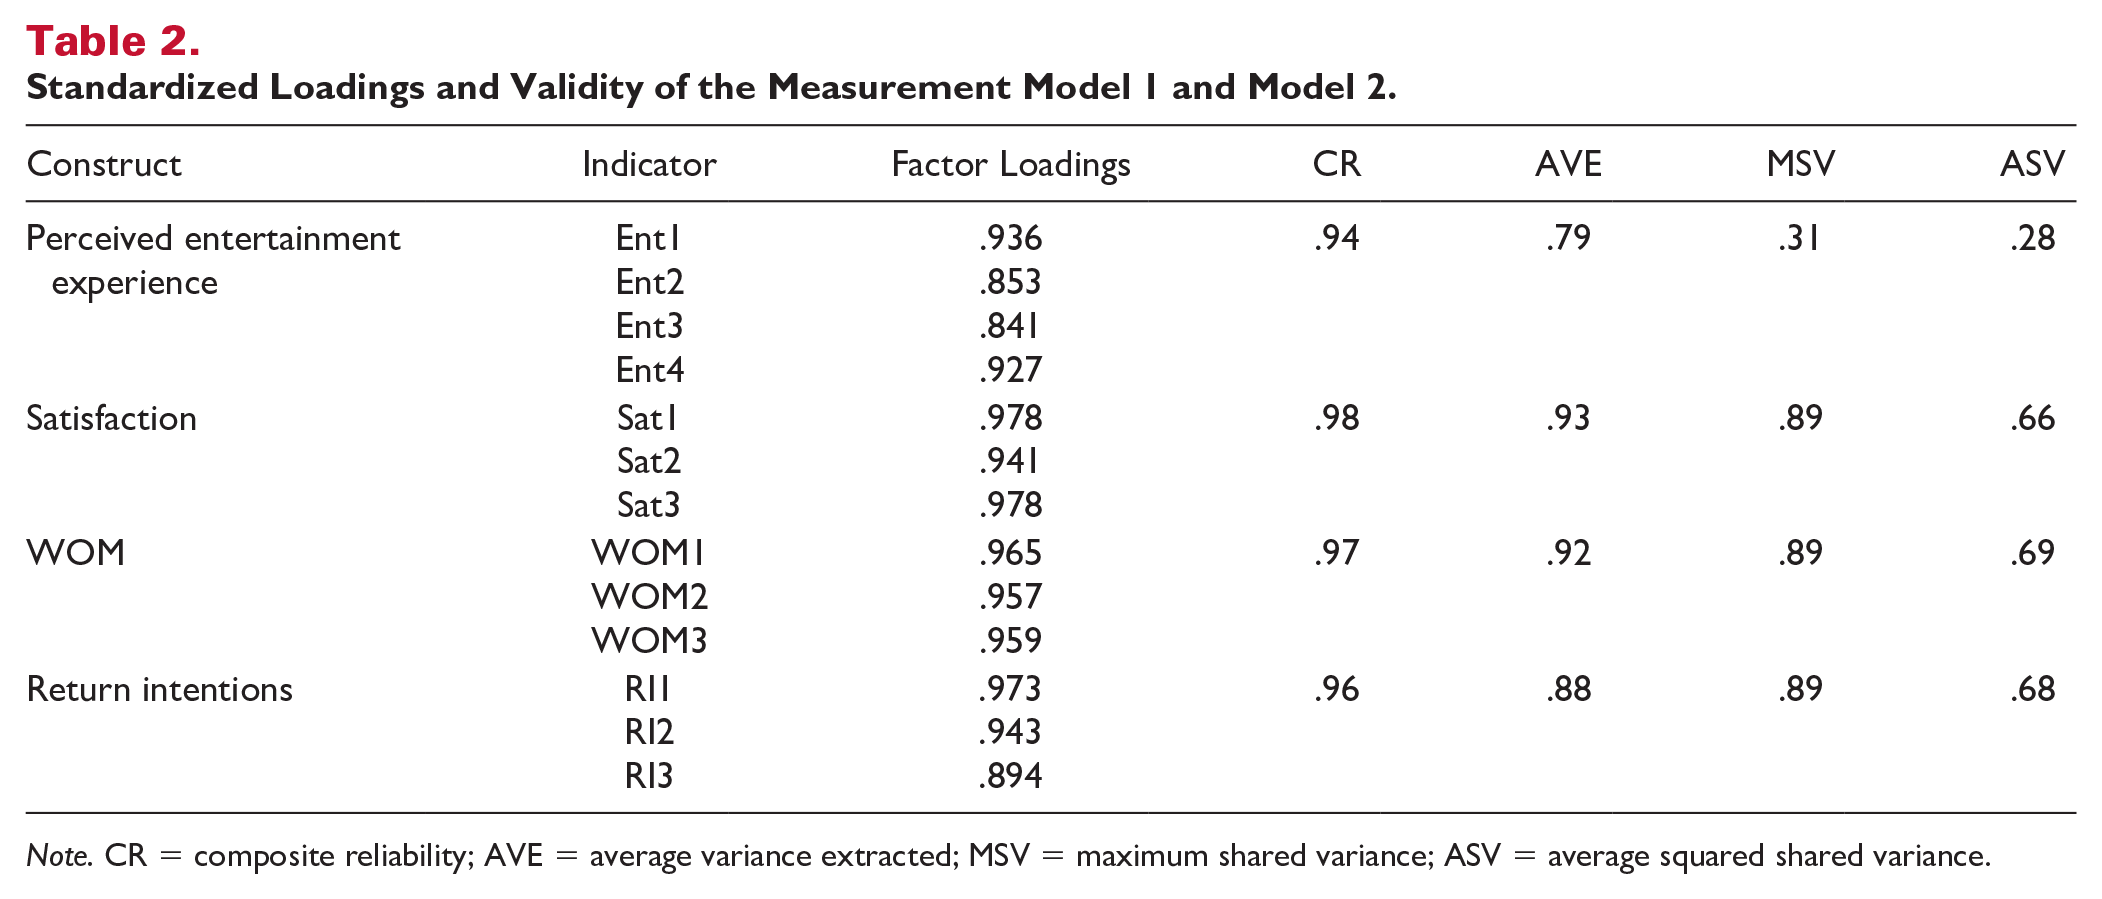
Note. CR = composite reliability; AVE = average variance extracted; MSV = maximum shared variance; ASV = average squared shared variance.
The estimated model yielded a good model fit, χ2(118, N = 252) = 132.91, p = .165, CFI = .997 (>.95), TLI = .996 (>.95), RMSEA = .022, 90% CI = [0.000, 0.040] (<.08), RMR = .042 (<.9) (Bowen & Guo, 2012; Jöreskog & Sörbom, 1996; West et al., 2012; Wheaton et al., 1977).
The statistical tests suggested that all regression paths were supported (see Figure 2). For both introverts (low extraversion group, <6.13) and extroverts (high extraversion group, ≥6.13), positive entertainment experience leads to satisfaction (H1) which encourages their RI (H2a) and positive WOM (H2b). Thus, H1, H2a, and H2b were all supported. The pairwise comparison (critical ratio of differences or the ratio of the unstandardized path to the standard error associated with that estimate) between introverts and extroverts is greater than ±1.96 (z = − 4.028) (Hopwood, 2007), which confirms the moderating effect of extraversion trait on the relationship between entertainment experience and satisfaction, and thus H3.
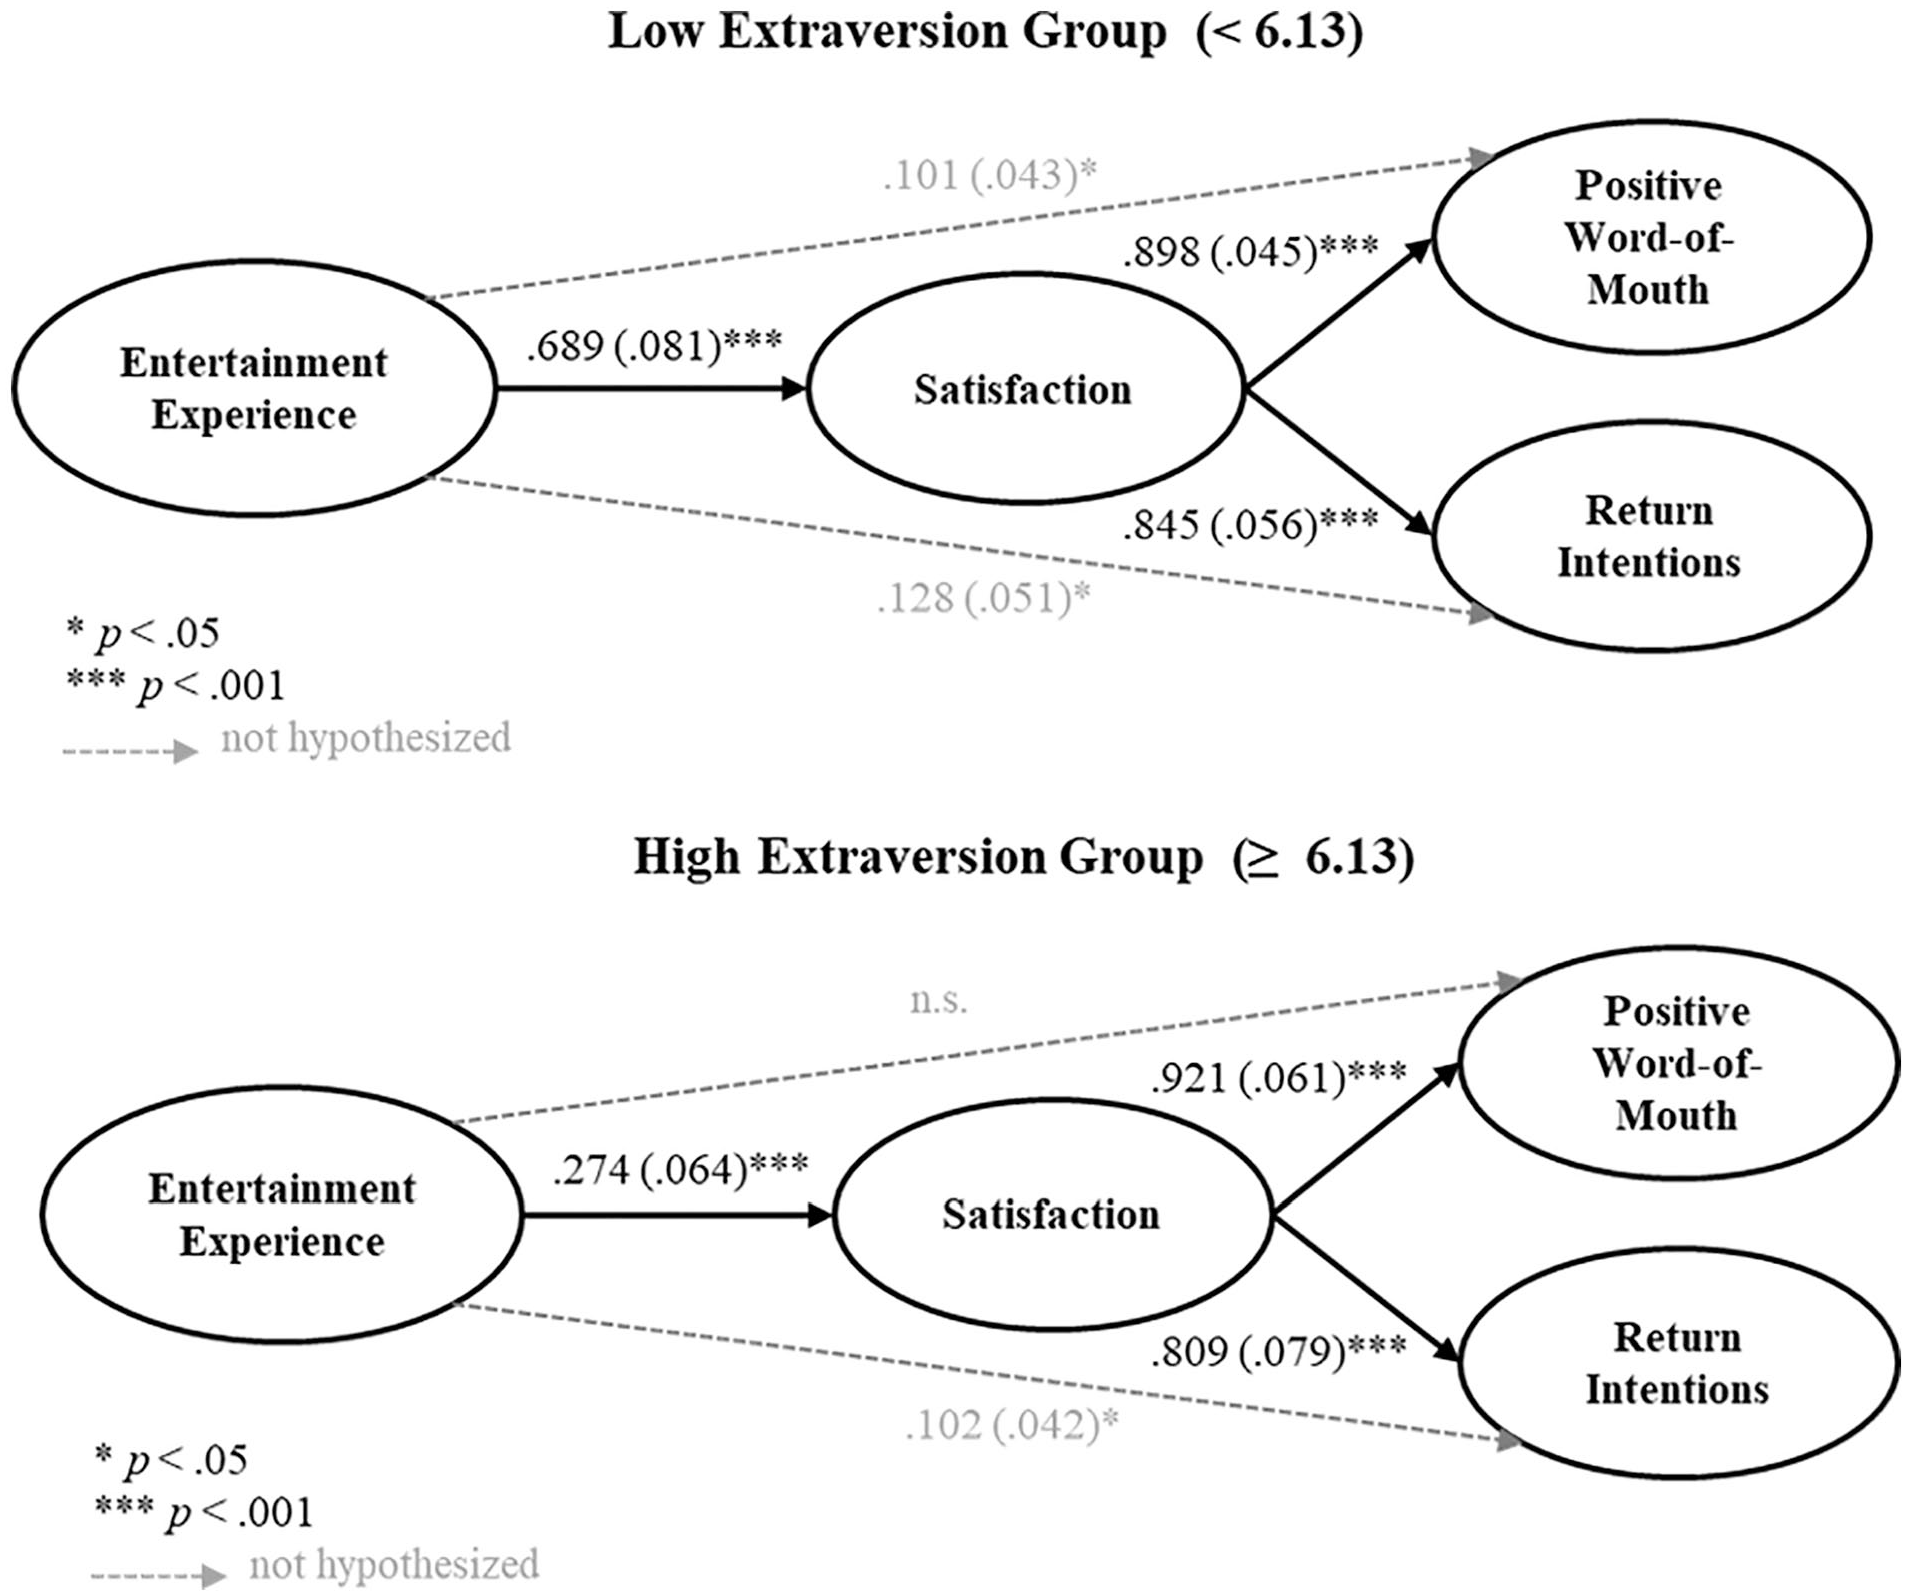
A Multi-.Group Latent Factor Model With Extraversion Median Split as a Grouping Variable (Unstandardized Estimates).
Model 3 Test: Latent Factor Model With an Interaction Between an Exogenous Latent Factor and a Dichotomous Observed Variable
Another approach to testing moderation is to utilize a binary grouping variable extraversion (i.e., introverts and extroverts) in an interaction with an exogenous latent factor entertainment experience, and endogenous latent factors for satisfaction, WOM, and RI. Although the measurement model is the same as Model 2, the structural model changes because the parameters for extraversion trait, observed exogenous variable, and the interaction term are freed for estimation in model testing.
As the algorithm for the model with the latent interaction term does not provide the goodness-of-fit indices, Muthén and Asparouhov (2015) advise to report the goodness-of-fit of the model without the latent interaction (nested) and to assess the fit of the model with the latent interaction (full) using the chi-square difference test based on log-likelihood values and maximum likelihood robust (MLR) scaling correction factors. The latent interaction significance is tested through a z-test.
Hence, we established the fit of the measurement model with 14 indicators and four latent factors first using Mplus with MLR estimator which accounts for the non-normality of data (Muthén & Asparouhov, 2015). The structural model met the pre-specified goodness-of-fit criteria, χ2 (71, N = 252) = 75.617, p = .332, CFI = .998 (>.95), TLI = .998 (>.95), RMSEA = .016, 90% CI = [0.000, 0.041] (<.08), standardized root mean residual (SRMR) = .017 (<.08).
Next, we proceeded to test the structural model with the latent interaction term (full) with 14 indicators but five latent factors (including a latent interaction term derived from latent factor entertainment experience and an observed binary indicator for extraversion trait). The MLR log-likelihood-ratio chi-square difference test was significant, χ2(1) = 8.023, p = .004, thus suggesting that the fit gets significantly worse in the nested model without the latent interaction. The latent interaction model fits the data at least as well as the parsimonious model without the interaction. The statistical tests provided evidence to support all hypothesized paths (Figure 3).

A Latent Factor Model With an Interaction Between an Exogenous Latent Factor and an Exogenous Observed Indicator (Unstandardized Estimates).
These results are consistent with the multi-group analysis but are more informative since this model constructs a proper regression equation with the observed grouping variable of the extraversion trait moderator. Specifically, positive entertainment experience predicts satisfaction (H1) which leads to RI (H2a) and positive WOM (H2b). The interaction coefficient is statistically significant and negative, thus suggesting that entertainment experience has a stronger effect on satisfaction for introverts compared to extroverts (H3). Furthermore, the difference between the two groups, introverts and extroverts, (γ = − .421, p = .002), is consistent with the difference between the regression paths between entertainment experience and satisfaction among the introverts and the extroverts in Model 2. Unlike Model 2, Model 3 is more precise because it estimates the main effect of extraversion trait on satisfaction (γ = − .747, p < .001).
Model 4 Test: Latent Factor Model With an Interaction Between Two Exogenous Latent Factors
Finally, to acknowledge the theoretical assumption of the extraversion trait as a reflective construct, in our final Model 4, we replaced the extraversion grouping variable with an extraversion trait latent factor and derived a latent interaction between the two exogenous variables: entertainment experience, and extraversion trait. However, because we introduced a new latent factor to the model, we first assessed the measurement model adequacy.
A CFA was conducted on a measurement model with 21 observed indicators five latent constructs (entertainment experience, extraversion trait, satisfaction, WOM, and RI). The measurement model indicated a good fit to data, χ2(179, N = 252) = 311.498, p < .000, CFI = .970 (>.95), TLI = .964 (>.95), RMSEA = .054, 90% CI = [0.044, 0.064] (<.08), SRMR = .061 (<.08). The standardized loading estimates for all factors except for extraversion trait were very high. We attribute the relatively lower estimates to multiple reverse coded items and the randomized order of the indicator questions in our instrument. The inter-factor correlations ranged from .133 to .95. Per Fornell and Larcker’s (1981) criteria, almost all constructs showed good convergent and discriminant validity (see Table 3). The complexity of the extraversion scale resulted in a somewhat lower average variance extracted (.4), as a more conservative convergent validity measure than the composite reliability which was higher than the .7 threshold at .84. Although the convergent validity of extraversion trait is not ideal, it is considered acceptable following the less stringent guidelines (Cheung & Wang, 2017; Fornell & Larcker, 1981). Compared with our Model 2 and Model 3, in a larger model, there is a slight tradeoff of the measurement model fit.
Standardized Loadings and Validity of the Measurement Model 4.
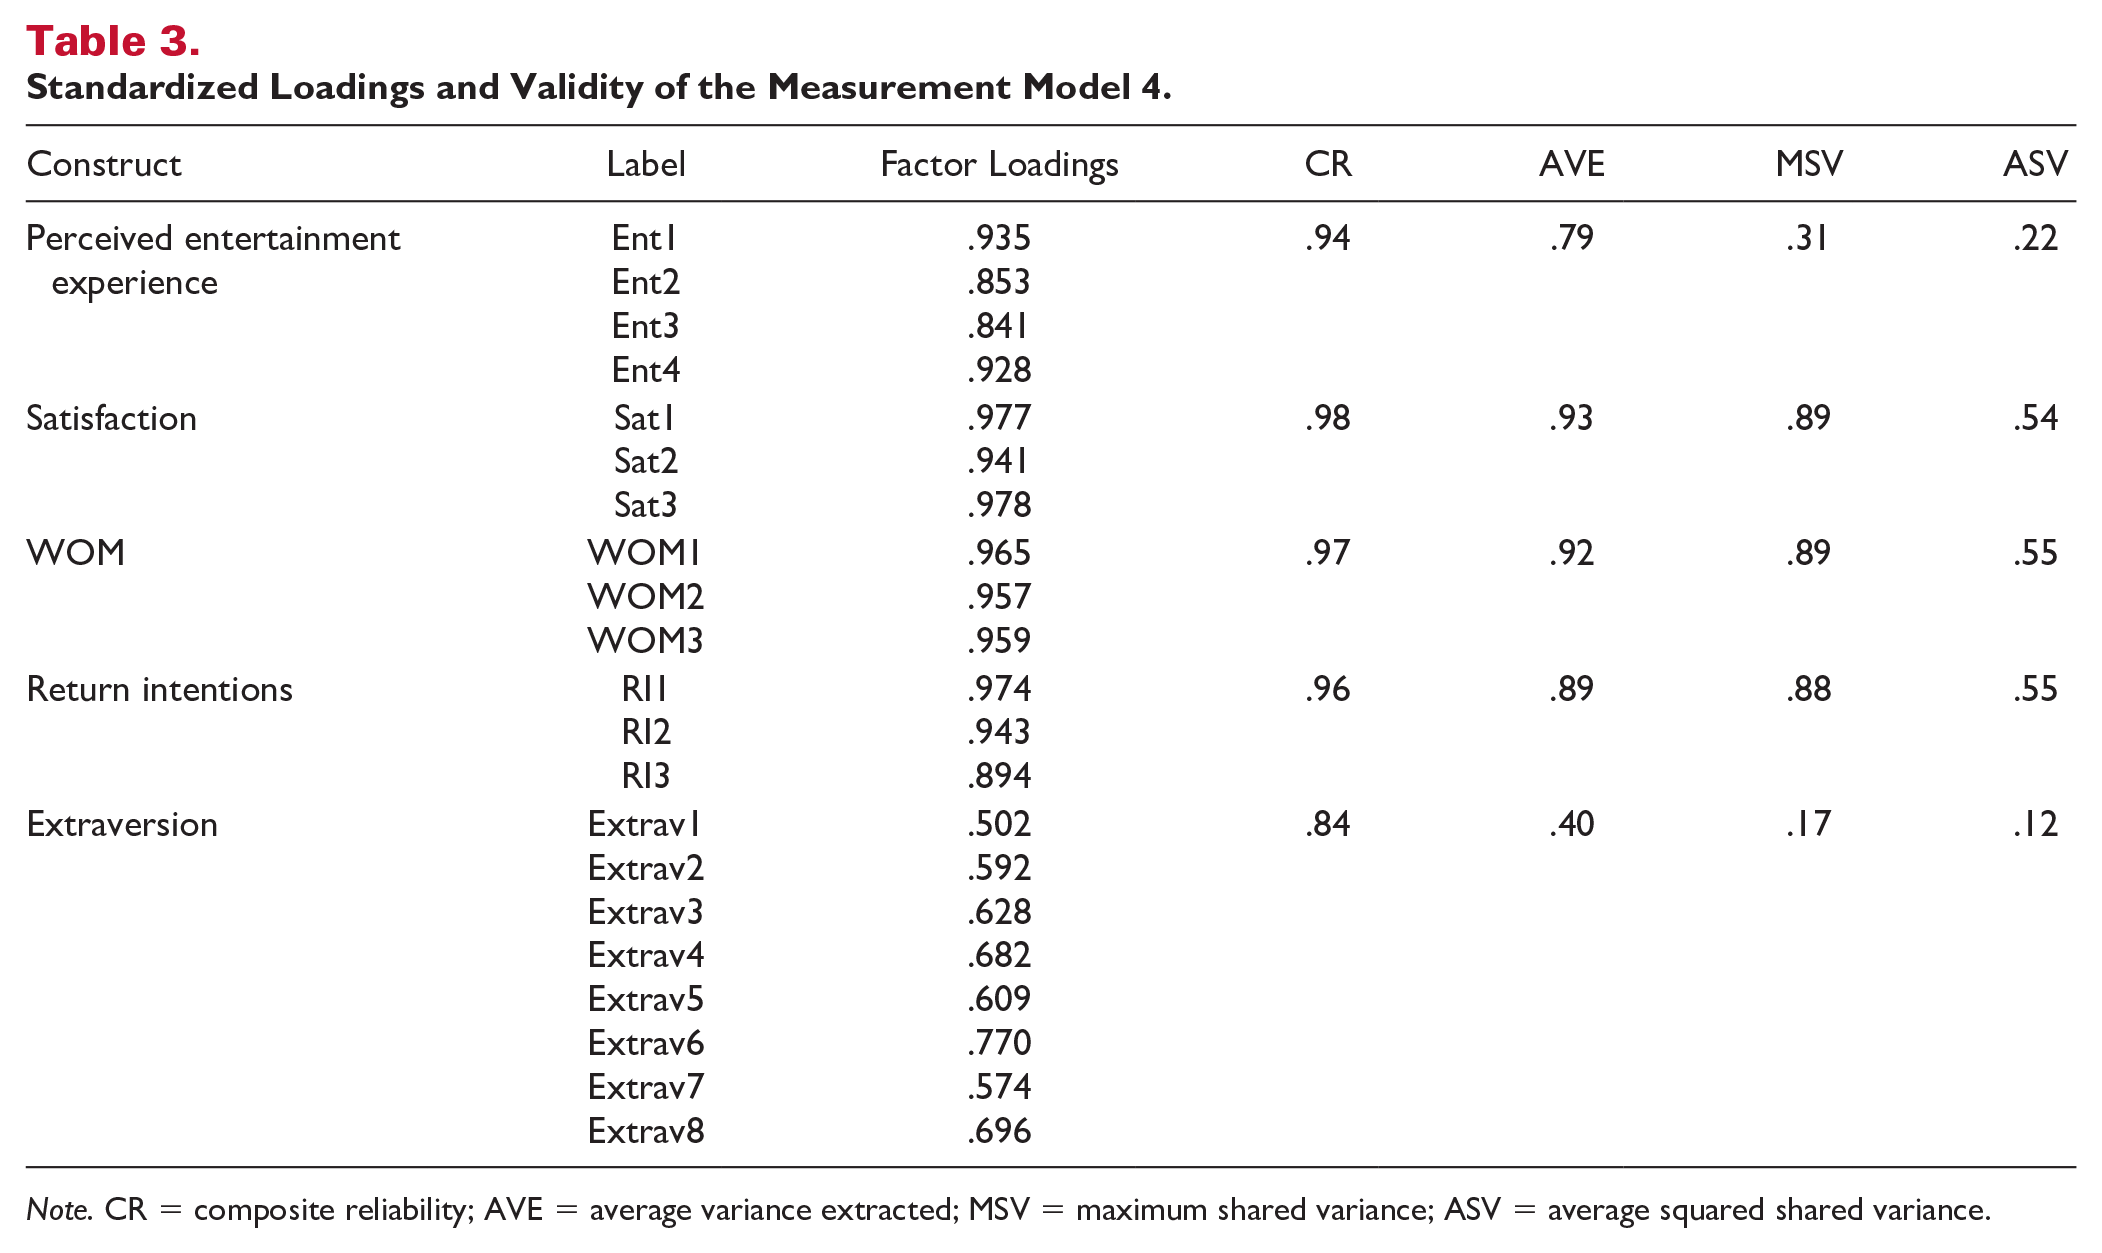
Note. CR = composite reliability; AVE = average variance extracted; MSV = maximum shared variance; ASV = average squared shared variance.
In the final step, we repeated the procedures from Model 3 to test the structural model without the latent interaction (nested) and then with the latent interaction term (full). Nested model indicated a good fit to data, χ2(181, N = 252) = 312.274, p < .000, CFI = .970 (>.95), TLI = .965 (>.95), RMSEA = .054, 90% CI = [0.043, 0.064] (<.08), SRMR = .061 (<.08). The significance of the MLR log-likelihood-ratio chi-square difference test, χ2(1) = 13.072, p < .001, indicated that the latent interaction model fits the data equally well or better than the nested model. As in our previous tests, all hypothesized paths were supported (Figure 4).

A Latent Factor Model With an Interaction Between Two Exogenous Latent Factors (Unstandardized Estimates).
Discussion
While Model 2 and Model 3 express the differences in the relationship between entertainment experience and satisfaction among the sample-bound, artificially constructed groups, Model 4 indicates the differences in customer satisfaction that results from the change expressed by one scale degree in individual’s extraversion (γ = .499, p < .001), their entertainment experience (γ = .398, p < .001), as well as the conditional change in the effect of the entertainment experience on satisfaction, contingent on individual’s extraversion trait (γ = −.237, p < .001). This approach is thus comparable with the approach in Model 1, which also expresses the change in the outcome variable, satisfaction, along the continuum of individual’s entertainment experience and extraversion. Unlike Model 1 which simplifies the conceptualization of the reflective constructs into composites, Model 4 accounts for the reflective nature of the personality trait variable and provides more robust estimates.
Due to such conceptualization of constructs, the extent of the effects of entertainment experience and extraversion trait on satisfaction, as well as the moderating effect of extraversion trait on the relationship between entertainment experience and satisfaction in Model 4 differs from the ones in Model 1 and Model 3 (see Table 4 for comparison). Specifically, Model 1 places more weight on the main effects of entertainment experience and extraversion trait on satisfaction and detects a relatively small change of −.083 scale degrees in the relationship between entertainment experience and satisfaction due to extraversion trait. While the effect of the interaction term in Model 1 reached statistical significance, detecting a small change due to the interaction effect (R2 = .02) in our study can be attributed to moderate statistical power (.61) and good reliability of the measurements, which are among common problems with detecting interaction effects in OLS models (Cheung & Lau, 2017).
Comparison of the Estimates Across Four Models.
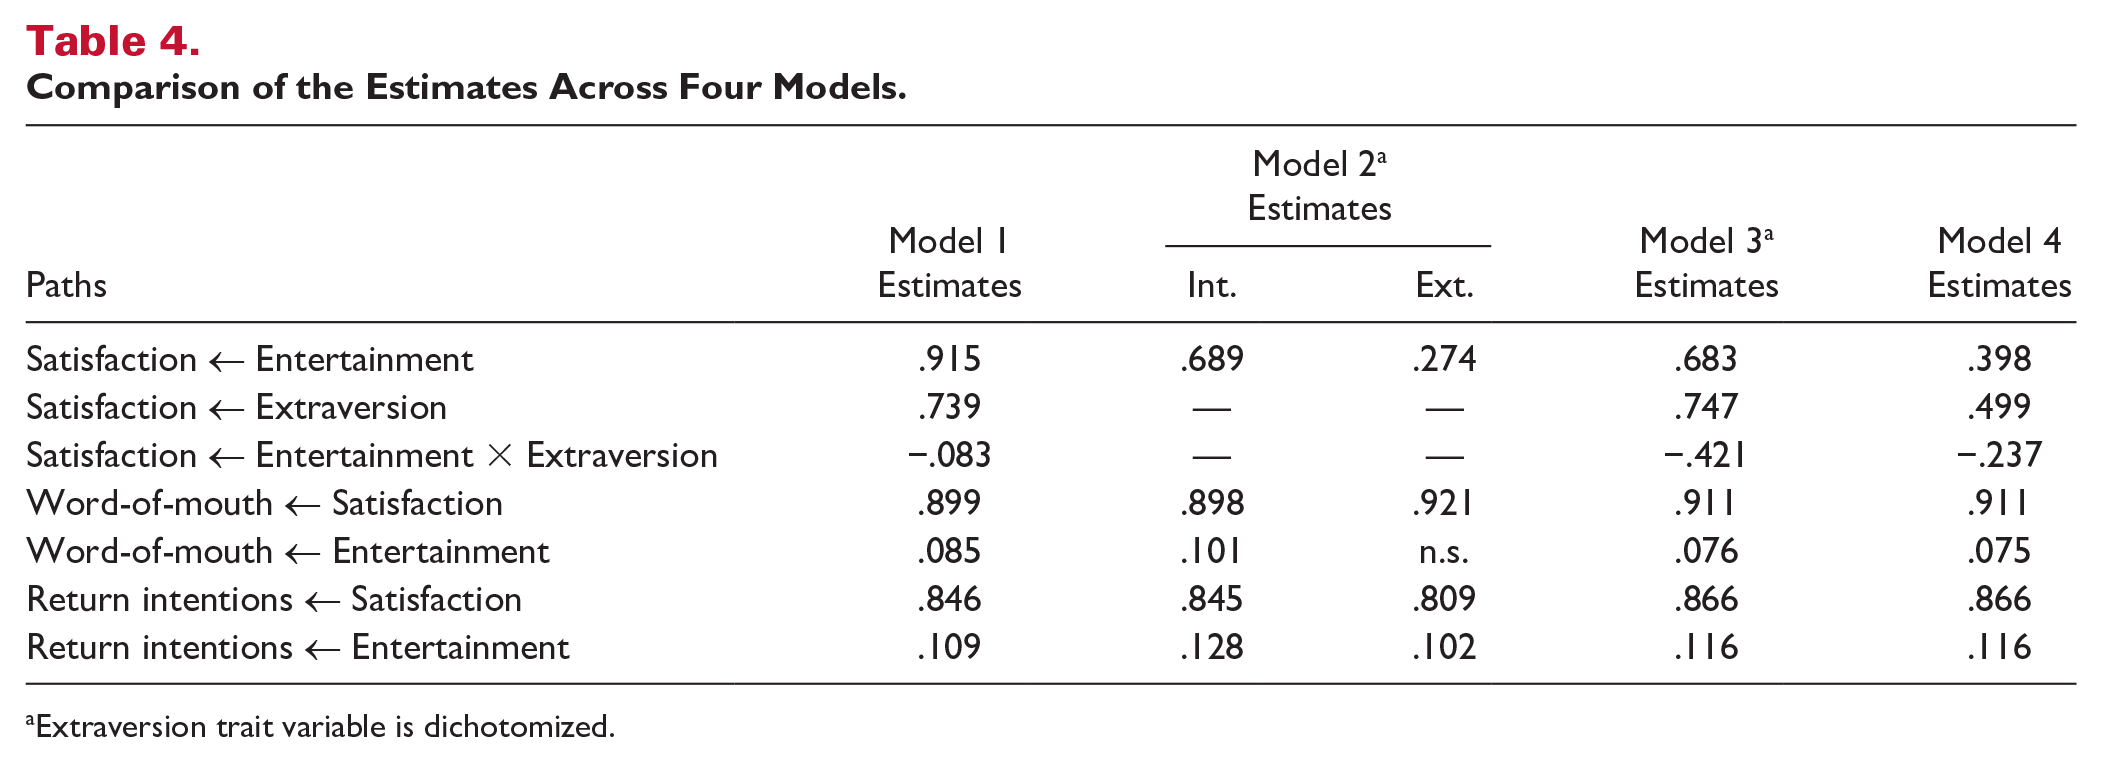
Extraversion trait variable is dichotomized.
Model 3 detects a more extreme difference in the relationship between entertainment experience and satisfaction between the introverts and extroverts of −.421. Model 4 results in a less extreme interaction estimate than Model 3, but less biased estimate than Model 1 of −.237 scale degrees, and thus places greater weight on the extent of the interaction effect, rather than the main effects. The results from Model 2 are especially difficult to compare with other models since they do not integrate the interaction effect and thus include two separate sets of path coefficients from high and low extraversion groups.
Regarding our conceptual framework, although the current illustrative example purported prior findings of the satisfaction arising from tourism experiences and subsequent loyalty manifestation, RI and WOM (Kim, 2018; Sharma & Nayak, 2019), destination loyalty is a complex issue. Specifically, tourism consumer’s choice to return to the same destination is determined by many intervening variables such as group decision-making (Decrop, 2005), the saturation point after numerous past visits, or the time-frame of their return visit (Baloglu & Erickson, 1998; Kozak et al., 2002; Oppermann, 1999). As suggested by the latter research, repeat patronage in tourism and hospitality may have a clearly marked beginning and end. Therefore, it could be that our participants completed the survey in the middle of their repeating patronage cycle, which does not accurately predict the longevity of their loyalty behaviors—a limitation that can be addressed by incorporation of the participants’ past patronage behavior. 1
Conclusions and Implications
While this research does not argue against the use of latent factors over composite indices, it calls for more attention to the selection of the measurement models with regard to the conceptualization of the constructs, its measurement approaches, as well as the statistical procedures that test the proposed hypotheses. In light of furthering theoretical contributions, moderating effects are integral to hospitality research (Ro, 2012). Yet, the theoretical underpinnings of the measurement models that underly constructs involved in the interaction effects may be ignored. This study invites hospitality and tourism researchers to respect the nature of the measurement models when selecting their statistical analysis for interaction testing because the two processes are not disjointed. Specifically, when researchers test relationships among reflective constructs that do not involve interactions using latent factor models and in the interaction testing step ignore the reflective measurement model of the moderator, they send an inconsistent message about the theoretical assumptions to the reader. Our call to hospitality researchers is consistent with pleas in other business areas, such as organizational behavior, where researchers equally welcome latent models as long as they do not test for interaction effects (Cortina et al., 2020). We advise hospitality researchers to branch out beyond the inherited construct operationalizations and statistical traditions and practice uniformity in selected procedures. By using the same dataset but a different representation of the constructs commonly examined in hospitality and tourism research along with distinct analysis methods, we demonstrate how researchers’ choices of methods and statistical approaches to testing moderation alter the study results and its interpretations.
While using composites simplifies the estimation of the regression paths and provides a reasonable sense of the direction of the effect and its statistical significance, it is not always aligned with the theoretical and conceptual underpinning of the employed constructs. Consistent with simulation studies in statistics and quantitative psychology (Jaccard & Wan, 1995), results from our illustrative example corroborate that a statistical model with composites may underestimate the interaction effect. This could be explained by the lack of inclusion of measurement errors in models with composites, which help isolate the effects in latent factor models. On the contrary, representing constructs with latent factors accounts for the measurement error and generally yields less biased estimates (Jaccard & Wan, 1995). In addition, problems with interpretation may also be due to the use of unstandardized scores. To compare different techniques, researchers are advised to use standardized scores.
Despite the viewpoints from the statistical community about the disadvantages of the artificial derivation of groups from constructs with assumed underlying continuous nature (Cortina et al., 2020), this has been a common practice in latent factor models in hospitality and tourism literature (Ro, 2012). When examining interaction effects resulting from consumers’ individual differences, researchers fluent in the SEM technique would typically adopt a multi-group testing approach and split their sample into groups according to the mean or median values of the composite score of their moderator. From a theoretical standpoint, the limitation of this approach is that the grouping is based on a sample-derived statistic (sample median or mean) that may not be practically relevant (MacCallum et al., 2002). Categorization unnecessarily diminishes the precision of the assumed continuum of measurements, shrinks the variance, and increases the likelihood of Type I and Type II errors (Fitzsimmons, 2008; MacCallum et al., 2002). Creating artificial high and low categories ignores that a large proportion of the population may self-identify between the two extremes. Problems can further arise with the interpretation of the results, comparisons of the results across multiple studies with different cutoff points, and extreme conclusions that are not generalizable to a “non-binary” population (Altman & Royston, 2006). The point the current research wants to make is, if categorization of continuous variables is strongly discouraged in OLS regression models, it is not justifiable to continue this practice in latent factor models.
From a methodological standpoint, the limitation is about disregarding the reflective nature of psychological constructs of personality or other character traits and assuming that they are perfect measurements. As suggested by our illustrative example, the measurements of the extraversion scale showed somewhat debatable validity, a problem that follows personality inventories since their conception (Palmer & Loveland, 2004; Robson et al., 2008). The controversy stems from social desirability bias in individual’s responses (Robson et al., 2008), which poses a limitation to the current study. However, in multi-group testing, such as our Model 2, the extraversion trait is dichotomized and treated as a perfect measurement before its scale reliability and validity is assessed.
While the estimates of the relationships between satisfaction and WOM, as well as the satisfaction and RI, are close to each other, more notable differences arise among the estimates of the relationships between the predictors, entertainment and extraversion, their interaction effect and satisfaction. As shown in our Model 2 and Model 3, dichotomization of a moderator using a sample median overestimates the interaction effect (Altman & Royston, 2006). This is particularly important to note in the interpretation of the interaction effect across models. For example, Model 3 includes one continuous predictor (entertainment experience), one dichotomous variable (extraversion moderator), and the interaction between the two. Therefore, the main (more precisely “conditional”) effect path coefficient for continuous predictor would correspond to the “0” condition of the dichotomous moderator and thus represents one extreme of the effect. In Model 4 which includes two continuous predictors and their latent interaction, the main effect path coefficient for the focal predictor corresponds to the “average scores” of the continuous moderator and alleviates the inflated estimates (low vs. high extraversion) of Model 2 or Model 3. Unlike multi-group latent factor models that assess model equivalence across groups, thus yielding estimates at specific points, latent factor interaction models allow researchers to capture an incremental change in the effect of the focal predictor on an outcome variable, contingent on the value of the moderator, while simultaneously accounting for the measurement errors and non-normality of data.
In conclusion, before deciding how to represent constructs in their models, the current study advises hospitality researchers to ask themselves the following questions: What is the underlying nature of the constructs in data? What is the focus of examining the interaction effect in the research? and Is there a theoretical foundation for the derivation of groups from a composite score of a construct? Some indications of the nature of data can be found in the measurement model fit indicators. For example, if the SRMR (or square root of the mean error of approximation) of the measurement model does not meet the “.08 and smaller” threshold, the data may follow a composite model, rather than the latent factor model (Sarstedt et al., 2016). An alternative to this approach could be assessing the robustness of the estimates and the effects across different measurement model types and structural model conceptualizations.
Finally, to aid the methods selection for a broader hospitality and tourism research community, this study outlines measurement model considerations and moderation testing approaches in Table 5. We encourage researchers in the hospitality and tourism industry to compare different measurement models and statistical approaches to modeling interactions to find their usefulness or own strength. To ensure that the findings from hospitality research hold practical value for managers, it is crucial to report more precise results across studies using latent factor modeling. Discrepant results caused by using different statistical approaches should be appropriately evaluated by comparing outputs of the results.
Recommendations.
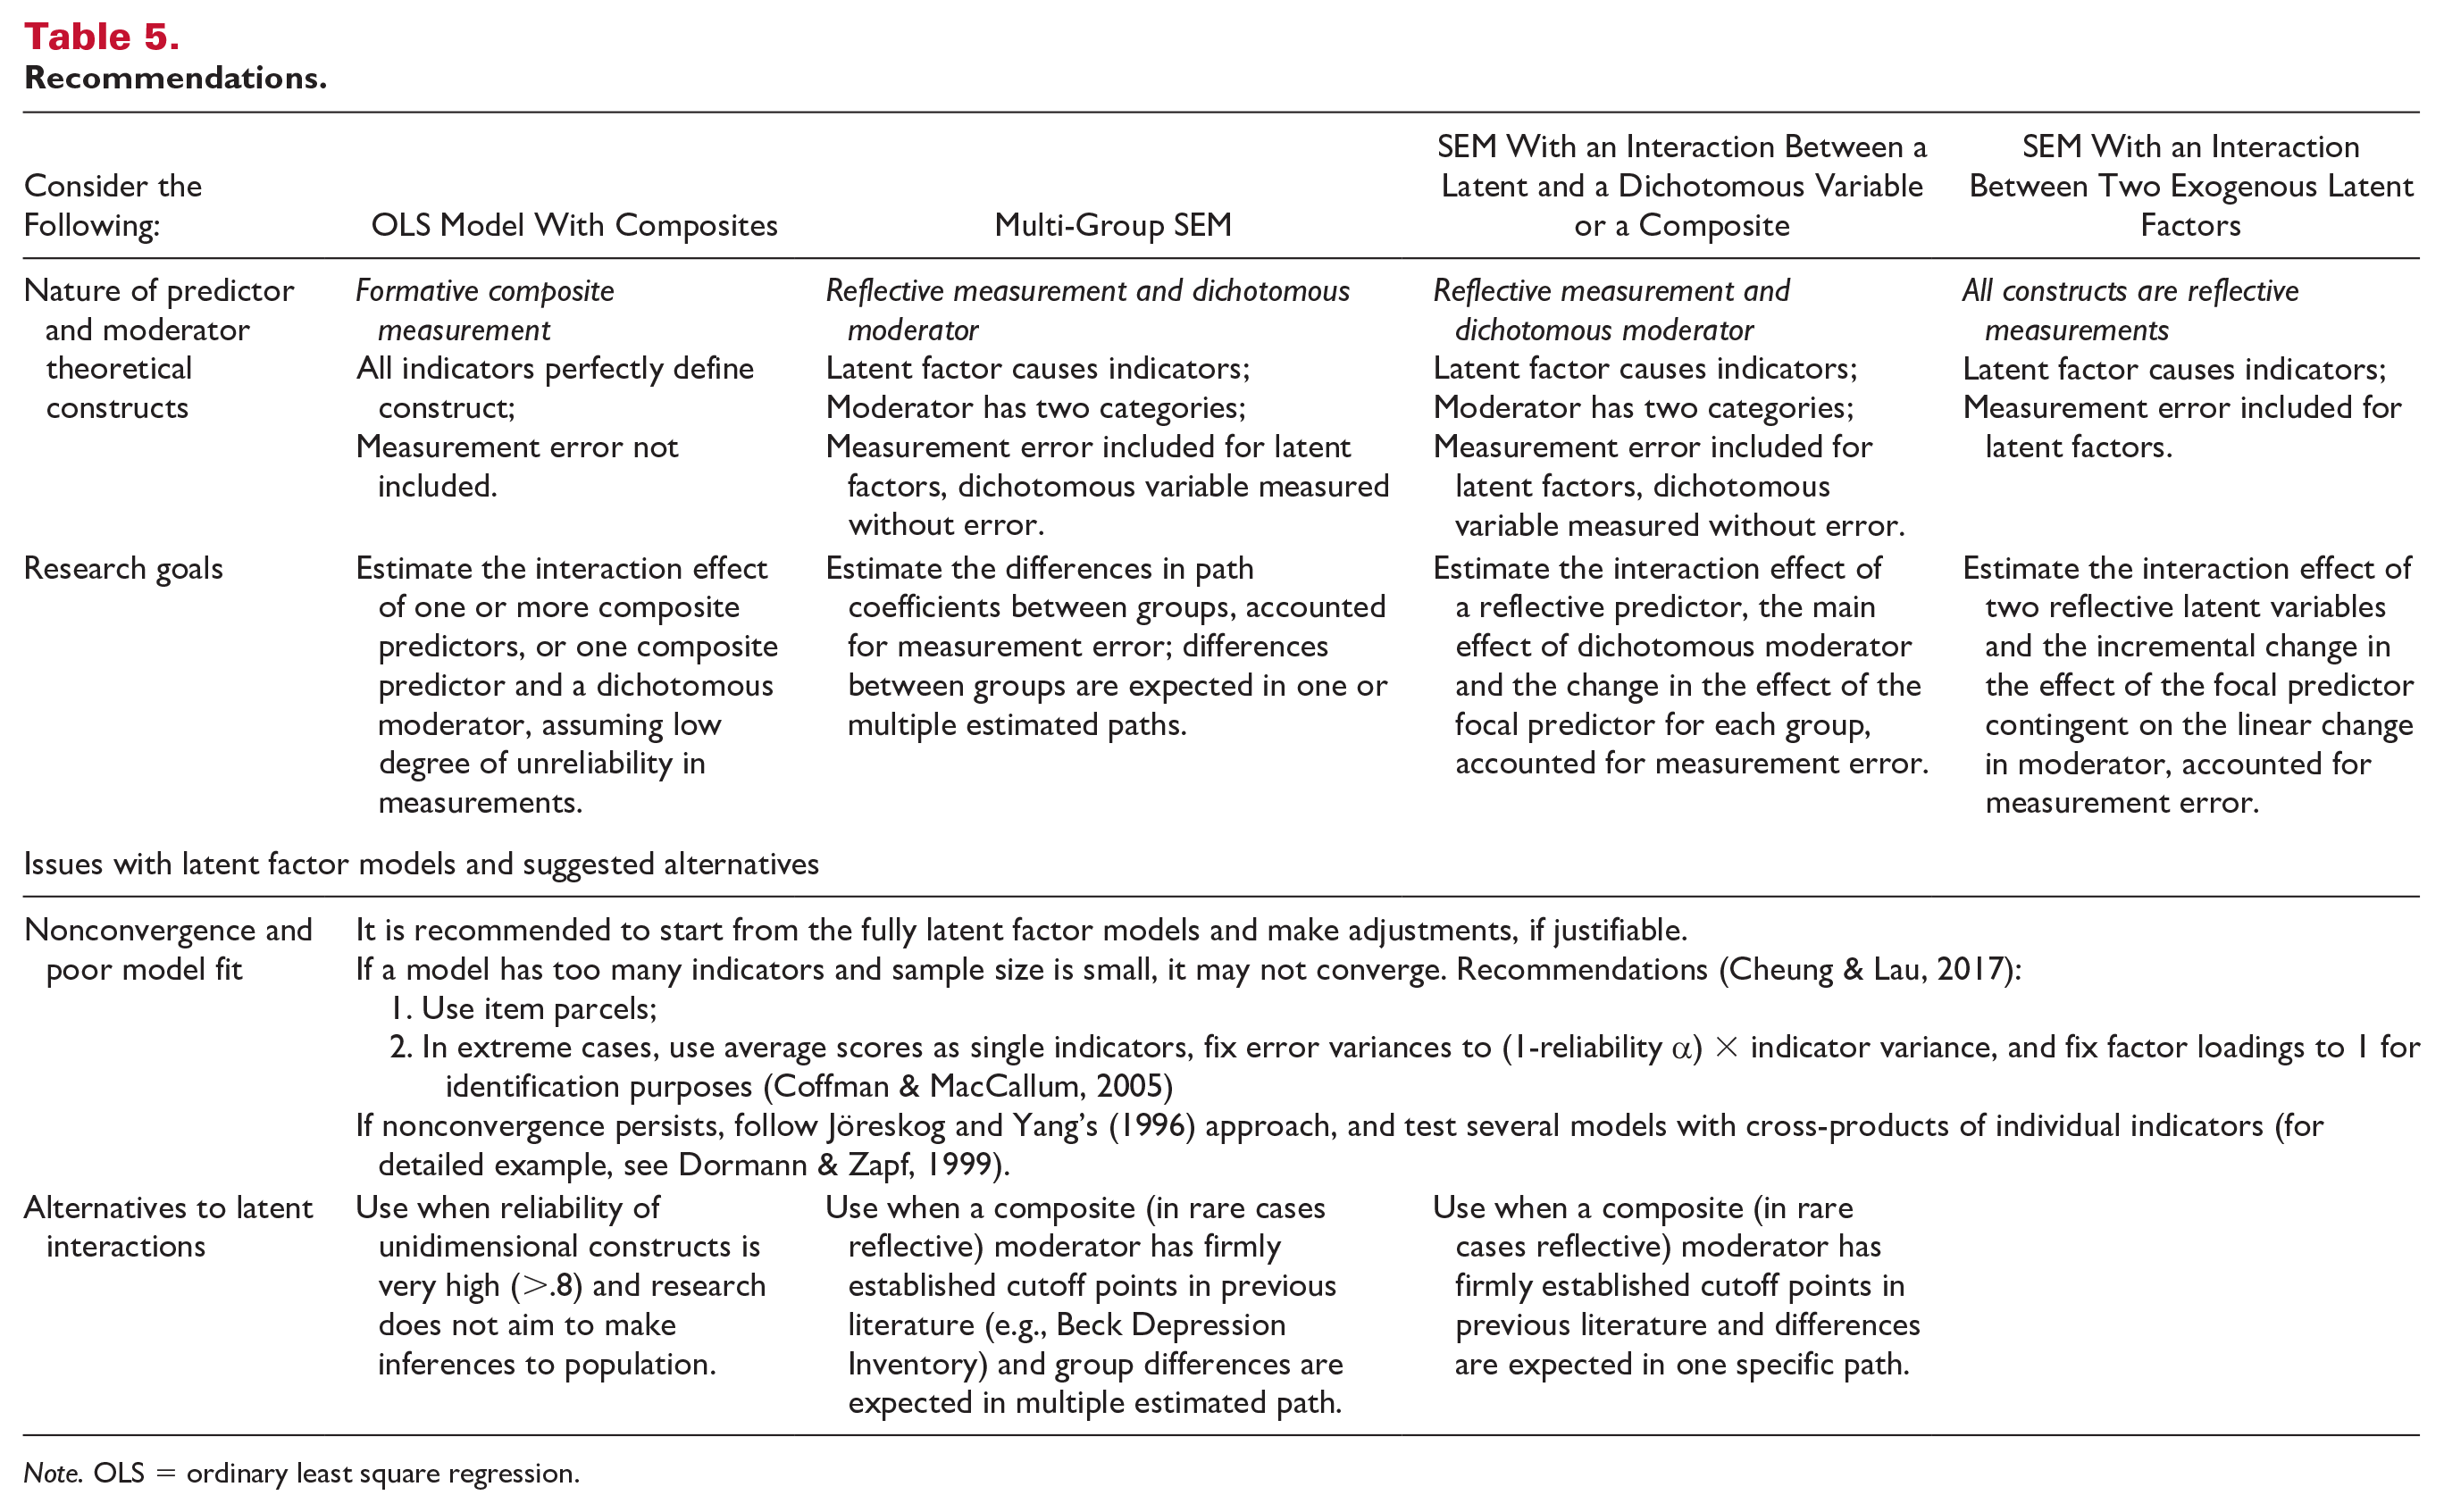
Note. OLS = ordinary least square regression.
Given that a limited number of hospitality publications utilized latent factor interactions (Grissemann & Stockburger-Sauer, 2012; Hodari et al., 2017; Kirillova & Wang, 2016; Lei et al., 2020), the current research advocates for the use of latent interaction modeling in Mplus statistical package to approach data in a unified manner and handle different types of variables more efficiently, without the need to construct new product variable proxies. We have provided the syntax for Models 3 and 4 in the appendix.
Supplemental Material
sj-docx-1-cqx-10.1177_1938965520973583 – Supplemental material for Comparison of Composites, Dichotomous, and Latent Factor Measurement Operationalizations in Hospitality Research on Moderating Effects
Supplemental material, sj-docx-1-cqx-10.1177_1938965520973583 for Comparison of Composites, Dichotomous, and Latent Factor Measurement Operationalizations in Hospitality Research on Moderating Effects by Vanja Bogicevic and Milos Bujisic in Cornell Hospitality Quarterly
Footnotes
Appendix
Declaration of Conflicting Interests
The author(s) declared no potential conflicts of interest with respect to the research, authorship, or publication of this article.
Funding
The author(s) received no financial support for the research, authorship, or publication of this article.

Notes
Author Biographies
References
Supplementary Material
Please find the following supplemental material available below.
For Open Access articles published under a Creative Commons License, all supplemental material carries the same license as the article it is associated with.
For non-Open Access articles published, all supplemental material carries a non-exclusive license, and permission requests for re-use of supplemental material or any part of supplemental material shall be sent directly to the copyright owner as specified in the copyright notice associated with the article.
