



Abstract
Although virtual reality technology is increasingly being used in tourism, its potential as a shopping tool and as an avenue for marketing and selling tourism products and services has not yet been examined. Likewise, very little is known about how exploring holiday packages through virtual reality affects behavioral intention to visit tourist destinations. This study aims to compare the visit intentions evoked and the process of booking holiday travel packages between an immersive virtual reality environment (displayed through Oculus head-mounted glasses) and a traditional web-based 2D platform. A causal model is proposed and tested for both designs. Using a between-subjects experimental design with a sample of 202 individuals, the experiences of two randomly selected groups were observed as they bought holiday tour packages to Rio de Janeiro, Brazil. The first group made a simulated purchase in an immersive virtual reality environment using a head-mounted device, and the second group made the purchase on a traditional e-commerce website. The findings revealed that the scores given to sense of presence, attitude change, and perceived ease of use were greater among those who made the purchase in the more immersive virtual reality environment. However, the relationships between the variables in the causal model were stronger for the classic website than for the virtual reality setting. Attitude change positively affected intention to visit a destination more in the virtual reality environment.
Keywords
Virtual reality (VR) is a promising tool for enhancing the experience of choosing destinations and buying travel packages (Bogicevic et al., 2019; Tussyadiah et al., 2018). VR is challenging current ways of selling and is set to change the customer experience in the coming years (Hoyer et al., 2020), ultimately leading to a new distribution channel that has been termed “virtual commerce” (Martínez-Navarro et al., 2019). The growing VR literature (Beck et al., 2019; Loureiro et al., 2020; Wedel et al., 2020) has suggested the potential of VR as a booking channel. We aim to contribute to the analysis of how VR impacts on tourists’ decisions by comparing their purchases of holiday travel packages displayed in both VR and on e-commerce websites.
The scarce literature highlights the value of VR as a distribution channel (Wedel et al., 2020). In VR-based retailing, two main variable types have been researched: (a) purchase decisions and (b) intrinsic VR features, such as immersion, sense of presence, consumers’ perceptions of the usefulness, ease of use, and enjoyability of VR for explaining purchases. Despite the growing interest in research on VR in tourism (see reviews by Beck et al., 2019; Loureiro et al., 2020), knowledge has been lacking until the last years on how to effectively use it to sell, and attract potential customers to, specifically, tourist destinations. Related research, for example, Kang (2020), has measured the impact of VR on the impulsive desire evoked for a tourist destination displayed through videos and head-mounted display (HMD) devices. Further studies on the development of attitudes and behavioral intention to visit tourist destinations are needed (Disztinger et al., 2017; Huang et al., 2013; Jung et al., 2016; Loureiro et al., 2020; Tussyadiah et al., 2018).
Online booking is the distribution channel closest to virtual commerce. The online channel dominates the tourism market. In 2020, 65% of worldwide tourism and travel sales were made online (Statista, 2021a); nonetheless, VR provides an emerging alternative to market products and services. Therefore, a comparison of VR with e-commerce in the tourism context has emerged from the following ideas: (a) Martínez-Navarro et al. (2019) introduced the concept of virtual commerce by comparing virtual reality and e-commerce channels; (b) as VR is relatively new, a reference point from the closest technologies may shed light onto how customers interact in VR settings; and (c) finally, websites may display 360° videos as non-immersive VR (Beck et al., 2019).
Built on intrinsic variables of the VR experience and the technology acceptance theory, this research aims to empirically compare the effectiveness of VR in a commerce channel (v-comm) with the effectiveness of VR on a website (e-comm), with a focus on technology acceptance and visit intention. This research contributes to knowledge about the buying behavior of tourists in VR scenarios by: (a) identifying the factors that affect user experience and behavioral intention to use electronic technologies; (b) comparing the navigation processes of v-comm and e-comm; (c) evaluating the influence of immersion, sense of presence, enjoyment, and perceived ease of use on tourism consumer decision-making in VR settings; (d) comparing attitude formation processes on the two platforms; and (e) establishing the differences in the value perceived by the customer in each platform type and in the tourist service provided by the seller.
The remainder of the study is organized as follows. First, we discuss the literature and propose a model. Then, we test the model and the hypotheses of both scenarios—VR and the website—using structural equation modeling, as described in the “Method” section. Subsequently, we present the results. Finally, we discuss the implications and limitations of the present study and propound future research avenues.
Conceptual Framework
VR has been defined as “a real or simulated environment in which a perceiver experiences a telepresence” (Steuer, 1992, p. 7). This definition points to the existence of three basic components in a VR experience: (a) a place or physical environment represented by a device that produces and emits structured sensory stimuli, (b) the user, and (c) the sense of presence experienced by the user.
Previous research on VR has adopted the technology acceptance model (TAM) as a study framework. Thus, Disztinger et al. (2017) applied an adaptation of the TAM for planning tourism trips and found that immersion, interest, and perceived enjoyment had significant effects on behavioral intention to use VR. Manis and Choi (2019) extended the TAM by incorporating perceived enjoyment and curiosity to assess the use of, and purchases made through, VR. They also assessed consumers’ perceptions of the usefulness, ease of use, and enjoyability of VR, and their attitudes toward the purchase and use of VR hardware. In addition, they studied the impact of age, curiosity, user experience, and the price customers are willing to pay. Jennett et al. (2008) described three phenomena that arise in the user when immersed: loss of awareness of time, loss of awareness of the real world, and a high level of involvement and the sense of being present in the simulated environment. The three main terms they used to describe immersive experiences were flow, cognitive absorption, and presence.
Zeng et al. (2020) compared the direct and interaction effects of online reviews on behavioral intentions to book hotel rooms through websites and through VR-based technologies. Their results indicated that using VR in information searches to make hotel reservations increased purchase intentions more than was the case for traditional web-based platforms. Moreover, a joint effect was also found between social media and travelers’ behavioral intentions.
Depending on the extent of the immersion, VR applications can be classified into two categories, immersive and non-immersive. Immersive VR involves the use of HMDs that completely engulf users in closed virtual environments. Non-immersive VR is mostly offered through desktop or laptop computers.
The novelty of VR technology is stimulating two research areas: First, the use of the technology (described as acceptance in the traditional literature) and its desired outcomes; and second, VR-based shopping. Therefore, we built our model based on two research streams, VR and visit intentions. The VR framework is based on Wedel et al. (2020). To explain behavioral intention to visit a destination, we adapted the model of Tussyadiah et al. (2018) by adding indicators from Usoh et al. (2000) related to sense of presence.
Dimensions of Technological Acceptance and Visit Intention and Booking in VR and 2D scenarios
E-commerce, which is usually displayed through 2D websites, accounts for 65% of worldwide tourism sales (Statista, 2021a). Furthermore, e-commerce has been studied extensively (for a review, see Amaro & Duarte, 2013). Therefore, it is an excellent reference point for other potential channels, such as v-commerce.
Most of the literature has concluded that virtual reality is more persuasive than traditional 2D technology because VR devices are, by their nature, more visually and auditorily stimulating than traditional 2D equipment (Grudzewski et al., 2018; Loureiro et al., 2020; Martínez-Navarro et al., 2019; Suh & Lee, 2006; Witmer et al., 2005). However, other studies have concluded that VR-based websites do not provide better performance than that achieved by physical stores (Schnack et al., 2021; Waterlander et al., 2015). Table 1 summarizes the key studies that have compared VR with 2D content in the tourism industry. Our study has two distinctive features. First, most previous studies used computer screens to display the VR content. Our study used HMDs, which is a much more immersive approach. Second, to compare v-commerce and e-commerce, we adapted models validated in the literature, thus avoiding ambiguity in the results which might have arisen with a newly developed model. Despite the differences between the studies, conclusive results can be obtained by analyzing the key variables proposed in the literature as key determinants of VR performance. Based on this viewpoint, the relationships between the key variables are hypothesized and a model is proposed.
Comparative Studies Between VR and Websites in Tourism.

Source. Own elaboration.
Note. VR = virtual reality; HMD = head-mounted display.
Immersion
The sense of immersion felt by users in a VR experience has been acknowledged as the key driver of how well the VR system performs the tasks for which it is designed; in turn, the level of performance the VR achieves is based on the visual cues it provides (Suh & Lee, 2006; Witmer et al., 2005) and users’ interactions with objects in the simulated scenario. In addition, the literature suggests that level of immersion determines how realistic the VR appears to the user, which ultimately leads to VR acceptance and purchase intention. Therefore, we focus on immersion and sense of presence as key drivers of the acceptance of VR to develop booking intentions.
Immersion is the objective reality provided by virtual reality. It refers to how users engage with a simulated reality based on its resolution, richness, and their interaction with the simulated environment (Slater et al., 1994, 2009). Users can be engaged and absorbed by the immersive environment and will often lose track of elapsed time; that is, they do not notice things that are happening outside of the immersive experience (Sekhavat & Zarei, 2018). Guttentag (2010, p. 638) described immersion as “the extent to which a user is isolated from the real world” and argued that a virtual reality experience can be defined by its ability to provide physical immersion and psychological presence. Agarwal and Karahanna (2000, p. 673) described immersion as “the experience of total engagement, where other attentional demands are, in essence, ignored.” Immersion is an experience that can generate positive or negative emotions (Jennett et al., 2008).
Some researchers conflate the immersion concept with the phenomenon of presence. However, immersion and presence are two different, although related, concepts. While immersion refers to participation in an online experience with a significant level of involvement with a technology, presence refers to the psychological perception of “being in,” or “existing in,” the online environment in which one is immersed (Slater et al., 1994, 2009; Steuer, 1992). For example, individuals may feel highly immersed in a game with abstract graphic characteristics, such as a puzzle, or that features combat with extraterrestrial alien beings; however, they will not feel present in that place (Witmer et al., 2005). In addition, presence can occur without immersion, as in the case of performing a boring task in a virtual environment with excellent 360° graphic characteristics. In this case, it is possible that users will not lose track of time and will not forget their upcoming tasks.
Sense of presence
VR can generate compelling sensations of telepresence through high media richness and interactivity (Abdullah et al., 2016; Biocca, 1997; Klein, 2003). Slater et al. (1994, p. 2) defined presence as the sense of “being there.” Witmer and Singer (1994, p. 3) and Emad (2017, p. 69) defined it as the subjective experience of being in one environment (there) when one is physically in another environment (here). Wei et al. (2019) showed that sense of presence depends on both the functional quality, that is, the clarity of the images, and the experiential quality of the virtual reality system.
Emad (2017) compared the levels of perceived sense of presence evoked by two HMD glasses, Oculus Rift and Samsung Gear, and found in all tests that the participants experienced a high sense of “being there,” with no significant differences between the groups. Martínez-Navarro et al. (2019) compared the impact on purchase intention of different VR formats and devices in a virtual store and found differences based on the formats and devices. No differences were found in sense of presence based on VR format or device. Therefore, sense of presence is unaffected by VR format type, but its influence on purchase intentions needs further examination. In a theme park context, Wei et al. (2019) found that the sense of presence generated by VR devices significantly influenced visitors’ overall experiences and visit and recommendation intentions. Tussyadiah et al. (2018) also demonstrated that a higher sense of presence felt during virtual reality experiences led participants to have stronger interest in, and inclination toward visiting, tourist destinations. The virtual reality experiences created a positive attitude toward the destinations, which affected visit intention. Sense of presence has been used to explain user behavior on the traditional web (see Lombard & Snyder-Duch, 2001). However, the differences between virtual reality and the traditional web should create different levels of immersion and sense of presence. The level of immersion offered by a virtual reality system is one of the main factors that influence the user’s sense of presence (Guttentag, 2009). Thus, human beings might experience a perceptual illusion of being present and highly engaged in an artificial environment while, in reality, they are physically present elsewhere (Biocca, 1997). Considering these facts, the following hypothesis compares the role of immersion in sense of presence on both platforms:
Enjoyment
Agarwal and Karahanna (2000) adapted the TAM to the web by adding hedonic elements, such as playfulness, to improve the understanding of web acceptance behavior. Moon and Kim (2001) proposed and tested a TAM adapted to the web, also incorporating the hedonic factor of playfulness. These authors based their adaptation on the works of Lieberman (1977) and Barnett (1991), concluding that people who believe the web is pleasant will interact with it more than others who are less enthusiastic about it. This suggests that when people enter a state of fun while on the web, their attention will be focused on their interactions with their devices.
Most research into the playfulness and enjoyment associated with VR is based on the flow theory of Csikszentmihalyi (Abdullah et al., 2016; Agarwal & Karahanna, 2000; Moon & Kim, 2001), who described state of flow as a special state of consciousness that integrates high but effortless concentration, defining it as “the state in which people are so involved in an activity that nothing else seems to matter” (Csikszentmihalyi, 1990, p. 4). This author described flow as an intrinsic source of motivation, because the activity is gratifying in itself, and used the term “optimal experience” to describe euphoric episodes of deep enjoyment that become unexpected milestones in our lives.
Tussyadiah, Wang, Jung, and Dieck’s (2018) VR model which analyzed behavioral intentions to visit a tourist destination incorporated sense of presence and enjoyment as explanatory factors, relating them directly to attitude toward change, and indirectly to visit intentions through attitude toward change. The authors affirmed that the key factor characterizing a virtual reality experience is the magnitude of the presence achieved and that this presence contributes to one’s level of enjoyment and participation. Their results confirmed that sense of presence increases enjoyment and causes a stronger liking and preference for destinations. In summary, sense of presence affects enjoyment in both traditional websites and in VR scenarios, but as perceived enjoyment is associated more with innovative devices such as VR (Lee et al., 2019), it is expected that perceived enjoyment will be higher with VR devices than with traditional websites. Therefore, the following hypothesis is proposed:
Attitude change
It has been shown in tourism that VR has a persuasive role that changes attitude toward its use (Lee et al., 2020). Furthermore, this attitude change has been shown to be transferable to attitude toward destinations (Lee et al., 2020; Tussyadiah et al., 2018). Early studies on VR based on 3D computer simulations also demonstrated the influence of the virtual experience in electronic commerce (Li et al., 2001). Pleyers and Poncin (2020) compared non-immersive versus immersive VR technologies in a real estate context and found that VR performed slightly better than photos, particularly in terms of attitude toward the product and the intermediary. Based on media richness theory (see Xi & Hamari, 2021), it is expected that VR will have higher media richness than traditional communications media (Yeh et al., 2017). Therefore, the richer experience of the immersive VR provided by HMDs over that provided by traditional formats may have a differential effect on customer attitudes.
Accordingly, we propose the following hypotheses:
Perceived ease of use
Davis (1989) validated the measurement scales for the perceived ease of use and the perceived usefulness described in his 1986 TAM: He argued that perceived ease of use represents an intrinsically motivating aspect of human–computer interactions. Agarwal and Karahanna (2000) argued that perceived ease of use is the user’s perception that human–technology interactions in a virtual experience will be relatively free of cognitive load; that is, ease of use reflects the ease (minimal effort) with which individuals interact with a particular software or device. Agarwal and Karahanna (2000) proposed that when an individual spends a lot of time on his or her computer and enjoys the experience, this suggests that (s)he regards the activity as useful; therefore, experiencing enjoyment should contribute to the perception of ease of use. This is in keeping with Csikszentmihalyi (1990), as pleasant activities are considered to be less burdensome.
Bearing in mind that fun and enjoyment facilitate and simplify user interaction with equipment and that, according to flow theory, a positive subjective experience becomes an important reason to conduct an activity, we conclude that, if an activity “feels good,” it is intrinsically motivating and that people are more likely to participate in it (Moon & Kim, 2001). Therefore, as one increasingly uses a device, interactions with it will become easier, regardless of whether it is VR based or traditional web based. In view of the foregoing points, we propose the following hypothesis:
Perceived usefulness
The literature suggests that the central element of the perceived value of a product or service is the evaluation of the costs and benefits associated with its purchase and use; for example, Kumar and Reinartz (2016, p. 62) defined perceived value as the “customers’ net valuation of the perceived benefits accrued from an offering that is based on the costs they are willing to give up for the needs they are seeking to satisfy.” In the present study, we have used the perceived usefulness concept of Davis (1986), who defined it as “the degree to which an individual believes that the use of a particular system will improve his or her work performance” (Davis, 1986, p. 320). Both definitions are based on the cost–benefit paradigm of behavioral decision theory (Davis, 1989). In the case of the perceived usefulness of technology, Davis (1989) argued that software perceived as easier to use than other software is more likely to be accepted by users. Davis (1986) proposed that an easy-to-use system will provide higher work performance (i.e., greater utility) to the user. As a fraction of the user’s work is dedicated to physically using the system per se, if they become more productive in that fraction of their work because the system is easy to use, they will become more productive in general, irrespective of the type of technology used. According to Google, easy search and simple booking processes are cited as important features for booking through smartphones (Google, 2018). Therefore, the higher is the user’s familiarity with e-commerce in comparison to his or her familiarity with virtual reality, the higher will be his or her level of perceived ease of use of e-commerce. Thus, the following hypothesis is proposed:
Behavioral intention to use information technology
One of Davis’s (1989) most significant findings was that the usefulness–use relationship was significantly stronger than the relationship between ease of use and use. He arrived at the important conclusion that perceived usefulness has a positive and direct effect on intention to use a technology. Indeed, people tend to use technologies to the extent that they believe they will help them to do their jobs better (Davis, 1989). Subsequently, Disztinger et al. (2017) demonstrated that perceived usefulness positively influences the behavioral intention to use VR technology when planning holidays. However, as online booking dominates the market, it is expected that customers will have higher intention to use traditional websites to make reservations. In accordance with these points, the following hypothesis is proposed:
Visit intention
The results of Tussyadiah et al. (2018) overwhelmingly confirmed that sense of presence influences attitude change toward a tourist destination, and that when the user develops a positive attitude toward a tourist destination through a VR experience, this leads him or her to develop a higher level of intention to visit the destination physically. Israel et al. (2019) found that using a smartphone-based virtual reality system had a positive effect on visit intentions. Similarly, McLean and Barhorst (2021) found that both HMD-based VR and 360° tour-based VR had greater influence than static images on visit intention. Therefore, the following hypothesis is proposed:
Influence of Psychographics and Demographics
Many studies have applied segmentation variables to achieve a better understanding of tourist behaviors, including demographics, psychographics, personal values, and lifestyles, among others (for an overview, see Hosany & Prayag, 2013). Technology use has been associated with its users’ personality traits (Barnett et al., 2015). Consumers’ personalities have scarcely been addressed in VR contexts. To the best of our knowledge, only Schnack et al. (2021), in a recent VR-based study, have investigated the impact of shopper personality through the “Big Five” personality traits. In the context of a VR convenience store, they did not find that personality traits impacted on purchases and product inspection time. However, psychographics might play a role in emotional decisions.
As a result, the following research questions are proposed. First, do demographics explain the adoption of VR in tourism? Second, do personal values and lifestyles moderate VR adoption in tourism?
Method
Experimental Design and Stimuli
The experiment consisted of three stages. First, two platforms (simulated stores) were created, both selling tourist packages to the same destination. One was a VR setting and the other a classic website. Both platforms presented the same detailed information, that is, text and pictures about five similarly priced (500 euros) tourist packages to Rio de Janeiro. Five travel packages were included to create a realistic experience and to allow the participants to choose among them. Rio de Janeiro was chosen, based on six focus group sessions, because it is a well-known, popular destination with attributes that the group participants could readily differentiate. In addition, the focus groups identified the key attributes of tourist packages.
Each simulated store differed in its audiovisual stimulus. In the VR condition, participants wore an Oculus Go HMD in which an interactive 3D application had been installed to allow them to tour the city and its tourist attractions at their discretion (https://www.oculus.com/experiences/go/1105507662843899/). On the website platform, the participants were shown a digital 2D/4K video, with a duration of 4 min 12 s, which featured tourist attractions in Rio (https://www.youtube.com/watch?v=8kPfcERw_2I).
Second, after being exposed to the stimuli, the respondents were asked to click on a link which redirected them to a dedicated webpage which featured the five travel package options and prompted them to complete their purchase. The content of the tourist packages whose attributes were identified in the six focus groups was delineated through a web search of the available options presented by online travel agencies. The options displayed pictures of the city’s attributes, with information about the duration of the trips (days), accommodation, food and tours, and a text summary of each package (see details at https://sites.google.com/view/turismobrasil-rv-uv-1). Figure 1 depicts the details of the experiment and its constituent parts, and Figure 2 shows the pictures displayed.
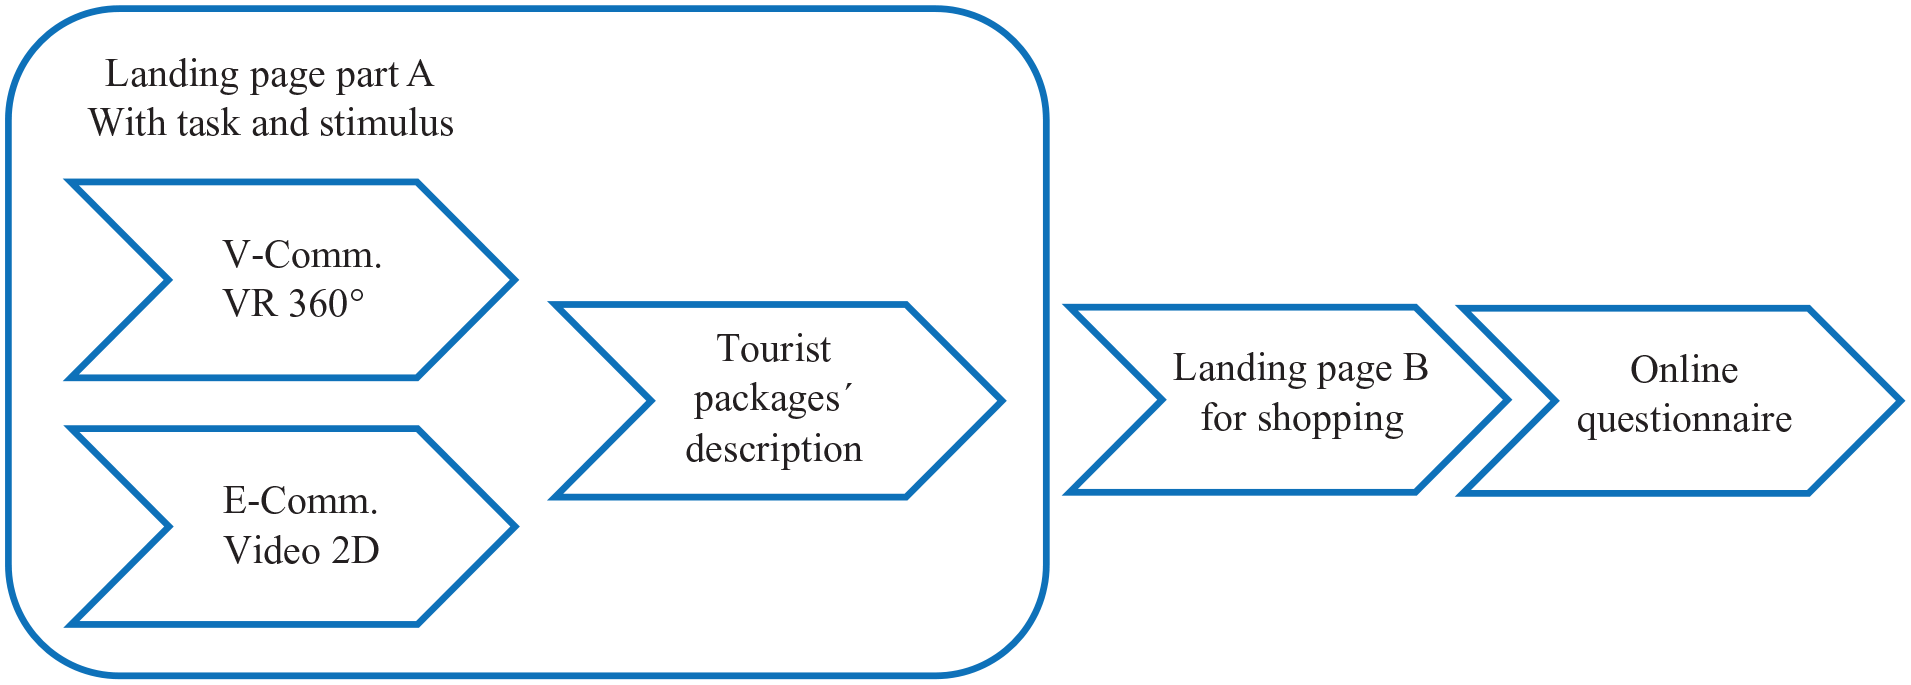
Design of the Experiment.

Tourist Package Images of Each Option.
To achieve more realism, we looked at different travel options provided by tourism providers. As a result, the tourist packages were designed by combining four aspects: stay duration (number of days), type of accommodation, food quality, and activities. The pictures and textual descriptions provided to the participants are shown in Figure 2. This resulted in 11 levels, namely: (a) number of days, 2, 5, and 15; (b) type of accommodation, five-star luxury hotel, two-star hotel, and hostel with shared kitchen and bathroom; (c) quality of food, luxury buffet, homemade-style food, and a lunch box with three sandwiches, water, and fruit; and (d) activities, a 1-day guided bus tour, a 3-hr unguided bus tour, and a catamaran tour around the bay. To reduce the 54 choice combinations, we conducted a conjoint analysis. The orthogonal design generated five tour packages, shown in Figure 3.

Tourist Package Details Displayed for Shopping Options.
Third, after the participants had chosen the tourist packages, a new link redirected them to an online questionnaire. The questionnaire was designed to measure the constructs of interest, as shown in Tables 2 and 3. Behavioral intention to use the technology and the five constructs, including immersion, perceived ease of use, and perceived usefulness, were measured through an adaptation of Agarwal and Karahanna’s (2000) model. Behavioral intention to visit the tourist destination and the constructs of enjoyment and attitude change were measured by adapting the scales of Tussyadiah et al. (2018). Sense of presence was measured in an adaptation of the scale of Usoh et al. (2000). All constructs were measured using 7-point Likert-type scales.
Constructs and Items in the VR Scenario.

Constructs and Items for the Web Scenario.

The data were analyzed using analysis of variance (ANOVA), chi-square tests, and mean differences. Subsequently, using structural equation analysis, the nomological network of the causal model depicted in Figure 4 was validated for each type of platform. Structural equation modeling, based on partial least squares, using SmartPLS 3 (Ringle et al., 2014), was used to test for the existence of relationships between the latent constructs.
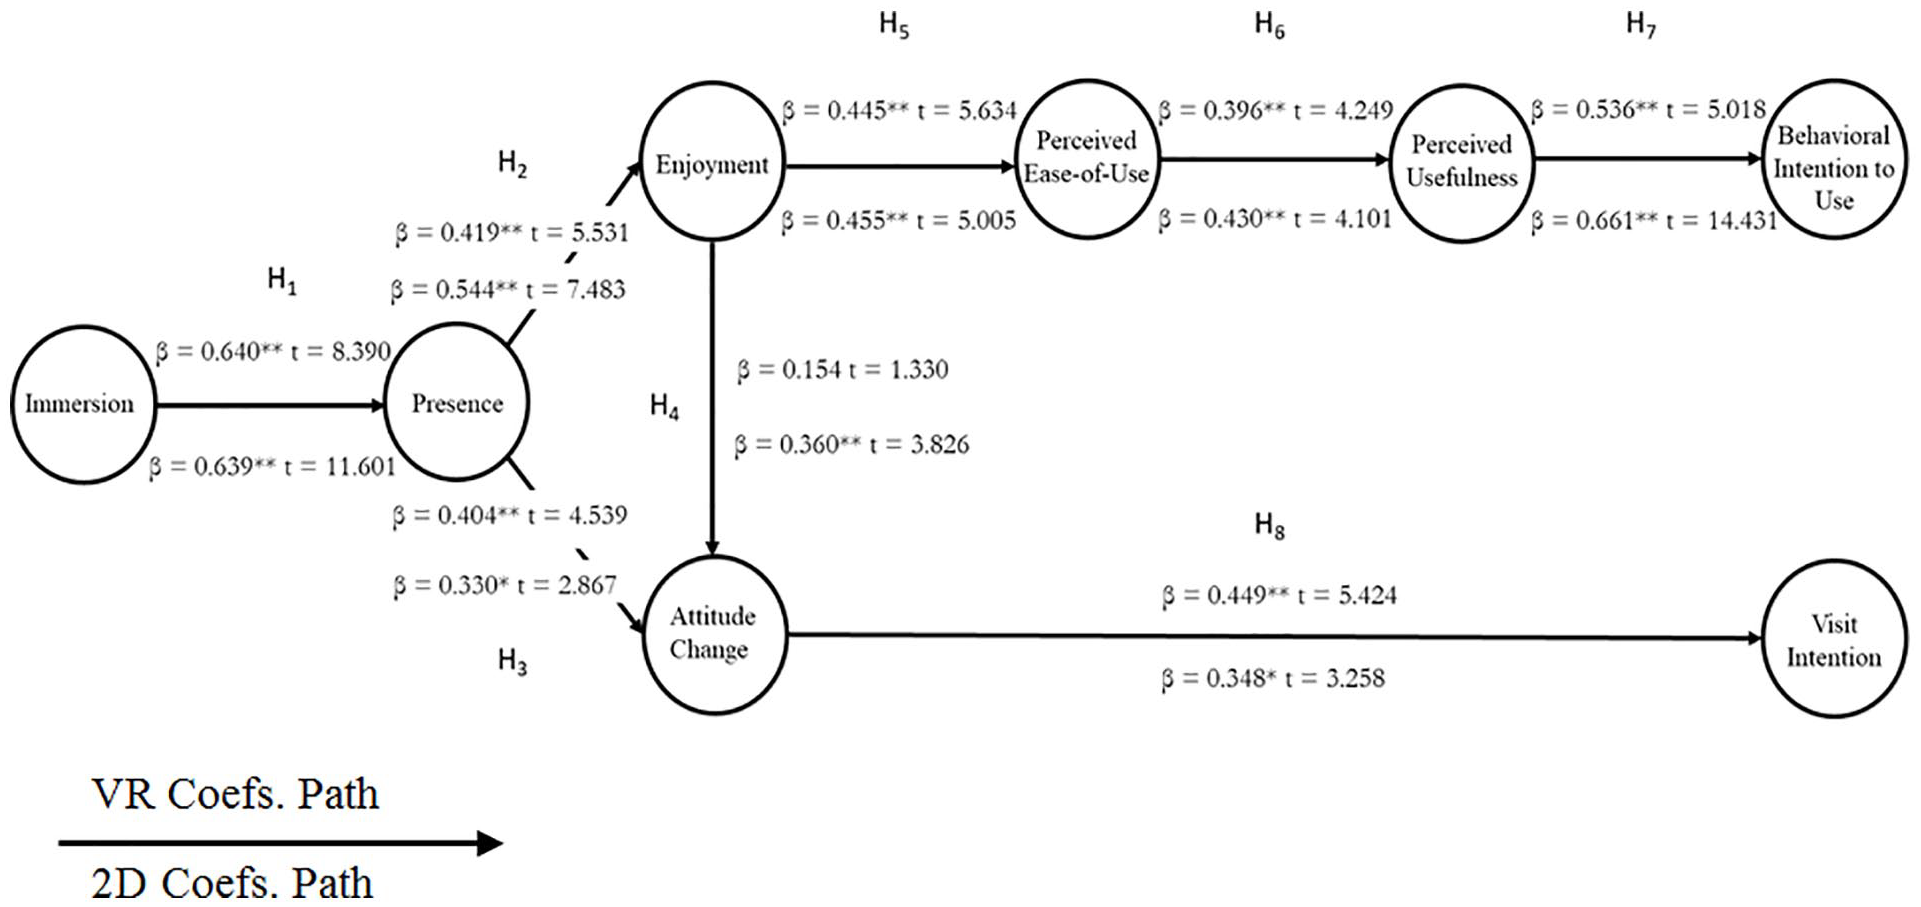
Structural Model Applied to VR (Upper) and E-Commerce (Lower) Platforms.
Subsequently, an analysis of the influence of external variables was conducted, particularly demographic and psychographic variables. This analysis was structured in two stages: (a) moderation tests for the metric variables (e.g., psychographics) and a multigroup analysis for the categorical variables gender and age; (b) a latent segmentation analysis using the FIMIX-PLS (finite mixture partial least squares) and PLS-POS (prediction-oriented segmentation) algorithms proposed by Hair et al. (2017). The psychographic variables of the latent segments came from a discriminant analysis of the variables of a psychographic segmentation study carried out with a sample of 334 individuals extracted from the same population 2 months prior to the present study. In the previous study, we adopted the following scales: the NEO-PI-R of Costa and McCrae (1992), the LOV Values List of Kahle and Kennedy (1988), and the SBI VALS Values and Lifestyles Scale. The discriminant analysis resulted in 10 variables, as shown in Table 8. For the present study, only the variables that discriminated were used.
Data Collection
The participants were approached through advertisements placed on different social networks and via e-mails aimed at a list of alumni in a university in Santiago, Chile. Chile was chosen because it has the highest per capita gross national income (GNI) in Latin America and the third highest in the Americas, after the United States and Canada. E-commerce sales accounted for 11% of all retail sales in Chile in 2020 (Statista, 2021a). The participants ranged from 17 to 77 years of age. They were invited to a laboratory to undertake a simulated purchase of a tourist package to the city of Rio de Janeiro, Brazil, a popular destination for Chilean tourists. The participants met the following criteria: they did not have stereoscopic vision, had normal hearing capacity, had never traveled to Rio de Janeiro, and were representative of the gender and age profiles in the broader Chilean population. The participants were randomly assigned to each scenario, VR and website, on different days and at different times. The data collection was conducted between January and April 2019.
Of the 223 questionnaires gathered, 202 were valid, 111 women and 91 men, ranging in age from 17 to 77 years. The individuals were organized for convenience and assigned randomly to the two treatment groups, website or VR setting.
As Loureiro et al. (2019) pointed out, 90% of virtual reality studies are experiments where sample sizes range from 100 to 200 participants. Thus, our sample size of 202 is larger than most virtual reality-based studies. In addition, the sample size is consistent with the criterion of Chin and Newsted (1999) and Hair et al. (1998), which is that the minimum acceptable size for a sample should be the highest value among the number of preceding constructs that lead to another dependent construct of the structural model and the number of indicators (observable variables) of the formative construct with the highest number of indicators, that is, the most complex formative construct of the model. Given that our model has no formative constructs, and taking into account that it has six latent preceding variables, the minimum sample size should be 60 individuals. Furthermore, if we consider the testing power criterion proposed by the same authors, it can be observed that with 200 individuals, our model exceeds a power level of 80%, which is considered acceptable for studies in social sciences (Cohen, 1988).
Results
Assessment of the Measurement Model
Tests were conducted to verify the reliability of the constructs. Cronbach’s alpha values of all constructs were above .7 (Cronbach, 1951), composite reliability values were higher than 0.6 (Bagozzi & Yi, 1988), and average variance extracted was above 0.5 (Fornell & Larcker, 1981), as depicted in Tables 4 and 5. Discriminant validity was tested using the Fornell and Larcker (1981) criteria, and by means of the heterotrait–monotrait ratio of correlations (Henseler et al., 2015), and both analyses showed acceptable results.
Concurrent Reliability Indicators of the VR Scenario.

Note. CR = composite reliability; AVE = average variance extracted.
Concurrent Reliability Indicators of the E-Commerce Scenario.

Note. CR = composite reliability; AVE = average variance extracted.
Assessment of the Structural Model
The relationships between the explained and total variances (R2) of the dependent latent variables in both measurement models had values greater than 0.1, thus the model has explanatory validity (Falk & Miller, 1992). As for predictive relevance, using the blindfolding procedure, values of the Q2 coefficient of Hair et al. (2014) greater than zero were obtained for the dependent latent variables in both measurement models, indicating that the model has predictive validity. Table 6 summarizes the R2 and Q2 indicators of the dependent factors of the measurement model applied to the traditional web treatment data.
Explanatory and Predictive Relevance of the Model for Each Platform.

Table 7 presents the standardized coefficients of the structural relationships tested in the model for each platform. As shown in Table 7, all the hypotheses tested were accepted, except for H5 relating to the virtual reality treatment. It should be noted that the results between the platforms did not differ much, but in six out of eight cases the effects observed in the digital scenario were slightly greater than in the VR scenario. Assuming that the participants were familiar with e-commerce platforms, our results can be interpreted as indicating that they are willing to adopt VR in a similar way to how they previously adopted e-commerce platforms.
Structural Relationships.

p < 0.01, *p < 0.05
Figure 4 depicts the structural model for both platforms, the VR setting and the classic website.
The two behavioral variables, intention to use the technology and intention to visit the destination, are explained, with similar β values, in both scenarios. However, the 2D scenario β value is slightly higher.
The acceptance of H1 is consistent with the specialized literature, as in the case of Guttentag (2009, 2010), who argued that the level of immersion offered by VR systems is one of the main factors that influences the user’s sense of presence, and that a virtual reality experience is defined by its ability to provide physical immersion and psychological presence. In a practical sense, we note that this result is consistent with Sekhavat and Zarei (2018), in that when a sense of immersion is present, users are not aware of the things occurring around them and feel that they are physically located in the environment created by the device. Biocca (1997) suggested that situations in which human beings experience a perceptual illusion of being present and highly engaged in an artificial environment while, in reality, they are physically present elsewhere, are characterized by their senses of immersion and presence.
As shown in Table 7, in the virtual reality scenario, it was observed that the greatest explanatory effect of the tested model was the effect of immersion on sense of presence; in the traditional web scenario, this relationship had the second highest value (β = .640 in VR and β = .639 in 2D). This is also consistent with the literature that argues that virtual reality technologies have the unique ability to simulate the intricate situations and contexts of real life while providing a sense of presence, of “being there” (Tussyadiah et al., 2018; Wei et al., 2019). It should be noted that there is a major difference in the average scores given to sense of presence between the scenarios. While the users of the virtual reality equipment scored 5,199 points on average, the users of the traditional web scored 3,987 points on average, a difference of 1,212 points on the scale from 1 to 7. This shows a clear difference in favor of the virtual reality system in the sense of presence generated by the platforms.
The acceptance of H2 confirms the existence of a strong relationship between sense of presence and enjoyment in both scenarios (β = .419 in the VR scenario and β = .544 in the 2D scenario). This accords with Tussyadiah et al. (2018), who found that the key factor that characterizes a virtual reality experience is the magnitude of the sense presence achieved and that this presence contributes to the participants’ levels of enjoyment and participation. However, contrary to our hypothesis, this relationship was shown to be higher for traditional websites than for VR scenarios. This can be attributed to the participants’ lack of familiarity with HMDs, which ultimately results in a slightly lower level of enjoyment.
H3 related sense of presence to attitude toward change; it was accepted in both scenarios. Contrary to expectations, the coefficient β associated with this relationship was lower in the VR treatment than in the 2D scenario (β = .330 in the VR scenario, and β = .404 in the 2D scenario). However, users of the virtual reality system scored significantly higher averages than users of the traditional web-based shopping experience (5,544 in the VR scenario and 5,025 on a scale of 1–7 in the 2D scenario). Consequently, although this relationship was slightly stronger for the traditional web, we consider this result to be consistent with that of Tussyadiah et al. (2018) in relation to their argument that a greater sense of presence during virtual reality experiences leads to greater interest in, and liking for, the tourist destination and a positive attitude change toward the destination. The weaker relationship shown in the VR scenario may be due to the greater trust users place in the web because it is a traditional shopping medium, and their lack of experience of shopping on a VR platform.
H4 was supported only in the 2D scenario; indeed, it was observed that in the e-comm scenario, this relationship had the lowest t value in the model (t = 1.330); therefore, we did not confirm the relationship proposed by Tussyadiah et al. (2018), that is, that enjoyment has an important effect on attitude change in a v-comm platform.
The acceptance of H5 is consistent with Moon and Kim (2001), in the sense that playfulness and enjoyment create greater concentration, which facilitates and makes the user’s interaction with technological devices easier. In addition, flow theory argues that a positive subjective experience is an important reason to undertake an activity; if an activity “feels good,” it is intrinsically motivating, and people are more likely to participate in it.
H6 was supported in both scenarios. This finding allows us to equate our model with that of Davis (1986) in terms of the existence of a direct effect of perceived ease of use on perceived usefulness and states that this relationship is sequential, and not parallel, in the explanation of the use of the technology. In addition, virtual reality users returned a significantly higher average score in the perception of ease of use of the system than did traditional web users (5.81 points in the VR scenario vs. 5.38 points on a scale of 1–7 in the 2D scenario).
As expected, H7 was supported in both environments. As an explanatory variable, perceived usefulness provides a better explanation for intention to use a technology in the 2D treatment than in the VR treatment, with β values of .661 and .536, respectively. The high β values (β = .536 in VR, the second highest effect in the model for this scenario, and β = .661 in 2D, the highest effect in the model for this scenario) are consistent with the acceptance of H6 and with Davis (1989), who argued that software that is perceived as easier to use than other software is more likely to be accepted by users. It is also in line with the findings of Disztinger et al. (2017), who showed that perceived utility positively influences tourists’ intention to using virtual reality technologies to plan their trips.
Regarding the acceptance of H8, we found that this effect contributed to the nomological validity of the model for both platforms (β = .449 in the VR scenario and β = .348 in the 2D scenario). This is consistent with Tussyadiah et al. (2018), who demonstrated that attitude change toward the destination directly and positively affects the consumer’s visit intention. In addition, there is a difference in the β values of .101 in favor of the VR platform. This is consistent with the findings of Huang et al. (2016), in that immersive VR technology can be used by tourism agents to incorporate sensory experiences into their communication strategies to support the tourist in his or her search for information, and his or her decision-making processes.
Effects of External Variables
As mentioned in the “Method” section, we analyzed the possible effects of some external variables that might influence the causal relationships between the constructs that constitute the proposed model applied to the virtual reality platform. Taking 10 discriminating variables, based on a study of psychographic segmentation by personality traits, values and lifestyles, applied to a sample of 334 individuals drawn 2 months earlier from the same population, a moderation analysis was made of the psychographic variables, followed by a multigroup analysis of the demographic variables gender and income. The analyses did not identify any interaction effect between the moderating variables and the endogenous constructs of the model.
Subsequently, a joint application of the FIMIX-PLS and PLS-POS methodologies proposed by Hair et al. (2017) was conducted, in an attempt to visualize the expected latent segmentation of the sample based on the discriminating psychographic variables and to establish its impact on the explanatory conditions of technological acceptance and intention to visit. While the FIMIX-PLS algorithm explores the unobserved heterogeneity of causal models, and generates a number of segments that represent it, the PLS-POS algorithm identifies latent segments by minimizing the distances between each individual and the segment to which (s)he belongs. A complementary ex-post analysis made it possible to characterize these segments and measure their impact on the path coefficients of the causal model. The psychographic scales used in the study were the NEO-FFI Five Great Personality Traits (NEO Five Factor Inventory) of Costa and McCrae (1992), the LOV Values List by Kahle and Kennedy (1988), and the System of Values and SBI VALS Lifestyles and demographics. Table 8 shows the representative discriminant variables of the psychographic population segments.
Discriminant Psychographic Variables.

The FIMIX analysis allowed us to determine an optimal division of the sample into two segments based on the criteria of Hair et al. (2017), that is, the values of the path coefficients and the R2 for each endogenous construct in the segmented sample were generally substantially higher than those obtained in the total sample. This shows that the sample has a reasonable level of heterogeneity. According to the FIMIX-PLS algorithm, both segments account for 76.47% and 23.53% of the individuals, respectively. However, because the moderation analyses were not revelatory, it was not possible to ensure that this heterogeneity was exclusively due to psychographic and demographic differences, that is, other latent variables may explain it.
From this resulting division, the individuals were assigned to the groups using the PLS-POS algorithm. An ex-post analysis conducted with the groups generated by the PLS-POS algorithm and the 10 psychographic variables, and the two demographic variables, based on contingency tables, showed that the frequency distributions of the individuals coincided with 70% or more for all pairs of possible variables. Given that the minimum value of acceptable coincidences is 60% (Hair et al., 2017), we can conclude that the assignment of individuals to each segment is explanatory of the distribution of the psychographic and demographic characteristics of the individuals. In other words, there is a joint variation between the psychographic and demographic characteristics and the latent heterogeneity of the sample, and this is generalizable to the study population. However, as no significant differences were found in the frequency distribution of each variable between both segments, it was not possible to determine the magnitude, type, and form of the effect of each of the psychographic and demographic variables on the adoption of virtual reality technology.
Finally, by using bootstrapping, a separate estimation of the model was performed based on the assignment of individuals made by the PLS-POS algorithm; this allowed us to establish how the causal relationships varied based on the latent segment identified in the sample. Unfortunately, the path coefficients of segment 2 were not significant, so it was not possible to obtain the predictability of the individuals that made up this segment. Table 9 shows the path coefficients for the unsegmented sample and for segment 1.
Model Path Coefficients With and Without Segmentation.

p > .05.
The differences between the path coefficients of segment 1 and the unsegmented sample in Table 9 indicate the convenience of latent segmentation for estimating adoption behavior toward virtual reality technology, and intention to visit the tourist destination, particularly considering that segment 1 is made up of individuals who account for 76.47% of the total sample.
From the results presented above, we can conclude that external factors influence the relationships between immersion and presence, presence and enjoyment, presence and attitude toward change, enjoyment and attitude toward change, perceived utility and intention to use virtual reality, and attitude toward change and intention to visit a destination. In turn, these external factors negatively influence the relationships between enjoyment and perceived ease of use, and between perceived ease of use and perceived utility.
Implications
Conceptual implications
Our findings allow us to make interesting suggestions for researchers and managers. From a research point of view, our findings underline the potential of virtual reality as a channel that can be used to promote visits to tourist destinations and to make bookings. Our comparative findings about e-commerce show that the effects observed in the VR model are only slightly lower than in the e-commerce model. These results can be attributed to the consumer’s higher familiarity with e-commerce platforms. Nonetheless, it seems that participants are willing to accept VR technology in much the same way as they accepted e-commerce.
The similarities in the relationships studied between VR and traditional websites are high, indicating that consumers tend to assess them similarly, although some differences exist. Furthermore, sense of presence is confirmed as a key driver of VR adoption. As the literature notes, immersion has an important influence on sense of presence, and sense of presence on enjoyment and attitude change.
The salient effect of VR in comparison to e-commerce is related to the relationship between attitude change and visit intention; this shows the feasibility of VR for promoting tourism destinations. Therefore, the acceptance of VR technologies is important because they elicit positive behavioral effects on visiting destinations. Conversely, the slightly greater effects shown in the e-commerce model indicate that it is still perceived as an important booking channel (e.g., the stronger relationship between perceived usefulness and intention to use).
From the cognitive effort perspective, the higher effect observed in the relationship between sense of presence and enjoyment in the e-commerce setting might suggest that, despite the value of VR, tourists might want to be guided (as happens in a video) when they are searching for information rather than searching for it themselves, as in VR. This additional cognitive effort does not seem to invalidate the positive effects of VR for promoting visits, but an interesting research line might be to compare the trade-off between the number of potential interactions in VR and decision-making.
There is growing evidence that in multichannel retailing customers switch between channels (Verhoef, 2021), and this is applicable also to the context of the present study. As our results show that tourists are positive about both v-commerce and e-commerce, they might switch between them during the decision-making process. A closer look at the customer journey concept, as described for VR by Wedel et al. (2020), may lead to a better understanding of the roles of each channel. Our results suggest that v-commerce seems more valid during the pre-purchase stage of the customer journey. However, consumers still use e-commerce more because of their previous online booking experience, as its higher perceived ease of use reflects. Indeed, the previous literature supports this view of omni-channeling based on virtual reality techniques. Thus, Verhoef (2021) emphasized the role of VR as an enabler of omni-channel shopping. Likewise, Hilken et al. (2018) also emphasized the role of VR in omni-channeling.
The FIMIX-PLS and PLS-PLOS analysis identified a latent segment based on the effect of the psychographic and demographic variables in the model. Although the magnitude of the influence on each variable could not be determined, the analysis showed a joint effect. This overall effect should encourage further research into specific personality traits, values and lifestyles, and the demographic variables that are key to explaining technology adoption and intention to visit a destination. As Guttentag (2020) noted, some people may use VR as a substitute for actual tourism experiences. Our results showed there is still limited adoption of VR for purchasing. Therefore, it might be that, currently, VR is in a transition era toward its full adoption for both experiences and purchases.
Managerial implications
Our findings allow us to make interesting suggestions to destination management organizations. First, VR seems to be a successful tool for promoting destinations. In fact, the higher score observed in the relationship between attitude change and visit intention in the VR scenario over the web-based scenario is indicative of its value. This can be attributed to the higher level of immersion and sense of presence provided by VR. Although traditional websites still perform well in holiday bookings, our results show that the gap between both environments is narrow. Second, as VR becomes more popular, its use by tourists for booking holidays will become similar to that currently experienced by traditional websites. In fact, the growing speed of adoption of VR (Statista, 2021b) seems likely to continue. Furthermore, our findings did not identify any potential caveats. Third, it seems that tourists behave differently based on psychographic and demographic variables, so managers should target the segments that will adopt VR earlier. Fourth, as suggested earlier in relation to omni-channeling, managers should consider VR as one of the channels that tourists may use in combination with others at different stages of the customer journey. Based on this channel switching consumer behavior (e.g., research online, purchase offline, ROPO), our results seem to suggest that VR immersion and purchase online (VRIPO) is a potential future pattern of the customer journey.
Conclusion, Limitations, and Further Research
This experimental study comparatively analyzed the effect of two electronic platforms (v-comm and e-comm), using the same booking environment and the same tourist services, on consumers’ visit intentions and on their evaluation of technology. The purpose was to investigate how the perceived value of a travel package varied based on whether the store offered a digital or a VR format for booking.
The empirical study followed a scenario-based experimental approach; this permitted us to identify the perceived values of a wide range of dimensions, such as sense of presence, cognitive absorption, perceived usefulness, attitude change, intention to visit a destination, intention to use a technology, perceived ease of use, and state of flow. The proposed structural model fits the data well and obtained adequate levels of explanation and predictability for both types of electronic platforms; this suggests that the results are reliable and can be considered comparable to each other. Our findings are limited to Chile. Therefore, generalizations should be undertaken with caution and be limited only to similar countries.
The mean differences observed demonstrate that tourists using the VR platform reported a higher sense of presence, greater ease of use, and a stronger attitude change toward the destination than those who purchased using the traditional web-based environment.
The analysis of the structural relations suggested that traditional web-based platforms are still as, or more, effective than VR platforms in terms of intention to use a technology; however, tourists who display a greater attitude to change to VR can be more influenced to purchase in a VR environment. However, the most interesting finding is that, overall, the relationships analyzed in the VR environment were confirmed and their values were close to the values of the relationships found in the traditional website, except for the relationship of enjoyment and attitude change, which was not significant in the VR setting. More specifically, VR generated a higher sense of presence, driven by immersion, than was apparent on the traditional websites. It was also observed that VR produced a greater attitude toward change, and that this factor depended more on the sense of presence generated by the VR, than on enjoyment. Furthermore, it can be concluded that attitude toward change exerted a greater influence on intention to visit the destination in a VR environment than in a traditional web environment. Conversely, it was observed that the traditional website exerted a greater influence on intention to use the technology, which is provoked by enjoyment, perceived ease of use, and perceived usefulness. Although the effect was only slightly greater, we consider it will be necessary to examine this in future technology adoption research. The effect may be attributed to the novelty of VR as a platform through which to buy tourist packages. When the channel is consolidated in the market, it is quite possible that this effect will be equal to, or exceed, that currently exerted in the traditional web. It is also possible that some external variables, such as demographic and psychographic factors, play important roles in technology acceptance and visit intention behaviors. We come to this conclusion because, in the latent segmentation analysis, the beta value provides more than 80% of the explanation of the effect between immersion and presence, and more than 60% of the explanation of the effect between presence and enjoyment.
No differences were found in participants’ preferences for the different tourist packages based on type of electronic platform, which suggests that providers need not adapt their offers based on platform type.
Taking into account that the theories and models of technology acceptance integrate individuals’ psychological and sociological factors as the main explanatory constructs of technology acceptance behavior (Ajzen, 1985; Ajzen & Fishbein, 1980; Ajzen & Madden, 1986; Davis, 1986; Rogers, 1995), we suggest that further research is required to identify the effects of personality, values, and lifestyles on booking intentions and into the dimensions of the perceived value of the service offered in VR environments. Pizzi et al. (2019) found that VR is efficient for both hedonic and utilitarian product sales; however, these authors showed in a VR environment that while hedonic products have greater consumer acceptance, utilitarian products produce greater satisfaction. Consequently, to broaden the knowledge about the scope of the use of VR, we suggest complementing this study with comparative analyses of purchases using VR devices applied to both hedonic and utilitarian products.
This study had some limitations. Sense of presence may encompass both spatial presence at the destination and social presence through interactions with the local community and/or other tourists. However, we did not measure these dimensions. Future studies might investigate whether these types of sense of presence might be higher in VR than on websites and address the influence of presence type in the holiday booking process in each channel. Furthermore, a second-order model was developed to test the effects of cognitive absorption on presence, but the average variance explained was below the recommended value of 0.5 (Fornell & Larcker, 1981).
In addition, we did not measure interchangeability between channels. Future studies might allow consumers to search for information on one platform and book through another. This interchangeability would favor the omni-channel perspective.
The experiment was conducted in real electronic environments, and self-administered questionnaires were used in the data collection stage. Consequently, the answers depend on the willingness of the interviewees to express opinions on subjective aspects, such as sense of presence, attitude to change, and perceived usefulness. The interviewees might not have easily understood these questions. To complement these measures, and in line with a growing trend, future studies might incorporate neuroscientific metrics to analyze participants’ emotional reactions and the visual attention they pay to content to identify the relationships between navigation patterns and product choice.
Footnotes
Declaration of Conflicting Interests
The author(s) declared no potential conflicts of interest with respect to the research, authorship, or publication of this article.
Funding
The author(s) disclosed receipt of the following financial support for the research, authorship, or publication of this article: This research has been partially supported by the Spanish Ministry of Science and Innovation (ID grant number: PID2019-111195RB-I00).
