



Abstract
What drives consumers to adopt mobile technologies has been a significant research topic in hospitality and tourism literature. The Technology Acceptance Model (TAM) has been widely adopted to examine this topic. Meta-analytic structural equation modeling (MASEM) was conducted to assess the efficacy of the TAM in estimating consumers’ intention to adopt these technologies in hospitality and tourism contexts. The moderating effects of cultural differences (Eastern vs. Western) and research contexts (hospitality vs. tourism) were also examined. Based on 33 individual samples (N = 13,635), the results indicated that: “perceived usefulness” (PU) has the strongest impact, “perceived ease of use” (PEOU) has stronger effects on PU and attitude in the context of Eastern culture compared to Western culture, and the relationship between “attitude” and “intention” was stronger in the context of hospitality than in the context of tourism. Implications for hospitality and tourism researchers and practitioners are discussed based on these findings.
Keywords
Introduction
Information and communication technologies have significantly impacted the expansion of the hospitality and tourism industry since the early 1990s (Buhalis & Law, 2008). With the widespread availability of mobile internet, mobile technologies (smartphones, mobile apps/applications, and tablets) are becoming the main means of accessing the internet for consumers. This is having a profound influence on consumer behavior (Pantano & Priporas, 2016; Sanakulov & Karjaluoto, 2015). Mobile payment technologies have reshaped consumers’ payment behaviors (Taylor, 2016), and mobile commercial apps have reformed consumers’ consumption behaviors (Zolkepli et al., 2021). Mobile technologies are also becoming increasingly significant in the hospitality and tourism industry (Dorcic et al., 2019; Law et al., 2018). For instance, when traveling abroad, almost 85% of visitors use a mobile device, and 74% of visitors prefer to adopt a mobile application to make reservations (Kumari, 2020). Furthermore, considering current competitive conditions in the hospitality and tourism industry (Hossain et al., 2021), many hospitality and tourism businesses are adopting more recent mobile technologies to achieve competitive advantages, such as AI-powered chatbots, big data and virtual assist, biochanin technology, and tech lounges (Kumari, 2020). Therefore, what motivates consumers to adopt mobile devices has attracted the attention of professionals in the hospitality and tourism industry.
Among previous research, the Technology Acceptance Model (TAM) has been one of the most representative models for predicting consumers’ intention to adopt mobile technologies (Huang et al., 2019; J. Kim, 2016; Min et al., 2019). TAM includes several variables that both directly and indirectly describe two things: (a) people’s intentions to use technology and (b) people’s actual usage of it. The variables include “perceived usefulness” (PU), “perceived ease of use” (PEOU), and “attitude toward technology” (Davis, 1989). In general, TAM is composed of two key exogenous constructs (PU and PEOU) and two key endogenous factors (attitude and intention to use). PU refers to “the degree to which a person believes that using a particular system would enhance his or her job performance,” while PEOU is defined as “the degree to which an individual believes that using a particular system would be free of physical and mental effort” (Davis, 1985, p. 26). A person’s attitude refers to their negative or positive thoughts toward the adoption of a particular technology (J. Kim, 2016). The TAM model indicated that both PU and PEOU positively influence individuals’ attitudes toward the use of technology (Song et al., 2021). Empirical research based on the TAM model also revealed that PU was influenced by PEOU (Huang et al., 2016; Sahli & Legohérel, 2016). In addition, research on consumers’ acceptance of technology also demonstrated that attitudes regarding a given technology influence customers’ intentions to use it and ultimately determine whether or not it is actually adopted (Zhuang et al., 2021). TAM has become a prominent tool in marketing research across various types of mobile technologies due to its ability to account for the notable discrepancy between intended and actual technology use as well as its ease of analysis in structural equation modeling (SEM) frameworks (Scherer et al., 2019). Compared with other theories and frameworks in mobile technologies research, TAM is a more effective and widely used tool to explain users’ intention to adopt technology based on a thorough evaluation of mobile technology use in hospitality and tourism research.
The correlations between the TAM factors have not been well-explained by prior research. More specifically, the connections between the TAM components have varied significantly between various research, which limits the generalizability of the overall results (Scherer et al., 2019; Šumak et al., 2011). For instance, the path coefficient between PEOU and PU was found to be 0.51 (Ritter, 2017), 0.40 (Šumak et al., 2011), and 0.27 (L. Zhang et al., 2012), respectively, in the different individual studies. While individual empirical studies can determine the extent of the effects of various components within the TAM through partial regression coefficients, the presence of conflicting and mixed results in these individual research may result in confusion and the spread of misleading information. Therefore, to determine the statistical significance of the correlations within TAM, condensing the discrepancies and contradictions noted in the earlier research, and verifying TAM’s dependability, a meta-analysis of TAM studies in the context of hospitality and tourism is required.
Two categories were used by Shelby and Vaske (2008) to characterize the benefits of meta-analysis: one was a way to take into account the practical importance of research findings, and the other was a rigorous approach to quantitative study synthesis. Hunter and Schmidt (2004) also indicated that a meta-analysis is a robust approach that can mitigate the constraints inherent in single research, such as sampling errors. A more accurate statistical estimate of the effect size associated with a particular relationship can thus be identified. To date, no meta-analysis has been done to look at how customers intend to use mobile technology in the hospitality and tourism industry. To compensate for this research gap, the present study carried out a meta-analytic evaluation of earlier research examining hospitality and tourism consumers’ intentions to utilize mobile technology depending on TAM.
Considering the variability in effect sizes across previous research, latent moderators should be considered to investigate whether the magnitude of the TAM relationship may vary under different circumstances. One of the potential moderators could be culture. Prior studies have indicated that the behaviors of hospitality and tourism consumers are influenced by cultures (Fan et al., 2018; Soldatenko & Backer, 2019). Indeed, Hofstede (2001) indicates that our cultural backgrounds shape how we see things, who we think we are, and how we act. Moreover, culture can influence our social interactions and our priorities in life (Hofstede, 2001). Although the influence of cultures on hospitality and tourism consumers’ behaviors has been identified by previous research (Ezeh et al., 2022; Soroker et al., 2023), less is known about the influence of cultural variations on hospitality and tourism customers’ propensity to adopt mobile technology based on TAM. This research thus investigates the moderating role of culture in TAM which can enhance our understanding of the acceptance and adoption. Following previous meta-analysis studies (Jadil et al., 2021; Zhao et al., 2021), the culture construct was also categorized into Western culture and Eastern culture from the perspective of the cultural background of the study (Chiu & Cho, 2022).
Apart from cultural differences, previous studies have also found that decision context or decision goals might affect the criteria that customers use to make choices and judgments (Bettman et al., 1998; Kraus, 2000). According to Kraus (2000), the choice context is an important factor influencing customers’ choices for the relative relevance and value of different selection factors. Previous studies found that tourists’ behaviors are influenced by various types of choice contexts, such as the location of a hotel (resort vs. downtown), the size of the trip (alone vs. family), and types of tourists (leisure vs. business; D. Kim & Park, 2017). The finding was supported by Rooderkerk et al. (2011) who found that it is possible to improve decision behavior prediction by considering context effects. In addition, Ladeira et al. (2016) noted the distinctions between the notions of tourism and hospitality as services in the hospitality industry are seen as more tangible compared to the services in the tourism industry. However, a review of existing TAM literature indicated that no research was found to measure the impact of contexts on hospitality and tourism consumers’ intention to use mobile technologies. Therefore, to bridge the knowledge gap, this research reviewed and compared studies done in various research settings to explore the moderating influence of research contexts (hospitality versus tourism) on the correlations within the TAM components.
In summary, this research has two objectives: (a) to employ meta-analytical structural equation modeling (MASEM) to examine how well TAM predicts the intention of hospitality and tourism consumers to utilize mobile technologies, taking into account the degree of variation and heterogeneity in the relationships between the TAM variables and (b) to explore the moderating roles of cultural differences (Eastern vs. Western) and research contexts (hospitality vs. tourism) on the causal correlations between the TAM constructs. The research is organized in the following way to accomplish these research goals.
The first part provides an overview of the TAM studies and describes the procedures for gathering data and conducting the meta-analysis. Following this, the outcomes of the meta-analysis, moderator analysis, and MASEM are elaborated upon with a comprehensive interpretation of the results. Finally, the implications for researchers and practitioners as well as limitations and recommendations for future study are discussed.
Literature Review
Consumers’ Intention to Use Mobile Technologies in Hospitality and Tourism Contexts
Mobile technology use has become a hot research topic in hospitality and tourism contexts in the last several years (Law et al., 2018). Among the studies, one of the most popular research topics has been consumers’ intention to use different types of mobile technologies (Cheng et al., 2021), such as mobile devices (M. J. Kim et al., 2016), mobile travel applications (Carvajal-Trujillo et al., 2021), mobile payment options (Sun et al., 2020), and mobile tour guides (Lai, 2015). Several factors impacting hospitality and tourism consumers’ intentions regarding the use of mobile technologies have been identified. These include “expectancy” (Gupta et al., 2018), “social influence” (Gupta et al., 2018), “innovation characteristics” (Bhatiasevi & Yoopetch, 2015; Carvajal-Trujillo et al., 2021; PU’ J. Kim & Bernhard, 2014), “PEOU” (Bhatiasevi & Yoopetch, 2015; J. Kim & Bernhard, 2014), “perceived enjoyment” (Liebana-Cabanillas et al., 2020), “perceived similarity” (Ayeh et al., 2013), “interactivity” (Carvajal-Trujillo et al., 2021), “perceived value” (Liebana-Cabanillas et al., 2020), “performance risk” (Carvajal-Trujillo et al., 2021), and “social risk” (Liebana-Cabanillas et al., 2020).
PU and PEOU, as two important exogenous constructs in TAM, have been the most frequently used variables to explore hospitality and tourism consumers’ intention to adopt mobile technologies. Therefore, TAM has been the most frequently used theory to examine consumers’ intentions to adopt these technologies (Law et al., 2018). Specifically, through a comprehensive review of 92 relevant articles published between 2002 and 2017, Law et al. (2018) summarized the key theories used to explore hospitality and tourism consumers’ intention to use mobile technologies based on a comprehensive review of pertinent articles published between 2002 and 2017, such as the unified theory of acceptance and use of technology (UTAUT), the theory of planned behavior (TPB), the theory of diffusion of innovation (DOI), and TAM. Among the studies, 26.2% of them adopted TAM to explore hospitality and tourism consumers’ intention to adopt mobile technologies (Law et al., 2018). Apart from the theories used, the research conducted by Law et al. (2018) also found that most existing studies explored the research topic from the perspective of consumers compared to suppliers.
While TAM has been studied to understand hospitality and tourism consumers’ willingness to adopt mobile technologies, there have been inconsistencies and discrepancies about the links between the TAM components in prior research (Ritter, 2017; L. Zhang et al., 2012). The applicability of TAM to predict how hospitality and tourism consumers adopt mobile technologies remains uncertain. It is thus crucial to undertake a meta-analysis that synthesizes the differences and conflicts observed in previous research and confirms the reliability of TAM. In addition, a deeper comprehension of the model’s applicability may be obtained by investigating potential moderators that might strengthen or weaken the link between TAM components based on meta-analysis. Therefore, the current meta-analysis tests the following hypotheses to verify the original notions of TAM in the hospitality and tourism contexts using mobile technologies.
Advantages of TAM Among Other Models
Drawing upon innovation diffusion theory and social psychology theories, Davis (1989) developed TAM to explain why people adopt new technology or not. Over the last decade, many theoretical frameworks have been adopted to explore the background mechanisms and the factors influencing the adoption of technology. These include the UTAUT model, TAM, and the DOI theory (Law et al., 2018). Despite the range of frameworks, TAM has been the most commonly used to investigate a user’s adoption intentions and their actual use of technology (King & He, 2006; Scherer et al., 2019).
TAM, as an interaction-based model, has been widely used for forecasting and elucidating human behavior when utilizing technology (Cheng et al., 2021). Indeed, Sun et al. (2020) indicated that TAM is the most cited theory to increase our understanding of the factors influencing individuals’ adoption of new technology. Chen et al. (2011) claimed that TAM is more suited for usage in situations involving the adoption of technology due to several benefits, including specific adpoting for applying the concepts of PU and PEOU, more parsimonious, and more robust. In addition, Bagozzi (2007) found that one of the most important advantages of TAM is to identify the factors influencing technology adoption and the relationship between the factors.
Cultural Differences in Mobile Technology Use
Culture refers to the shared values, beliefs, and customs of a certain group of people (Nakata & Sivakumar, 2001; Pizam & Sussmann, 1995). The cultural dimensions theory proposed by Hofstede (2001) showed that there are distinct variations in how individuals perceive themselves in Eastern and Western societies. To elaborate, Eastern cultures tend to prioritize maintaining social harmony and focus on their responsibilities to prevent conflicts with others, whereas Western cultures place a greater emphasis on an independent self-view with a focus on individual gains. Moreover, Eid and Agag (2020) proposed that an individual’s values can be shaped by their national culture, given that their personal expectations and behavioral responses may differ.
As people from different cultural backgrounds could think and behave differently, the existing literature has investigated cultural differences as an important factor influencing how customers utilize and accept mobile technology (Choi & Totten, 2012; Tam & Oliveira, 2019). Specifically, previous research demonstrated that cultural variations have a moderating effect on customers’ adoption of mobile technology in numerous scenarios, such as mobile TV (Choi & Totten, 2012), mobile banking (Goularte et al., 2020; Jadil et al., 2021), and mobile commerce (L. Zhang et al., 2012). For example, L. Zhang et al. (2012) discovered the moderating influence of culture on the link between effort expectancy and usage intention. They found that consumers from Eastern cultural backgrounds are more inclined to prioritize effort expectations when considering the adoption of wireless technology. They also discovered that, in comparison to Western culture, the association between usage intention and actual usage behavior is greater in Eastern culture. This result was supported by Jadil et al. (2021) who found that the UTAUT linkages are more significant in Eastern cultures than in Western cultures by conducting a meta-analysis of the UTAUT model in the context of mobile banking. Despite this, the influence of cultural variations on consumers’ intention to adopt mobile technologies in hospitality and tourism contexts is still an under-researched topic (Ahmad et al., 2021). Currently, research has explored cultural differences when applying TAM to use mobile technologies in business (Alshare et al., 2011) and education contexts (Zhao et al., 2021). Although previous research has investigated the role of cultural differences on consumers’ intentions to adopt mobile technologies using TAM (Alshare et al., 2011; H. C. Lin, 2014), no research has looked at how cultural differences affect hospitality and tourism customers’ intentions to adopt mobile technologies using TAM. This research used a meta-analytic technique to investigate the influence of cultural differences on intention to use mobile technologies in hospitality and tourism contexts using TAM, taking into account the significant impact of culture on consumers’ intentions to adopt these technologies. Drawing on the aforementioned literature, the subsequent hypothesis is posited:
Research Context Differences in Mobile Technology Use
Extant literature suggests that research context differences can lead to divergent results regarding a person’s behavioral pattern (D. Kim & Park, 2017; Miska et al., 2018). For instance, Kim and Park (2017) demonstrated that tourists’ perceptions of the relative relevance of features are impacted by the choice context, such as the location of a hotel (downtown vs. resort or tourist destination) and the size of the trip (alone vs. family). Previous studies on consumers’ intentions to use mobile technologies have been conducted in many contexts, including “alliance” (Shah & Swaminathan, 2008), “environmental” (Richard et al., 2007), “team” (Schippers et al., 2015), “sociocultural” (Fox et al., 2017), and “job” (Farh et al., 2012). The study conducted by Wu et al. (2011) investigated the moderating effect of context type (commercial or non-commercial) on the core components of TAM by conducting a meta-analysis. All core components of TAM were moderated by the context type in the e-commerce context. The results indicated that a deeper comprehension of the effects of the context enables to increase the ability to predict how customers will embrace mobile technologies. Therefore, it is imperative to define the context in which consumers make a decision for meaningful implications (Hensher et al., 2005).
A review of existing research showed that some studies explored customers’ intentions to use mobile technologies in hospitality settings, and some studies investigated this topic in tourism settings. Ladeira et al. (2016) emphasized the distinctions between the concepts of hospitality and tourism. This distinction is based on the notion that services offered by the hospitality industry are less tangible than the tourism industry. Tourism refers to the activity in which individuals travel beyond their local regions, either for recreational or for business reasons, with a stay lasting no more than a year (Ladeira et al., 2016). However, hospitality includes businesses such as lodging, restaurants, and events, offering products and services not only to tourists but also to the community’s residents (Ladeira et al., 2016). Similarly, Reisinger (2001) noted that tourists usually receive intangible experiences rather than concrete goods from tourism services. However, customers in hospitality environments encounter more concrete services, such as food, beverage, and accommodation.
Wakefield and Blodgett (1999) stated that consumers show varying responses within hedonic contexts such as hospitality and tourism when experiencing tangible and intangible services. Customers’ perceptions, emotional experiences, and subsequent behavioral intentions are influenced by the differences. In addition, Ding and Keh (2017) indicated that as services cannot be physically touched or observed, consumers are more likely to adopt abstract thinking (i.e., high-level construal) when evaluating intangible services. However, when experiencing a tangible service, consumers rely on low-level construal and pay close attention to details (Ding & Keh, 2017; Liberman et al., 2007). Thus, consumers who use services offered by the hospitality industry may perceive things differently and focus on different levels of construal compared with the tourism industry.
Previous studies have indicated that an individual’s construal level can affect their cognition and emotions toward mobile technologies based on construal level theory (Liberman et al., 2007; Tseng & Hsieh, 2019). For these reasons, hospitality and tourism consumers may exhibit varying perceptions toward mobile technologies. However, there have been no studies investigating the influence of context differences (hospitality versus tourism) on consumers’ intentions to use mobile technologies based on TAM. Therefore, this research uses a meta-analytic method to investigate how context differences affect the desire to adopt mobile technologies in hospitality and tourism contexts depending on TAM. The following hypothesis is put out in light of the material mentioned earlier:
Method
Literature Search
An electronic database (i.e., EBSCO Hospitality and Tourism Complete) and a search engine (i.e., Google Scholar) were employed to retrieve studies to be included. Latent samples were captured using the following search items (“technology acceptance model *” OR “technology acceptance OR “TAM”) AND (“tourism” OR “hospitality” OR “travel” OR “hotel” OR “Restaurant”). Google Scholar was checked first, with subsequent searches utilizing EBSCO Hospitality and Tourism Complete. Google Scholar was chosen as the primary search tool because of its proven ability to detect various publication types (e.g., working papers, journal articles, dissertations, and conference proceedings; Weigel et al., 2014) and research using hospitality or tourism samples but published in non-tourism or hospitality journals. To guarantee the thoroughness of the analysis, the search was conducted without restriction to any particular journals. In the end, an additional unstructured search targeted at unpublished research was conducted using Google Scholar to double-check if any unpublished studies could be included. However, only very few unpublished studies (e.g., working papers) were found, and they failed to meet our inclusion criteria.
Candidates for inclusion, however, were required to conform to the criteria below:
to be an empirical research using TAM variables, namely, PEOU, PU, attitude toward use, and at least one dependent variable (i.e., intention to use and/or actual use);
to address hospitality or tourism consumers’ intentions to use mobile technologies;
to report a Pearson correlation matrix of the utilized TAM components;
to present the necessary statistics to conduct meta-analysis (e.g., effect size and sample size);
to report their findings in English; and
to be conducted in a hospitality or tourism context.
Study Selection and Coding
Study selection was performed by carefully following the procedures suggested by Moher et al. (2009) based on the above-mentioned inclusion criteria. In the initial stage, a total of 7,190 articles were found. After the removal of duplicates and the screening of titles, 2,874 individual studies remained. Specifically, by checking the title, studies on non-consumer samples (e.g., employees) or non-hospitality and tourism samples (e.g., banking customers), studies on other topics rather than mobile technology use (e.g., intention to use online review system or digital marketing tools), non-empirical (e.g., qualitative and review research), and non-English works were excluded. An examination of these based on the abstract yielded 2,156 articles for further screening. A more exhaustive (full-text) check was then conducted to confirm the eligibility of the final samples in the present review. The performance of inclusion criteria and study selection resulted in 29 articles covering 33 independent studies.
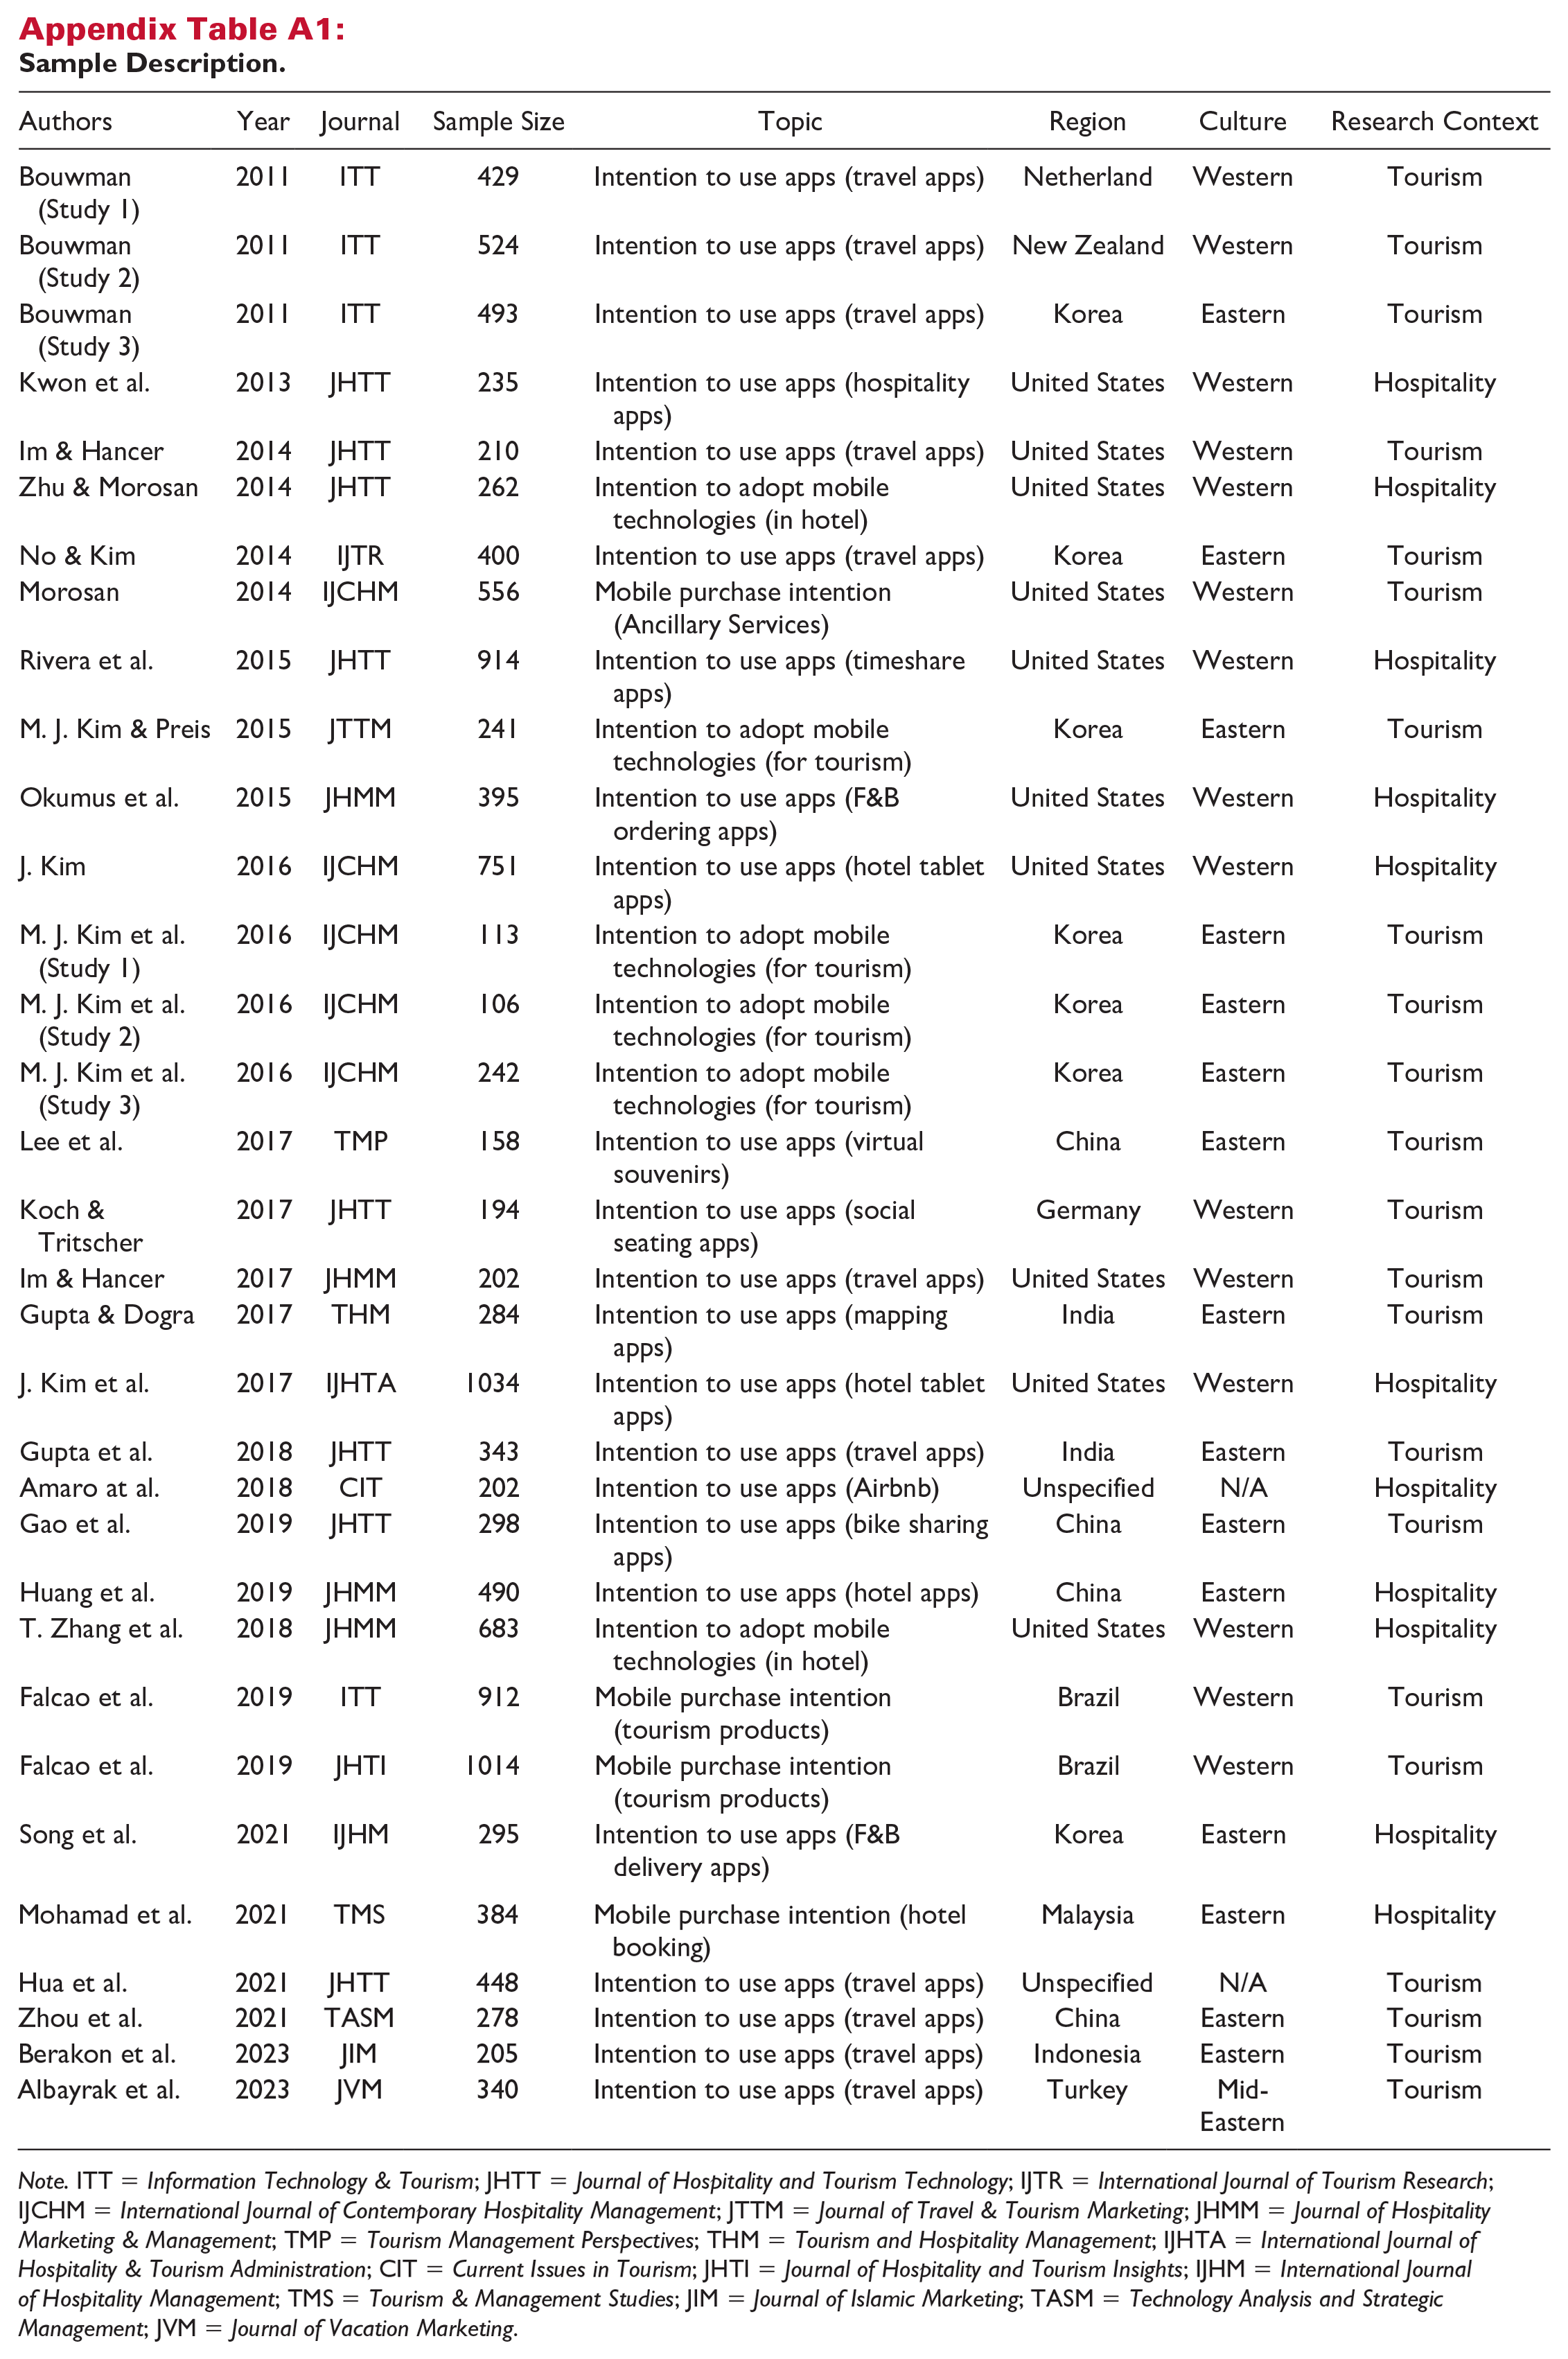
A code guidebook was created to guarantee coding uniformity. The coding was undertaken by two of the authors. During this process, whenever an issue of interpretation arose, it was resolved through consensus involving all the authors. Specifically, description information was first coded (See Table 1), such as publication details (e.g., authors, source, year of publication, and region) and research design (e.g., theme, research subject, culture, contexts, and research techniques). For example, regarding culture, in line with extant meta-analytic work (e.g., Jadil et al., 2021), the included works were tagged according to the geographic region where the study was undertaken, such as Western culture (e.g., United States) and Eastern culture (e.g., China). In terms of research contexts, in line with M.-T. Lin et al. (2022), independent studies were divided into two groups, namely, hospitality and tourism. Specifically, hospitality deals with accommodation and restaurants while tourism focuses on attractions, transportation, traveling activities, and so on. After then, the statistical data needed for undertaking a meta-analysis was recorded (e.g., sample size, correlation matrix, and construct reliability).
Meta-Analysis of Correlations Among TAM Constructs.
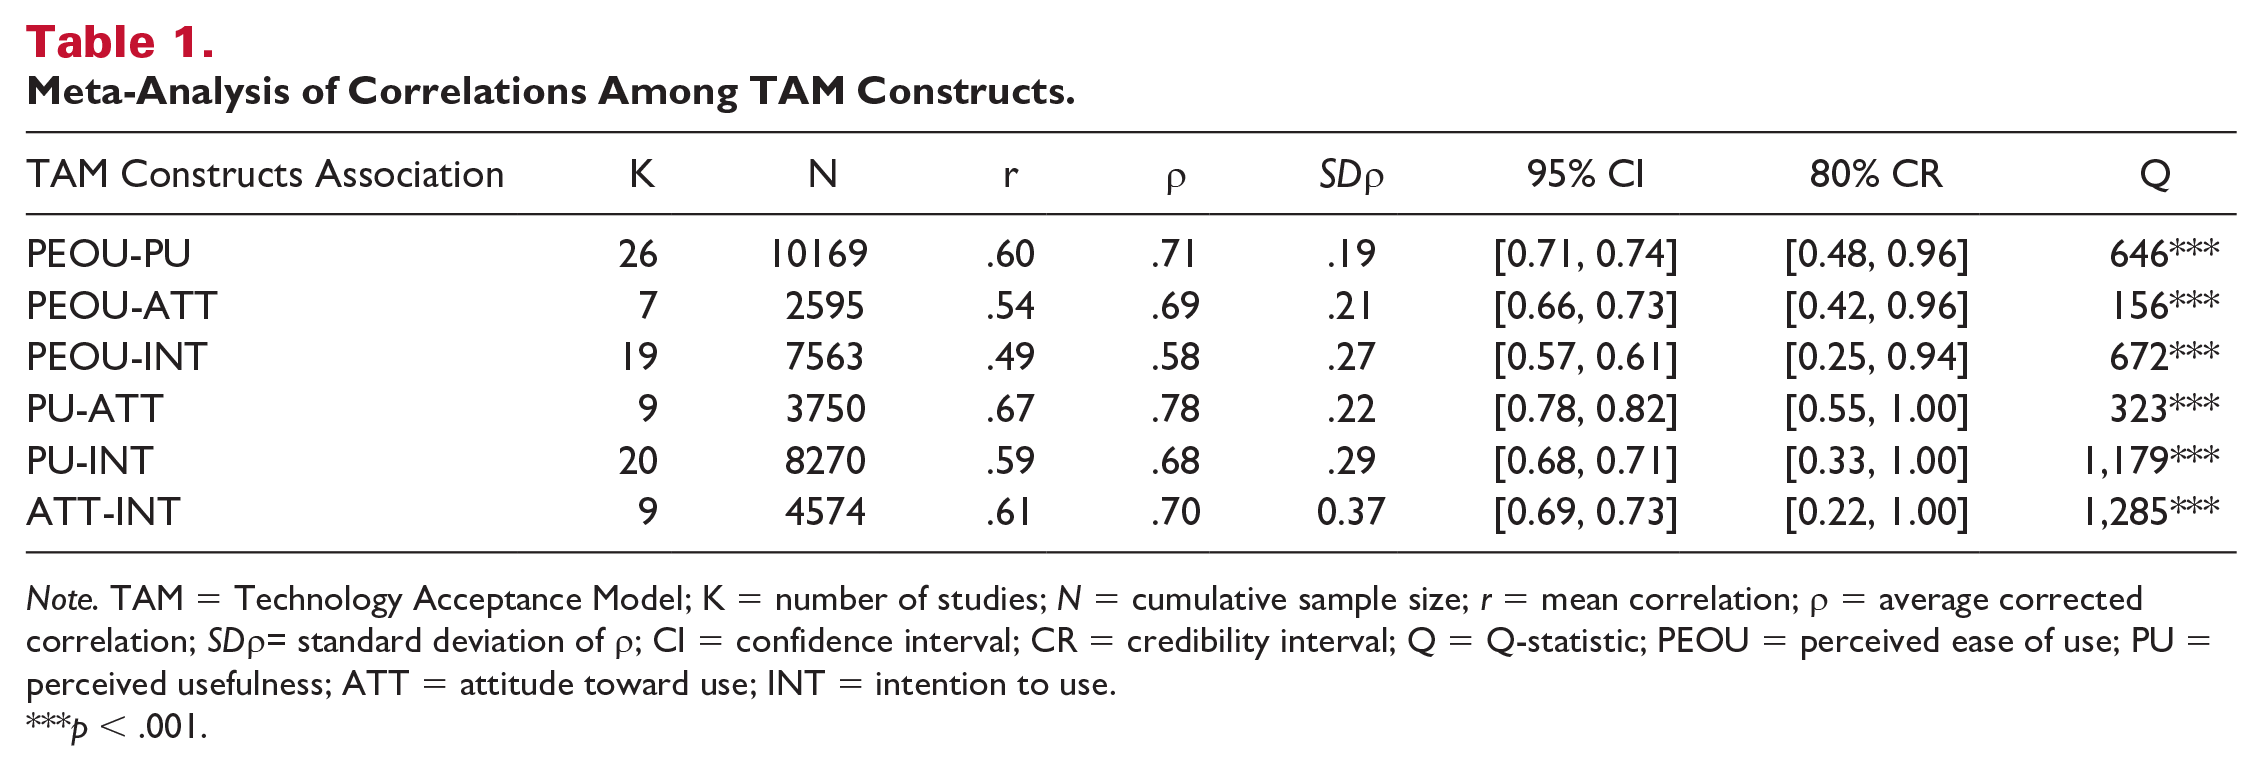
Note. TAM = Technology Acceptance Model; K = number of studies; N = cumulative sample size; r = mean correlation; ρ = average corrected correlation; SDρ= standard deviation of ρ; CI = confidence interval; CR = credibility interval; Q = Q-statistic; PEOU = perceived ease of use; PU = perceived usefulness; ATT = attitude toward use; INT = intention to use.
p < .001.
Data Analysis
Schmidt and Hunter’s (2015) psychometric meta-analytic procedures were adopted to estimate corrected mean correlations among the TAM constructs. A random-effect model was selected due to the fact that most included works were conducted independently with samples from different regions. The Pearson correlation coefficient (i.e., Pearson’s r value) was chosen as the effect size estimator when synthesizing primary findings. Sample sizes from the selected studies were adopted as weights to adjust for the sampling variations of the observed relations, and Cronbach’s α values were used to correct the unreliability of measurement. The mean corrected effect size (i.e., ρ) was used to indicate the estimation of the true effect size. It should be mentioned that because only two correlations between actual use and other TAM components were found, to avoid second-order sampling errors, the current review did not involve the actual usage construct (Schmidt & Hunter, 2015). To examine the stability and accuracy of the estimate, the statistical significance of each meta-analysis correlation was deduced by calculating 95% confidence intervals. If zero was not found in the 95% confidence interval, a statistically significant correlation was determined.
Considering that the random-effect meta-analysis model allows true effects to vary across studies because of sampling error and particularly because of unexplained heterogeneity (Schmidt & Hunter, 2015), two homogeneity tests (80% credibility intervals and Q-statistics) were performed for each correlation to indicate whether the included works showed a heterogeneous distribution for each correlation and whether further moderation analysis was required. Zhu et al. (2021) indicated that there exists substantial between-study heterogeneity when a credibility interval is large and/or includes zero. A statistically significant Q-value also suggests that there are significant variations in effects because of sample heterogeneity. In these situations, latent moderators could be in use. The “Z-test” was applied to perform a subgroup analysis (see Tables 3 and 4) to explore the potential moderating of culture and research context. Specifically, in terms of culture, in line with the practice of prior meta-analytic studies (e.g., L. Zhang et al., 2012), the included works were categorized into two subgroups (Eastern and western) in the present review according to the geographic region in which the research was undertaken, while with respect to the research context, the included research were divided into two subgroups (hospitality and tourism) according to the industrial sector in which the study was undertaken.
SEM was used to evaluate the corrected TAM relationships as a model of interlinked constructs and then to determine how well the model fit the data. Following the suggestions of Cheung (2015), a meta-analytic correlation matrix of TAM components was first created according to the findings of the psychometric meta-analysis. The matrix was then employed as the input to perform SEM analysis to assess the casual linkages among the TAM constructs, including the model fit test (i.e., Goodness-of-fit), as well as path analysis. Specifically, model fitness was evaluated utilizing (comparative fit index [CFI], goodness-of-fit index [GFI], incremental fit index [IFI], normed fit index [NFI], standardized root mean square residual [SRMR]) and standardized estimates. Typically, the model fit can be deemed satisfactory if GFI, CFI, NFI, IFI>0.90, and SRMR<0.08. Standardized regression coefficients were provided for path analysis.
Results
Sample Description
A total of 29 journal articles satisfied the requirements for inclusion: a total of 33 samples. Sample sizes of the selected works were relatively diverse: from 106 to 1,034 (M = 414, SD = 259). The total sample size was 13,635. The oldest work was published in 2011, while the latest study included was published in 2021. Among the included studies, 54% were published from 2017 until 2021. The individual studies were conducted in 11 different countries/regions. The majority of them utilized United States samples (K = 10), followed by Korean samples (K = 7), and Chinese samples (K = 4). In terms of research contexts, a larger portion of the research (65%) was undertaken in the tourism context (e.g., traveling activities), while the balance was in the hospitality industry (e.g., lodging, Food and Beverage). Publication distribution was scattered among 16 academic journals, with a clear dominance of International Journal of Contemporary Hospitality Management, Information Technology and Tourism, Journal of Hospitality and Tourism Technology, and Journal of Hospitality Marketing & Management. More descriptive information about the included works is exhibited in the Appendix.
Psychometric Meta-Analysis
The confidence interval of each relationship did not include zero, suggesting that all the corrected links among TAM constructs were significant (see Table 1). Among the relationships of intention to use with its antecedents, “attitude” (ρ= 0.70) showed the strongest correlation, with “intention,” followed by “PU” (ρ= 0.68) and “PEOU” (ρ = 0.58). Results also revealed that both PU (ρ = 0.78) and PEOU (ρ = 0.69) played an important role in improving attitudes toward using mobile technologies. In addition, a strong correlation was also detected between PEOU and PU (ρ = 0.71).
Moderation Analysis
As shown in Table 1, the Q statistics of each relationship were statistically significant, revealing the need for further moderating analysis. A series of Z-tests were performed to explore the moderating role of culture and research contexts. First, it was found that studies conducted within Eastern cultures reported stronger PEOU-PU and PEOU-ATT relationships (PEOU-PU = 0.76; PEOU-ATT, ρ = 0.83), compared with those conducted in Western cultures (PEOU-PU = 0.69; PEOU-ATT, ρ = 0.65; see Table 2). It was also observed that studies conducted in the hospitality sector (ρ = 0.83) reported a stronger ATT-INT relation in comparison with those conducted in the tourism sector (ρ = 0.57; see Table 3).
Results of Moderation Analysis-Eastern Culture vs. Western Culture.
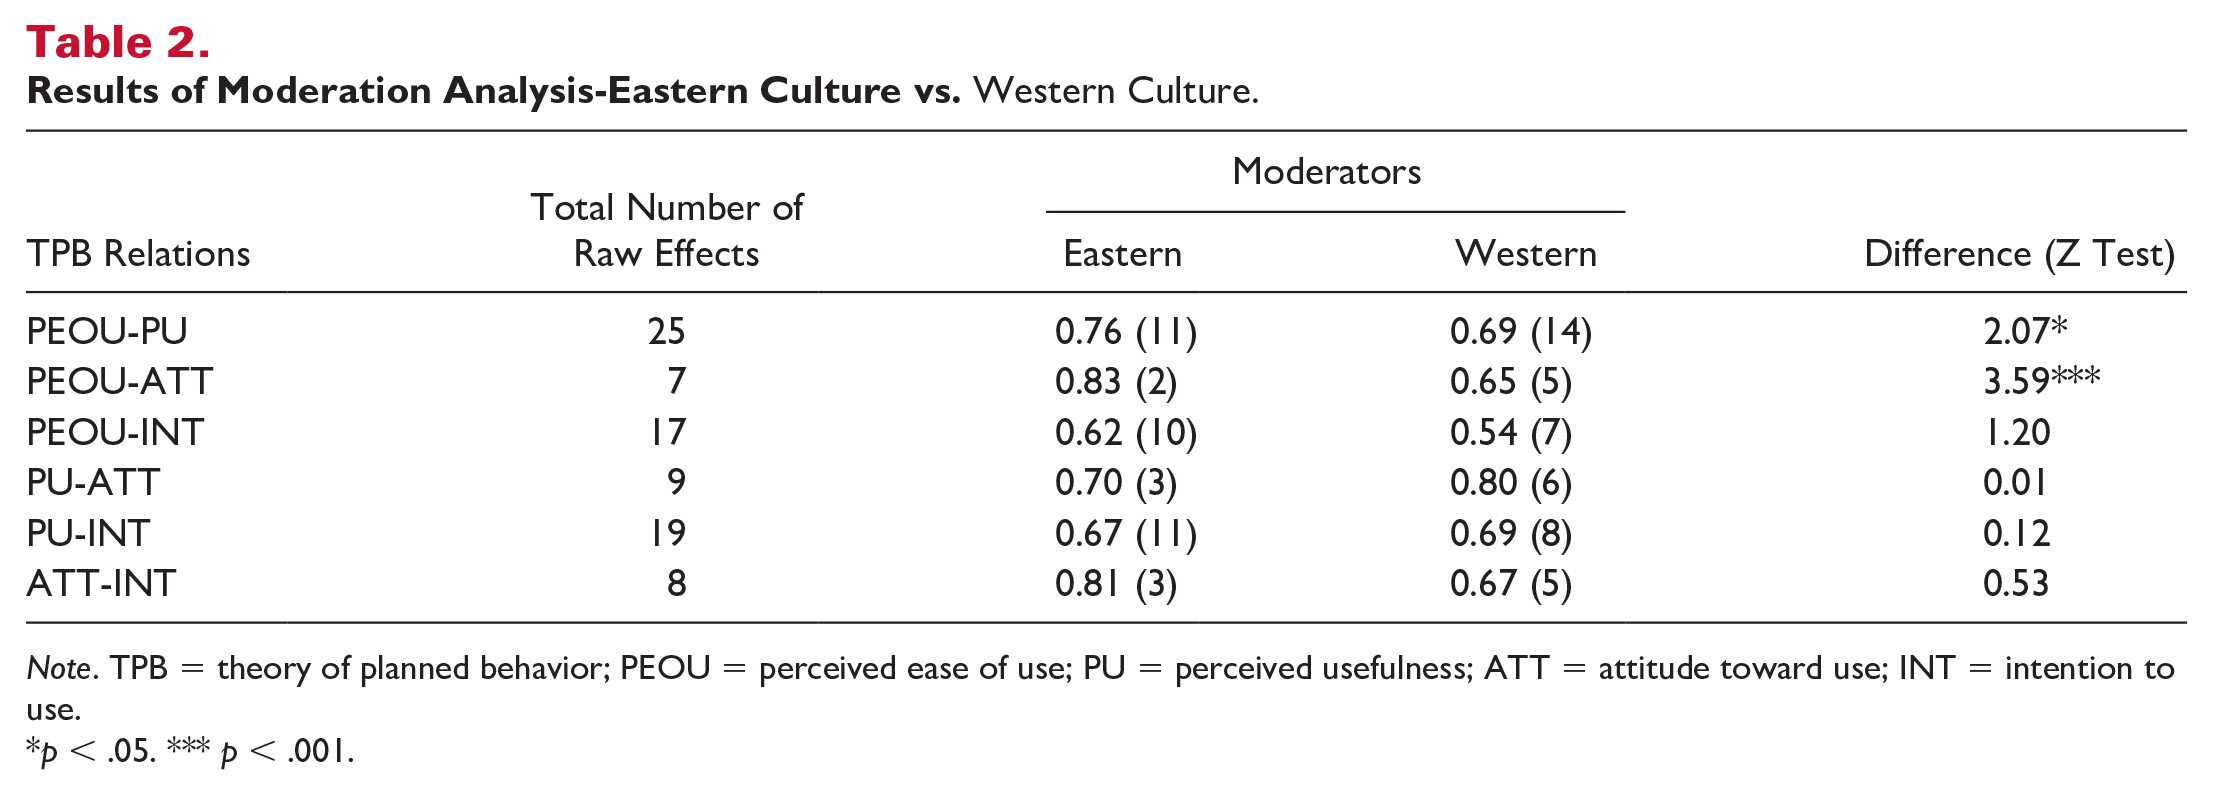
Note. TPB = theory of planned behavior; PEOU = perceived ease of use; PU = perceived usefulness; ATT = attitude toward use; INT = intention to use.
p < .05. *** p < .001.
Results of Moderation Analysis—Hospitality versus Tourism.
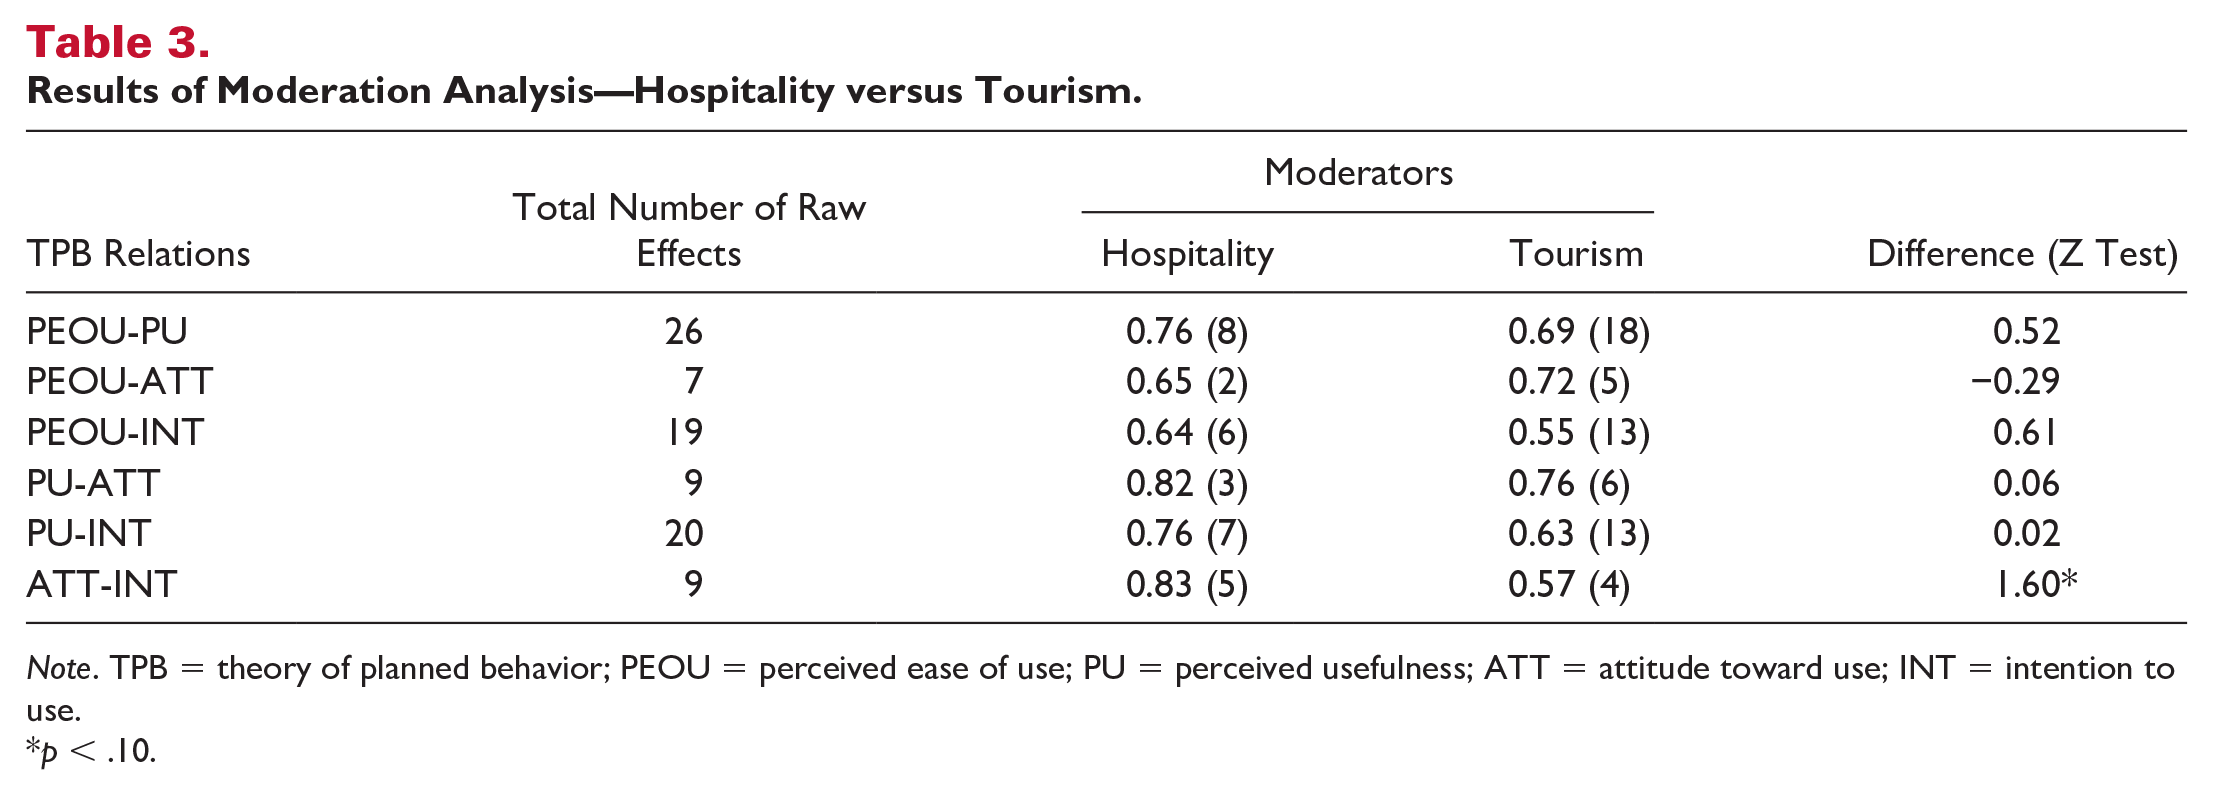
Note. TPB = theory of planned behavior; PEOU = perceived ease of use; PU = perceived usefulness; ATT = attitude toward use; INT = intention to use.
p < .10.
MASEM Analysis
MASEM
Analysis of TAM Model for Hospitality and Tourism Consumers’ Mobile Technology Use Intention
Utilizing the meta-analytically produced matrix of pairwise correlations as input (Table 4), MASEM was undertaken to investigate the efficacy of TAM in forecasting hospitality and tourism consumers’ mobile technology use intention. The TAM model’s fit indices were acceptable: χ2(2) = 248.5, p < .001, CFI = .96, GFI = 0.96, IFI = 0.96, NFI = 0.96, SRMR = 0.05. They demonstrated 65% and 49% variance in attitude toward utilizing mobile technologies and intention to adopt mobile technologies, respectively. In addition to the original TAM model, MASEM analysis was also performed for alternative theoretically feasible models. The results showed that the original TAM model (R2 = .49) explained more variance in the intention to adopt mobile technologies than the model without ATT (R2 = .40) and the model with PEOU, PU, and ATT as three independent predictors (R2 = .36).
Meta-Analytically Pooled Correlation Matrix for TAM.
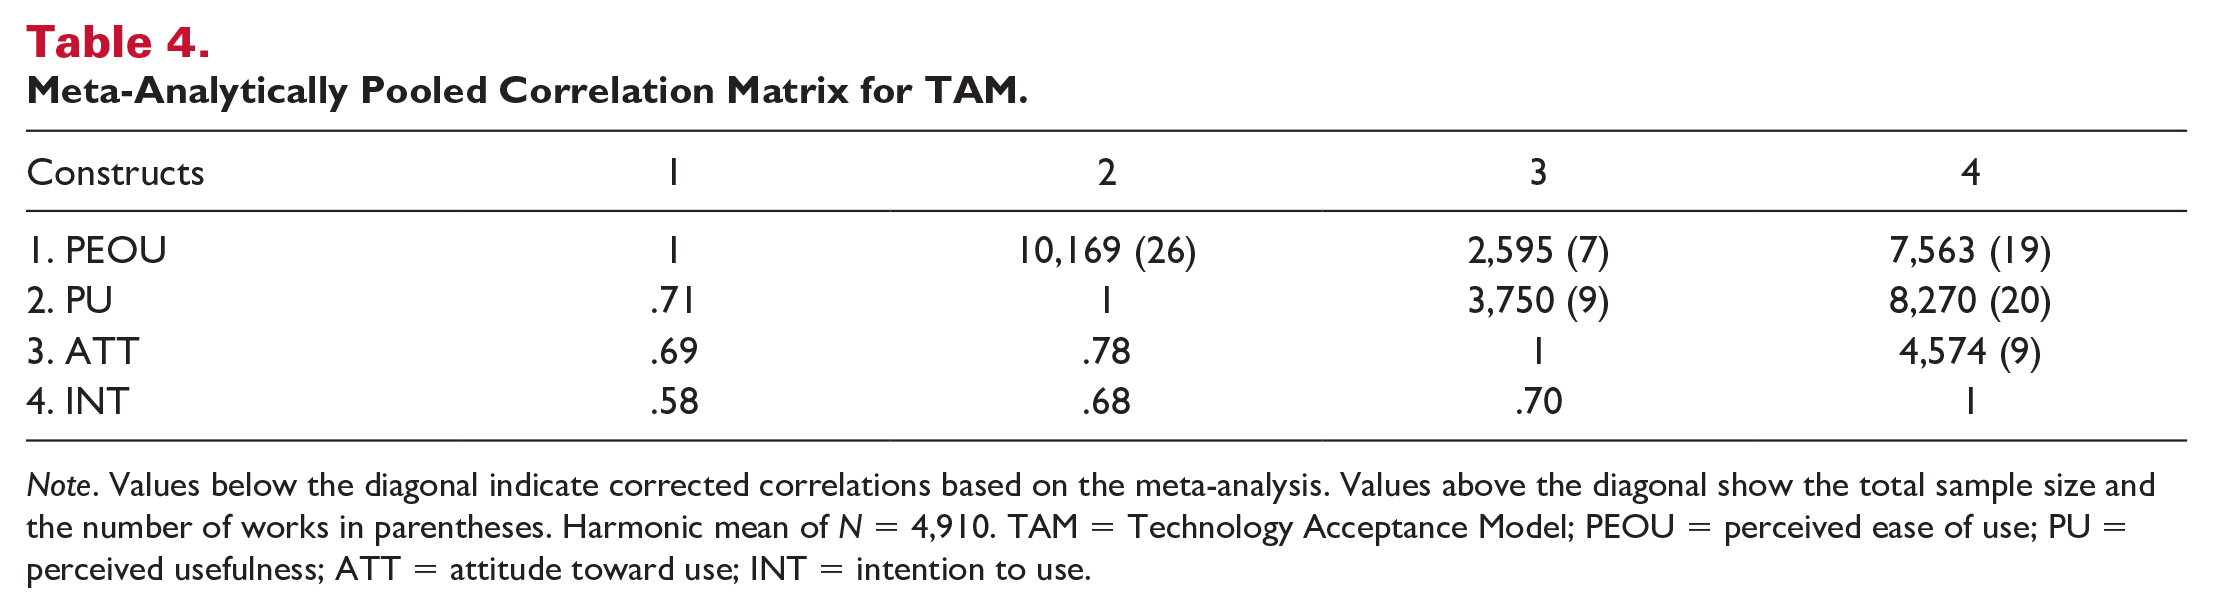
Note. Values below the diagonal indicate corrected correlations based on the meta-analysis. Values above the diagonal show the total sample size and the number of works in parentheses. Harmonic mean of N = 4,910. TAM = Technology Acceptance Model; PEOU = perceived ease of use; PU = perceived usefulness; ATT = attitude toward use; INT = intention to use.
In line with the results of the psychometric meta-analysis, all the estimated TAM paths achieved statistical significance. Specifically, the regression coefficients showed that attitude toward use was observed to be a strong antecedent of intention to use (β = 0.70, p < .001). PU (β = 0.58, p < .001) was identified as a stronger predictor of attitude toward use than PEOU (β = 0.27, p < .001). In addition, a strong effect from PEOU to PU was identified (b = 0.71, p < .001).
MASEM Analysis With Eastern and Western Samples
Utilizing the meta-analytically produced matrices of corrected correlations as input (Tables 5 and 6), MASEM was further conducted on the Eastern and Western samples, respectively, to better understand how culture acts as a moderator. First, regarding model fit, the TAM model obtained satisfactory model indices in both Eastern, χ2(2) = 80.61, p < .001, CFI = .95, GFI = 0.93, IFI = 0.95, NFI = 0.95, SRMR = 0.04, and Western contexts, χ2(2) = 238.08, p < .001, CFI = .95, GFI = 0.94, IFI = 0.95, NFI = 0.95, SRMR = 0.06.
Meta-Analytically Pooled Correlation Matrix for TAM-Eastern Sample.
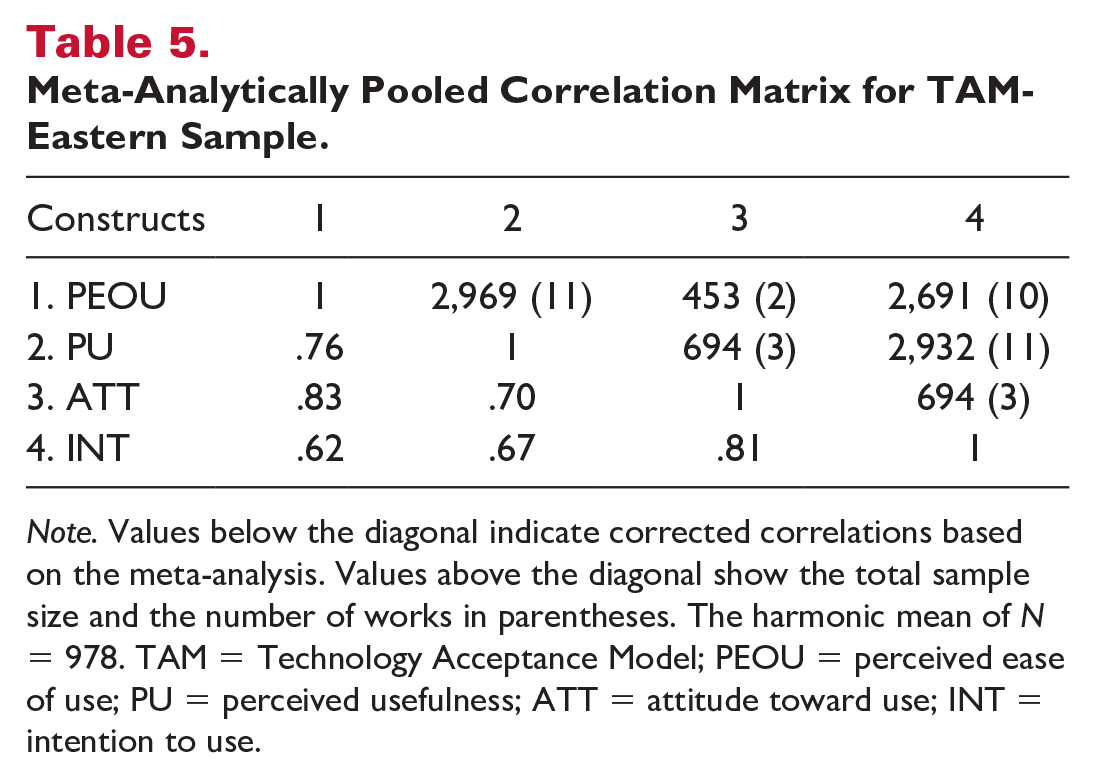
Note. Values below the diagonal indicate corrected correlations based on the meta-analysis. Values above the diagonal show the total sample size and the number of works in parentheses. The harmonic mean of N = 978. TAM = Technology Acceptance Model; PEOU = perceived ease of use; PU = perceived usefulness; ATT = attitude toward use; INT = intention to use.
Meta-Analytically Pooled Correlation Matrix for TAM-Western Sample.
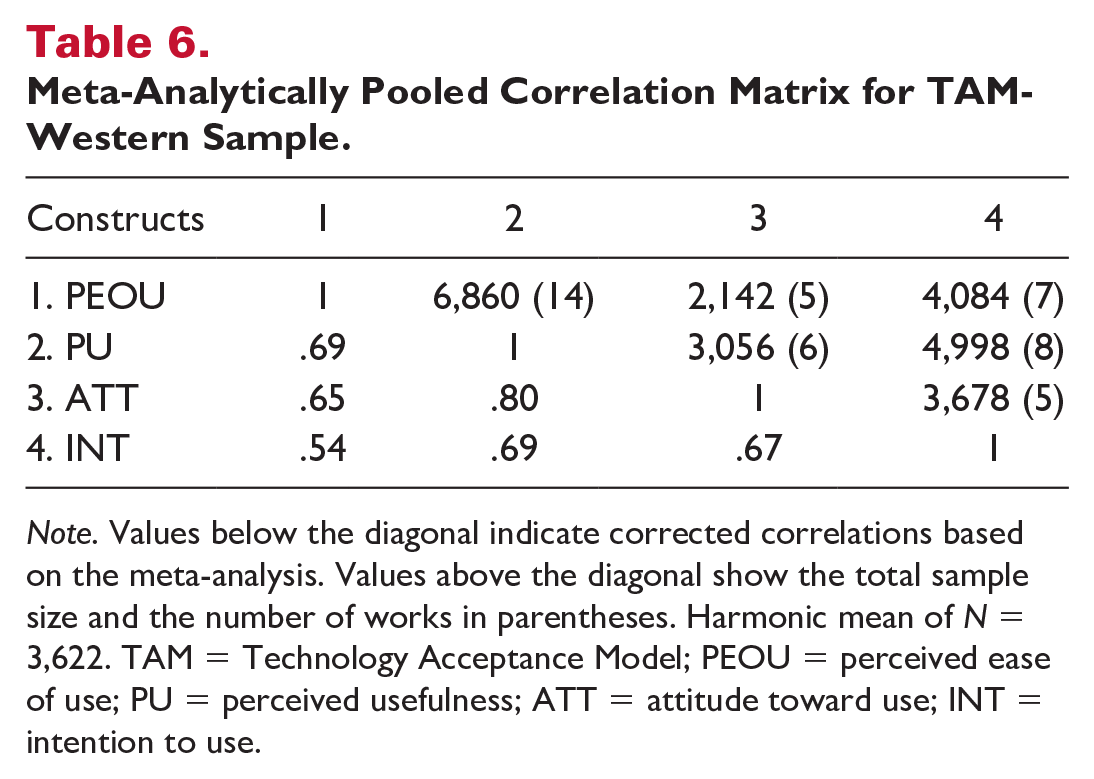
Note. Values below the diagonal indicate corrected correlations based on the meta-analysis. Values above the diagonal show the total sample size and the number of works in parentheses. Harmonic mean of N = 3,622. TAM = Technology Acceptance Model; PEOU = perceived ease of use; PU = perceived usefulness; ATT = attitude toward use; INT = intention to use.
All the estimated TAM paths achieved statistical significance in both Eastern and Western samples, confirming the psychometric results. The explained variance percentages of attitude toward using and intention to use are displayed in Figure 2. The results from subgroup MASEM also supported those of the Z-test, that is, the relationship of PEOU with PU (β = 0.76, p < .001) and attitude toward use (β = 0.71, p < .001) were significantly stronger in Eastern culture samples than in the Western culture samples (PEOU-PU, β = 0.69; PEOU-ATT, β = 0.19).

MASEM Analysis of TAM Model for Hospitality and Tourism Consumers’ Mobile Technology Use Intention.

MASEM Analysis With Eastern and Western Samples.
MASEM Analysis With Hospitality and Tourism Samples
Using the meta-analytically computed matrices of corrected correlations as input (Tables 7 and 8), MASEM was further conducted with the hospitality and tourism samples, respectively, to gain more understanding of the moderating effect of research contexts. First, in terms of model fit, the TAM model showed a good model fit for both hospitality and tourism samples (Hospitality: χ2[2] = 63.72, p < .001, CFI = 0.98, GFI = 0.96, IFI = 0.98, NFI = 0.98, SRMR = 0.04, Tourism: χ2[2] = 247.80, p < .001, GFI = 0.93, CFI = 0.93, NFI = 0.93, IFI = 0.93, SRMR = 0.07).
Meta-Analytically Pooled Correlation Matrix for TAM-Hospitality Sample.
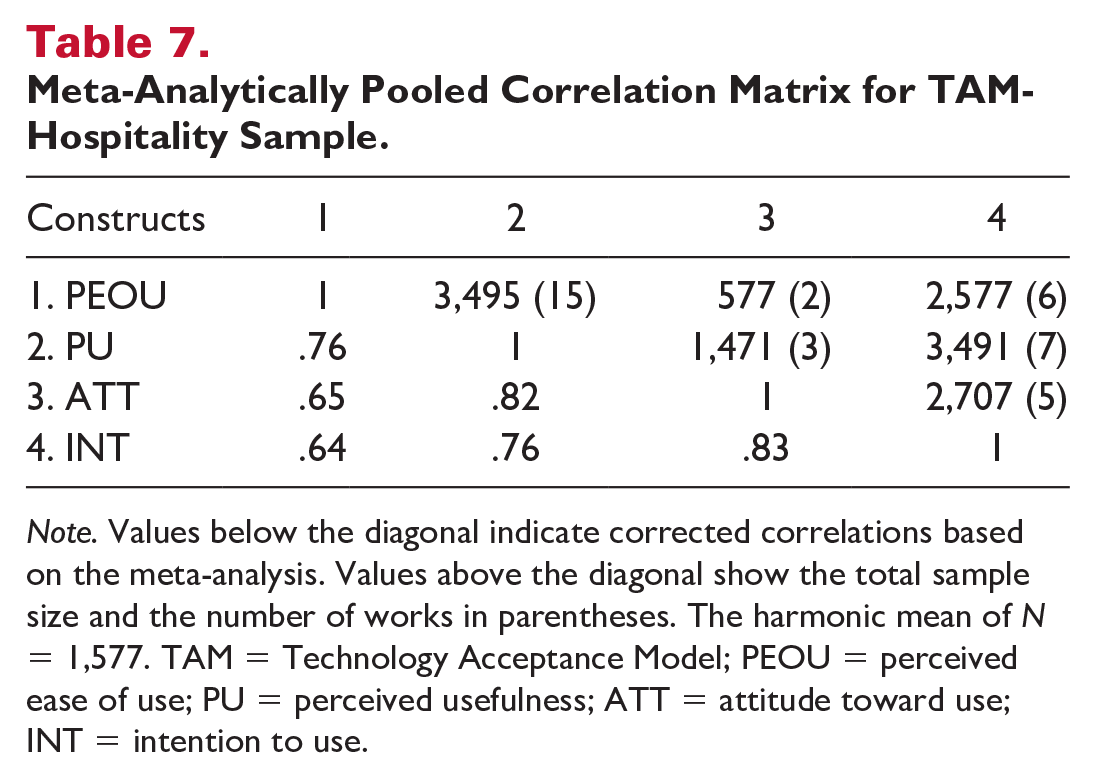
Note. Values below the diagonal indicate corrected correlations based on the meta-analysis. Values above the diagonal show the total sample size and the number of works in parentheses. The harmonic mean of N = 1,577. TAM = Technology Acceptance Model; PEOU = perceived ease of use; PU = perceived usefulness; ATT = attitude toward use; INT = intention to use.
Meta-Analytically Pooled Correlation Matrix for TAM-Tourism Sample.
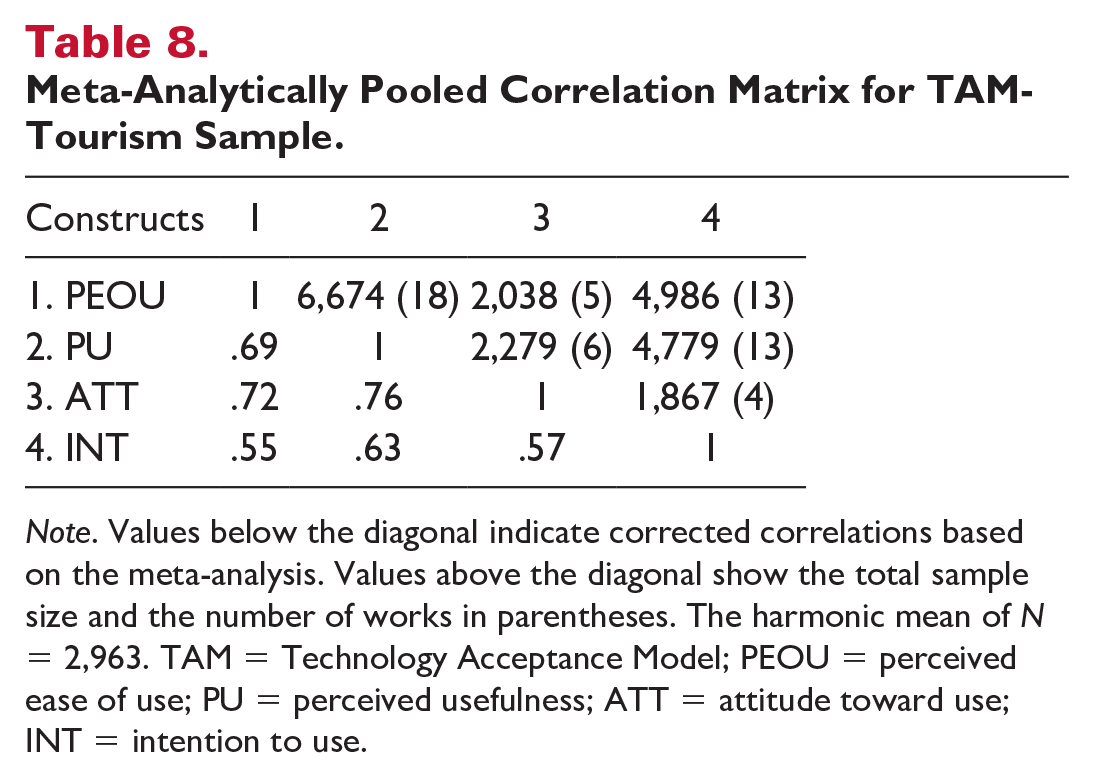
Note. Values below the diagonal indicate corrected correlations based on the meta-analysis. Values above the diagonal show the total sample size and the number of works in parentheses. The harmonic mean of N = 2,963. TAM = Technology Acceptance Model; PEOU = perceived ease of use; PU = perceived usefulness; ATT = attitude toward use; INT = intention to use.
All the estimated TAM paths achieved statistical significance in both samples, providing support for the psychometric results. The explained variance percentages of attitude toward use and intention to use are exhibited in Figure 3. The results from subgroup MASEM also supported those of the Z-test, that is, the connection between attitude toward use and intention to use was stronger in the hospitality context (β = 0.83, p < .001) than in the tourism context significantly (β = 0.57, p < .001).
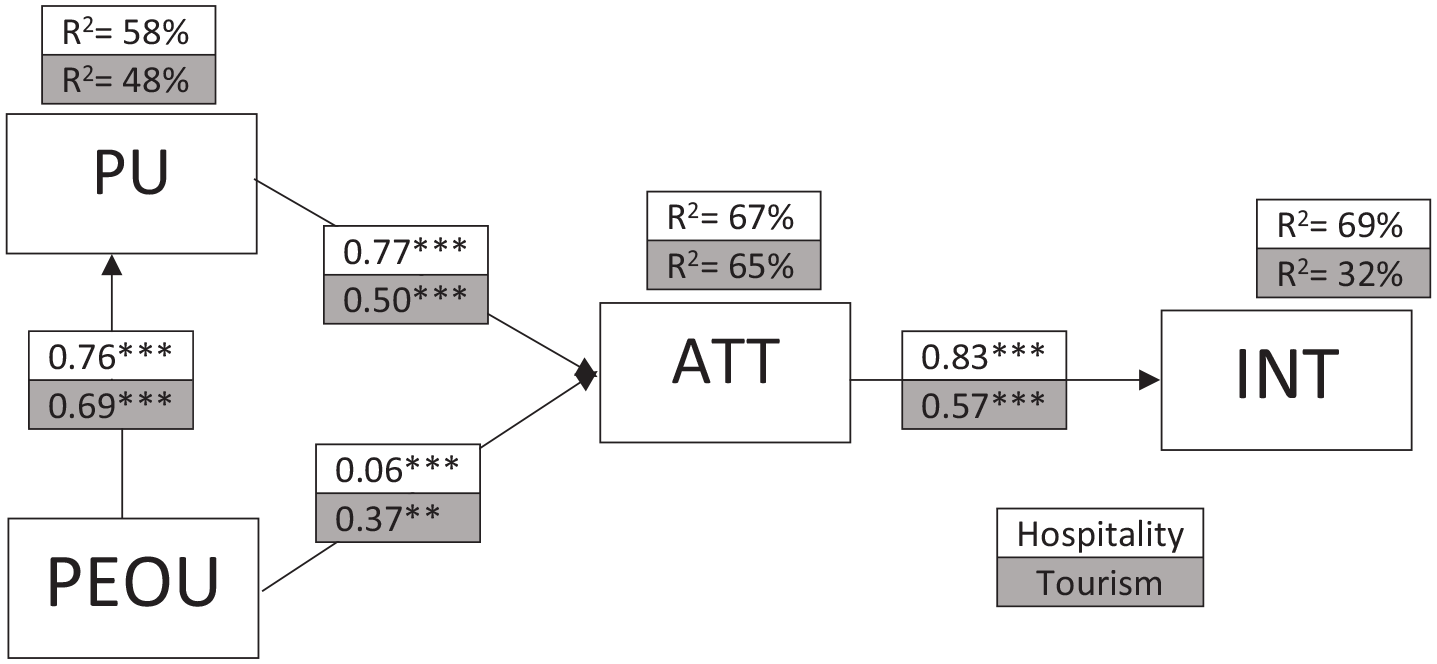
MASEM Analysis With Hospitality and Tourism Samples.
Discussion
While TAM has been extensively used as a theoretical framework to investigate hospitality and tourism consumers’ intention to use mobile technologies, no previous meta-analysis has been undertaken to synthesize the previous results in using TAM on consumers’ intention to adopt mobile technologies. Considering the research gap, the study conducted MASEM to investigate the reliability of TAM in predicting hospitality and tourism consumers’ intentions to adopt mobile technologies; the study also explored the impact of cultural and contextual differences on mobile technology use intention based on TAM. In this way, this research advances the theoretical and empirical understanding of TAM’s role in predicting attitudes and intentions toward mobile technology use in the hospitality and tourism literature. Thirty-three individual research (N = 13,635) were utilized in the meta-analytic analysis.
Research Implications and Future Research
This research offers the first meta-analytic evaluation of TAM to explain hospitality and tourism consumers’ intentions to adopt mobile technologies, which contributes to knowledge in several ways. It can be seen that most of the individual works (around 70%) have been published in the past 6 years, revealing that the attention to the use of mobile technologies is spreading along with the research interest to fully understand the psychological process behind their intention to use mobile devices. The utilization of SEM analysis to meta-analyze the relationship within the TAM constructs provides hospitality and tourism scholars with a reliable method to evaluate the validity of this theoretical model in predicting the adoption of mobile technologies among hospitality and tourism customers.
Unlike a traditional review work, the present meta-analytic work also corrected latent bias (e.g., sampling bias, measurement errors) in the existing studies, producing a more accurate and generalizable effect size for TAM relations. The current work thus can be an important reference for future research to further apply, modify, or extend the TAM theory. In addition, due to its ability to generate statistically robust findings and test theories, meta-analysis, particularly MASEM, as a relatively new methodological approach in the field of social science is increasingly attracting hospitality researchers (Ustunel et al., 2021); from this perspective, our work can serve as a methodological example. Consistent with the original TAM model, the findings of the present review capture the significant influence of customers’ perceptions (PEOU, PU) and attitudes on their intention to adopt mobile technologies. This research attests to the TAM’s generalizability in examining how customers embrace technology in the hospitality and tourism contexts.
Although most prior works supported the original positions regarding causal relationships within TAM, some contradictions and inconsistences still existed in them, particularly with regard to the influence of PEOU. The role of PEOU has been understated by several studies (Lee et al., 2013; Zhu & Morosan, 2014) in which the pair-wise relationship of PEOU-ATT was either very weak or not significant. According to Wang and Goh (2017), with time, as users become more familiar with technology, the influence of PEOU could be overshadowed by other variables. Indeed, Venkatesh (2000) observed that the impact of PEOU can differ based on an individual’s technological usage experience. Our meta-analytic results also demonstrated that PU had a more profound impact on attitude and intention to use mobile technologies than PEOU. While PEOU might not have a direct impact on intention to use, both the psychological meta-analysis and MASEM analysis in this research detected the significant influence of PEOU on attitude and PU. This is in line with Davis (1989, p. 334) indicating that “ease of use may be an antecedent to usefulness rather than a parallel direct determinant of usage” because “the easier a technology is to use, the more useful it can be” (Venkatesh, 2000, p. 343). The findings provide new theoretical perspectives on how TAM can be employed to elucidate the process of hospitality and tourism consumer adoption of mobile technologies. Therefore, it is strongly recommended that the significance of PEOU not be disregarded in future research.
The review also revealed that considering frequency, the link between attitude and intention was less investigated compared with the linkages of intention with PEOU and PU. Previous review work (e.g., Wu et al., 2011) also indicated that the exclusion of the attitude from the TAM model had been a norm. Such findings raise the question of whether the exclusion of attitude helps us better predict the acceptance of mobile technology by customers. However, the MASEM analysis in this study confirmed that the original TAM model with attitude as the outcome of PEOU and PU explained more variance in intention to use compared with the model without attitude. In addition, the present meta-analytic findings show that ATT had a stronger influence on customers’ intention to use mobile technologies than PE and PEOU. The findings provide robust support for the original notion of TAM that attitude that represents the level of affection of customers for technology is more central to explaining their technology acceptance, and we suggest that the role of attitude in TAM should not be neglected in future research.
It is also significant to highlight that a review of the included research demonstrates that research on this topic tends to measure intention to adopt mobile technologies as a powerful predictor of actual usage behavior. For this reason, the present review was unable to involve the actual usage construct in the meta-analysis as only very few studies (e.g., Gupta & Dogra, 2017) examined the association between intention and actual usage. While intention has commonly been considered as a proxy to predict technology adoption, Rhodes and Dickau (2012) found that a medium-sized variation in intention only caused a small-sized variation in actual behavior. This could be the result of people’s statements and actions not always matching up (Miller, 2003). When employing TAM to investigate the adoption of technology among customers in the hospitality and tourism industry, academics should exercise caution when utilizing intention to predict actual behavior.
This is an earlier meta-analysis research that examines the moderators of culture and research context within TAM constructs among hospitality and tourism consumers’ intentions to use mobile technology. The findings thus contribute an additional explanation for the inconsistent results in TAM relationships observed across various cultural and research contexts. This study found that, in contrast to Western culture, the link between PEOU and ATT displayed a more prominent impact size in Eastern culture. One possible reason is that consumers from diverse cultural backgrounds have different mindsets when assessing tasks for subsequent behavior (Trompenaars & Hampden-Turner, 2011). In line with cultural dimensional theory, people in Eastern culture tend to be prevention-oriented, leading them to avoid or minimize potential problems or risks. On the other hand, Westerners prioritize personal achievement due to their promotion oriented. Eastern consumers are thus more likely to prioritize the ease of use or difficulty in using mobile technology to meet their needs. The results thus provide additional support for cultural dimensional theory by acknowledging how culture moderates the adoption of mobile technology among hospitality and tourism consumers within the TAM components.
The research context has also been identified as a moderator influencing the relationship between ATT and INT. According to the results from the subgroup MASEM and Z-test, this relationship is stronger in the hospitality context as compared with the tourism context. Considering the tangible nature of the hospitality industry, consumers may feel a stronger willingness to adopt mobile technology (Ladeira et al., 2016). As observed in the study by Wakefield and Blodgett (1999), the greater the tangibility of the service or setting, the more pronounced the emotions experienced by consumers, subsequently influencing their behaviors. Therefore, the current study expands on existing literature and TAM by emphasizing the significance of culture and research context as potential moderators for understanding hospitality and tourism consumers’ technology adoption.
Practical Implications
This research offers some practical implications for hospitality and tourism marketing and management professionals who wish to develop more attractive mobile technology. First, considering that customer attitude was identified as the most important predictor of intention to use mobile technology, special attention should be given to creating positive consumer attitudes toward the use of mobile technologies, such as creating an attractive design for mobile technologies and providing subsidies for consumers who use these technologies. Second, given the significant role of consumer attitude in shaping mobile technology use attention, hospitality and tourism practitioners should have a deeper understanding of this attitude. In addition, it is significant to highlight that PU significantly influences both one’s attitude and the INT. Practitioners need to learn more about the advantages that mobile technology may provide for customers both prior to, during, and after their vacation (Rivera et al., 2015). Regarding PEOU, hospitality and tourism marketing and management professionals should pay attention to how to make their mobile technologies user-friendly to save consumers’ time and effort in learning how to use them.
The results of the meta-analysis demonstrated that cultural differences moderate the pair-wise relationships of PEOU-PU and PEOU-ATT. Therefore, hospitality and tourism practitioners should develop different marketing strategies for customers from different cultural backgrounds. For instance, hospitality and tourism practitioners could place more focus on highlighting the ease of use for Eastern consumers, while a marketing strategy for Western consumers might center on promoting the usefulness of mobile technology. Finally, the findings relating to the moderating role of research contexts indicate that marketing strategies associated with different industrial sectors should be diverse. For example, in the case of hospitality consumers, the focal point of marketing strategies could be built around the enhancement of consumers’ perceived usefulness of mobile technology use and attitudes toward mobile technology. One possible strategy for the hospitality industry could involve emphasizing how the utilization of mobile technology can greatly improve the customer experience.
Limitations
Although this study has provided fascinating insights, there are also several limitations. First, theoretically, publication bias is somewhat inevitable in meta-analytic research. Such a problem (i.e., file drawer problem) may occur because of the omission of works that are difficult to detect or because research with insignificant results is less likely to be published. In other words, the inclusion of more unpublished works may have generated a more accurate true effect size. In practice, however, meta-analytic scholars have emphasized that this issue normally may not produce increasing/descending biases in estimating effect size. Besides, the research considered in this meta-analysis was only written in English. To improve the results’ generalizability, research written in other languages could be considered for evaluation in the future. Second, as the majority of the studies used self-reported data and were cross-sectional, there may be a problem with common method bias (Podsakoff et al., 2003). Third, only the original notion of TAM (Davis, 1985, 1989) was the subject of this investigation. To improve the predictability of TAM, an increasing number of research works have attempted to expand TAM by incorporating more external factors (Huang et al., 2019; Mathew & Soliman, 2021). Future research may wish to consider the variables regularly integrated into TAM and examine how each of these either improves or impairs the effectiveness of TAM in predicting consumers’ intentions to use mobile technologies. Moreover, this research mainly concentrated on the moderating effects of culture and research contexts. Further investigation might look at more possible moderators (e.g., gender and sample size).
Finally, as most included papers were published prior to the COVID-19 outbreak, the influence of the COVID-19 pandemic on the TAM variables has not been fully captured in this analysis. The COVID-19 pandemic was found to have changed the attitudes toward technology use (Cruz-Cárdenas et al., 2021). Therefore, many variables in the TAM are assumed to be influenced by the COVID-19 pandemic. For instance, the PU and PEOU of mobile technologies by hospitality and tourism consumers may be influenced by the measures taken to control the pandemic, including social distancing and lockdown. Furthermore, it is likely that hospitality and tourism consumers’ intentions to use mobile technologies are impacted by their emotions, such as perceived threat and fear of being infected (Zheng et al., 2022). Therefore, comparing the variations in TAM between the pre- and post-COVID-19 eras using the COVID-19 epidemic as a moderator will be an intriguing avenue for future research.
Footnotes
Appendix
Sample Description.
| Authors | Year | Journal | Sample Size | Topic | Region | Culture | Research Context |
|---|---|---|---|---|---|---|---|
| Bouwman (Study 1) | 2011 | ITT | 429 | Intention to use apps (travel apps) | Netherland | Western | Tourism |
| Bouwman (Study 2) | 2011 | ITT | 524 | Intention to use apps (travel apps) | New Zealand | Western | Tourism |
| Bouwman (Study 3) | 2011 | ITT | 493 | Intention to use apps (travel apps) | Korea | Eastern | Tourism |
| Kwon et al. | 2013 | JHTT | 235 | Intention to use apps (hospitality apps) | United States | Western | Hospitality |
| Im & Hancer | 2014 | JHTT | 210 | Intention to use apps (travel apps) | United States | Western | Tourism |
| Zhu & Morosan | 2014 | JHTT | 262 | Intention to adopt mobile technologies (in hotel) | United States | Western | Hospitality |
| No & Kim | 2014 | IJTR | 400 | Intention to use apps (travel apps) | Korea | Eastern | Tourism |
| Morosan | 2014 | IJCHM | 556 | Mobile purchase intention (Ancillary Services) | United States | Western | Tourism |
| Rivera et al. | 2015 | JHTT | 914 | Intention to use apps (timeshare apps) | United States | Western | Hospitality |
| M. J. Kim & Preis | 2015 | JTTM | 241 | Intention to adopt mobile technologies (for tourism) | Korea | Eastern | Tourism |
| Okumus et al. | 2015 | JHMM | 395 | Intention to use apps (F&B ordering apps) | United States | Western | Hospitality |
| J. Kim | 2016 | IJCHM | 751 | Intention to use apps (hotel tablet apps) | United States | Western | Hospitality |
| M. J. Kim et al. (Study 1) | 2016 | IJCHM | 113 | Intention to adopt mobile technologies (for tourism) | Korea | Eastern | Tourism |
| M. J. Kim et al. (Study 2) | 2016 | IJCHM | 106 | Intention to adopt mobile technologies (for tourism) | Korea | Eastern | Tourism |
| M. J. Kim et al. (Study 3) | 2016 | IJCHM | 242 | Intention to adopt mobile technologies (for tourism) | Korea | Eastern | Tourism |
| Lee et al. | 2017 | TMP | 158 | Intention to use apps (virtual souvenirs) | China | Eastern | Tourism |
| Koch & Tritscher | 2017 | JHTT | 194 | Intention to use apps (social seating apps) | Germany | Western | Tourism |
| Im & Hancer | 2017 | JHMM | 202 | Intention to use apps (travel apps) | United States | Western | Tourism |
| Gupta & Dogra | 2017 | THM | 284 | Intention to use apps (mapping apps) | India | Eastern | Tourism |
| J. Kim et al. | 2017 | IJHTA | 1034 | Intention to use apps (hotel tablet apps) | United States | Western | Hospitality |
| Gupta et al. | 2018 | JHTT | 343 | Intention to use apps (travel apps) | India | Eastern | Tourism |
| Amaro at al. | 2018 | CIT | 202 | Intention to use apps (Airbnb) | Unspecified | N/A | Hospitality |
| Gao et al. | 2019 | JHTT | 298 | Intention to use apps (bike sharing apps) | China | Eastern | Tourism |
| Huang et al. | 2019 | JHMM | 490 | Intention to use apps (hotel apps) | China | Eastern | Hospitality |
| T. Zhang et al. | 2018 | JHMM | 683 | Intention to adopt mobile technologies (in hotel) | United States | Western | Hospitality |
| Falcao et al. | 2019 | ITT | 912 | Mobile purchase intention (tourism products) | Brazil | Western | Tourism |
| Falcao et al. | 2019 | JHTI | 1014 | Mobile purchase intention (tourism products) | Brazil | Western | Tourism |
| Song et al. | 2021 | IJHM | 295 | Intention to use apps (F&B delivery apps) | Korea | Eastern | Hospitality |
| Mohamad et al. | 2021 | TMS | 384 | Mobile purchase intention (hotel booking) | Malaysia | Eastern | Hospitality |
| Hua et al. | 2021 | JHTT | 448 | Intention to use apps (travel apps) | Unspecified | N/A | Tourism |
| Zhou et al. | 2021 | TASM | 278 | Intention to use apps (travel apps) | China | Eastern | Tourism |
| Berakon et al. | 2023 | JIM | 205 | Intention to use apps (travel apps) | Indonesia | Eastern | Tourism |
| Albayrak et al. | 2023 | JVM | 340 | Intention to use apps (travel apps) | Turkey | Mid-Eastern | Tourism |
Note. ITT = Information Technology & Tourism; JHTT = Journal of Hospitality and Tourism Technology; IJTR = International Journal of Tourism Research; IJCHM = International Journal of Contemporary Hospitality Management; JTTM = Journal of Travel & Tourism Marketing; JHMM = Journal of Hospitality Marketing & Management; TMP = Tourism Management Perspectives; THM = Tourism and Hospitality Management; IJHTA = International Journal of Hospitality & Tourism Administration; CIT = Current Issues in Tourism; JHTI = Journal of Hospitality and Tourism Insights; IJHM = International Journal of Hospitality Management; TMS = Tourism & Management Studies; JIM = Journal of Islamic Marketing; TASM = Technology Analysis and Strategic Management; JVM = Journal of Vacation Marketing.
Declaration of Conflicting Interests
The author(s) declared no potential conflicts of interest with respect to the research, authorship, or publication of this article.
Funding
The author(s) disclosed receipt of the following financial support for the research, authorship, and/or publication of this article: This research was supported by Hainan Provincial Natural Science Foundation of China (623RC444; 721QN223).
