



Abstract
Relative to sales, the average operating lease commitments of hospitality firms are 4 times larger than those of other publicly traded firms. In response to the recently enacted accounting standards update No. 2016-02 (ASU 2016-02) that requires lessees to recognize operating leases on their balance sheet, hospitality firms decreased their use of operating leases, switching to shorter-term off-balance sheet leases. We find that this change did not have negative consequences on firm performance, shareholders, or employees. The only significant effect we do find is an improvement in credit ratings for firms that reduced operating leases in response to the new standard. Our findings are inconsistent with the concerns some hospitality managers and academics expressed prior to the introduction of the standard.
Introduction
Accounting standards update (ASU) No. 2016-02 requires that firms recognize operating leases with a term greater than 12 months on their balance sheet for annual reporting periods beginning after December 15, 2018. We investigate how this new accounting rule affects hospitality firms. In particular, we examine whether hospitality firms altered their use of operating leases in response to the new standard and assess the subsequent effect on firm performance, shareholders, and employees.
Under the prior accounting rule (SFAS 13 issued in 1976), only capital leases were recognized on the balance sheet. Operating leases were not: Firms were only required to report information on future operating lease commitments in a footnote. Operating leases thus constituted a form of off-balance sheet financing, potentially creating an incentive for firms to structure their leases as operating (rather than financing) leases to avoid balance sheet reporting. Furthermore, the prior standard included so-called “bright lines” for the classification of leases, which managers could easily circumvent. For example, under the prior accounting rule, a lease was considered a capital lease if the present value of future lease commitments exceeded 90% of the fair value of the asset. If the present value was only slightly smaller however, firms could treat a lease as an operating lease and thus avoid balance sheet reporting. 1
To provide greater transparency to information users, the Securities and Exchange Commission (SEC) issued a report in 2005 in which it recommended that the Financial Accounting Standards Board (FASB) revisit accounting standards to require recognition of operating leases on balance sheets. The new standard, issued in 2016, is the result of much debate among regulators and corporate managers.
While the intent of the SEC and FASB was to improve both the quality and the comparability of financial reporting, and to discourage lease transactions primarily motivated by reporting considerations, in comment letters to FASB, most managers expressed concerns about the new standard (Comiran & Graham, 2016; FASB, 2013; SEC, 2005). 2 Consequently, Chang & Adams Consulting was commissioned to study the potential effects of the rule change prior to its enactment. According to their findings, the implementation of the new lease standard would result in a decrease in real estate value and could lead to the loss of 190,000 jobs across the real estate and related industries.
The concerns about the potential negative effect of the new accounting standard were especially acute in the hospitality industry for several reasons. Most directly, as Chatfield et al. (2017) report, hospitality firms make more extensive use of operating leases relative to other firms, which we confirm in this article.
The main effects of the new leasing standard are (a) that it increases leverage ratios because lease liabilities that were previously unrecognized are now recognized on balance sheets, and (b) that it decreases profitability ratios such as return on assets (ROA) because lease assets are now recognized on the balance sheet, which increases total assets (ROA is the ratio of net income to total assets). Both effects are expected to be severe in the hospitality industry because the hospitality industry is especially reliant on leases.
In fact, Chatfield et al. (2017) warned that “the expected widespread unfavorable impact” of the new rule could “affect a hospitality company’s borrowing rates and debt covenants.” de Jong (2017) anticipated that “the accounting regulation for leases will have a negative impact on the performance ratios of hotel chains.” Kostolansky et al. (2012) investigated the potential effect of the new lease reporting rule on 47 eating and drinking places and predicted large increases in total assets, total liabilities, and leverage ratios. They also predicted that these establishments would experience a 29% decline in their ROA.
There is also anecdotal evidence that the new lease accounting rule would have a significant effect on hospitality firms. For example, in a report on the new lease accounting standard, Deloitte (2018) singled out the hospitality industry as one of three sectors in which the standard would have a large effect, writing that Companies in the hospitality industry will likely be greatly affected by the new standard. Large hospitality companies typically have thousands of operating leases—or service contracts with embedded lease components that need to be treated as operating leases—all of which now need to be aggregated and analyzed, then accounted for on the balance sheet. In hotels, the challenge is amplified by the industry’s unique and complex structure . . .
Considering the significant concerns about the potential effects of the new lease recognition rule on hospitality firms and their stakeholders, we examine whether hospitality firms reduced their reliance on operating leases in response to the new rule, and whether there were any (potentially negative) effects.
Our article builds on the related work of Ma and Thomas (2023) in accounting. 3 They investigate the effect of the new lease standard on firms’ utilization of operating leases and study whether firms’ response to the new standard had adverse effects on performance. The authors find that firms reduced their use of operating leases after ASU 2016-02. Neither a decrease in firm performance nor negative consequences to the firms’ shareholders and other stakeholders accompanied this change. The main feature that differentiates our paper from Ma and Thomas (2023) is that we focus specifically on hospitality firms, whereas they consider all U.S. publicly traded firms without distinguishing across industries. The analysis of the effect of ASU 2016-02 on hospitality firms is especially important, however, given the significant concerns that hospitality practitioners and academics alike have raised.
Our main results are easily summarized. First, we find that the hospitality industry is especially reliant on leases. Between 2011 and 2021, total operating lease commitments represented 54.6% of sales for publicly traded hospitality firms (74.7% for restaurants and 21% for hotels and casinos), with annual new operating lease commitments accounting for 9.2% of sales on average (8.6% for restaurants and 10.1% for hotels and casinos). In contrast, over the 2011 to 2019 period in their study, Ma and Thomas (2023) report that operating lease commitments (new operating lease commitments) amounted to 12.5% (2.5%) of sales for all publicly traded U.S. firms. Leases, therefore, play a particularly important role in the hospitality industry. Koh and Jang (2009) provide a detailed analysis of what drives hotel firms to use operating leases not only for equipment but also as a sale and leaseback financing mechanism. This sale–leaseback financing mechanism allows hotel operators to “lighten” on-balance sheet assets (e.g., Li & Singal, 2019; Page, 2007). Prior evidence is mixed, however, regarding whether the asset-light business model improves performance and increases efficiencies of investment. Seo and Soh (2019) and Seo et al. (2021) find evidence that supports the benefits of an asset-light strategy. In contrast, Märklin and Bianchi (2022) show that an asset-light business model does not significantly affect hospitality companies’ return risk or performance.
Second, we examine the effect of the new lease accounting rule on firms in the hospitality industry. Our findings indicate that hospitality firms more reliant on operating leases prior to the issuance of the new standard (2011–2014) sharply reduced their new operating lease commitments subsequent to the implementation of the new accounting standard (i.e., between 2016 and 2021). To further test whether on-balance sheet recognition drove this change in leasing practice, we examine the term structure of leases. According to ASU 2016-02, firms are not obligated to recognize on their balance sheets operating leases that are due within a year. As a result, firms that use operating leases primarily to avoid balance sheet recognition are incentivized to enter more short-term leases after the enactment of the new standard. We find that hospitality firms on average switch toward shorter-term leases subsequent to the adoption of the new rule.
Third, we examine whether the reduction in operating leases as a result of the new standard had an effect on hospitality firms’ performance, shareholders, or employees. There were conflicting predictions about what effect, if any, the new standard would have. As we previously discussed, managers expressed concerns that ASU 2016-02 would have unfavorable effects. However, one could also expect no effect, or even a positive effect, for example, if prior to the new rule managers were using costly operating leases as a source of off-balance sheet financing mainly for reporting reasons. We do not find any evidence of negative consequences on firm performance, shareholders, or employees for hospitality firms that decreased their reliance on operating leases after the issuance of ASU 2016-02. In fact, the only significant effect we find is an improvement in credit ratings for hospitality firms that reduced operating leases. Given that borrowing rates are inversely related to credit ratings, more favorable credit ratings lower borrowing rates.
Data and Empirical Methodology
We describe our data on listed hospitality stocks and explain our difference-in-differences approach.
Hospitality Stocks: Sample Composition
Our sample comprises firm-year observations of listed U.S. hospitality companies from 2011 to 2021 (excluding 2015), which spans 10 fiscal years surrounding the issuance of ASU 2016-02 in February 2016. As the issuance of ASU 2016-02 occurred close to the year-end dates for many firms that fiscal year, we exclude 2015 from our sample as in Ma and Thomas (2023). This approach yields four fiscal years prior to ASU 2016-02 (2011–2014) and six fiscal years after (2016–2021). The new standard is applicable for fiscal years that start after December 15, 2018. Consequently, the postperiod encompasses 3 years after the actual implementation (for most firms). We obtain all financial data from Compustat. To evaluate whether the preperiod is different from the postperiod, we require firms to have data for at least 1 year prior to, and 1 year after, the issuance of ASU 2016-02, in addition to having at least US$100 million in sales revenue.
We identify hospitality firms based on their Standard Industrial Classification (SIC) code. We further separate our hospitality sample into two subgroups—hotels and restaurants—using their SIC codes for some of our analysis. Restaurant firms have SIC codes 5810 and 5812 and hotels and casinos have codes 7011 and 7990. The hotel sample does not include hotel REITs; the Internal Revenue Code prohibits REITs from operating their own hospitality properties (see Gim & Jang, 2020). Nonetheless, as Canina and Gibson (2003) note, the hotel classification under SIC codes is more inclusive compared with the restaurant classification. The hotel classification comprises both ownership and management firms, in addition to gaming firms.
We do not separate hotel and casino firms in our main tests following Canina and Gibson (2003) and Weinbaum (2009). There are several reasons for this choice. First, we identify hospitality stocks based on the SIC hotel classification that includes gaming firms. Second, many gaming firms, such as Las Vegas Sands Corporation and Wynn Resorts, Limited, also operate hotels and resorts. Our data do not allow us to separate the hotel and gaming business operations of these firms. Third, using a broad definition of the hotel industry increases the statistical power of our tests, as the individual hotel and gaming subsectors comprise too few firms. Nonetheless, our main results hold separately for both hotels and casinos, as discussed subsequently.
Our final hospitality sample comprises 580 observations (72 distinct companies listed in the Appendix). The restaurants sample has 363 observations (45 unique firms) and the hotels and casinos sample has 217 observations (27 unique firms).
Difference-in-Differences Approach
The overall level of operating leases in the hospitality industry can vary over time for various reasons unrelated to accounting rules. For example, the use of operating leases could increase (decrease) during economic expansions (contractions). We, therefore, employ a statistical approach known as a difference-in-differences test to assess the potential effect of the new lease standard. Specifically, we classify firms into a treatment group and a control group based on the potential effect of operating lease recognition on them. We study the change in new operating lease commitments that treatment firms make in the post- versus preperiods relative to the change for control firms. We also separate the postimplementation period (2019–2021) in some of our analysis.
Following Ma and Thomas (2023), we categorize firms into treatment and control groups based on how much operating lease recognition would affect their balance sheets: Firms with a ratio of total operating lease commitments to lagged total assets in 2014 that is above (below) the median are assigned to the treatment (control) group. The rationale is that the level of a firm’s operating lease commitments relative to its lagged assets is directly related to the potential effect of the new lease standard on its balance sheet and leverage ratios. We expect ASU 2016-02 to have a greater effect on treatment firms relative to control firms. Our prediction is that treatment firms will reduce their operating lease commitments compared with control firms after ASU 2016-02.
Empirical Results: Firms’ Use of Operating Leases
We present our main empirical results on the effect ASU 2016-02 had on operating lease practices in the hospitality industry.
Descriptive Statistics
Descriptive statistics for the full hospitality sample are reported in Panel A of Table 1 for our sample period, 2011–2021. Panel B presents descriptive statistics for hotels and restaurants separately. The variable NewOpLease is new operating lease commitments scaled by lagged sales. As in Ma and Thomas (2023), this quantity is computed as operating lease commitments at the end of the year less operating lease commitments carried over from the prior year (firms are required to disclose operating lease commitments due in each of the next 5 years; amounts not due within the next year are carried over to the following year).
Descriptive Statistics
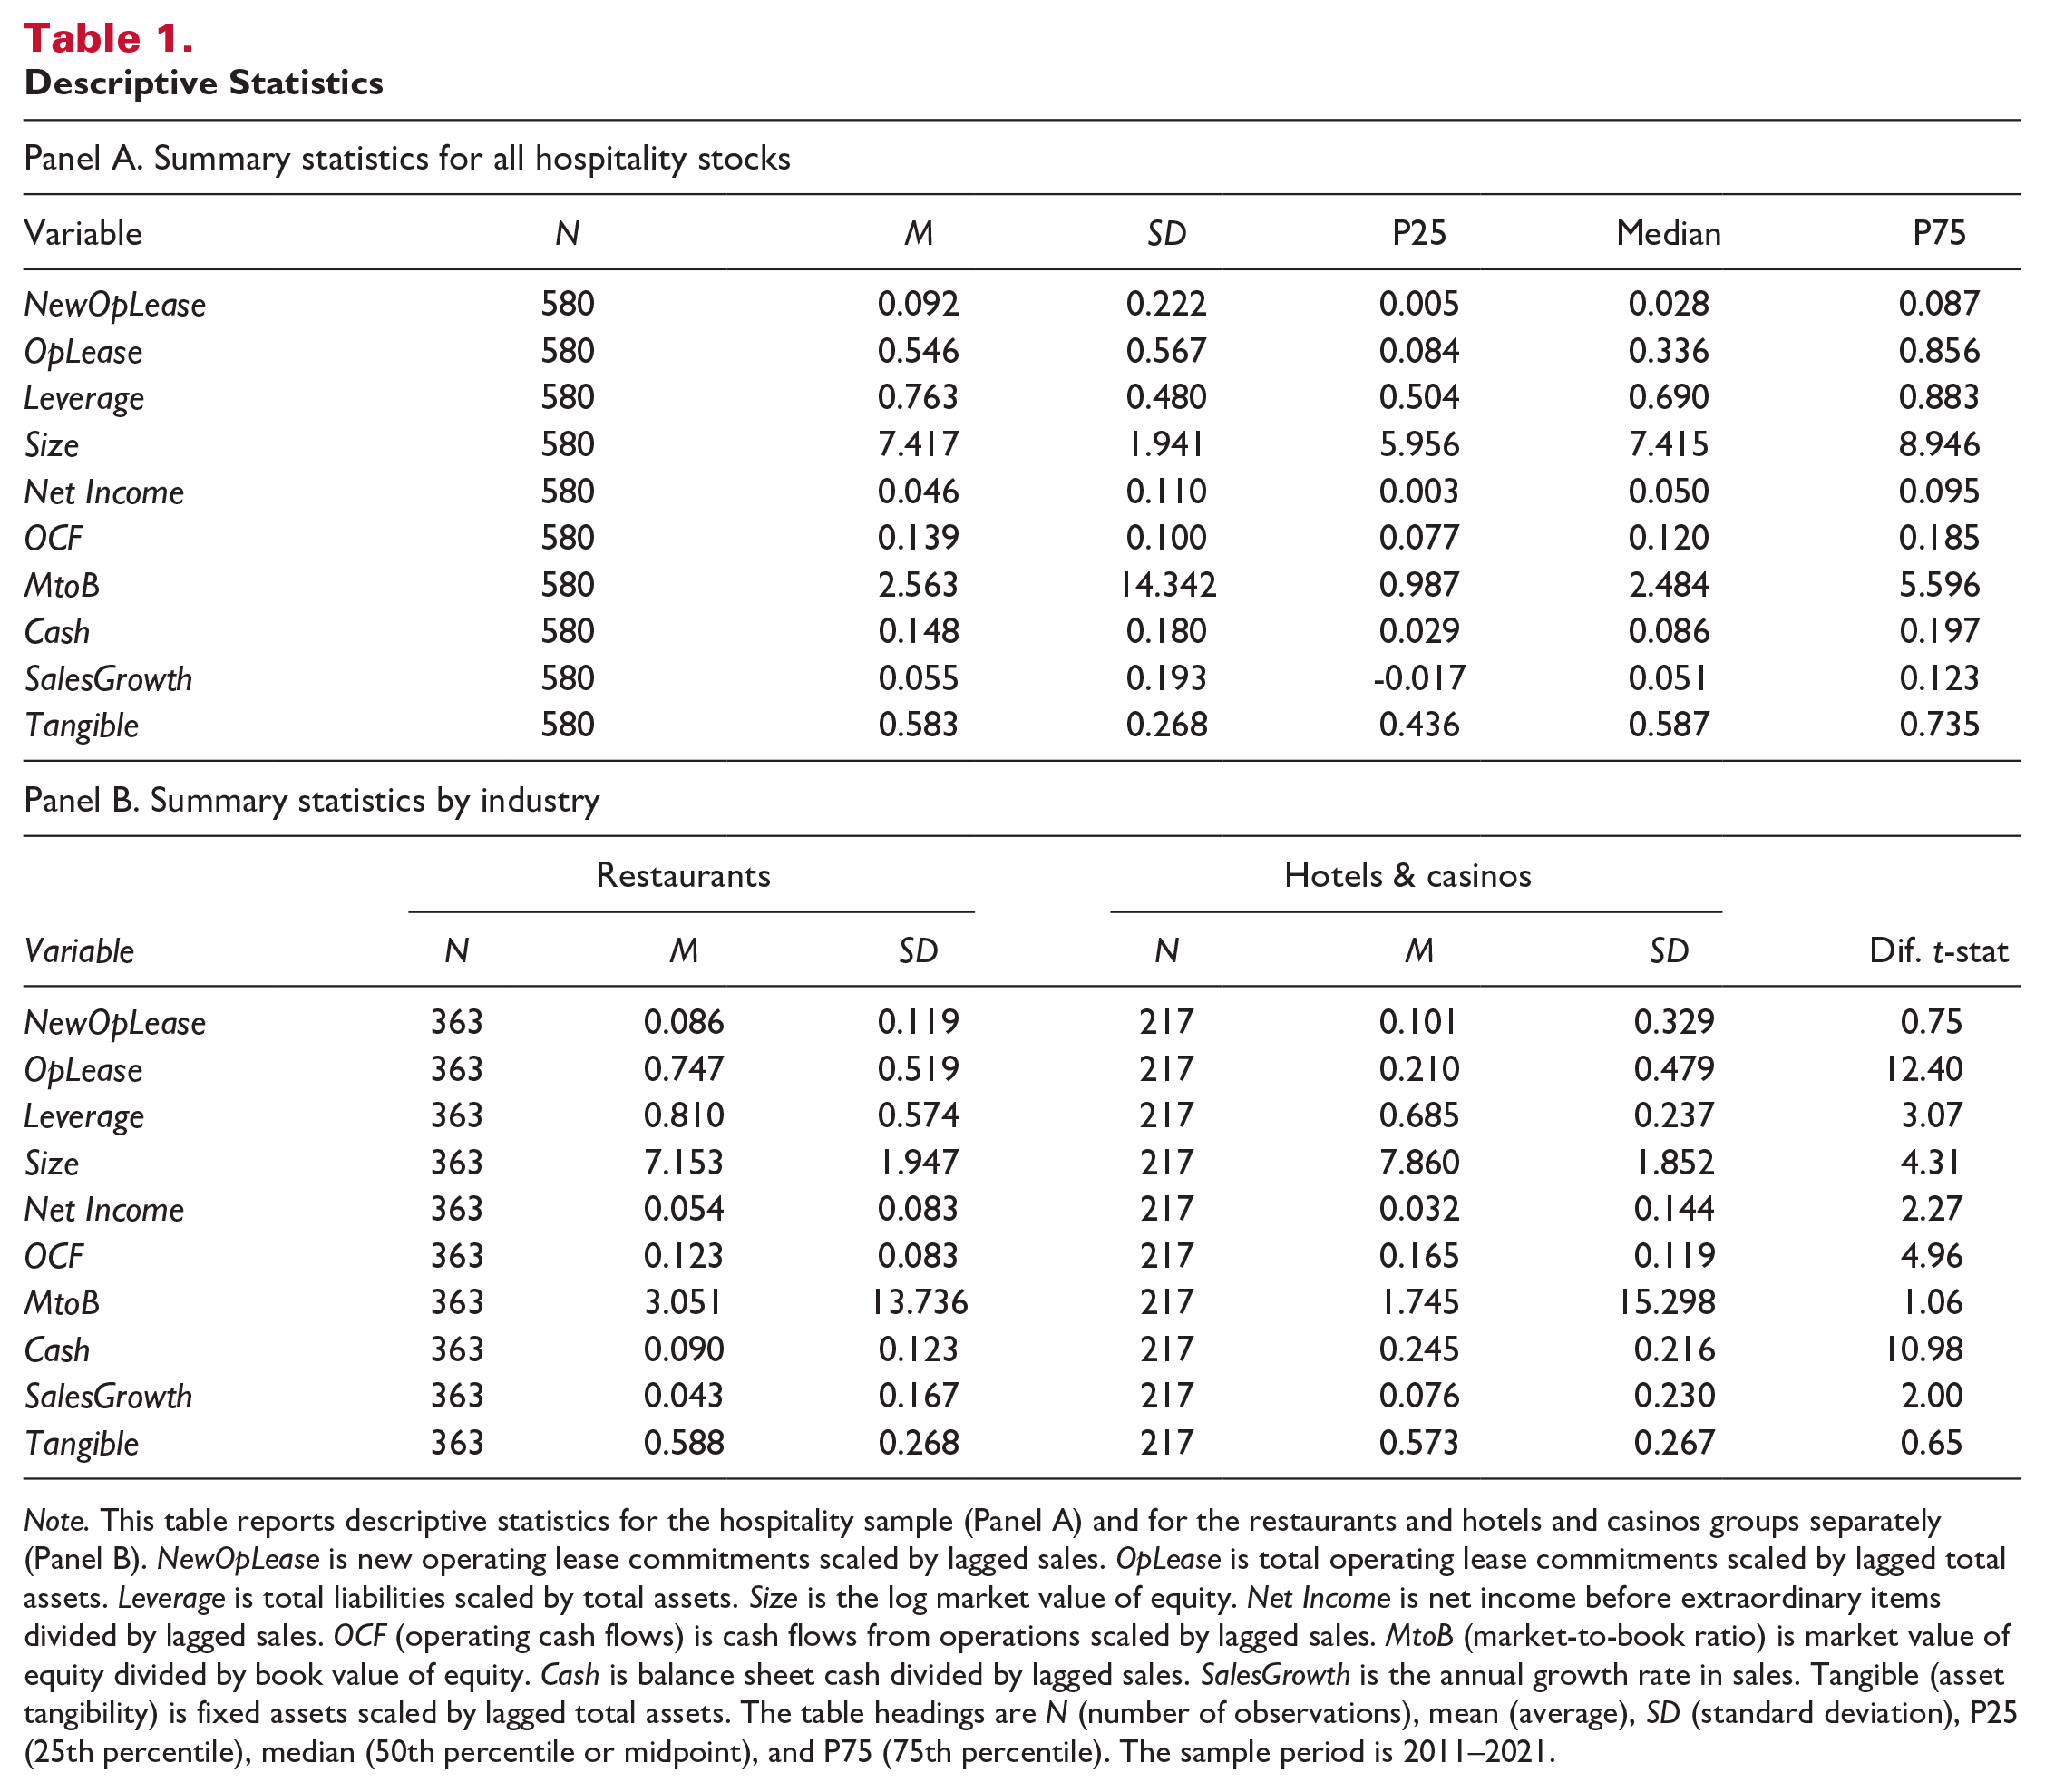
Note. This table reports descriptive statistics for the hospitality sample (Panel A) and for the restaurants and hotels and casinos groups separately (Panel B). NewOpLease is new operating lease commitments scaled by lagged sales. OpLease is total operating lease commitments scaled by lagged total assets. Leverage is total liabilities scaled by total assets. Size is the log market value of equity. Net Income is net income before extraordinary items divided by lagged sales. OCF (operating cash flows) is cash flows from operations scaled by lagged sales. MtoB (market-to-book ratio) is market value of equity divided by book value of equity. Cash is balance sheet cash divided by lagged sales. SalesGrowth is the annual growth rate in sales. Tangible (asset tangibility) is fixed assets scaled by lagged total assets. The table headings are N (number of observations), mean (average), SD (standard deviation), P25 (25th percentile), median (50th percentile or midpoint), and P75 (75th percentile). The sample period is 2011–2021.
The average value of NewOpLease in Panel A is 0.092 or 9.2%. In other words, new operating lease commitments on average account for 9.2% of sales for firms in the hospitality industry. Panel B shows that the corresponding figures are 8.6% for restaurants and 10.1% for hotels and casinos. Similarly, total operating lease commitments for hospitality firms amount to 54.6% of sales on average (74.7% for restaurants and 21% for hotels and casinos).
In stark contrast, Ma and Thomas (2023) find that, over the 2011 to 2019 period in their study, new operating lease commitments represent an average of 2.5% of sales. Total operating lease commitments comprise 12.5% of sales for publicly traded U.S. firms. That both figures are notably lower than the corresponding estimates for hospitality firms highlights the significant role that leases play in the hospitality industry. Our finding implies that the leverage ratios of hospitality firms increased significantly as a result of operating lease recognition. 4
The other descriptive statistics in Table 1 are consistent with what we expect. For example, the average hospitality firm in the sample has significant liquid assets, as the average cash holding (Cash) is 14.8% of sales. Mean net income before extraordinary items (Net Income) is 4.6% of sales for hospitality firms and the average of cash flows from operations (OCF) is 13.9% of sales in the industry.
Effect on New Operating Leases
Recall that we classify firms into a treatment group and a control group based on the potential effect of operating lease recognition: treatment (control) firms have above (below) median ratios of operating lease commitments to assets in 2014. Fiscal years 2011 to 2014 are the pre-ASU 2016-02 years, and years 2016 to 2021 are the post ASU 2016-02 years. We are interested in the change in new operating lease commitments made by treatment firms in the post- versus preperiods relative to the corresponding change for control firms.
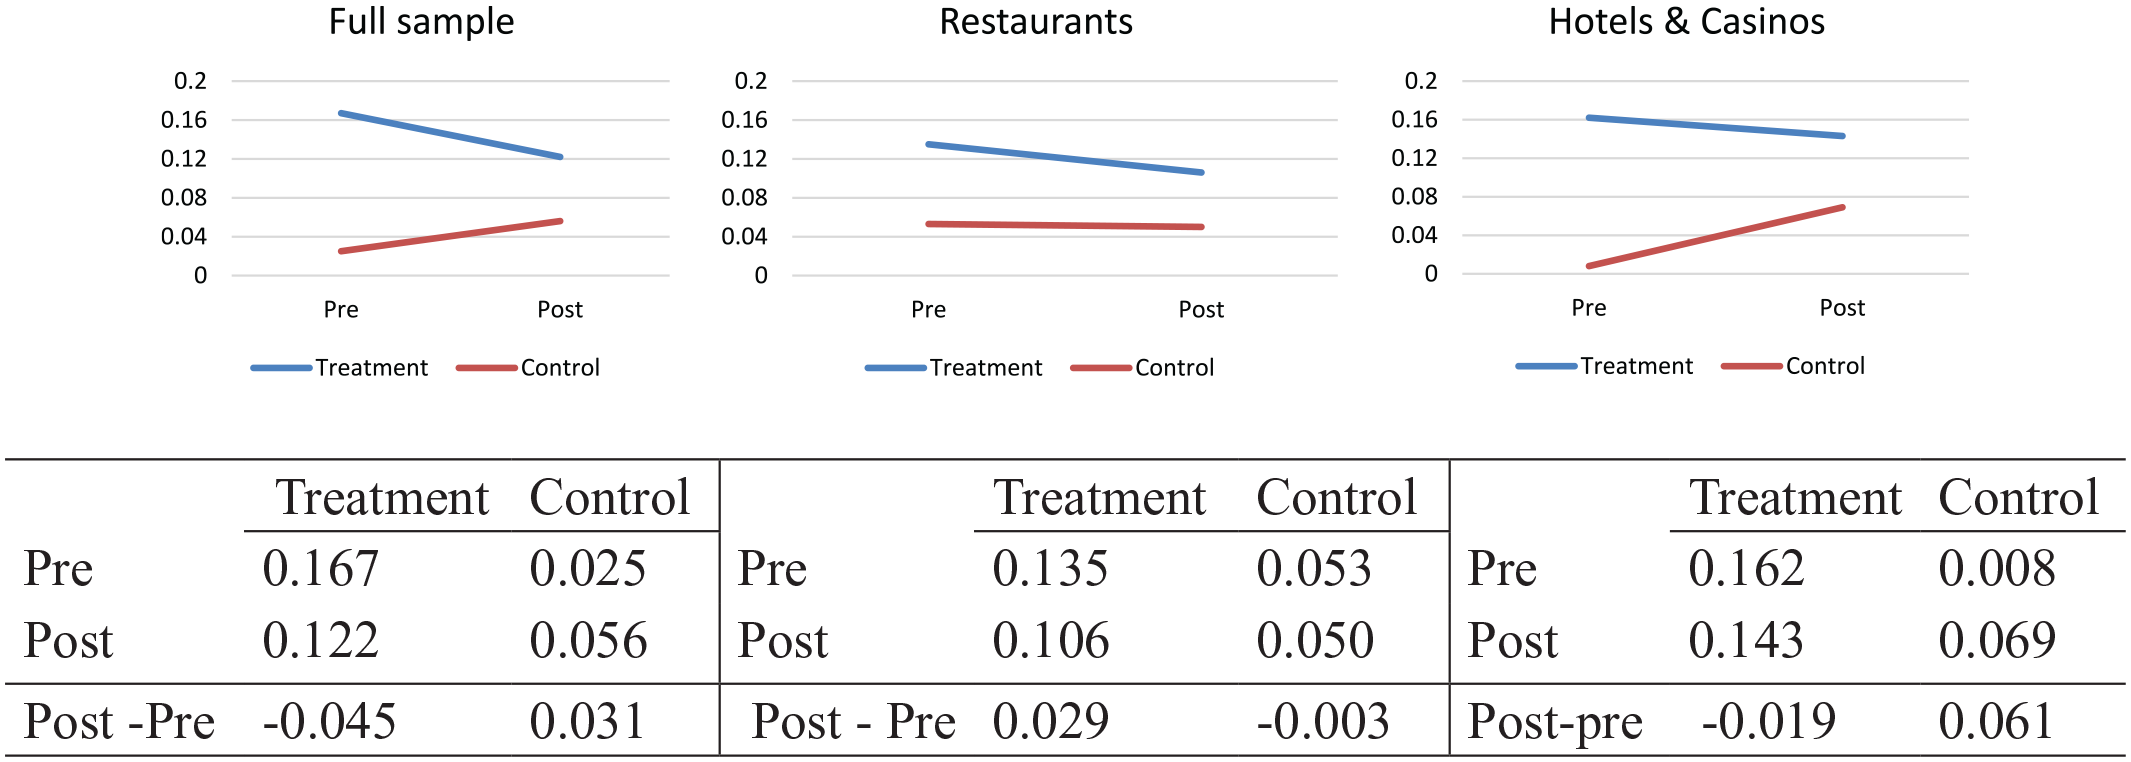
In Figure 1, we plot the average of the variable NewOpLease in the periods before and after the new standard. Consistent with our expectations, we find that treatment firms reduce their use of operating leases relative to control firms. This conclusion also holds when restaurants and hotels are examined separately. In the full sample of hospitality stocks, the change in the average value of NewOpLease is –0.045 in the treatment group and 0.031 in the control group. The difference between these two differences is 0.076 or 7.6%. In other words, relative to control firms, treatment firms reduce operating leases by 7.6 percentage points of sales.
To test whether this difference in differences is statistically significant, and to control for other variables that change over time across the treatment and control groups, we follow Ma and Thomas (2023) and estimate the following regression:
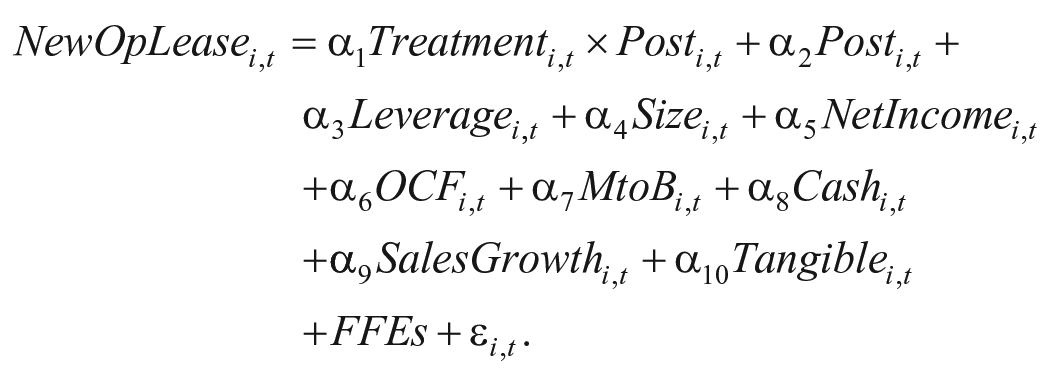
In the preceding regression, Treatment is an indicator variable that equals one for treatment firms and Post is an indicator variable equal to one for years 2016–2021 (the years after ASU 2016-02). Our main variable of interest is the interaction term Treatment × Post. The coefficient α1 on this interaction term provides the difference-in-differences test. It measures the difference between treatment and control firms in the change from the preperiod to the postperiod in operating lease commitments, controlling for all other variables in the regression, namely, the overall change in leases for the control group, leverage, size, net income, cash flows, sales growth, asset tangibility (calculated as fixed assets divided by lagged total assets), and firm fixed effects.
From our findings in Figure 1, as treatment firms reduce their operating lease commitments relative to control firms after ASU 2016-02, we expect to find a negative coefficient α1 on the interaction term Treatment × Post. The results, in Panel A of Table 2, confirm our expectation. In the first specification, the coefficient on the interaction Treatment × Post is –0.09 with a t-statistic of –2.86. In other words, controlling for firm fixed effects, relative to control firms, treatment firms reduce operating leases (as a percentage of sales) by 9 percentage points. This difference in differences is not only economically large, but also highly significant statistically. Specification II adds the other control variables to the regression; the main result remains nearly identical.
Difference-in-Differences Tests of New Operating Leases
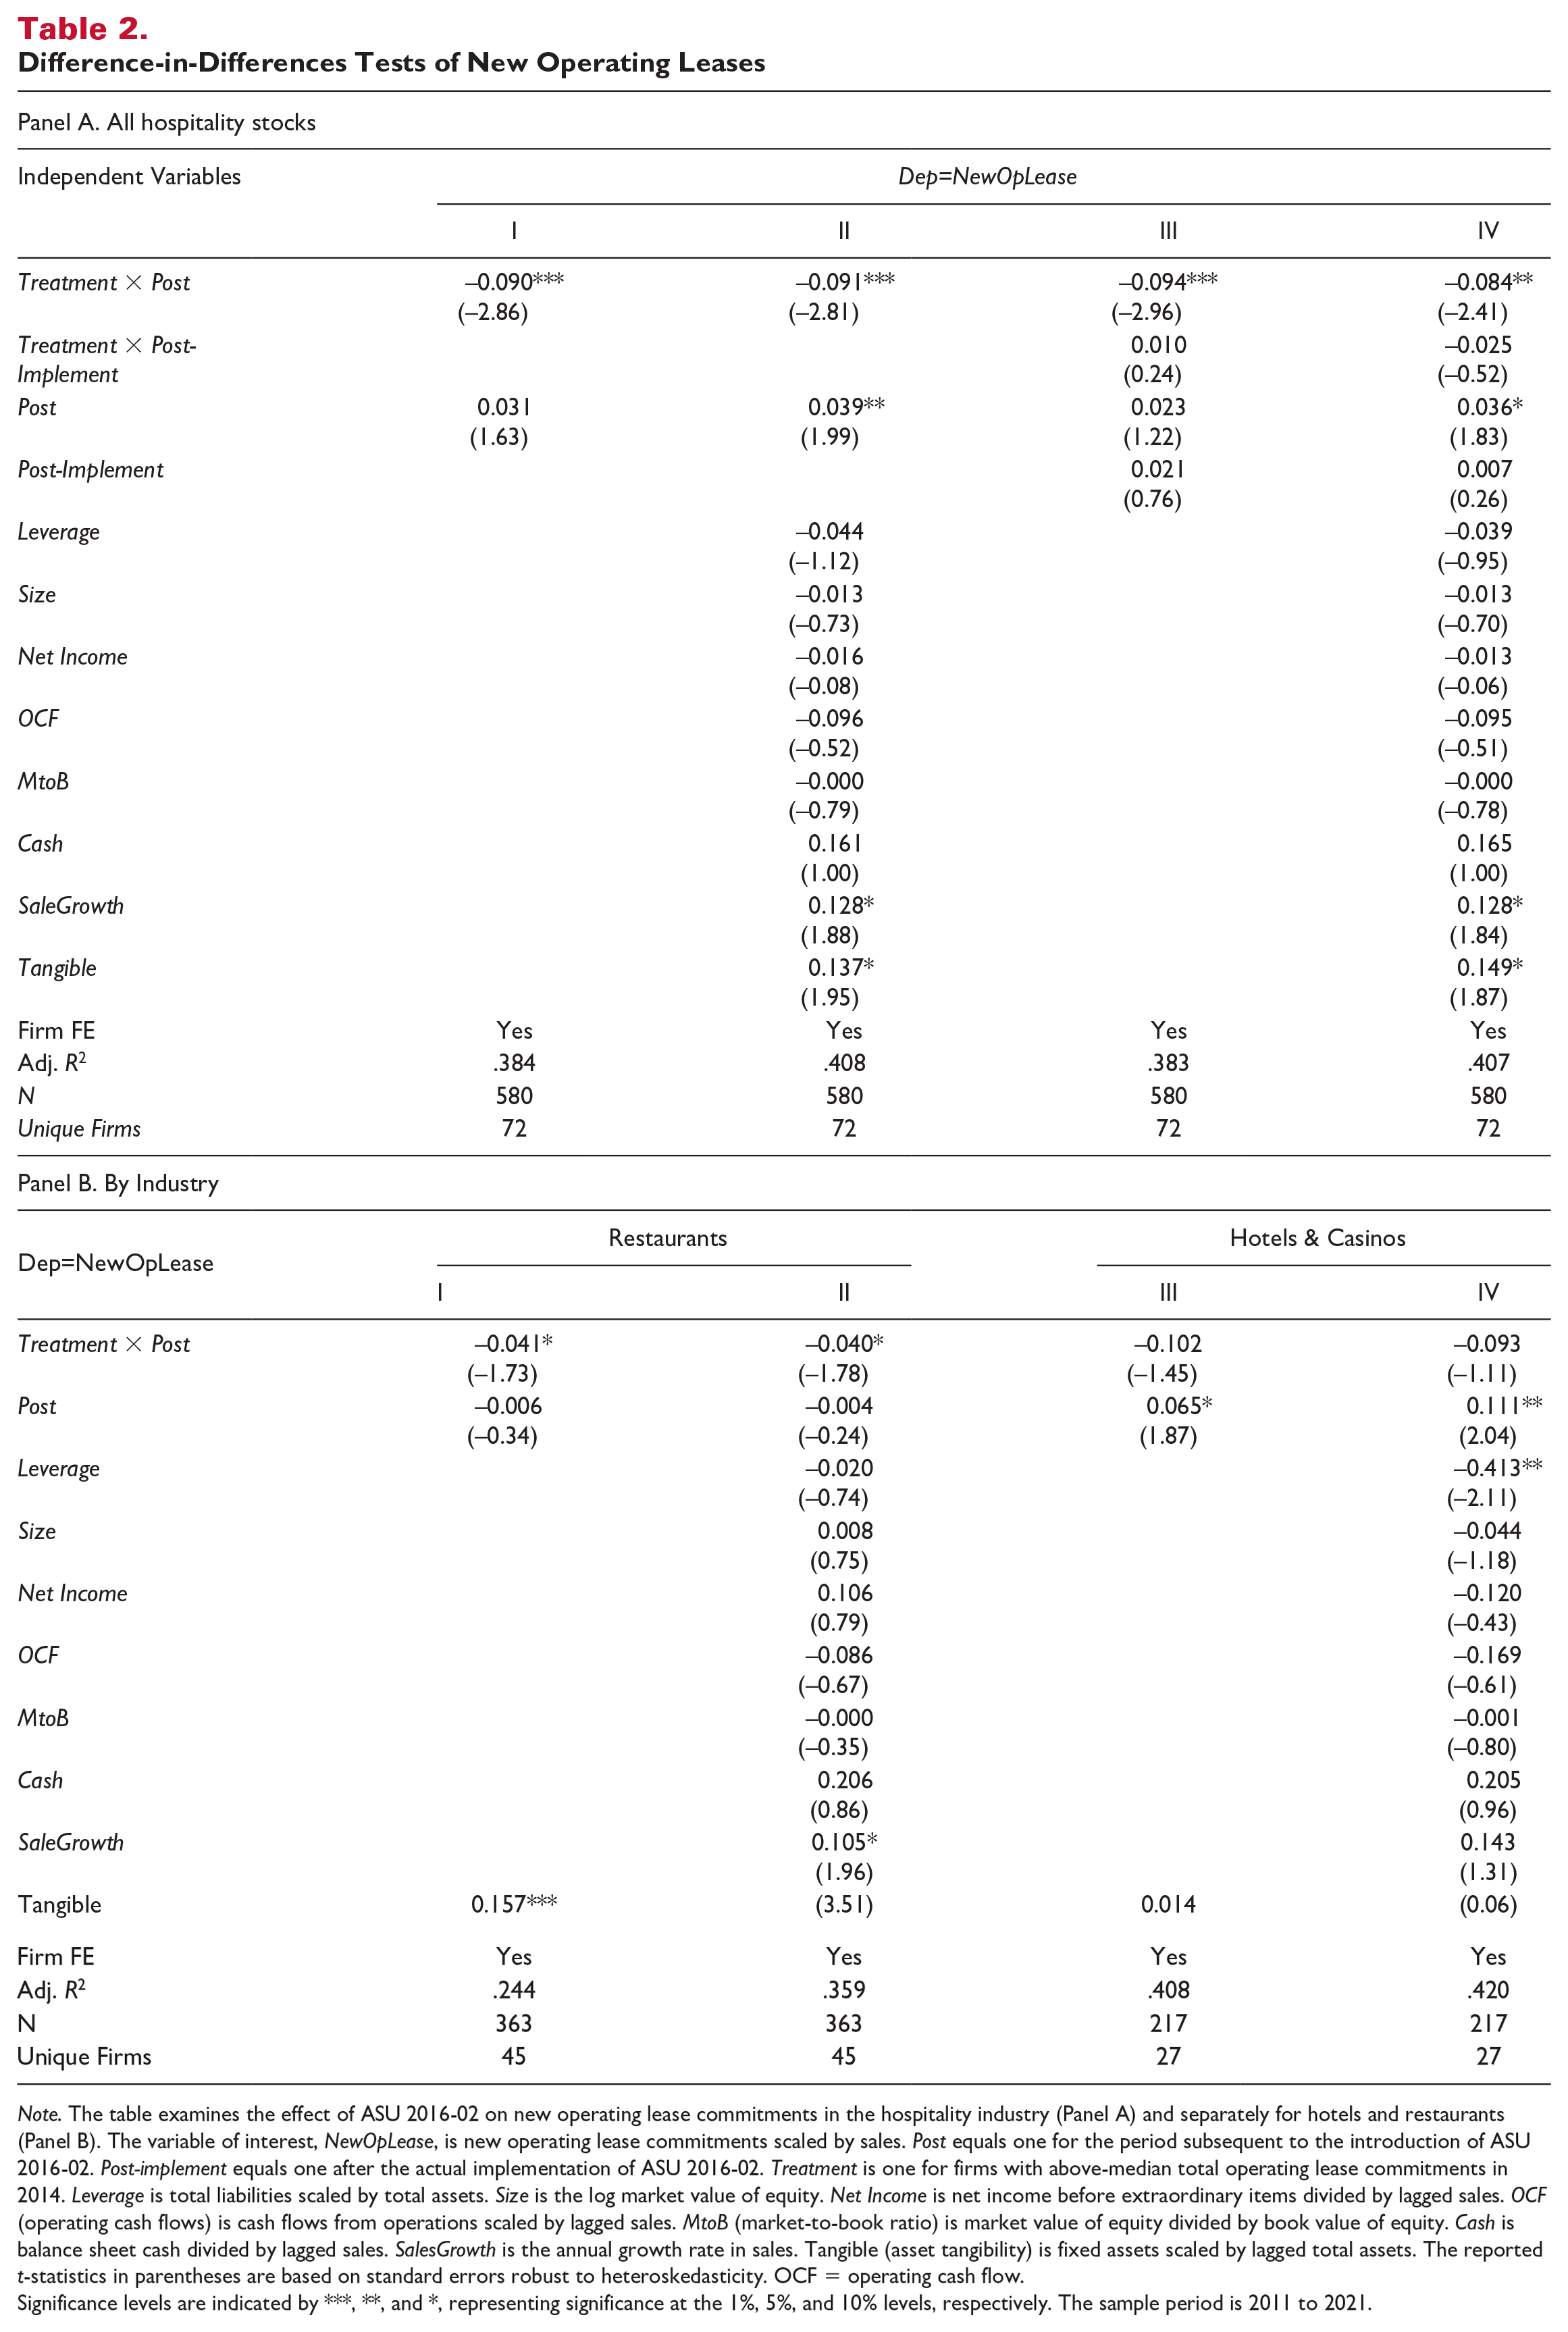
Note. The table examines the effect of ASU 2016-02 on new operating lease commitments in the hospitality industry (Panel A) and separately for hotels and restaurants (Panel B). The variable of interest, NewOpLease, is new operating lease commitments scaled by sales. Post equals one for the period subsequent to the introduction of ASU 2016-02. Post-implement equals one after the actual implementation of ASU 2016-02. Treatment is one for firms with above-median total operating lease commitments in 2014. Leverage is total liabilities scaled by total assets. Size is the log market value of equity. Net Income is net income before extraordinary items divided by lagged sales. OCF (operating cash flows) is cash flows from operations scaled by lagged sales. MtoB (market-to-book ratio) is market value of equity divided by book value of equity. Cash is balance sheet cash divided by lagged sales. SalesGrowth is the annual growth rate in sales. Tangible (asset tangibility) is fixed assets scaled by lagged total assets. The reported t-statistics in parentheses are based on standard errors robust to heteroskedasticity. OCF = operating cash flow.
Significance levels are indicated by ***, **, and *, representing significance at the 1%, 5%, and 10% levels, respectively. The sample period is 2011 to 2021.
The results thus far provide compelling evidence that hospitality firms that ASU 2016-02 more likely affected reduced their operating leases to a greater extent as a result of the new standard. Next, we add to the regression the variable Post-Implement and the interaction Treatment × Post-Implement. The variable Post-Implement is an indicator variable for the period subsequent to the actual implementation of ASU 2016-02; for example, we set it equal to one for fiscal years 2019-2021. The interpretation of this regression is as follows. The coefficient on Treatment × Post serves as the difference-in-differences test to compare the pre-ASU 2016-02 years (2011–2014) to the post-enactment years but prior to the implementation of ASU 2016-02 (2016–2018). The coefficient on Treatment × Post-Implement measures the additional effect of the actual implementation of the new standard on the difference-in-differences test. In other words, this specification enables us to test the differential effect of enactment and implementation of ASU 2016-02 on hospitality firms.
The results are in Columns III and IV of Table 2, Panel A. The coefficient on Treatment × Post remains similar. However, the coefficient on Treatment × Post-Implement is close to zero and is not statistically significant. We conclude that hospitality firms started to reduce their use of operating leases after the issuance of ASU 2016-02, in anticipation of its implementation.
Finally, Panel B of Table 2 provides separate results for restaurants and hotels. These results are similar to those in the full sample of all hospitality firms except we lose statistical significance as the result of the lower sample size (there are only 45 firms in the restaurants group and 27 in the group of hotels and casinos). 5
Overall, our results indicate that hospitality firms reduced their reliance on operating leases in reaction to the new accounting standard. For both hotels and restaurants, the reduction occurred at the initial issuance of the new accounting standard but prior to its actual implementation.
Effect on the Term Structure of Leases
ASU 2016-02 requires that operating lease commitments that are not due within 1 year are recognized on the balance sheet. However, operating leases due in the next year are exempt from this requirement, which creates an incentive for firms to enter into shorter-term leases after ASU 2016-02 if they were using operating leases to keep the liabilities off-balance sheet. Consequently, we anticipate that some hospitality firms transition toward shorter-term leases after ASU 2016-02.
Firms are required to disclose in a footnote operating lease commitments due in each of the next 5 years, as well as to provide an aggregate amount for all commitments due in years six and beyond. This requirement enables us to test whether firms alter the term structure of their leases as a result of ASU 2016-02. We follow Ma and Thomas (2023) and estimate six regressions of the following form:
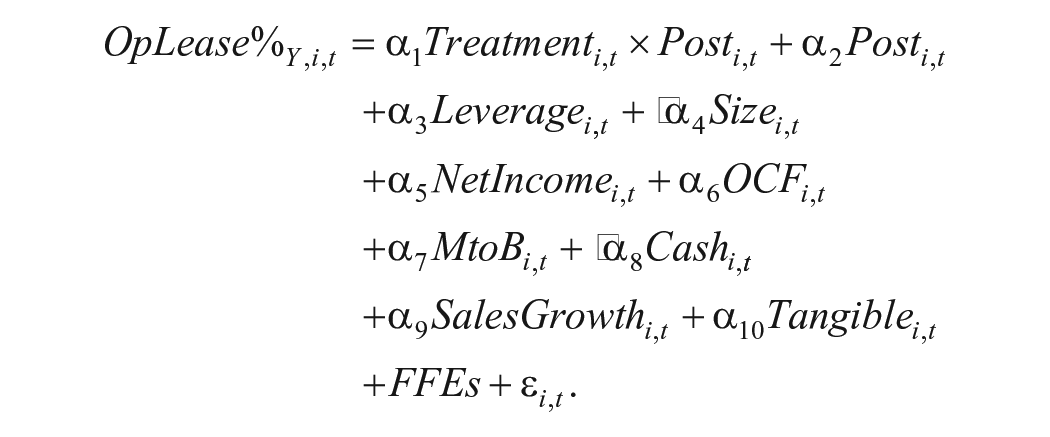
In these regressions, the variable OpLease%Y, i, is the proportion of leases due in year t + Y, where Y = 1, . . ., 6+.
The results, in Table 3, show that the coefficient on the interaction term Treatment × Post is significantly negative for Y = 6+, significantly positive for Y = 1, and insignificant for the intermediate years Y = 2, . . ., 5. In other words, hospitality firms reduce the proportion of long-term operating leases and increase the proportion of short-term leases, which remain off-balance sheet after ASU 2016-02.
Term Structure of Leases

Note. This table examines the effect of ASU 2016-02 on the term structure of operating leases. The variable OpLease%Y, i, is the proportion of leases due in year t + Y, where Y = 1, . . ., 6+. Post equals one for the period subsequent to the introduction of ASU 2016-02. Treatment is one for firms with above-median total operating lease commitments in 2014. Leverage is total liabilities scaled by total assets. Size is the log market value of equity. Net Income is net income before extraordinary items divided by lagged sales. OCF (operating cash flows) is cash flows from operations scaled by lagged sales. MtoB (market-to-book ratio) is market value of equity divided by book value of equity. Cash is balance sheet cash divided by lagged sales. SalesGrowth is the annual growth rate in sales. Tangible (asset tangibility) is fixed assets scaled by lagged total assets. The reported t statistics in parentheses are based on standard errors robust to heteroskedasticity. OCF = operating cash flow.
Significance levels are indicated by ***, **, and *, representing significance at the 1%, 5%, and 10% levels, respectively. The sample period is 2011 to 2021.
Empirical Results: Economic Consequences on the Hospitality Industry
We now present our main empirical results on the economic effect that ASU 2016-02 had on the hospitality industry.
Effect on Firm Performance
We first examine the effect of the new accounting standard on the performance of hospitality firms using the following regression:
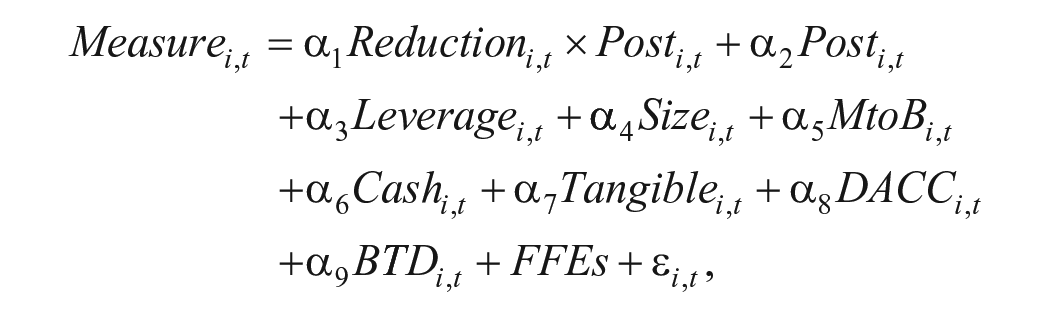
where Reduction is an indicator variable that equals one for treatment firms that reduce their reliance on operating leases and Measure is one of three measures of firm performance: Net Income (computed as net income before extraordinary items divided by lagged sales), OCF (operating cash flows, calculated as cash flows from operations divided by lagged sales), and SalesGrowth (annual sales growth rate). The additional control variables DACC and BTD, which we subsequently elaborate on, control for the effect of changes in revenue recognition rules due to the implementation of ASU 2014-09 (topic 606) in fiscal year 2018.
As we previously mentioned, it is difficult ex-ante to predict how the new accounting standard would affect the performance of hospitality firms. On one hand, in numerous comment letters to FASB, corporate managers raised alarms about potential negative effects (Comiran & Graham, 2016). Similarly, Chatfield et al. (2017) expressed concerns regarding the adverse consequences that could arise within the hospitality industry. One might therefore expect a negative effect on firm performance. In the context of our empirical test, we should expect a negative coefficient on the interaction term Reduction × Post.
On the other hand, one could also expect the accounting standard to have no effect, or even a positive effect. Several studies suggest that firms tend to rely heavily on operating leases, with managers driving reporting incentives (Cornaggia et al., 2013; Dechow et al., 2011; Lim et al., 2017). These reporting incentives are observable in two primary ways. First, managers may have assumed that keeping lease obligations off the balance sheet would contribute to a reduction in perceived risk for the firm. Second, an agency perspective proposes that managers may have aimed to extract economic rents and gain personal advantage through utilizing operating leases as a form of off-balance-sheet financing.
Although Ma and Thomas (2023) find that ASU 2016-02 did not have a negative effect on firms in general, the effect on hospitality firms could differ given our earlier results that show hospitality firms are more reliant on operating leases. The effect of the new lease standard on hospitality firms is, therefore, an empirical question, which we investigate through examining the estimated coefficient for the interaction term Reduction × Post in the above regression.
When assessing the economic effect of ASU 2016-02, it is important to also control for the effect of another change in accounting rules—revenue recognition standard ASU 2014-09, which went into effect for annual reporting periods beginning after December 15, 2017. ASU 2014-09 requires firms to recognize revenue in a manner that portrays the conveyance of contracted goods or services to customers, thus reflecting the compensation that these firms anticipate receiving in return for providing said goods or services.
Rutledge et al. (2016) study the potential effect of the new revenue recognition standard. They conclude that ASU 2014-09 should have a direct effect on earnings quality and deferred taxes. Several competing factors drive the effect on earnings quality, including greater opportunity for some executives to manage earnings, and greater consistency and comparability of revenue recognition practices across firms. The effect on deferred taxes is straightforward: the new standard allows firms to accelerate revenue recognition for accounting purposes relative to tax reporting purposes. This book-tax difference leads to larger amounts of deferred taxes.
To control for the effect of ASU 2014-09, we therefore control for earnings quality and deferred taxes in our regressions. We proxy for earnings quality using the discretionary accruals (DACC) measure based on the Jones (1991) model that Dechow et al. (1995) modified. We compute the book-tax difference (BTD) as the difference between book income adjusted for special items and taxable income (scaled by lagged total assets). 6 Our regressions, therefore, measure the economic effect of firms’ decision to reduce operating leases as a result of ASU 2016-02, controlling for other changes in the economic environment, and controlling for the effect of revenue recognition standard ASU 2014-09.
Our results, in Table 4, show that ASU 2016-02 did not have a significant effect on the performance of hospitality firms. There is a small positive effect on net income and operating cash flow, and a small negative effect on sales growth. However, in all three cases, the effect is economically small and not statistically significant.
Economic Consequences on Firm Performance

Note. The table examines the effect of ASU 2016-02 on three economic performance measures: net income before extraordinary items scaled by lagged sales (NetIncome), operating cash flows scaled by lagged sales (OCF), and the growth in sales (SalesGrowth). Reduction equals one for firms that decreased their utilization of operating leases after the introduction of ASU 2016-02. Post equals one for the period subsequent to the introduction of ASU 2016-02. Leverage is total liabilities scaled by total assets. Size is the log market value of equity. MtoB (market-to-book ratio) is market value of equity divided by book value of equity. Cash is balance sheet cash divided by lagged sales. Tangible (asset tangibility) is fixed assets scaled by lagged total assets. DACC is discretionary accruals from Jones (1991) and Dechow, Sloan, and Sweeney (1995). BTD is book-tax difference calculated as book income adjusted for special items less taxable income scaled by lagged total assets. The reported t-statistics in parentheses are based on standard errors robust to heteroskedasticity. The sample period is 2011 to 2021. OCF = operating cash flows; DACC = discretionary accruals; BTD = book-tax difference.
Significance levels are indicated by ***, **, and *, representing significance at the 1%, 5%, and 10% levels, respectively.
Effect on Shareholders
We next examine four variables to assess the effect of ASU 2016-02 on shareholders through stock price behavior. These variables are the market-to-book ratio (MtoB), the stock return (Ret), the beta of the stock (Beta), and the volatility of the stock (Vol).
The market-to-book ratio is a financial valuation metric widely used to evaluate a company’s current market value of equity relative to book value. Both higher market-to-book ratio and a higher stock return are positives for shareholders; each indicates greater firm value.
Beta and volatility are measures of risk. The beta of a stock is a measure of the systematic risk in the stock. The overall market has a beta of one. Stocks that are riskier (less risky) than the market have betas greater (less) than one. The volatility of a stock is a measure of the total risk to an investor of holding the stock. A higher volatility is associated with large stock price swings in either direction. In their analysis of the potential effect of ASU 2016-02 on hospitality firms, Chatfield et al. (2017) note the “expected widespread unfavorable impact on a lessee’s debt ratios,” implying that the market could perceive hospitality stocks as significantly riskier as the result of the new accounting standard.
To empirically assess the effect of ASU 2016-02 on shareholders, we estimate the following four regressions to test how the shareholders of treatment firms that reduce their reliance on operating leases (Reduction = 1) are affected by the new accounting standard:
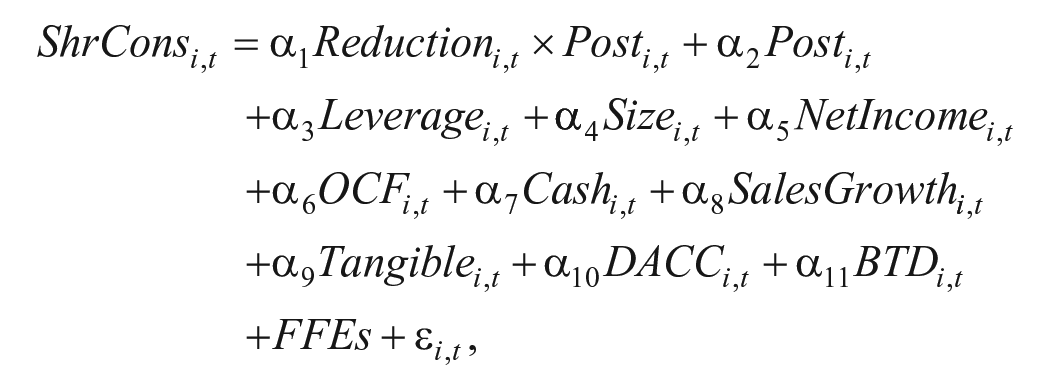
where ShrCons is each of the four variables that reflect the potential effect of the new standard on shareholders.
We observe that there is no significant change for Reduction firms in market-to-book ratios, returns, betas, or volatility in our results in Table 5. In other words, we do not find any enhancement or deterioration in firm value nor any change in firm risk. The results in Table 5 are consistent with those in Table 4, which shows no significant effect on firm performance.
Economic Consequences on Shareholders

Note. The table examines the effect of ASU 2016-02 on shareholders through four measures: MtoB (market-to-book ratio, market value of equity divided by book value of equity), Ret (stock return over the following year), Beta (systematic risk in the stock), and Vol (volatility or total risk in the stock). Reduction equals one for firms that decreased their utilization of operating leases after the introduction of ASU 2016-02. Post equals one for the period subsequent to the introduction of ASU 2016-02. Leverage is total liabilities scaled by total assets. Size is the log market value of equity. NetIncome is net income before extraordinary items scaled by lagged sales. OCF is operating cash flows scaled by lagged sales. Cash is balance sheet cash divided by lagged sales. SalesGrowth is growth in sales. Tangible (asset tangibility) is fixed assets scaled by lagged total assets. DACC is discretionary accruals from Jones (1991) and Dechow, Sloan, and Sweeney (1995). BTD is book-tax difference calculated as book income adjusted for special items less taxable income scaled by lagged total assets. The reported t-statistics in parentheses are based on standard errors robust to heteroskedasticity. OCF = operating cash flows; DACC = discretionary accruals; BTD = book-tax difference. The sample period is 2011 to 2021.
Significance levels are indicated by ***, **, and *, representing significance at the 1%, 5%, and 10% levels, respectively.
Effect on Other Stakeholders
We now assess the effect of ASU 2016-02 on other stakeholders, namely, creditors and employees. Some had predicted especially dire consequences on both dimensions. For example, Chang & Adams Consulting conducted a study analyzing the effects of the new accounting standard when it was proposed. According to their findings, the implementation of ASU 2016-02 would have detrimental consequences on employment, leading to the loss of at least 190,000 jobs across the United States. Furthermore, their report estimated that public companies in the United States would incur an additional expenditure of over US$10 billion in interest expenses. This rise in borrowing costs is the result of the new standard’s requirement to recognize additional balance sheet debt . Similarly, in their analysis of the potential effect of the new standard on the hospitality industry, Chatfield et al. (2017) anticipated adverse effects on lessees’ debt and interest coverage ratios. The authors predicted that they may exert a negative influence on those firms’ borrowing rates and debt covenants.
To assess the effect of the new standard on creditors and employees of hospitality firms, we estimate two regressions of the following form:

where StkCons is either Credit Rating or EmpGrowth, two variables that measure the potential effect of ASU 2016-02 on shareholders. We use S&P credit ratings that we convert to a numerical scale. Credit Rating is set to eight if the firm’s credit rating is AAA, seven if it is AA, six if it is A, five if it is BBB, four if it is BB, three if it is B, two if it is C, one if it is D, and zero if the firm is not rated. We measure EmpGrowth as the annual growth rate in the number of employees of the firm. The data for both measures are obtained from Compustat.
The results are in Table 6. We do not find that hospitality firms that reduce their reliance on operating leases experience either a deterioration in credit ratings or a decrease in employment. Contrary to some of the more dire predictions, the only significant effect we do find is an improvement in credit ratings for firms that reduced operating leases.
Economic Consequences on Other Stakeholders

Note. The table examines the effect of ASU 2016-02 on hospitality firms’ credit ratings and employees. Credit Rating is the S&P credit rating of the firm, converted to a numerical scale by setting Credit Rating to eight if the firm’s credit rating is AAA, seven if it is AA, six if it is A, five if it is BBB, four if it is BB, three if it is B, two if it is C, one if it is D, and zero if the firm is not rated. EmpGrowth is the annual growth rate in the number of employees of the firm. Reduction equals one for firms that decreased their utilization of operating leases after the introduction of ASU 2016-02. Post equals one for the period subsequent to the introduction of ASU 2016-02. Leverage is total liabilities scaled by total assets. Size is the log market value of equity. NetIncome is net income before extraordinary items scaled by lagged sales. OCF is operating cash flows scaled by lagged sales. MtoB is the market-to-book ratio, that is, market value of equity divided by book value of equity. Cash is balance sheet cash divided by lagged sales. SalesGrowth is growth in sales. Tangible (asset tangibility) is fixed assets scaled by lagged total assets. DACC is discretionary accruals from Jones (1991) and Dechow, Sloan, and Sweeney (1995). BTD is book-tax difference calculated as book income adjusted for special items less taxable income scaled by lagged total assets. The reported t-statistics in parentheses are based on standard errors robust to heteroskedasticity. The sample period is 2011 to 2021. OCF = operating cash flows; DACC = discretionary accruals; BTD = book-tax difference.
Significance levels are indicated by ***, **, and *, representing significance at the 1%, 5%, and 10% levels, respectively.
Borrowing rates are inversely related to credit ratings. More favorable credit ratings, therefore, benefit hospitality firms in terms of relatively lower borrowing rates. While this finding is surprising, it is consistent with the results in Ma and Thomas (2023). Perhaps analysts did not completely anticipate that hospitality firms would reduce their use of operating leases. Consequently, despite the rise in debt ratios resulting from ASU 2016-02, it is conceivable that the increase was not as large as analysts anticipated.
Conclusion
We find strong evidence that hospitality firms use leases significantly more than firms in other industries on average, which is consistent with the trend of hospitality firms shifting to an asset-light model that includes the use of sale-leasebacks. The recently enacted accounting standard ASU 2016-02 requires that operating leases with a term greater than 12 months be recognized on a lessee’s balance sheet. We analyze the effect of the new standard on the hospitality industry.
We find that the new lease accounting standard ASU 2016-02 had a sizable effect on the hospitality industry. In response to the new accounting rule, hospitality firms decreased their use of operating leases, switching to shorter-term releases (which remain off-balance sheet). However, this change in leasing practice did not have negative consequences on firm performance, shareholders, or employees. Notably, the only significant economic effect we find is an improvement in credit ratings for hospitality firms that reduced their reliance on operating leases. The improved credit ratings suggest lower borrowing rates and therefore are a benefit to these firms.
Our salient study addresses a timely and relevant question regarding the effects of ASU 2016-02 on hospitality firms and their stakeholders. It contributes novel findings that are at odds with the concerns some hospitality managers and academics had expressed prior to the introduction of the standard.
Footnotes
Appendix
Acknowledgements
We are grateful to an anonymous referee, an anonymous Associate Editor, and Christopher Anderson, the Editor, for helpful suggestions that greatly improved the paper. We thank Milena Petrova and Lauren Thirer for helpful comments and discussions. Weinbaum gratefully acknowledges research support from the Harris Fellowship in Finance. All errors are our responsibility.
Declaration of Conflicting Interests
The author(s) declared no potential conflicts of interest with respect to the research, authorship, or publication of this article.
Funding
The author(s) received no financial support for the research, authorship, or publication of this article.
