
Abstract
While recent studies have drawn attention to the environmental justice implications of specific hazards and pollution sources for inhabitants of public housing developments (PHDs), previous research has not examined whether PHD residents are disproportionately exposed to the cumulative impacts of multiple environmental stressors. We address this gap by conducting the first systematic, national-scale analysis of the relationship between cumulative environmental burdens and PHD residency, using a novel spatial statistical approach for assessing cumulative impacts. We seek to determine whether: (1) PHD units and residents, and (2) socially disadvantaged households residing in PHDs, are significantly overrepresented in census tracts with higher cumulative burdens in the continental U.S. Our study utilizes environmental indicators from the U.S. Environmental Protection Agency’s EJScreen tool (2022), and PHD-related data from the U.S. Department of Housing and Urban Development (December 31, 2022). We implement a spatial cluster analysis technique to designate hot (and cold) spots of tracts with significantly higher (and lower) cumulative burdens compared to other tracts. Results indicate that both PHD units and residents are disproportionately located in hot spot areas, compared to non-PHD housing units and population. For people residing in PHDs, we found Black, Hispanic, and extremely low-income households to be overrepresented in hot spot tracts. Our findings highlight the necessity to reverse these unequal patterns for PHDs, as well as illustrate how emerging spatial statistical approaches can contribute to measuring cumulative impacts and detecting overburdened communities that require policy intervention.
INTRODUCTION
Although environmental justice (EJ) activism, research, and policies in the United States have focused on a variety of disadvantaged and marginalized population groups, residents of federally subsidized rental housing have received limited attention. Households residing in public housing developments (PHDs) represent a particularly vulnerable group because public housing is only available to households with incomes at or below 30% of the Area Median Income. In addition to economically disadvantaged households, several case studies1,2,3 have revealed that PHDs are inhabited by relatively higher proportions of racial/ethnic minorities, disabled individuals, older residents, people with preexisting health conditions, and others with limited capacity for coping with the adverse impacts of various environmental hazards and risks, when compared to the general population in the local metropolitan area or county.
Several distributive EJ studies have investigated the relationship between environmental risk burdens and subsidized rental housing in the United States. Cutter et al. 4 found families in federally assisted public housing in eight medium-sized urban areas to have significantly higher risk potential from hazardous facilities, based on both proximity and reported toxic releases. Almost 70% of Superfund sites on the National Priorities List in the United States are located within a mile of federally assisted housing developments. 5 Chakraborty et al.2 found that PHD units and residents in the continental U.S. are significantly overrepresented in areas with higher exposure to fine particulate matter (PM2.5), after accounting for relevant spatial and social factors. Greenberg and Schneider 6 reported that leaking underground storage tanks, non-Superfund waste sites, and highways with greater traffic density were located near public housing sites in eight U.S. cities.
Based on knowledge that federally assisted public housing was racially segregated historically and exhibits persisting racial segregation and inequalities today (e.g., with White public housing residents having access to less expensive and higher quality rental housing units than non-White residents), 7 two studies have examined social disparities in exposure to environmental hazards within the PHD population. Chakraborty et al.2 found disabled, non-White, and extremely low-income households within PHDs to be significantly overrepresented in areas with higher PM2.5 exposure, while Chakraborty et al.1 found extremely low-income, elderly-headed, and female-headed households to be overrepresented in PHDs and other subsidized housing properties with greater exposure to Hurricane Harvey-induced flooding. While previous studies have drawn attention to the unequal distribution of specific individual hazards for public housing residents, prior research has not examined cumulative exposure from multiple hazards and pollution sources. Several reports and this special issue emphasize the growing need to incorporate cumulative impacts in EJ analysis and government decision-making at the federal8,9 and state10,11 levels.
With more than 1.6 million people residing in public housing, more research is urgently needed to examine if PHD units and residents are disproportionately exposed to the cumulative impacts of multiple stressors. We address this gap by conducting the first systematic, national-scale analysis of the relationship between cumulative environmental burdens and PHD residency in the United States using a novel spatial statistical approach. Although cumulative exposure and impacts can be assessed in multiple ways, our specific focus here is on the collective concentration of risk burdens in a given geographic area, measured as the total number or count of environmental burdens that exceed specified threshold levels. Our study aims to answer two research questions:
Are PHD units and residents significantly overrepresented in neighborhoods with higher cumulative environmental burdens? Are socially disadvantaged households residing in PHDs significantly overrepresented in census tracts with higher cumulative environmental burdens?
While Research Question 1 focuses on federally subsidized housing units designated as public housing and their residents, Research Question 2 examines the sociodemographic characteristics of households residing in public housing. The term ‘socially disadvantaged’ in Research Question 2 refers to households with extremely low incomes, with disabled persons, and those headed by an elderly, female, or racial/ethnic minority resident. We use census tracts as the unit of analysis for assessing environmental burdens, with the continental U.S. (lower 48 states and Washington, DC) representing our study area. Our study utilizes environmental indicators available in the U.S. Environmental Protection Agency (EPA)’s EJScreen tool, in conjunction with data on PHDs and their residents from the U.S. Department of Housing and Urban Development (HUD). Cumulative risk assessment at the tract level is based on a spatial statistical approach that uses cluster analysis to designate hot (or cold) spots of tracts with significantly higher (or lower) cumulative burdens compared to the continental U.S. We thus demonstrate how local indicators of spatial association can be applied to evaluate cumulative environmental impacts and their EJ implications.
DATA AND METHODS
Assessment of cumulative environmental burdens
Census tract-level data on environmental burdens were obtained from the EPA’s EJScreen 2.1 tool, released in October 2022. 12 EJScreen is a web-based application that uses nationally consistent and publicly available data on environmental and sociodemographic indicators to highlight areas with potential EJ concerns. The downloading and analysis of EJScreen datasets for this study were conducted before public access to the official version was discontinued by the federal government on February 5, 2025. The 12 environmental indicators available in EJScreen 2.1 and used for this research include PM2.5, ozone, diesel PM, air toxics cancer risk, air toxics respiratory hazard, traffic proximity/volume, lead paint, Superfund site proximity, Risk Management Plan facility proximity, hazardous waste facility proximity, underground storage tanks, and wastewater discharges. Although EJScreen also provides sociodemographic indicators (e.g., minority and low-income status) for the general population, those were not applicable here because of our public housing focus.
For each EJScreen environmental indicator, we defined areas of concern as tracts where its value exceeds the 80th percentile nationally. Early applications of EJScreen recommended and used the 80th percentile filter as the initial threshold for selecting areas that should be considered as potential candidates for further review. 13 Our choice is further justified in that the Federal Emergency Management Agency’s National Risk Index tool utilizes the 80th percentile as the lower bound for its ‘very high’ rating for communities at greatest risk to 18 natural hazards. 14
A spatial statistical approach was then implemented to classify tracts in the continental U.S. in terms of their cumulative environmental burden. This comprised univariate cluster analysis based on a local indicator of spatial association to detect hot and cold spots of tracts, utilizing the total number of EJScreen environmental burdens exceeding the 80th percentile. The more conventional method for assessing cumulative impacts is an additive approach for combining multiple burdens that has been used in EJ scholarship, as well as web-based EJ screening tools. For example, Mohai’s 15 recent national-scale analysis illustrates how racial/ethnic and socioeconomic disparities tend to increase as the number (count) of EJScreen environmental burdens meeting multiple critical thresholds (percentiles) increases. The New Jersey EJ Mapping, Assessment, and Protection Tool 16 also estimates cumulative burdens based on the number of stressors deemed ‘adverse’ in a given community, where the adverse designation is based on whether the stressor is above a critical (50th) percentile value.
Spatial cluster analysis extends this additive approach for identifying areas of concern by classifying analytic units as statistical hot spots, based on their unusually higher values relative to other units in the study area that can be accepted (or rejected) using a test of significance. The family of G statistics, introduced by Getis and Ord, 17 provides a reliable and useful approach for detecting spatial clustering patterns. The most widely used G statistic is the Gi* (Gi-star), which identifies local spatial clustering patterns, specifically hot spots (clusters of high values) and cold spots (clusters of low values). This measure is operationalized using a spatial weights matrix that describes how analytic units are spatially connected to, or interact with, one another. For discrete variables and polygon features (e.g., counties or census tracts), contiguity based on polygons that share a boundary or corner, referred to as the first-order queen spatial weights matrix, is the recommended and widely used method. 18
The statistical significance of the Getis-Ord Gi* statistic is determined via hypothesis testing using standardized z-scores calculated for each analytic unit and corresponding p-values. For this analysis, z-scores for each unit and corresponding levels of significance were utilized to classify tracts in the continental U.S. as hot spots (clusters of tracts with the number of environmental burdens significantly larger than expected) and cold spots (clusters of tracts with the number of burdens significantly smaller than expected). We employed 9999 random permutations and the first-order queen contiguity-based spatial weights matrix to estimate the statistical significance of the Getis-Ord Gi* statistic, based on the number of EJScreen environmental indicators exceeding the 80th percentile threshold. Both hot and cold spot clusters of tracts were further classified based on p-values of their z-score to distinguish between the 95%–99% (0.05 < p < 0.01) and >99% (p < 0.01) levels of significance. The open-source software application GeoDa 1.22 19 was used to conduct this spatial cluster analysis.
Housing and sociodemographic data
Data on public housing units, residents, and sociodemographic characteristics of resident households were obtained from the HUD Picture of Subsidized Households 20 for 2022 (compiled on December 31, 2022). Using ArcGIS Desktop 10.8.2 software, the locations of all PHDs in the continental U.S. were geocoded based on their latitude-longitude coordinate information. PHDs in this HUD database are assigned a distinct address to represent the general location of an entire housing development. If a PHD includes multiple buildings, the building with the largest number of units is selected to represent its location.
In the Picture of Subsidized Households database, HUD suppresses data for count variables with values smaller than 11 (coded as −4) to preserve confidentiality, and data for specific variables are not reported (coded as −5) when reporting rates for the PHD are lower than 50%. To address suppressed data on the resident population, a value of 1 was used to replace values of −4 and −5, following previous studies on federally subsidized housing developments.1,2 This may lead to an undercounting of the actual population residing in these PHDs, but yields a conservative non-zero estimate for our tract-level analysis.
Analytic approach
Research Question 1 examines whether PHD units and residents are overrepresented in census tracts with higher cumulative burdens. We summed the number of both PHD units and residents in each tract and estimated their numbers based on the number (count) of burdens. For each burden category (i.e., >99% cold spot, 95%–99% cold spot, non-significant, 95%–99% hot spot, and >99% hot spot tracts), PHD-specific percentages were calculated by dividing the numbers of PHD units and residents, respectively, by the total number of housing units and population provided in the 2022 ACS five-year estimates. PHD-specific proportions are also compared to the proportions of other (non-PHD) housing units and non-PHD residential population in each cumulative burden category, obtained by subtracting PHD units and residents from the total number of housing units and population from the 2022 ACS five-year estimates, respectively. Two-sample z-tests for proportions were used to determine the statistical significance of differences in percentages for each burden category with respect to corresponding percentages for the entire continental U.S. (comparison or reference group). This analysis encompasses 5914 PHDs with complete data on the total number of PHD units and residents.
Research Question 2 examines whether socially disadvantaged households residing in PHDs are significantly overrepresented in tracts with higher cumulative burdens. We aggregated the number of households in each tract residing in PHDs based on seven sociodemographic characteristics for which data are available in the 2022 HUD database: households with extremely low-income (income below 30% of local area median family income, adjusted for household size), with a disabled person, headed by a female resident, head of household or their spouse is aged 62 years or older, head of household is non-Hispanic White, head of household is non-Hispanic Black, and head of household is Hispanic. We then estimated the numbers and proportions of households in each cumulative burden category (i.e., hot and cold spots) based on these characteristics and the total number of PHD households that reported data on these variables. Two-sample z-tests for proportions were again used to determine the statistical significance of differences between the percentages associated with each burden category and corresponding percentages for the continental U.S. This analysis for Research Question 2 includes 5587 PHDs comprising households that reported this information to HUD via Form-50058 or Form-50059 with complete data on the sociodemographic variables examined.
Sensitivity analysis
We replicated the analyses conducted for Research Questions 1 and 2 using the conventional additive approach to cumulative impact assessment. The additive approach involved summing the total number of EJScreen environmental burdens (0–12) that exceed the 80th percentile for each burden and classifying tracts based on their number of burdens into five categories: 0, 1–2, 3–5, 6–8, and ≥9.
RESULTS
The spatial distributions of PHD locations and cumulative environmental burdens based on hot/cold spot analysis are depicted in Figure 1. The mean number of EJScreen burdens exceeding the 80th percentile is 0.4 in the >99% level cold spot, 1.2 in the 95%–99% level cold spot, 2.9 in the non-significant, 5.2 in the 95%–99% level hot spot, and 7.1 in the >99% level hot spot category of tracts. Figure 1 indicates that tracts in the highest burden category (>99% level hot spots) are located mainly in metropolitan areas of California, Illinois, New Jersey, and New York, and concentrated within the most populous U.S. cities (e.g., Los Angeles, Chicago, and New York) that also contain a large number of PHDs. Tracts with the lowest cumulative burden (>99% level cold spots), in contrast, are dispersed across multiple states and located in more sparsely populated areas of the United States.
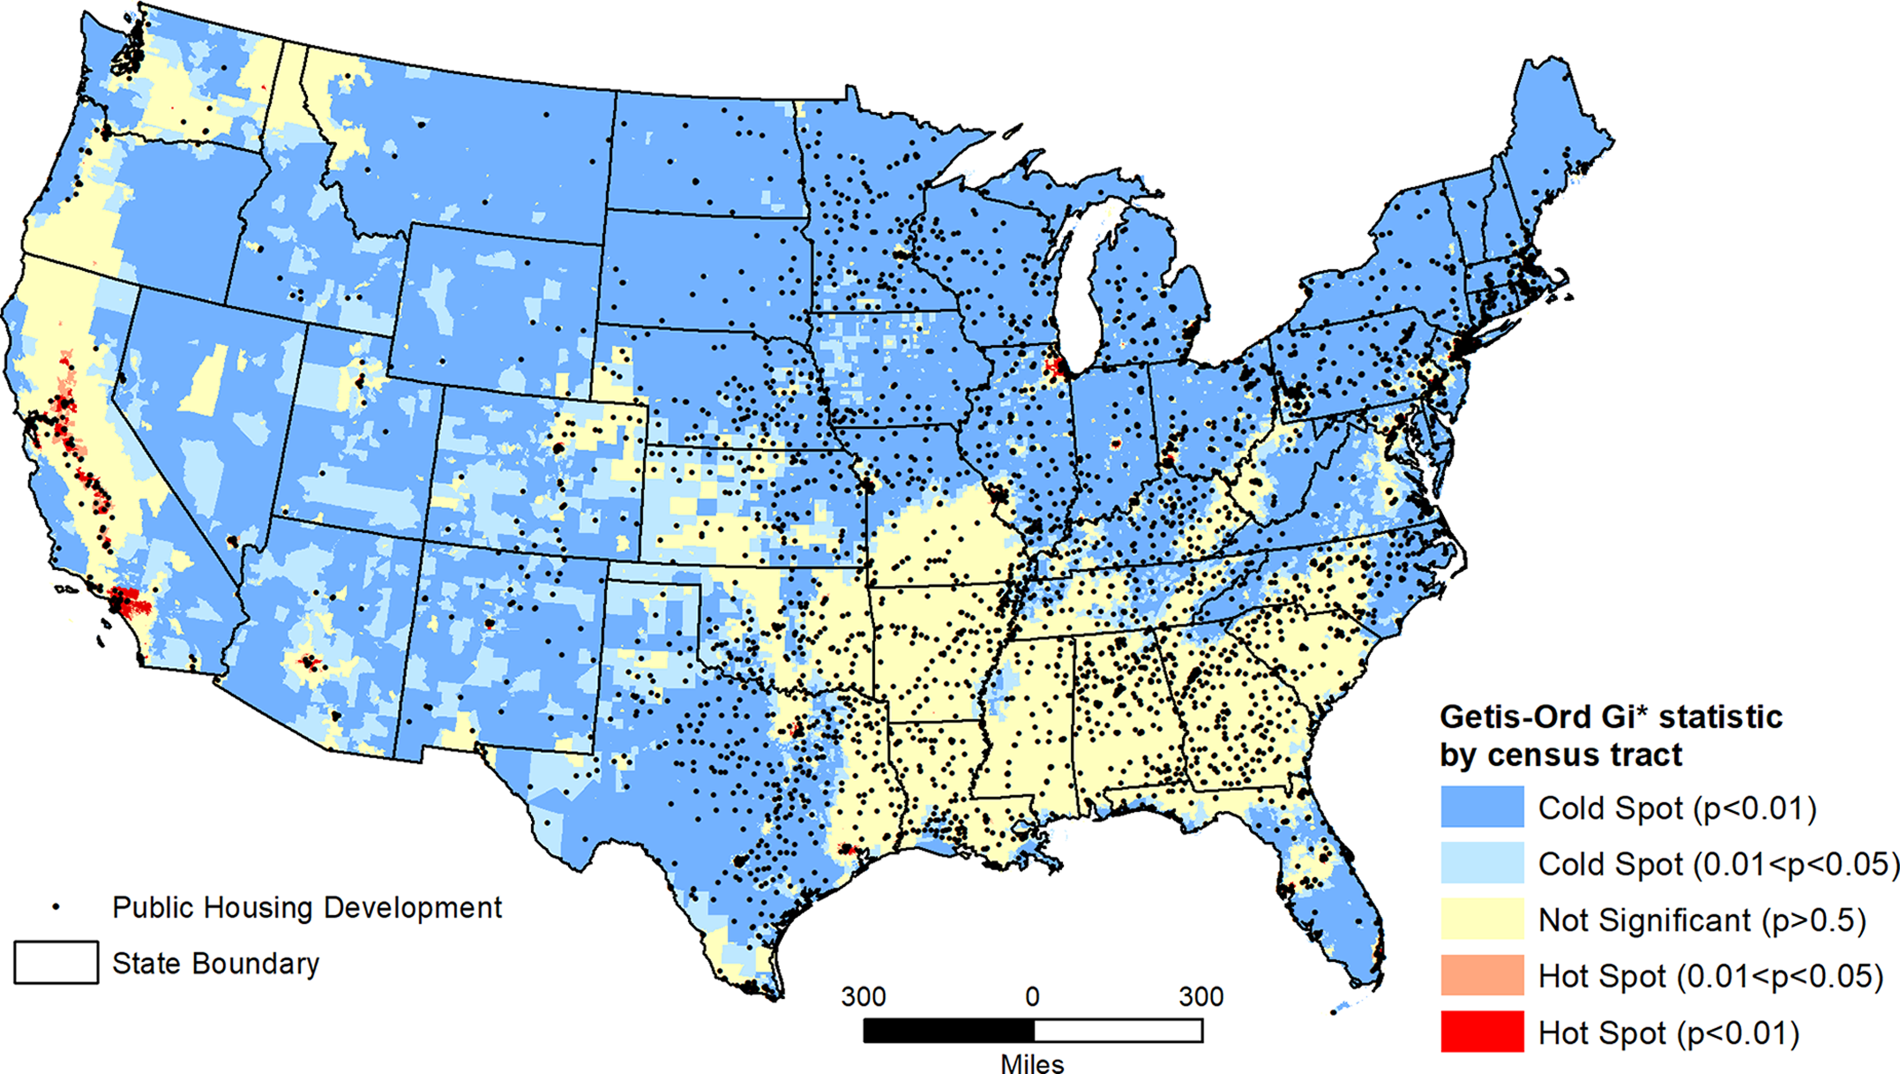
Public housing and hot/cold spots for the number of EJScreen indicators exceeding the 80th percentile, based on Getis-Ord Gi* statistic, by census tract in the continental U.S.
Urban tracts in densely populated areas and hot spot spatial clusters are difficult to identify on this national-scale map (Figure 1) because of their relatively small areal extent. Detailed maps of PHD locations and census tracts in Chicago, Los Angeles, and New York are shown in Figure 2. These maps illustrate how PHDs are concentrated primarily within the >99% level hot spot tracts that are too small in size to be detected on the national map.
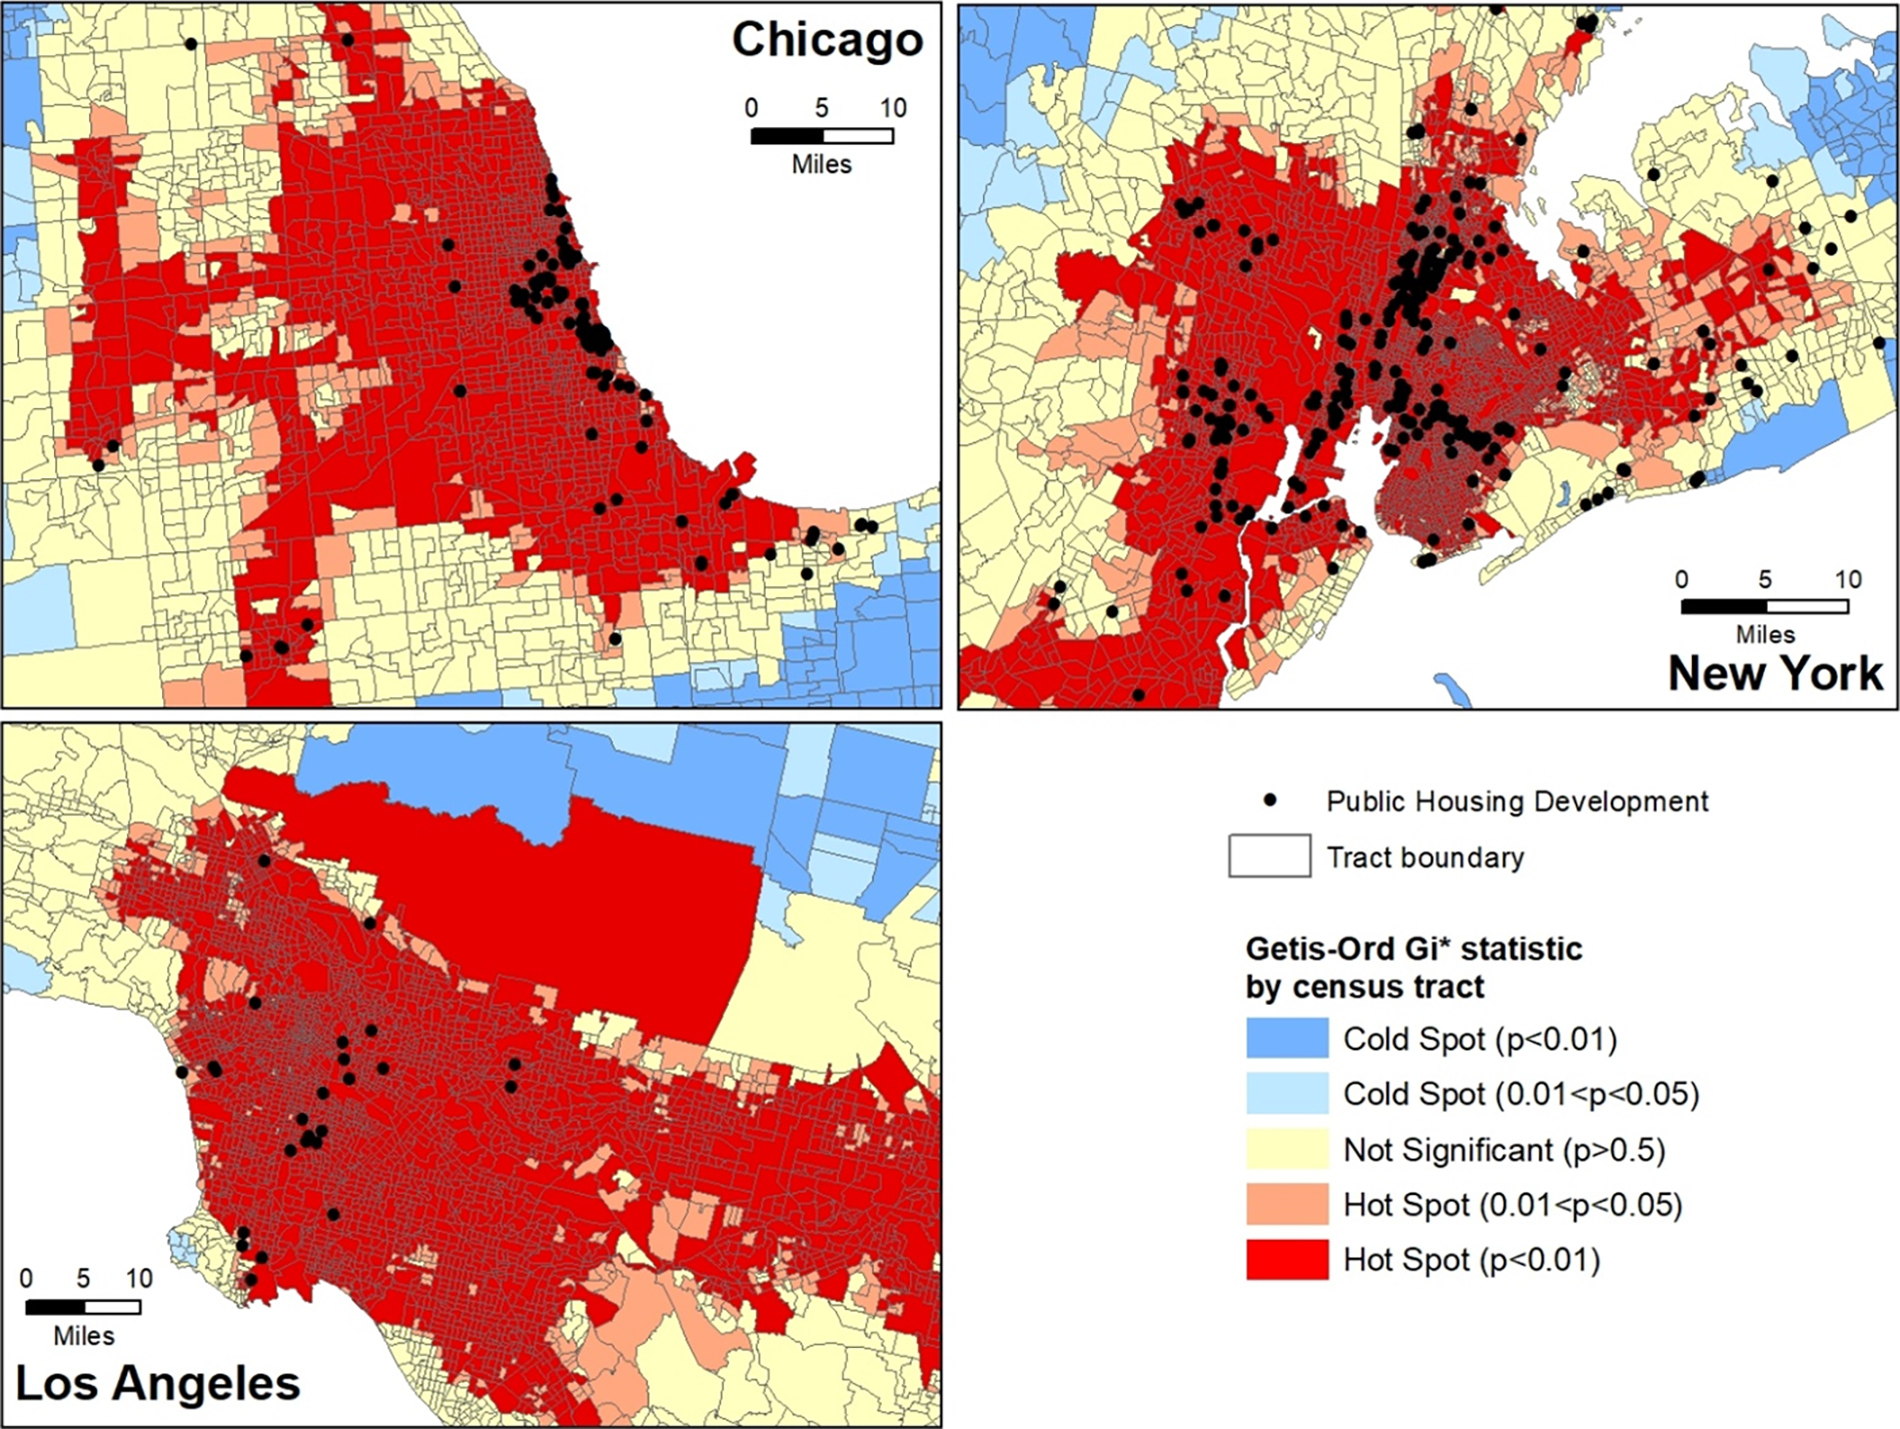
Public housing and hot/cold spots for the number of EJScreen indicators exceeding the 80th percentile in three large metropolitan areas of the United States.
Research question 1
The numbers and percentages of housing units and people residing in PHDs are listed in Table 1 for each cumulative burden category. The corresponding numbers and percentages for the continental U.S. are also included for comparison. The percentages of both PHD units and population, respectively, are found to increase as cumulative environmental burdens increase from the lowest (>99% level cold spot) to the highest (>99% level hot spot) category of tracts. Percentages of both PHD units and residents are about five times higher in the most overburdened category (>99% level hot spot) compared to the least burdened category (>99% level cold spot). The percentages of PHD units and population, respectively, in each of the two hot spot categories (95%–99% and >99% levels) are significantly higher (p < 0.001) than their respective percentages in the continental U.S., based on the two-sample z-test of proportions (not shown in Table 1). The z-test also revealed the percentages of PHD units and residents associated with the remaining burden categories (i.e., non-significant and both cold spots) to be significantly lower (p < 0.001) than their percentages in the continental U.S.
Numbers and Percentages of Public Housing Development (PHD) Units and Resident Population Based on the Spatial Statistical Approach to Estimating Cumulative Environmental Burdens (Getis-Ord Gi* Statistic)
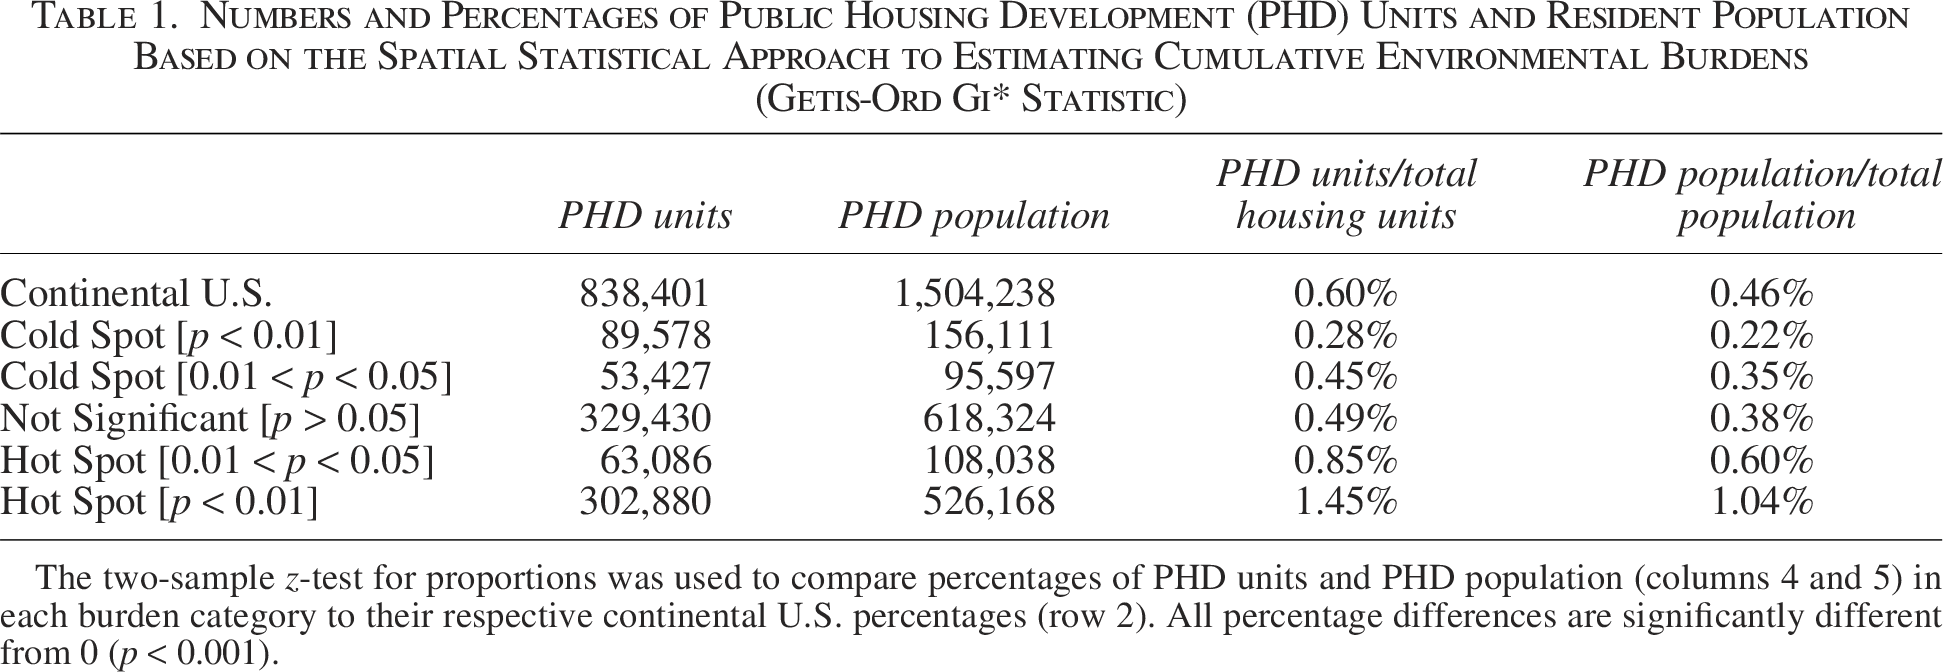
The two-sample z-test for proportions was used to compare percentages of PHD units and PHD population (columns 4 and 5) in each burden category to their respective continental U.S. percentages (row 2). All percentage differences are significantly different from 0 (p < 0.001).
Figure 3 depicts how the number of PHD units and population (as a percentage of their respective U.S. total) changes across the five burden categories. Tracts in the >99% level cold spot category contain only about 11% of PHD units, but approximately 23% of non-PHD units in the continental United States. This cold spot category includes only about 10% of the PHD population, but nearly 21% of the non-PHD population. Similar overrepresentations of PHD units and residents are detected in the hot spot categories of cumulative burdens. Almost 36% of PHD units and 35% of PHD residents are located in the >99% level hot spot category, compared to only about 15% of non-PHD units and 15% of the non-PHD population, respectively. The respective proportions of both PHD units and residents (more than 40% each) are at least twice as high, compared to the proportions of non-PHD units and population, when both the hot spot categories are collectively considered.
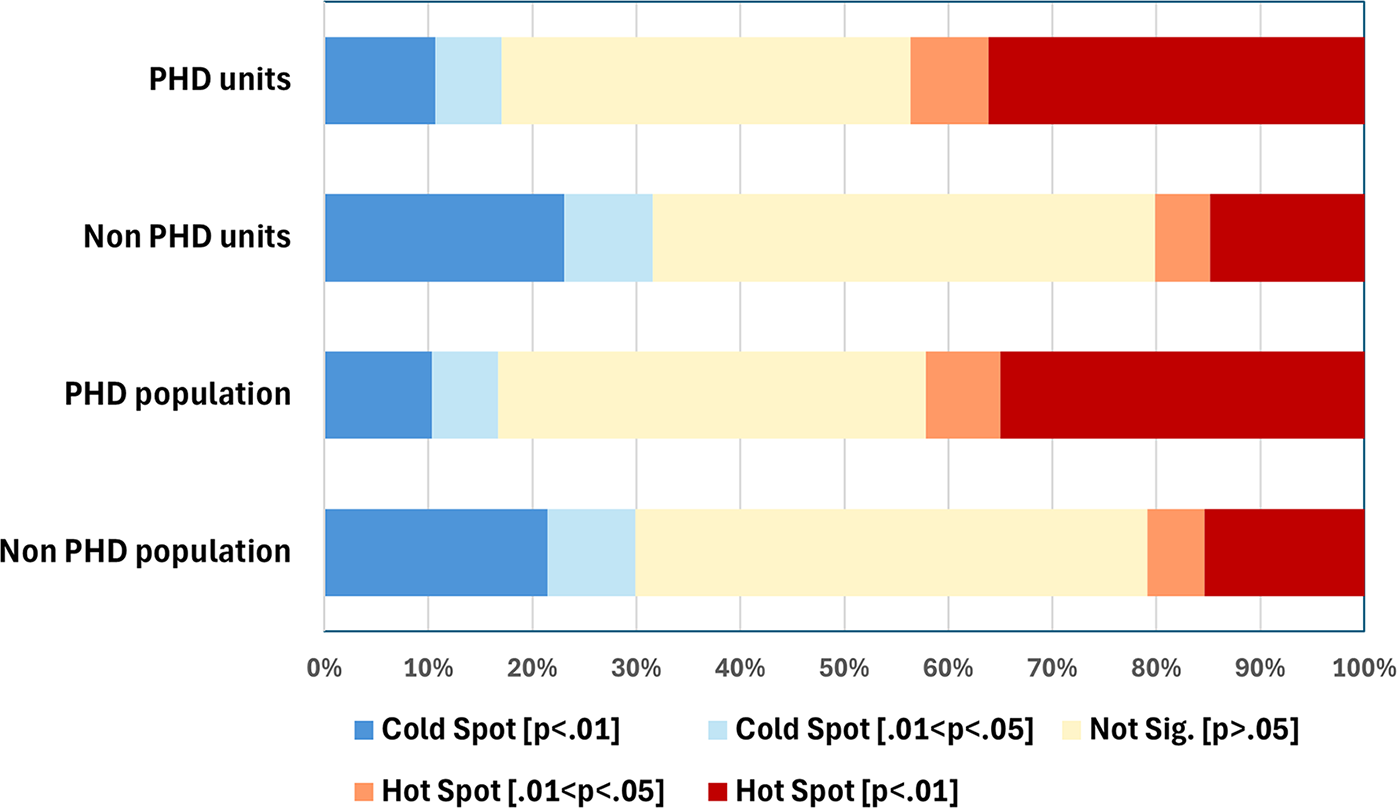
Relative proportions of public housing development (PHD) units and resident population with non-PHD units and population based on the spatial statistical approach to estimating cumulative environmental burdens (Getis-Ord Gi* statistic).
Research question 2
Table 2 summarizes the percentages of PHD households in each sociodemographic group, based on the five cumulative burden categories. Corresponding percentages for the continental U.S. are also included for comparison. The percentages of extremely low-income households, as well as households headed by Black and Hispanic residents, increase gradually from the lowest (>99% level cold spot) to the highest (>99% level hot spot) category of tracts. Percentages for both Black- and Hispanic-headed households are at least 2.5 times higher in the most overburdened category (>99% level hot spot) compared to the least burdened (>99% level cold spot). Percentages of White-headed households, however, decline steadily from cold to hot spots. That percentage is nearly eight times higher within >99% level cold spot tracts, compared to those in >99% level hot spots. Percentages of Black- and Hispanic-headed households, respectively, in the hot spot categories (95%–99% and >99% levels) are both significantly higher (p < 0.001) than their respective values in the continental U.S., based on the z-test of proportions. This test also confirms that the percentages of White-headed households in these hot spot categories are significantly lower (p < 0.001) than their corresponding continental U.S. percentage.
Sociodemographic Characteristics of Households Residing in Public Housing Developments, Based on the Spatial Statistical Approach to Estimating Cumulative Environmental Burdens (Getis-Ord Gi* Statistic)
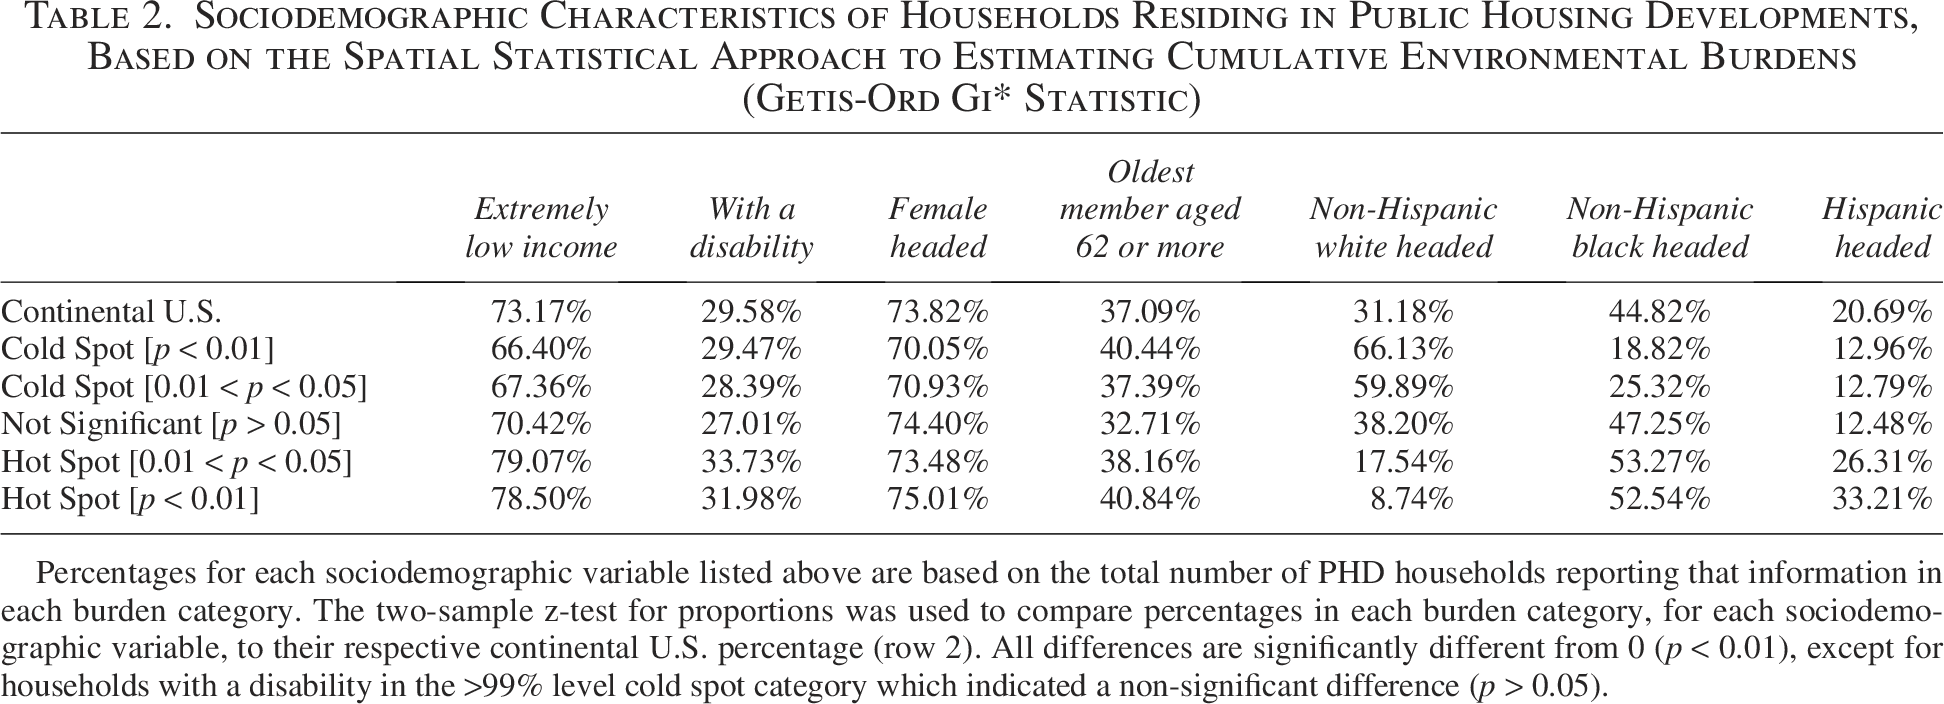
Percentages for each sociodemographic variable listed above are based on the total number of PHD households reporting that information in each burden category. The two-sample z-test for proportions was used to compare percentages in each burden category, for each sociodemographic variable, to their respective continental U.S. percentage (row 2). All differences are significantly different from 0 (p < 0.01), except for households with a disability in the >99% level cold spot category which indicated a non-significant difference (p > 0.05).
The percentages of both extremely low-income and female-headed households indicate relatively minor but gradual increases as cumulative burdens increase from the lowest (>99% level cold spot) to the highest (>99% level hot spot) category. Values of both these variables in each of the two hot spot categories (95%–99% and >99% levels) are significantly higher (p < 0.001) than their respective percentages in the continental U.S., based on the z-test of proportions. The two remaining variables (i.e., disability and the oldest member aged 62 or more years) did not indicate any major or consistent changes from the >99% level cold spot to the >99% level hot spot category. However, the z-test of proportions revealed that the percentages of households with a disability and the oldest member aged 62 or more in the >99% level hot spots are both significantly higher (p < 0.001) than their respective percentages in the continental U.S.
Figure 4 depicts the distribution of PHD households (as a percentage of their respective U.S. total) based on their sociodemographic characteristics in each cumulative burden category. The corresponding proportions of all PHD households in the continental U.S. that reported sociodemographic data are used as a reference for comparing each sociodemographic group. Tracts in the >99% level hot spot category contain almost 40% of Black-headed and 55% of Hispanic-headed households, but less than 10% of White-headed households in PHDs. A similar overrepresentation of racial/ethnic minority households can be detected in the 95–99% level hot spots. Additionally, those overrepresented in the hot spot categories (compared to their corresponding percentages in the continental U.S.) include extremely low-income, disabled, female-headed, and elderly headed households.
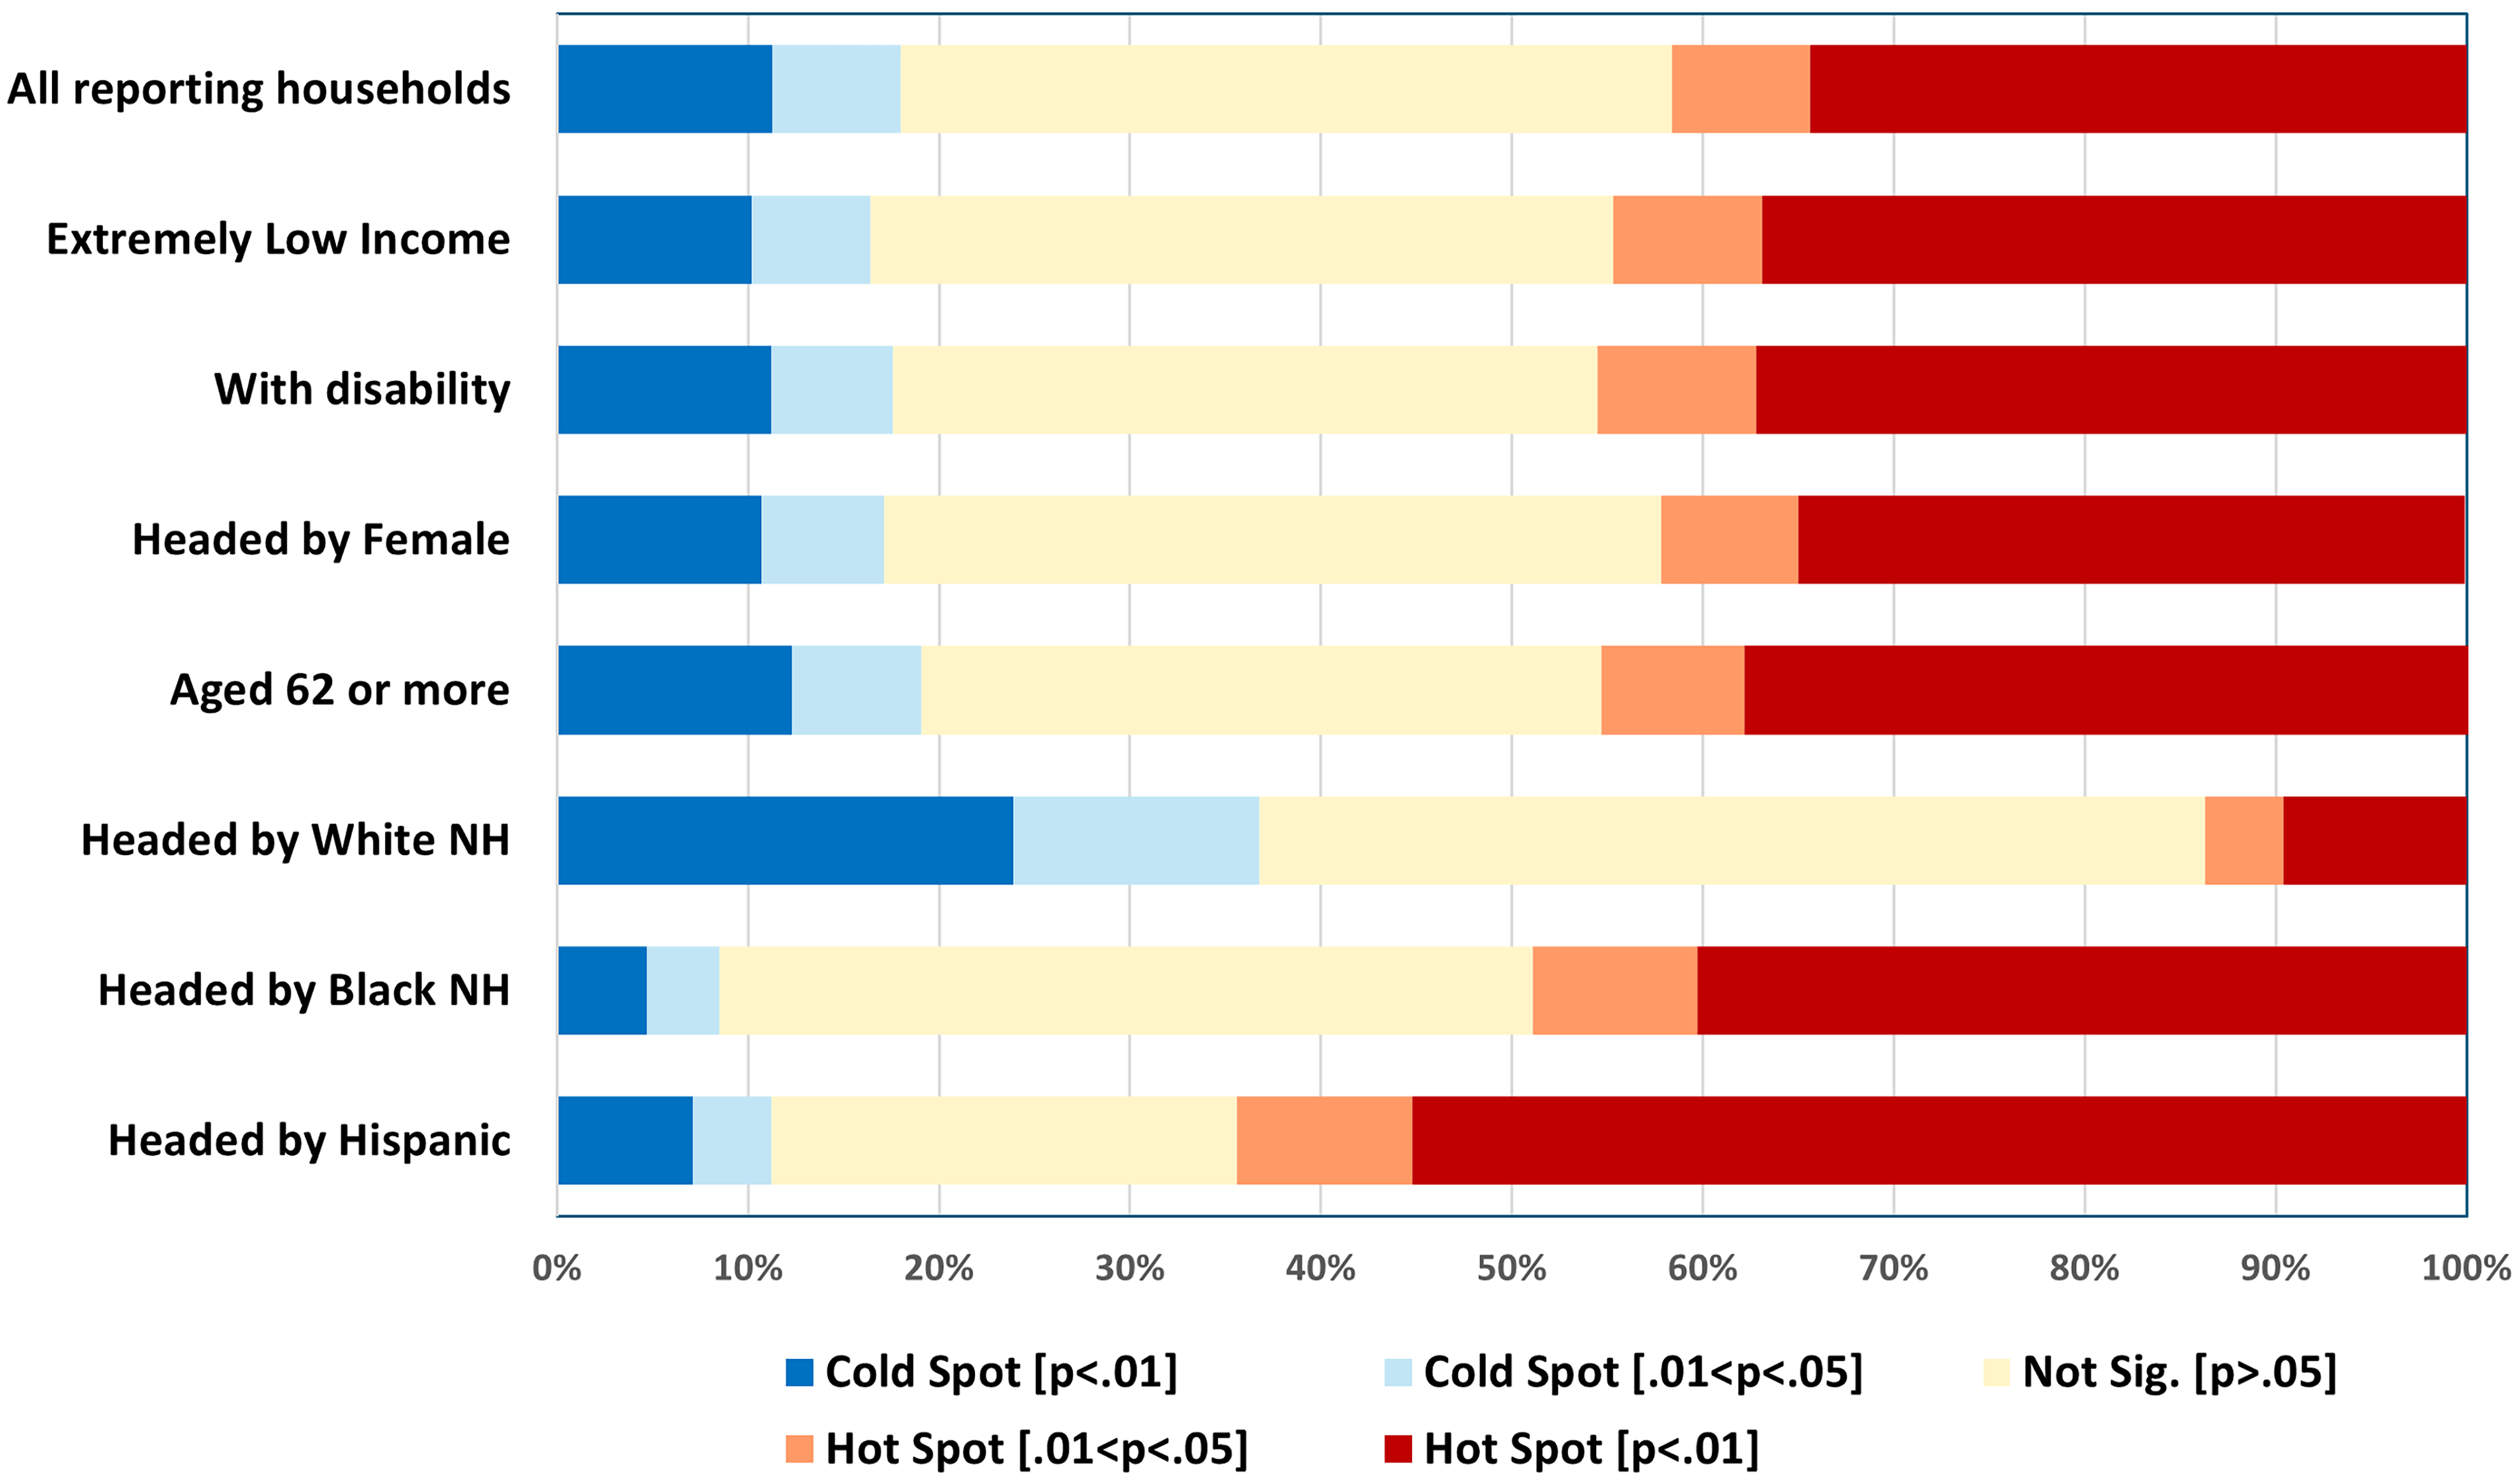
Sociodemographic characteristics of households residing in PHDs, based on the spatial statistical approach to estimating cumulative burdens (Getis-Ord Gi* statistic).
Sensitivity analysis
Results of the sensitivity analysis are presented in the Supplementary Data. Findings from the additive approach are like those from the spatial statistical approach, although percentages of PHD units (8%) and population (7%) in tracts with nine or more burdens are considerably smaller than those in tracts (36% and 35%, respectively) in the >99% level hot spot category. The spatial distributions of PHD locations and (additive) cumulative environmental burdens are shown in Supplementary Figure S1. The numbers and percentages of housing units and people residing in PHDs in each burden category are listed in Supplementary Table S1. Percentages of both PHD units and residents increase gradually as burdens increase from the lowest to the highest category, similar to the results presented in Table 1. Supplementary Figure S2 depicts how the number of PHD units and population, as a percentage of their respective U.S. total, changes across the (additive) burden categories. Almost one-half of both PHD units and residents are located in tracts with six or more burdens, compared to only about 15% of all non-PHD units and non-PHD population, respectively. Supplementary Table S2 summarizes the percentages of PHD households in each sociodemographic category by (additive) burden category. Percentages of extremely low-income households, as well as households headed by Black and Hispanic residents, increase steadily from the lowest to the highest category. Disability, female-headed, and oldest member aged 62 or more years indicate relatively minor and inconsistent changes, when the number of burdens increases. Supplementary Figure S3 shows the distribution of PHD households (as a percentage of their respective U.S. total) based on their sociodemographic characteristics in each (additive) cumulative burden category. With the exception of White-headed households, all groups are overrepresented in the two highest burden categories compared to the corresponding percentages for all reporting PHD households.
DISCUSSION AND CONCLUSION
This study extends EJ research on cumulative impacts by analyzing environmental burdens experienced by residents of federally subsidized public housing and implementing a spatial cluster detection technique to evaluate cumulative burdens. Our first research question sought to examine whether PHD units and residents are overrepresented in areas with higher cumulative burdens. Results indicated that overall percentages of both PHD units and residents are significantly greater (compared to their continental U.S. percentages) in areas designated as statistical hot spots (p < 0.05) based on the number of EJScreen burdens, but significantly smaller in areas classified as cold spots (p < 0.05). These hot spot areas collectively encompass more than 40% of both PHD units and population, but only about 20% of non-PHD units and population, respectively.
The second research question focused on investigating whether socially disadvantaged households residing in PHDs experience higher cumulative burdens. Comparisons with all PHD households in the continental U.S. indicate significantly higher percentages of extremely low-income, disabled, female-headed, elderly headed, Black-headed, and Hispanic-headed households, and lower percentages of White-headed households, in statistical hot spots (p < 0.05) based on the number of burdens. Specifically, our analyses revealed substantial racial/ethnic disparities within households residing in PHDs, with respect to increases in cumulative burdens. Hot spot areas (p < 0.05) collectively encompass almost one-half of Black-headed and two-thirds of Hispanic-headed households in PHDs, but less than 15% of White-headed households in PHDs. These disproportionately large concentrations of Black, Hispanic, and extremely low-income residents in PHDs within cumulative burden hotspots point to racial/ethnic and socioeconomic injustices in public housing locations that extend beyond our findings for Research Question 1 regarding the greater presence of PHD units and residents in neighborhoods with higher cumulative burdens.
In addition to providing new empirical knowledge of disproportionate environmental burdens for public housing residents, our study makes a methodological contribution by demonstrating how spatial cluster analysis based on the Getis-Ord Gi* statistic can be used for evaluating cumulative burdens and their EJ implications. While counting or summing the number of burdens represents a preliminary assessment of cumulative burdens, hot spot analysis based on a local indicator of spatial association provides a more statistically valid approach for identifying areas of EJ concern as clusters of neighborhoods (e.g., tracts) with significantly higher burdens, relative to the study area (e.g., continental U.S.). Since neighboring analytic units are considered in the calculation and classification of statistically significant hot spots, this approach also includes areal units with relatively fewer burdens that are often surrounded by units with higher burdens (as hot spots). These tracts would be classified as low-burden areas if only the count or number of burdens were used. From a practical perspective, identifying geographically contiguous clusters using spatial statistical methods instead of isolated areas with higher burden counts could be helpful for investigating particular processes or causal factors that produce disparate patterns, as well as informing interventions and mitigation.
While our study provides important findings on cumulative environmental burdens for PHD residents, it is important to consider several limitations. The first set of limitations is associated with measuring cumulative impacts only by counting the number of environmental burden indicators available in EJScreen 2.1 that exceed the 80th percentile threshold. While this measurement aligns with the EPA’s general approach to cumulative exposure assessment and emphasizes spatially varying exposures to well-documented human health hazards that are relevant nationally, it does not focus on hazards that may be especially relevant only in particular localities. It also weighs different health hazards equally due to insufficient data (e.g., on actual human exposures) and knowledge (e.g., on direct and synergistic health effects of exposures to each hazard) for implementing variable weights. Additionally, our analysis does not include other environmental risks such as heatwaves and natural hazards, as well as access to environmental amenities or benefits such as urban green spaces and parks. Future EJ research on cumulative impacts should consider a wider range of environmental hazards and risks, as well as access to amenities that provide environmental benefits in neighborhoods with PHDs. In future studies, we also plan to utilize multiple percentile values and explore how both the number of environmental burdens and the critical threshold level used to define these burdens influence the observed disparities.
A second limitation is that this study focuses exclusively on federally subsidized rental housing developments associated with HUD’s public housing program. Although public housing includes more residents than any other type of HUD-assisted rental housing,20 our study can be extended to evaluate cumulative burdens for properties supported by other HUD programs such as Section 202 (supportive housing for the elderly), Section 811 (supportive housing for persons with disabilities), and Section 8 project-based rental assistance. In addition to these place-based housing programs, it is important to examine subsidized rental housing affiliated with Section 8 Housing Choice Vouchers (HCVs)–a program used by tenants to subsidize their rents in the private market housing of their choice. Although locations of households using Section 8 HCVs are not available in the HUD Picture of Subsidized Households database utilized for this study, future research should explore additional data sources that can be used to evaluate cumulative environmental burdens for residents of Section 8 HCVs.
A third limitation is that our study is cross-sectional and did not investigate processes that are responsible for the disparate spatial patterns. Longitudinal data and analysis are necessary to understand the sequence of events that caused greater cumulative burdens in areas containing a significantly higher proportion of PHDs and PHDs with a higher proportion of socially disadvantaged households. More research is necessary to analyze the changing patterns of economic development, racial/ethnic migration, residential segregation, urban gentrification, and other processes or policies that led to the concentration of PHDs, and PHDs with a higher proportion of socially disadvantaged households, in overburdened neighborhoods.
A final limitation is that our EJ analysis of cumulative environmental burdens is based entirely on census tract-level data. Consequently, our statistical results are subject to the modifiable areal unit problem and sensitive to geographic scale and boundary definitions, 21 as well as the ecological fallacy, which can lead to biased inferences when patterns observed from aggregated data are made about individual entities or people. Future research should utilize other census units, such as block groups, to determine how the level of data aggregation influences our findings regarding PHD units and residents in areas with disproportionately higher burdens.
Previous research has emphasized the protective effects of public housing residence on health and demonstrated that specific environmental health outcomes (e.g., blood lead levels) for PHD residents may be better than those of low-income individuals who do not reside in PHDs.22,23 However, several studies have documented the negative health experiences of PHD residents compared to non-PHD residents.24,25,26 Individuals living in PHDs have reported higher rates of asthma, cardiovascular problems, and other chronic diseases, as well as limited access to resources such as safe exercise spaces and healthy food outlets.27,28,29,30 Disproportionate and cumulative burdens, like those assessed in our study, are likely to worsen the health of marginalized public housing residents. It is thus imperative for decision makers to use cumulative exposure assessment approaches, like those introduced here, to inform their decisions related to hazardous facilities and pollution sources (e.g., permitting and siting).7 Neglecting to do so will amplify the negative impacts of hazards on the health and well-being of PHD residents and exacerbate environmental injustices.
Our study demonstrates the importance of using cumulative impacts mapping and emerging geospatial methodologies to inform decisions regarding the locations of new subsidized housing developments for low-income households, so that the inequitable patterns of cumulative burdens highlighted here are not reinforced. Although the spatial cluster detection technique we implemented cannot explain causal mechanisms underlying the resulting hot spot areas, it can be applied to select and prioritize places for further investigation and mitigation. Neighborhoods in a hot spot cluster, for example, could be targeted for more precise interventions such as pollution prevention or reduction programs that seek to improve environmental health for overburdened communities, in general, and those with public housing, in particular. Like the EJScreen tool used for this study, our analysis is useful for the preliminary screening of locations where residents of PHDs are burdened by cumulative exposure disparities nationally. To better understand and address such disparities, case studies are needed of smaller geographic areas (e.g., regions, states, and large cities), including studies that take a more sophisticated approach to characterizing cumulative exposures (e.g., by including locally relevant hazards excluded from EJScreen, or weighting hazards based on regional or local knowledge of health effects). The recent removal of federal databases and screening tools on climate and environmental injustices, however, is likely to represent a major impediment to future advocacy, research, and policy interventions related to cumulative environmental burdens faced by socially disadvantaged individuals.
In conclusion, our study provides unequivocal evidence to indicate that public housing units and residents in the United States are disproportionately located in hot-spot areas, or neighborhoods with significantly higher cumulative environmental burdens. Within the population residing in PHDs, we found that Black, Hispanic, extremely low-income, and other socially disadvantaged households are more likely to reside in developments that are located in neighborhoods with significantly higher cumulative burdens. Our findings highlight the necessity to reverse these disproportionate patterns, as well as address gaps in environmental, public health, and housing policies that place such adverse and unfair environmental burdens on public housing residents.
AUTHORS’ CONTRIBUTIONS
J.C.: Conceptualization, data curation, formal analysis, methodology, software, visualization, writing—original draft, and writing—review and editing. T.C.: Conceptualization, methodology, and writing—review and editing. S.G.: Conceptualization, methodology, and writing—review and editing.
Footnotes
AUTHOR DISCLOSURE STATEMENT
No competing financial interests exist.
FUNDING INFORMATION
No funding was received for this article.
Supplemental Material
Supplementary Material
Please find the following supplemental material available below.
For Open Access articles published under a Creative Commons License, all supplemental material carries the same license as the article it is associated with.
For non-Open Access articles published, all supplemental material carries a non-exclusive license, and permission requests for re-use of supplemental material or any part of supplemental material shall be sent directly to the copyright owner as specified in the copyright notice associated with the article.