
Abstract
INTRODUCTION
Physical inactivity is a growing public health concern in the United States. 1 In 2020, 25.3% of Americans were physically inactive, and only 24.2% of adults ages 18 and over met the 2018 physical activity (PA) guidelines set by the Department of Health and Human Services. 2 While there are varying strategies to combat high levels of sedentary behavior, the World Health Organization notes the significance of the built environment and creating accessible, safe spaces in encouraging PA. 3 Within built environment research, there has been an increasing focus on the topic of neighborhood walkability and its potential in physical health promotion.4,5,6,7
Walkability is typically defined by characteristics such as street connectivity, residential density, and land use mix.8,9 Such characteristics are often compiled and used to create walkability indices, such as WalkScore™ and the Environmental Protection Agency’s National Walkability Index (NWI).10,11,12 Using these indices, several studies have reported positive associations between areas determined as highly walkable and PA but have also noted some limitations with these tools. 13 Despite variance in how walkability has been operationally defined, a growing body of research has reported that diverse individual and community factors are associated with levels of neighborhood walkability and, subsequently, PA.14,15,16 These factors range from sociodemographic characteristics (i.e., resident characteristics like age, gender, income, education, and location)17,18 to the social vulnerability of the population (i.e., social, cultural, economic, political, and institutional factors that influence socioeconomic disparities).19,20 For example, one national study in the United States found disadvantaged neighborhoods, as well as neighborhoods with more educated residents, had greater walkability, while communities with more vulnerable populations, such as children and the elderly, were less walkable. 21 Across the literature, several studies reinforce these findings, but few seek to examine how specific neighborhood structures promoting walkability (e.g., sidewalks) may vary based on different social vulnerability characteristics. 22
The concept of social vulnerability refers to the risk that communities face due to negative outcomes that may result from environmental, economic, and social challenges. 23 Scarce resources and a lack of support systems often exacerbate social vulnerability levels, putting certain populations at greater risk during crises or under ongoing stressors.24,25 In order to assist public health officials and emergency response planners in responding to and recovering from emergencies, the Centers for Disease Control and Prevention/Agency for Toxic Substances and Disease Registry (CDC/ATSDR) developed and maintains the Social Vulnerability Index (SVI). 26 Within the CDC SVI, 16 social factors are grouped according to four related themes (i.e., socioeconomic status, household characteristics, racial and ethnic minority status, and housing type and transportation) that rank census tracts from most to least vulnerable. In addition to an overall ranking, each tract is ranked separately for each of the four themes.
The CDC SVI has been used widely in research examining an array of health-related outcomes.27,28,29 For example, prior studies have linked SVI to disparities in chronic disease prevalence, PA levels, injury rates, and access to health care services.30,31,32 In addition, some research has identified the important relationship between some themes of SVI, such as housing type and transportation, and particular features of neighborhoods. For instance, neighborhoods with higher housing density, greater rates of crowding, and lower vehicle ownership (all factors within the SVI) often exhibit distinct walkability patterns, including more extensive sidewalk coverage and reliance on pedestrian and public transit infrastructure. 33 However, little research has directly explored how these specific components of social vulnerability are associated with disparities in neighborhood walkability.
The overall purpose of the present study was to investigate the relationship between social vulnerability and its four themes and the walkability level of neighborhoods. While social vulnerability has a potential contribution to the walkability of a neighborhood and, consequently, residents’ PA and health, few studies have specifically examined the association between the four themes of SVI and walkability. 34 Findings in related studies have been inconsistent and differed across regions. For example, in the Northeast, low-income neighborhoods were found to have greater access to sidewalks, while those in the Northwest had fewer sidewalks; high-income neighborhoods with more White residents in the West also had fewer sidewalks. 35 Additionally, existing studies often rely on coarse geographic units, such as counties or census tracts, which may obscure important within-city variation. 36 By conducting analyses at the block group level, this study provides more localized insights into neighborhood disparities in walkability infrastructure. Further, minimal studies investigating these relationships, especially those including educational attainment level as a social vulnerability factor, have been conducted in the Southeast United States, where substantial health disparities exist. 37 Consequently, using a large Southeastern city as a case study, the specific objectives of this study were to (1) examine disparities in sidewalk availability by social vulnerability and its four themes, and (2) examine disparities in neighborhood walkability by social vulnerability and its four themes.
METHODS
Study setting
This study occurred in the state capital of Columbia, SC, which contained an estimated 2022 population of 136,632 and a population density of 998.9 persons per square mile.38,39 Within this population, 49.21% of residents identified as non-Hispanic White, and 38.49% as Black or African American. As of 2022, 47.8% of the population had a Bachelor’s degree or higher, and the median household income was $56,175. 40 Given its demographic diversity, variations in urban form and pedestrian infrastructure, and well-documented regional health challenges, Columbia represented an ideal location to examine issues related to walkability and social vulnerability. Neighborhoods in Columbia were defined by 2020 census block groups; only block groups with greater than 40% of their area within the city limits were included, leading to a final sample of 115 block groups.
Measures
Social vulnerability
The CDC SVI is a tool for identifying and quantifying vulnerable communities’ social needs during public health emergencies. Using the SVI, counties and census tracts are ranked according to four themes—socioeconomic status, household characteristics, race and ethnicity, and housing type—which each contains multiple sub-factors. Theme 1, Socioeconomic Status, includes the variables below 150% of the federal poverty line, civilian unemployment over 61 years, housing cost burden (i.e., households spending 30% or more of income on housing costs), no high school diploma for people above 25 years old, and no health insurance. Theme 2, Household Characteristics, contains aged 65 and older, aged 17 and younger, percentage of civilians with a disability, single-parent households with children under 18 years old, and the percentage of people over the age of 5 who are of households not fluent in speaking English. Theme 3, Racial and Ethnic Minority Status, involves Hispanic or Latino (of any race) and all people who are not White and non-Hispanic. Theme 4, Housing Type & Transportation, includes multiunit structures, mobile homes, crowding, no vehicle, and group quarters (“persons who are in institutional and noninstitutional group homes”). 41 Figure 1 illustrates the aforementioned themes and their subcategories. Theme 5 is the average of all themes, representing an overall social vulnerability score for each county. 42 All variables are represented on a scale from 0 to 1, with higher percentiles (closer to 1) indicating greater social vulnerability.43,44
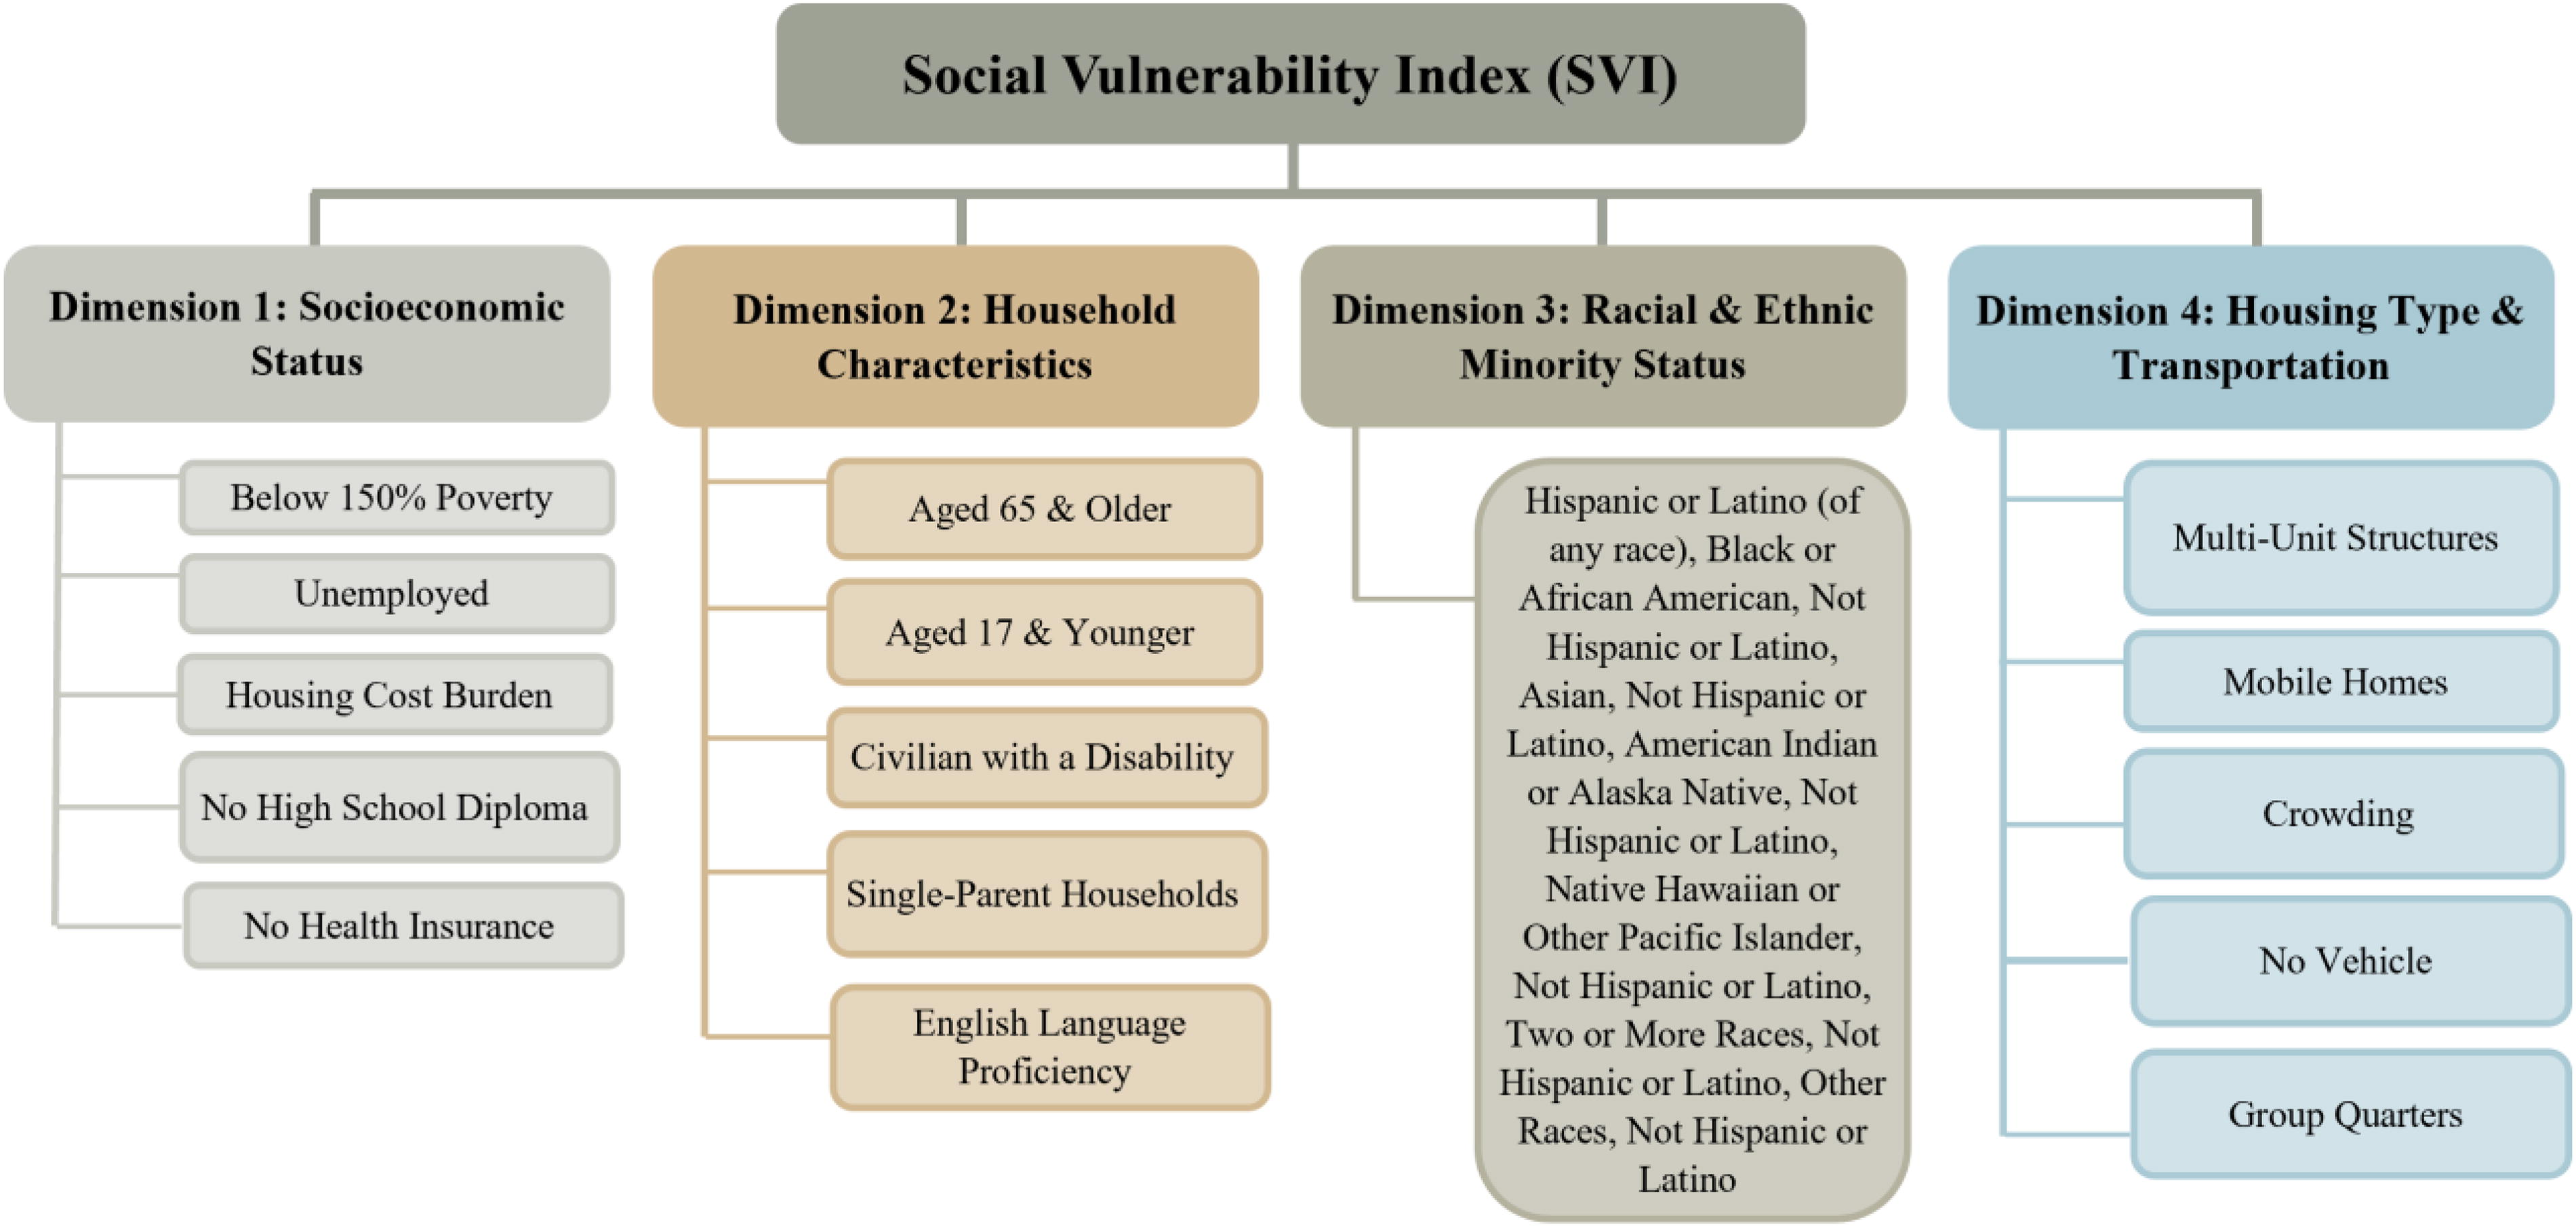
Social Vulnerability Index.
SVI is originally available at the county level. 45 However, this study used a dataset generated by and publicly available from Harvard Dataverse entitled U.S. Social Vulnerability by Census Block Groups that was created based on 2020 Census Bureau block group information. 46 Thus, an overall SVI score and a value for each of the four themes for each of the 115 study block groups were obtained from the dataset. In the case of minimal missing data for one or more themes, we imputed values for those block groups as necessary by averaging SVI values for all bordering block groups.
Sidewalk access
Sidewalk access was measured as the proportion of streets in each block group with sidewalks. Street and sidewalk data were provided by the City of Columbia GIS Department. 47 The “summarize within” function was used to determine the length of roads and the length of sidewalks within each block group. The length of sidewalks was then divided by the length of roads to calculate the percentage of roadways with sidewalks for each block group.
Neighborhood walkability
The walkability of each census block group was measured using the NWI. 48 The NWI calculates walkability scores for all block groups in the United States using a formula that includes street connectivity, land use mix, and accessibility to different locations.49,50 NWI scores range from 1 to 20, with higher scores indicating greater walkability (i.e., 1–5.75 is classified as least walkable, 5.76–10.5 below the average, 10.51–15.25 above the average, 15.26–20 most walkable). 51
Population density
The population density of each census block group was calculated by dividing the block group population by its total land area based on 2020 Census Bureau block group information. 52
Analysis
Linear regression was used to evaluate the relationships between overall SVI as well as each of its four themes and sidewalk access. Then, the linear regression was repeated to evaluate the relationships between overall SVI and each of its four themes with NWI. Population density served as a control variable within the analyses. Tests were conducted in SPSS 29.0 and considered significant at p < 0.05.
RESULTS
Table 1 presents descriptive statistics for overall SVI and its four themes, sidewalk coverage, and NWI across all study block groups. Overall, SVI had a minimum value of 0.0059 and a maximum of 0.9877, with an average of 0.6125 (standard deviation [SD] = 0.26). Block group sidewalk access ranged from 0% to 100%, with a mean of 49.34% (SD = 37.53). In addition, while NWI ranges from 1 to 20, the average NWI within Columbia block groups was 12.72 (SD = 3.09), with a minimum value of 2.00 and a maximum value of 17.83.
Characteristics of Columbia, SC, Block Groups (n = 115)
SVI, Social Vulnerability Index.
Table 2 presents findings from analyses examining associations between block group SVI and sidewalk access. Only the Housing Type & Transportation theme (Theme 4) showed a significant relationship, with greater vulnerability associated with increased sidewalk access (B = 86.52, p < 0.001).
Differences in Sidewalk Access by Social Vulnerability Across Columbia, SC, Block Groups (n = 115)
p < 0.001.
Table 3 presents findings from analyses examining associations between block group SVI and NWI. Again, there was a significant positive association between the Housing Type & Transportation theme (Theme 4) and NWI (B = 6.68, p = 0.002).
Differences in Neighborhood Walkability by Social Vulnerability Across Columbia, SC, Block Groups (n = 115)
p < 0.01.
DISCUSSION
This study investigated the relationship between different elements of social vulnerability and two key indicators of neighborhood walkability, including sidewalk access and the NWI. Interestingly, we found no significant associations between Theme 5 (overall SVI) or Themes 1 (Socioeconomic Status), 2 (Household Characteristics), and 3 (Racial and Ethnic Minority Status) and either sidewalk access or NWI, despite previous research noting that some of the subgroup characteristics of these themes had a significant association with walkability. For example, one study focusing on King County, WA, showed that there was an inverse relationship between walkability and social vulnerability in 46% of the neighborhoods. 53 Bereitschaft reported a fair distribution of highly walkable neighborhoods among areas with high social vulnerability, yet people living in a highly socially vulnerable neighborhood with a high level of walkability were likely to experience higher levels of personal crime (homicide, rape, robbery, assault), less accessible schools, and poorer transit accessibility. 54
Other studies regarding differences in social and economic status and neighborhood walkability have shown varying results. Using the 2019 Walk Score dataset,55,56 Conderino et al. 57 examined such differences across 500 cities in the United States and found an inverse relationship between income and mean Walk Score, with low-income cities having the highest average Walk Score and vice versa. In terms of household characteristics, some studies found that walkability around publicly assisted housing was inaccessible for all tenants.58,59,60 In addition, according to Conderino et al. 61 and Thornton et al., 62 predominantly White neighborhoods were less walkable and consisted of fewer walking supports. In contrast, Rigges claimed that in some regions, such as the San Francisco Bay area, Black residents lived in less walkable neighborhoods. 63 Our study likewise found a negative association between racial/ethnic minority status and accessibility to sidewalks and walkability, but our findings did not reach statistical significance, perhaps due to sample size limitations.
Importantly, our results showed a significant and positive association between Theme 4 (Housing Type & Transportation) and both sidewalk access and NWI. These findings are supported by some research, such as Zhang et al., 64 who reported that cheaper houses were associated with high walkability within the neighborhoods they studied. These findings are substantial and need careful investigation since it might be that as crowding (one factor within Theme 4) rises, sidewalk coverage and NWI increase. One explanation might be that people living in crowded houses and mobile homes with no vehicles are disadvantaged with low SES,65,66,67 yet their living areas have greater street connectivity compared with those in higher-income communities. 68 This could be due to a number of policies aiming to ensure high levels of amenities in neighborhoods with housing density and transportation issues. 69 Another explanation might be that wealthier people with access to vehicles eschew sidewalks and other walkability attributes in favor of a car-oriented lifestyle. 70 Overall, these results align with broader literature suggesting that neighborhoods with higher housing density, lower rates of vehicle ownership, and greater reliance on public transportation often feature more extensive pedestrian infrastructure. 71
The patterns observed in this study also connect to broader issues of environmental justice, transportation equity, and structural urban inequalities. The finding that neighborhoods with higher housing and transportation vulnerability exhibit greater sidewalk access and walkability may reflect historical patterns of development in denser, lower-income urban areas, where residents have long relied on walking and public transit out of necessity. It is, however, critical to note that pedestrian infrastructure quality and safety often vary in these areas and that sidewalk conditions, maintenance, and connectivity can still result in inequitable mobility experiences. 72 Furthermore, socially vulnerable neighborhoods frequently face overlapping burdens, including proximity to highways or industrial land uses, limited access to green space, and higher exposure to traffic-related air pollution, all of which intersect with walkability and influence health outcomes. 73 These dynamics underscore the importance of not viewing walkability as an isolated built environment feature but as part of a larger urban infrastructure system that can perpetuate or mitigate environmental injustice.
Studies such as the present one have important implications for public health and urban planning and should be conducted more widely in communities to inform policies and interventions aimed at reducing disparities in access to key environmental resources. Specifically, neighborhood walkability and sidewalk access are critical determinants of PA, which is closely linked to the prevention of obesity, cardiovascular disease, diabetes, and other chronic conditions. 74 In socially vulnerable neighborhoods, where residents may have limited access to private vehicles and greater reliance on walking or public transportation, the availability and quality of pedestrian infrastructure become even more essential for supporting daily mobility and access to key resources such as employment, education, health care, and healthy food. The present findings highlight that patterns of walkability are not uniformly distributed but vary systematically with dimensions of social vulnerability, particularly housing type and transportation factors, which capture aspects such as housing density, vehicle access, and reliance on alternative transportation modes. From an urban planning perspective, the results underscore the importance of prioritizing sidewalk investments and walkability improvements (e.g., expanding sidewalk networks, improving sidewalk quality and connectivity, enhancing pedestrian safety features, designing to meet the requirements of the Americans with Disabilities Act) in underserved neighborhoods, especially those with high housing and transportation vulnerability. Policymakers and planners should also consider how broader factors, such as transportation planning, zoning, and historical patterns of disinvestment, shape neighborhood walkability and contribute to persistent health disparities. As an example, they might prioritize zoning reforms to support mixed-use development, sidewalk connectivity construction in new projects, and barrier removal, like excessive parking requirements that discourage walkability. By highlighting these connections, this study provides a foundation for future efforts to design healthier and more equitable urban environments.
This study was one of the first to explore social vulnerability at the block group level in relation to walkability resources within a Southeastern U.S. city, a region where health disparities are disparagingly high.75,76 However, it had several limitations. First, it occurred in only one metropolitan area, and the findings may not be generalizable to other areas in the U.S. Southeast or beyond. Additionally, some SVI information for certain block groups was missing, which required us to calculate SVI values based on adjacent block groups. Further, this study focused only on neighborhood supports for walking and did not assess other built environment factors that may influence PA and health in each block group, such as crime or access to parks and recreational facilities. In addition, our measures did not include access to key amenities such as grocery stores, workplaces, or public transit, nor did they account for the impacts of transportation barriers (e.g., highways) or urban planning histories (e.g., redlining) that may influence walkability patterns. Also, this study was conducted exclusively in a primarily urban and suburban setting, and findings may not translate to rural areas where different factors shape walkability. Additionally, other related elements, such as sidewalk condition and surrounding land uses, were not included when measuring sidewalk access and neighborhood walkability. Finally, we did not account for the walkability impact on any health outcomes.
Further research is needed to explore associations between SVI, sidewalk access, and walkability in other metropolitan areas to better assess how social vulnerability and walkability interact in diverse settings. Additionally, future studies should consider examining broader geographic scales, such as at the county or state level, as well as urban and rural areas, to enhance the generalizability of their findings. To fully understand the relationship between the built environment and PA, future investigations could also delve into microscale aspects of sidewalks and walkability using audit tools. 77 Additionally, exploring the role of other built environment factors, such as access to parks and recreational facilities, and their juxtaposition with walkability, can provide a greater understanding of how to promote health equity and mitigate disparities in PA, obesity, and health across regions. Because disparities in walkability likely contribute to disparities in PA, access to services, and ultimately health outcomes, 78 further research is needed to directly assess these relationships. For example, scholars are encouraged to use the newly developed Environmental Justice Index, 79 which integrates social vulnerability with environmental and health burden indicators, 80 offering a comprehensive framework for examining how overlapping exposures may influence neighborhood walkability and access to supportive infrastructure. Other research could also examine how individual subgroup factors of each theme or the combinations of various factors/themes of SVI impact sidewalk availability and walkability.
CONCLUSION
The complex relationship between social vulnerability and neighborhood walkability was comprehensively explored in this study spanning the capital city of Columbia, SC. A significant positive correlation was found between SVI Theme 4 (Housing Type & Transportation) and multiple walkability indicators, suggesting that certain vulnerable communities may benefit from better urban infrastructure, possibly as a result of policies and practices targeted at improving connectivity in densely populated areas. In contrast, nonsignificant associations were found between other SVI themes and walkability, suggesting the need for a more comprehensive examination of how social vulnerability impacts urban design and access to walkable spaces. Considering these findings, urban planning and public health professionals should take social vulnerability into account when developing policies and interventions to reduce health disparities. Further, it would be beneficial to examine these relationships in other metropolitan areas, account for additional resources such as parks and recreation facilities, and consider microscale factors affecting walkability, such as sidewalk condition and surrounding land uses, to gain a comprehensive understanding of the relationship between the built environment, social vulnerability, and community health. Overall, we suggest future studies expand such a relationship with a special focus on exploring how the patterns observed in this study—such as the association between housing and transportation vulnerability and walkability—may contribute to or mitigate health disparities in different urban contexts.
Footnotes
AUTHORS’ CONTRIBUTIONS
K.M.T.: Data curation, writing—original draft, formal analyses. F.H.S.: Data curation, formal analyses, writing—reviewing and editing. S.H.H.: Writing—original draft, investigation. A.T.K.: Methodology, funding acquisition, writing—reviewing and editing.
ETHICS APPROVAL AND CONSENT TO PARTICIPATE
Not applicable. We used datasets that are publicly available.
AVAILABILITY OF DATA AND MATERIALS
The datasets used and/or analyzed during the current study are available from the corresponding author on reasonable request.
AUTHOR DISCLOSURE STATEMENT
No competing financial interests exist.
FUNDING INFORMATION
This study was supported by the University of South Carolina, Office of Research.