
Abstract
Objective:
The environmental justice (EJ) literature has focused on the link between residential pollution and racial and ethnic demographics, as well as socioeconomic status. Yet, many adults spend a significant amount of time at work. EJ effects in workplaces are little, if at all, examined. Here, we add consideration of workplace environmental disparities to EJ research.
Methods:
We use multivariate regression analysis to investigate work-area ambient pollution and sociodemographics. We analyze the following research questions: What patterns exist between workplace ambient pollution and the proportion of minority workers? May wage mechanisms explain such patterns? For employees’ sociodemographics, we use census tract-level data from the Longitudinal Origin-Destination Employment Statistics (LODES) dataset, and we measure pollution burden using data from CalEnviroScreen 4.0.
Results:
Work-area ambient pollution varies systematically by race and ethnicity in California. Specifically, increases in the percent of Hispanic, Black, and Asian workers are associated with more-polluted tracts. Based on market rational risk response, we expect that workers require more wage compensation to work in more-polluted areas. However, we find that such compensation is lower for Hispanic, Black, Asian, and Native American employees.
Conclusions:
These results highlight potential inequities concerning workplace EJ. Knowing that minority people are working in disproportionately polluted areas exacerbates health concerns around the already-known residential EJ effects. To improve public health, policies such as the California Clean Air Technology Initiative should jointly consider residential and work-area exposure.
Keywords
INTRODUCTION
In the first volume of this journal, Sokas, the Professor of Environmental and Occupational Health Sciences at the University of Illinois at Chicago, published a discussion titled “Environmental Justice and Work.” 1 In it, she points out that good work is important to good health, but that work outputs often include hazards that impact neighborhoods, and that the “inequitable distribution of both the benefits and the hazards generated by…work lies at the heart of the environmental justice movement.” 2 Indeed, especially because many adults spend much of their waking time in employment, “Work is among the important social determinants of health.” 3
Public health scholars often study occupational safety and health, and there has been a study of workplace discrimination and consequences. 4 For their part, environmental justice (EJ) scholars focus on the relationship between residential pollution levels and residents’ sociodemographic features (e.g., race, ethnicity, and education), and sometimes explicitly on their health outcomes. 5 But, in spite of Sokas’s conclusion that “The recognition of the interrelationship between work, home, community, and society, and the importance of justice in each of these spheres, is needed to develop, evaluate and sustain effective interventions,” 6 there are few, if any, EJ analyses of where people work—and none that we could find in the Environmental Justice journal. 7 This article aims to begin filling this gap by, first, examining links between workers’ sociodemographic attributes and the pollution levels of the census tracts within which they work—which we refer to as workplace ambient pollution—and, second, analyzing one mechanism that may help explain these links.
By using multivariate linear regression models to analyze data from the 2019 Origin-Destination Employment Statistics (LODES) dataset and the 2021 CalEnviroScreen 4.0 dataset, both at the census-tract level, we find empirical evidence that census-measured racial and ethnic minorities are disproportionately exposed to work-area ambient pollution: A larger proportion of Hispanics, Black or African Americans, and Asian Americans working within a Californian census tract is associated with a higher pollution burden for that tract, holding all else constant. Also, while there appears to be wage compensation for increases in pollution burden in the work tract, the estimated compensation is lower for Hispanic, Black, Asian, and American Indian workers than for White non-Hispanic workers. Though much more analysis is needed, this may indicate that the former are less sensitive to increases in pollution than to increases in wages, perhaps because they have fewer job opportunities than the latter. 8
The remainder of the paper is organized as follows. Part II provides a review of the EJ literature and then presents studies relevant to EJ effects in workplaces. In Part III, we present the data, Hypothesis 1, and the model used for hypothesis testing. Part IV provides and interprets results. In Part V, we consider a potential explanation for the findings regarding racial and ethnic minority workers and pollution burdens. Finally, Part VI summarizes the study and discusses its contributions to the EJ literature and its implications for policy.
LITERATURE REVIEW
In the EJ literature, studies predominantly highlight systematic inequalities regarding residents’ sociodemographics and the levels of pollution in their residential areas. Mohai, Pellow, and Roberts 9 ; Agyeman et al. 10 ; and Banzhaf, Ma, and Timmins 11 review the emergence and development of EJ studies and conclude that the main arguments of the vast majority converge to one: Exposures to pollution (in air, water, soil, etc.) are unequally distributed by race and ethnicity and/or income. To list only a few among a large set of empirical findings: Nationwide research conducted by the United Church of Christ (UCC) examines the United States in 1986 and concludes that non-White residents are much more likely to be exposed to hazardous waste sites than White households 12 ; a few years later, Bullard conducts community-level case study research on toxic facility siting, which was found to mainly affect the poor, elderly, and non-White communities 13 ; Bryant and Mohai later reaffirm the phenomenon, further supplementing the EJ literature. 14 Combined, their works affirm that harmful pollution has been systematically affecting minority groups in their residential areas, thereby reinforcing UCC’s call that “No residential community, regardless of race, should be left defenseless in the midst of this mounting crisis.” 15
However, these foundational EJ studies have some shortcomings. As noted by Pollock and Vittas, they tend to lump racial and ethnic groups together, exhibit methodological biases, leave substantial variance unexplained, and understate “the presence of harmful environmental substances and the potential for human exposure.” 16 Lumping together racial and ethnic groups is quite common in earlier EJ research, but is less useful because systemic biases regarding racial and ethnic groups vary, with especially strong evidence for African Americans, and less strong evidence for some other groups. Putting all census-measured minoritized groups together, in essence, provides only a mean response over all measured races and ethnicities, blurring the reality for certain groups. In fact, some research evidence indicates that American Indians may be the one census-measured minority group that actually resides in less-polluted environments on average than do White non-Hispanics on average. 17 Including a group whose coefficient is positive with groups whose coefficients are negative reduces the magnitude of the negative coefficient for the “non-White” groups, implying less environmental injustice than actually exists for some groups.
By adopting new datasets and more advanced research methods, a recent study finds that more-populated, Whiter, higher-income, and less-Hispanic census tracts in 1981 are associated with more significant reductions in
However, what EJ scholars often overlook is the mobility of individuals. As Kim and Kwan point out, “…previous studies assumed that people are static and remain in their residential neighborhoods and considered a fixed residential administrative unit (e.g., a census tract) as the most important and relevant neighborhood where air pollution affects people,” 24 a bias also known as the neighborhood effect averaging problem (NEAP), and one which, in essence, assumes that all pollution exposure is residential exposure, though this could overstate or understate true exposure. Using one-day activity-travel diary data from the Los Angeles Metropolitan Statistical Area, these two scholars conclude that air pollution exposure estimates could be erroneous because they disregard individuals’ mobility. Also, figures created by the California Employment Development Department’s Labor Market Information Division showing employees’ county-to-county commuting patterns provide a counterexample to the residential-pollution-only assumption. 25
Despite Kim and Kwan’s call for attention to individual mobility and Sokas’s emphasis on the interrelationship between home and work, we do not find many work-location EJ studies in the existing literature.
26
Previous research in Florida in the 1990s considers the role of occupational choices in explaining the variation in residential pollution exposure, but this factor is overshadowed by the effects of racial inequality.
27
Some early pioneering empirical evidence by Friedman-Jiménez suggests that “African-American, Latino and probably Asian, Pacific Islander, Caribbean, and Native American workers…, especially those in low-paying agricultural, manufacturing, service, and manual labor jobs, tend to be at higher risk for occupational diseases, injuries, and disability…caused by exposure to toxic substances or hazardous conditions in the workplace.”
28
Similarly, in Robinson’s book Toil and Toxics: Workplace Struggles and Political Strategies for Occupational Health, he collects data from the California Workers’ Compensation reporting system and finds that occupational hazards and pollution affect Black and Hispanic male workers at higher levels than White male workers, a pattern also observed among female workers.
29
However, note that the reporting system only collects information from those who report an injury. Murray uses theories and related evidence to argue that low-income, minority, and immigrant workers tend to work in industries with higher amounts of workplace pollution, also known as “job ghettos.”
30
Saville and Adams conduct qualitative research into workplace pollution and conclude that Black women muck farmworkers in Apopka, Florida, are disproportionately affected by pesticide and nutrient pollution, as compared with Black male and non-Back farmworkers and other non-farmworker populations because the former are primarily assigned to work in the fields, where those types of pollution are most relevant.31,32 Nevertheless, this finding is limited in scope due to analyzing a single town. It is only recently that Stephan-Recaido et al. and Shkembi et al. adopt sophisticated quantitative approaches to studying workplace EJ in the United States. They find empirical evidence that racial and ethnic minority workers are “overrepresented in exposure to work-related chemical hazards” in the former case and are “disproportionately burdened by cumulatively high occupational and environmental exposures” in the latter.
33
Using the 2011–2018 LODES data, de Souza et al. find that first, in general, people are exposed to more
Following the line of the previous study, our analysis looks only at California, rather than the entire country, which allows us to improve on de Souza et al.’s research by using a multifaceted measure of pollution burden that includes
DATA, HYPOTHESIS, AND MODEL
Data
We analyze data from the 2019 Origin-Destination Employment Statistics (LODES) dataset under the U.S. Census Bureau’s Longitudinal Employer Household Dynamics (LEHD) program. 36 The Census Bureau creates the LEHD through its census and survey data coupled with state administrative records. The LODES is a specific dataset produced under the LEHD that includes information on all civilian employment covered by unemployment insurance in each industry sector. 37 This dataset contains race, ethnicity, gender, age groups, education groups, and monthly income groups variables. It is set at the census-block level, smaller areas than census tracts.
We then merge the LODES dataset with the 2021 CalEnviroScreen 4.0 dataset. The Office of Environmental Health Hazard Assessment (OEHHA) of the California Environmental Protection Agency develops the CalEnviroScreen Score (known as CESScore) as a component of the dataset and uses the score as a metric, with multiple indicators, to measure pollution and EJ. 38 One such indicator in the CESScore is the pollution burden, which is an aggregation of pollution indicators into a percentile rank for a census tract in California (as shown in Table 1). 39 The higher the pollution burden percentile, the higher the ambient workplace pollution. 40
Thirteen Components of the Pollution Burden Score
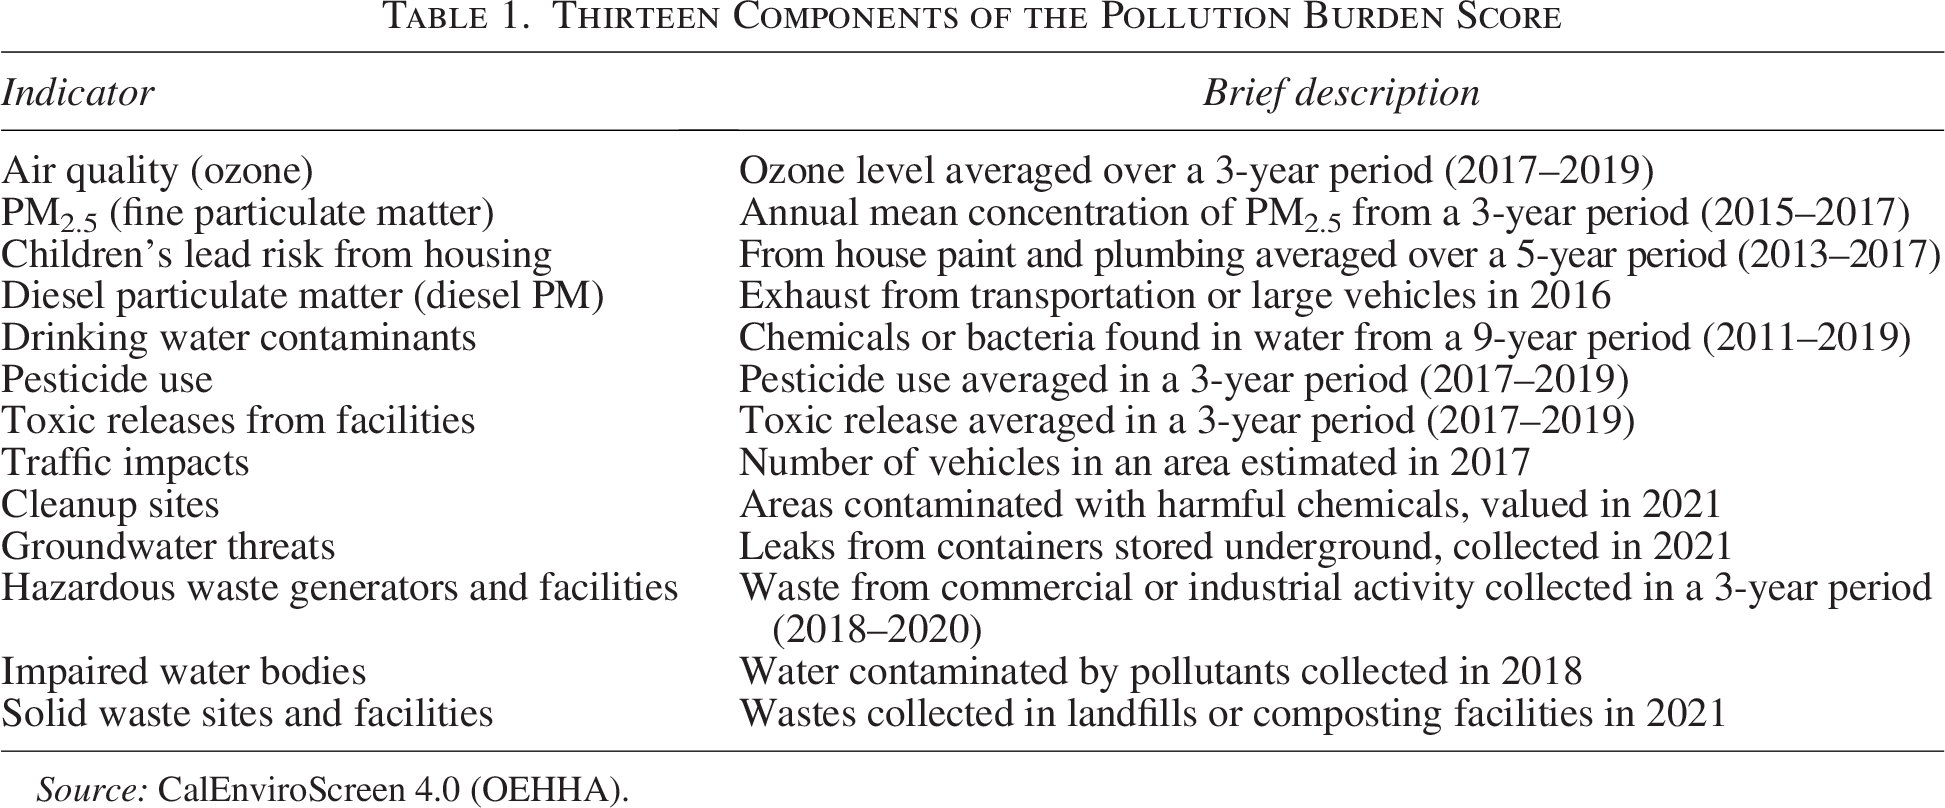
Source: CalEnviroScreen 4.0 (OEHHA).
Because the pollution burden data are collected at the census-tract level, the LODES data must be aggregated to the same level. We remove the last digit of the geographic identifier code in the LODES dataset and find census-tract-level sociodemographic values by calculating population-weighted means using census-block LODES data. The LODES dataset results in a total of 8057 census tracts, while the CalEnviroScreen dataset includes 8035 tracts. When we merge these two, a total of 8028 census tracts remain with data from both sources. The reduction in the number of tracts during the merging process occurs because some tracts lack LODES data, while others lack CalEnviroScreen data. Table 2 presents the summary statistics for variables of interest from the combined LODES and CalEnviroScreen data, and Table 3 shows medians by quartiles, which allows early examination of (uncontrolled) trends between pollution levels and sociodemographics.
Traditional Summary Statistics for Pollution Burden and Sociodemographics of Workers by Californian Census Tracts
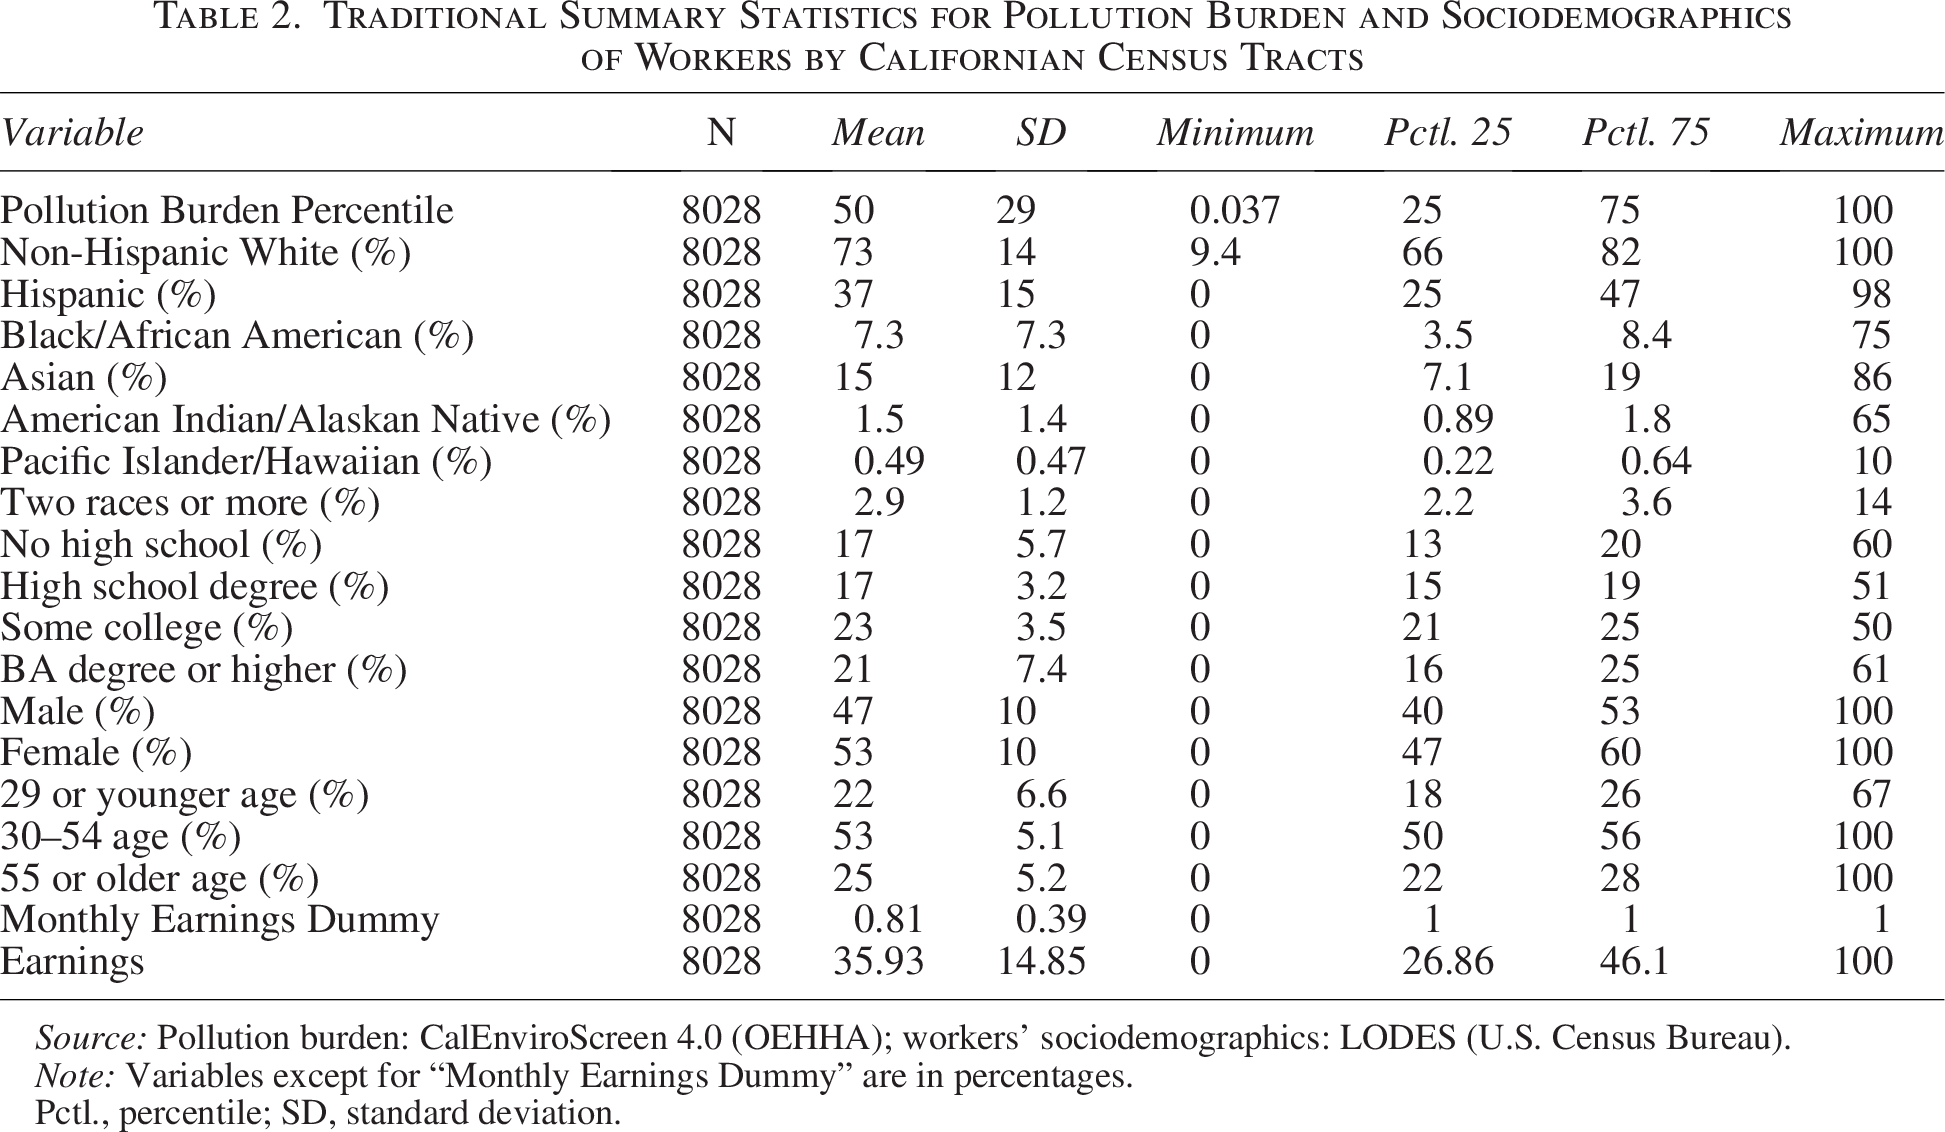
Source: Pollution burden: CalEnviroScreen 4.0 (OEHHA); workers’ sociodemographics: LODES (U.S. Census Bureau).
Note: Variables except for “Monthly Earnings Dummy” are in percentages.
Pctl., percentile; SD, standard deviation.
Summary Medians for Pollution Burden and Sociodemographics of Workers in Californian Census Tracts by Quartiles
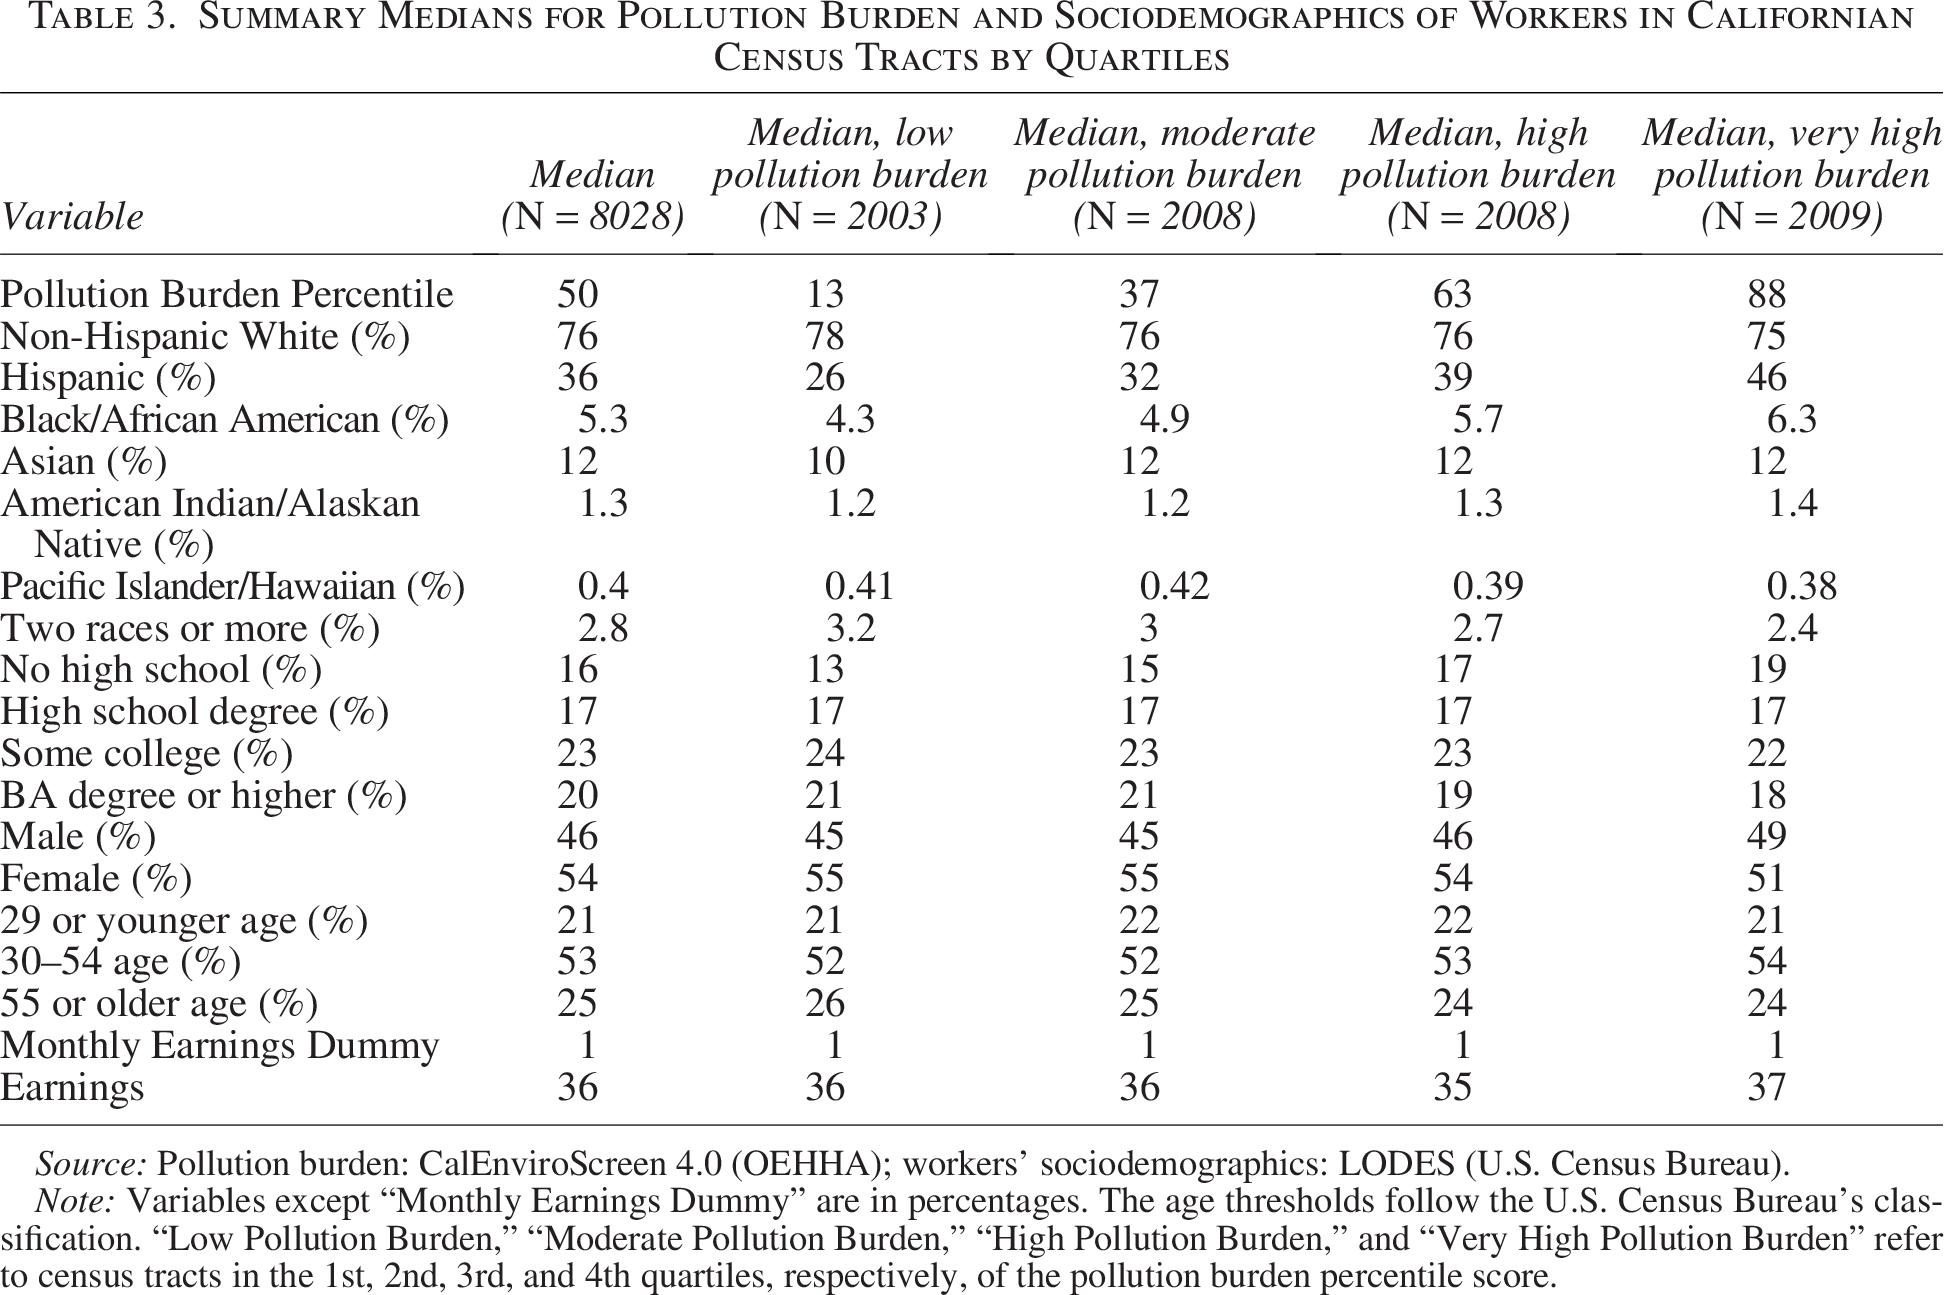
Source: Pollution burden: CalEnviroScreen 4.0 (OEHHA); workers’ sociodemographics: LODES (U.S. Census Bureau).
Note: Variables except “Monthly Earnings Dummy” are in percentages. The age thresholds follow the U.S. Census Bureau’s classification. “Low Pollution Burden,” “Moderate Pollution Burden,” “High Pollution Burden,” and “Very High Pollution Burden” refer to census tracts in the 1st, 2nd, 3rd, and 4th quartiles, respectively, of the pollution burden percentile score.
“Pollution Burden Percentile” is the percentile rank of pollution burden for each census tract. It is a continuous variable that ranges from 0 to 100, with 0 meaning this tract’s pollution burden is heavier than 0% of the other tracts in California and 100 meaning that it is heavier than 100% of the other tracts. Most of the variables in Table 2 tell various facets of the sociodemographics of the workers in each census tract (race and ethnicity, education, gender, age, etc.). An additional variable included in the table is “Monthly Earnings Dummy,” which is used as a control in our analysis. It is a dichotomized variable, with 1 indicating when the percentage of workers making $3,333/month or lower is greater than that of workers making more than $3,333/month in the census tract. 41 “Earnings” is a continuous variable that runs from 0 to 100, with 0 meaning 0% of the employees in the census tract earn more than $3,333/month and 100 meaning that 100% of them make more than $3,333/month. All variables except for “Monthly Earnings Dummy” are in percentages. From Table 3, preliminary evidence is found that the most burdened tracts (those in the 4th quartile of the pollution burden score) also have the highest median proportion of Hispanic, Black, Asian, and American Indian workers.
Hypothesis 1 and Model 1
To begin with, a multiple linear regression model with ordinary least squares estimation is used to identify the sociodemographic factors of workers that are associated with the pollution burden of census tracts in California. The regression output allows us to quantify the race, ethnicity, education, sex, wage, and age groups in disproportional pollution burden compared with White non-Hispanics, highly educated (i.e., with BA degrees or higher), male, higher-wage, and middle-aged workers.
Race and ethnicity are key predictors in EJ research. Past studies show that marginalized racial and ethnic groups face disproportionate environmental hazards.
42
Therefore, the first hypothesis (Hypothesis 1 or All else being equal, higher proportions of racial and ethnic minority workers in a census tract are related to higher pollution burden in that tract.
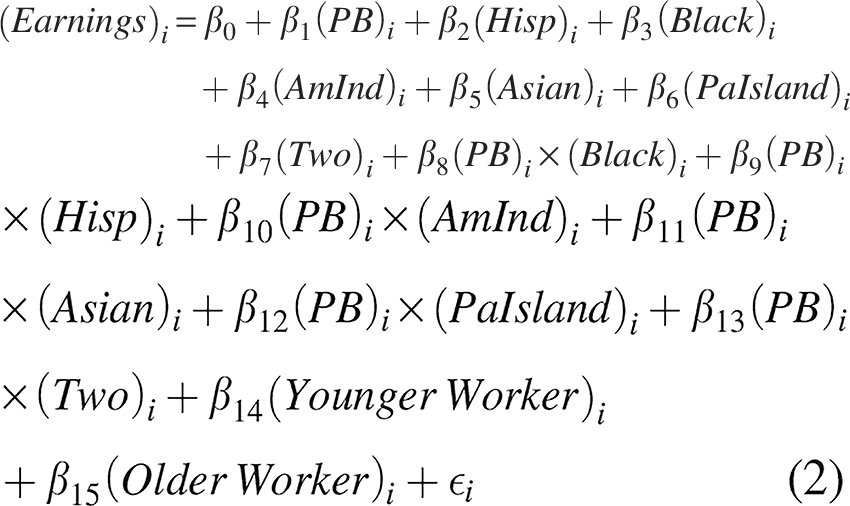
H1 can be tested using the following model (Model 1):
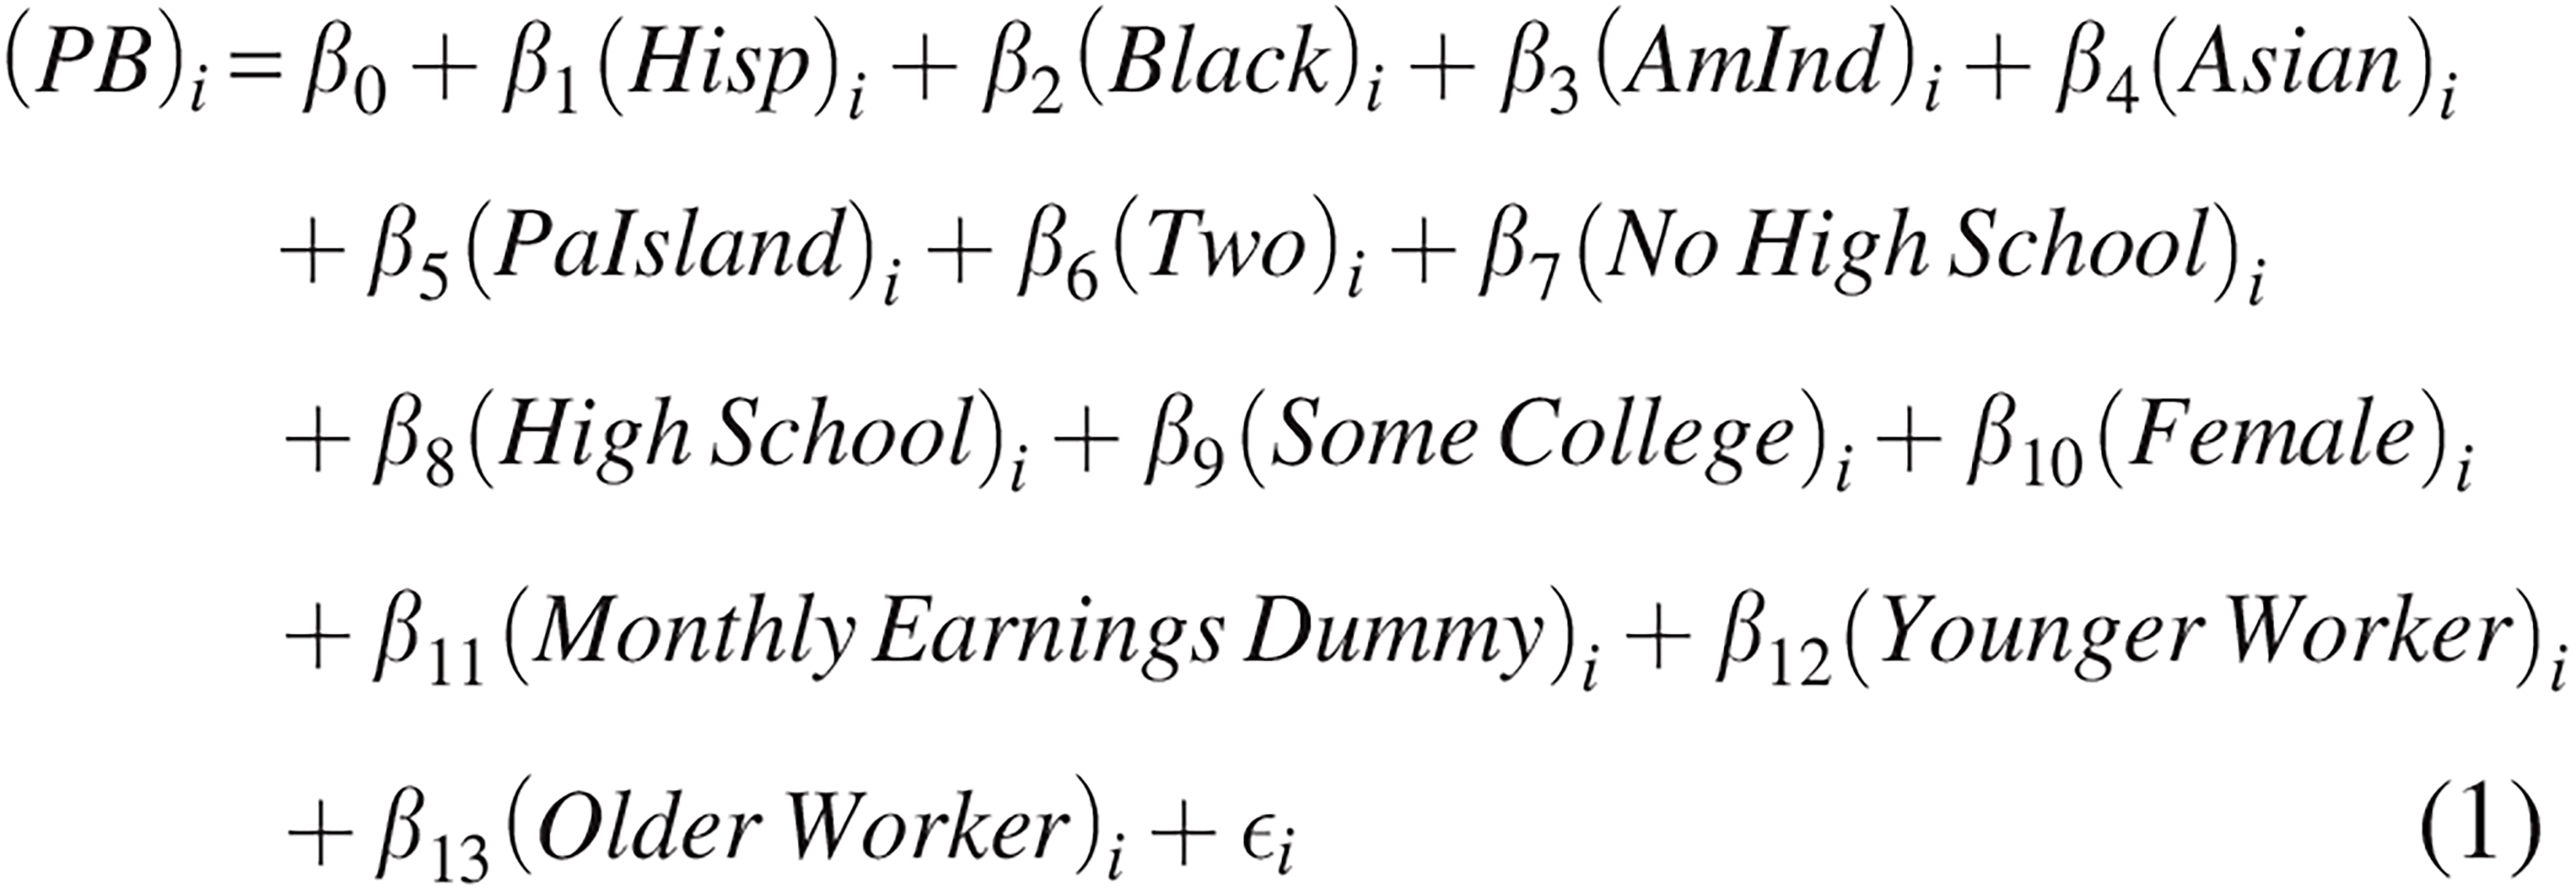
RESULTS FOR HYPOTHESIS 1
Spatial data, such as census-tract-based data, usually exhibit spatial serial correlation, which biases estimates of the standard errors (SEs). Therefore, we apply the Global Moran’s I test to the pollution burden percentile variable and detect positive spatial correlation, as shown in Supplementary Table S3. 43 Because we are also concerned with potential heteroskedasticity in the model, we run the White test (see Supplementary Table S2 for the test results). 44 It yields a test statistic of 871 (df = 104, p = 0.000). As p < 0.05, we reject the null hypothesis of homoskedasticity. Therefore, we analyze the model with heteroskedasticity-robust SEs. We employ the Newey–West variance estimator, which is robust to both heteroskedasticity and autocorrelation (sometimes referred to as a HAC estimator) (Model 1). 45 The results of hypothesis testing for Equation 1 are summarized in Table 4.
Results for Analysis of Pollution Burden Percentile as a Function of Workers’ Race and Ethnicity with Newey–West (HAC Robust) Standard Errors (Model 1)
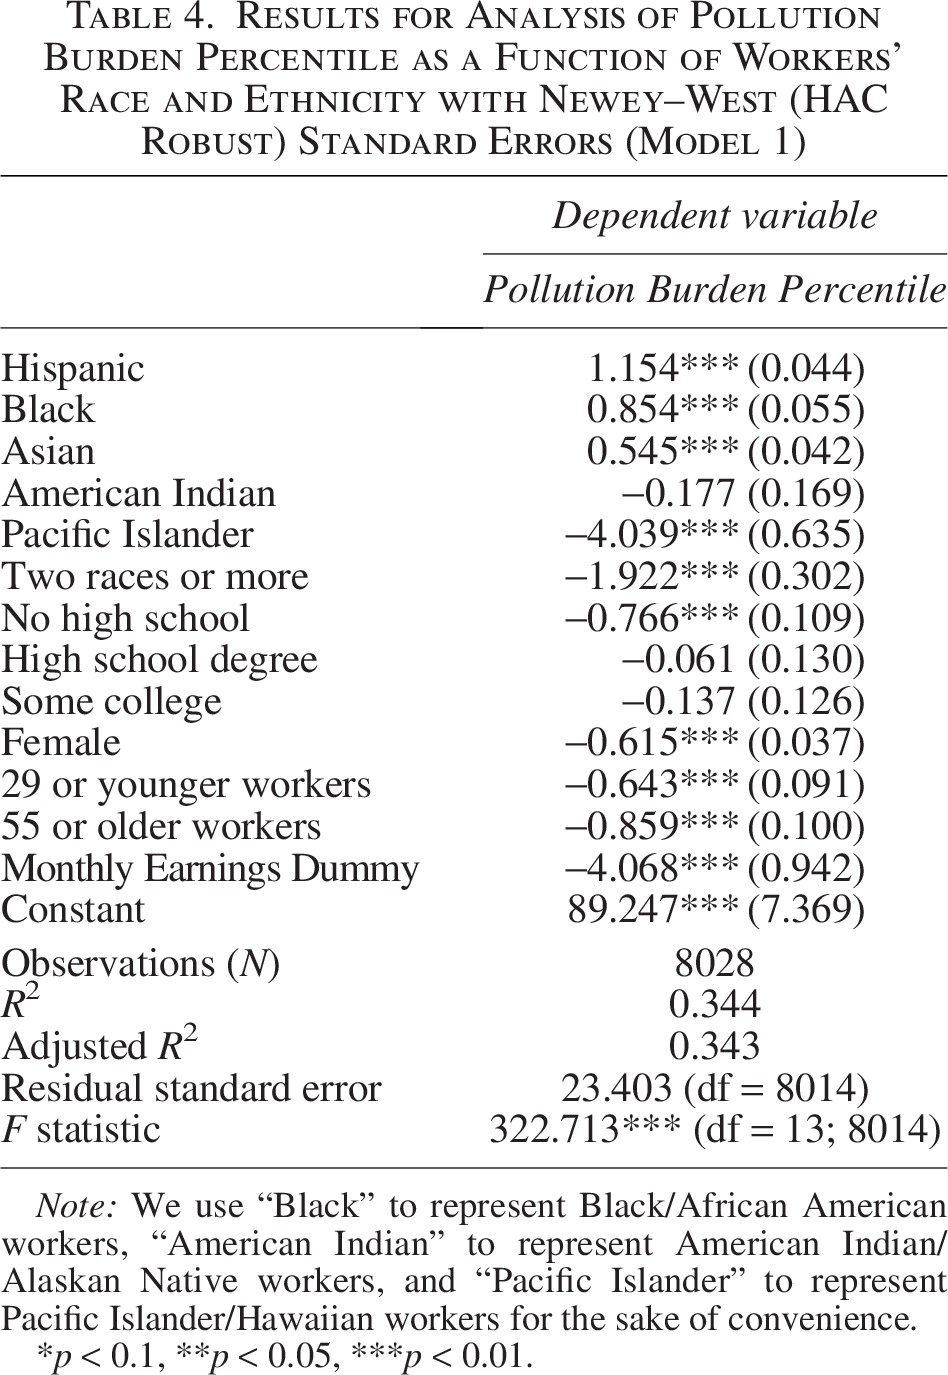
Note: We use “Black” to represent Black/African American workers, “American Indian” to represent American Indian/Alaskan Native workers, and “Pacific Islander” to represent Pacific Islander/Hawaiian workers for the sake of convenience.
*p < 0.1, **p < 0.05, ***p < 0.01.
As Table 4 shows, Hispanics, Blacks or African Americans, and Asians are disproportionally working in census tracts with a higher pollution burden, holding all else constant. Increasing any of these populations by 10 percentage points is estimated to result in 12-percentile, 9-percentile, and 5-percentile increases in pollution levels, respectively, from the baseline (i.e., a tract with only White non-Hispanic workers). Such effects are all statistically significant.
However, American Indian or Alaskan Native, Pacific Islander or Hawaiian, and “two or more races” employees are estimated to work in less-polluted tracts than White-non-Hispanics-only tracts, though the effect of percentage increases in American Indian/Alaskan Native workers is statistically insignificant. The finding for American Indians is consistent with previous research in the EJ literature; it is hypothesized that this may be because native tribes possess distinctive environmental authority over uses of their own (reservation) lands. 46 But additional research is needed.
“Two races or more” is a unique but elusive group due to the nature of its own description. This category was first included by the U.S. Census Bureau in 2000. 47 However, by its nature, this category lacks granularity regarding the possible array of combinations of the individuals who may classify themselves as two races or more. Prior research using datasets that include “two races or more” either drops this category from the analysis 48 or merges it into an “other” category. 49 Dropping it would put it into the omitted category of White non-Hispanic, thus muddying our control comparison group, so we do not do this. What is included in the “other” category varies but it usually includes American Indian and Pacific Islanders, and sometimes Asians. We choose to estimate the independent effects of these groups rather than lumping them into an “other” category.
Holding constant other measured factors, females tend to work in less-polluted areas compared with their male counterparts. The effect of percentage increase in female workers is statistically significant. These findings seem to run contrary to some previous research where harmful pollution disproportionally affects females. 50
According to the estimates, less-educated groups are in less-polluted areas compared with the most educated omitted group (i.e., BA degrees or higher). Similarly, younger and older employees work in less-polluted areas compared with the middle-aged workforce. Less wealthy (i.e., monthly income no higher than $3,333) groups also tend to work in census tracts with lower pollution burdens. Since older adults are more susceptible to pollutants, the findings that older adults work in less-polluted areas, all else equal, are positive.
To address the potential issue of skewed error distribution in Model 1, we also estimate logistic regression models using maximum likelihood estimation by dichotomizing the dependent variable. The results, presented in Supplementary Table S1, are consistent with those in Model 1, providing us with support for the robustness of the findings.
EXPLORING A MARKET-BASED EXPLANATION FOR THE ASSOCIATION BETWEEN WORKERS’ RACE AND ETHNICITY AND AMBIENT POLLUTION BURDEN
In keeping with the significant EJ literature focusing on residential location, we find that an increase in the proportion of certain racial and ethnic minority workers in a census tract is related to higher pollution burdens compared with non-Hispanic White-only tracts, holding constant various other sociodemographic characteristics of the tract’s workforce. We are also interested in causal factors that may explain this association. Using Equation 1, we estimate that a poorer tract (i.e., tracts in which the majority is comprised of workers whose monthly wage is no higher than $3,333) is associated with less pollution burdens, all else equal. In the literature on labor economics, it is supported that, holding all else constant, riskier jobs demand higher wages.
51
In the same way, the observed lower pollution levels for tracts dominated by lower-paid workers could be because some people are willing to accept more pollution for more income. Returning to the main association of interest, the observed relationship between race and ethnicity and pollution burdens may partly be because, on average, some racial and ethnic groups require less compensation to accept more pollution than White non-Hispanic workers. This possibility can be translated into the following hypothesis (Hypothesis 2 or All else equal, higher pollution burden is associated with higher earnings; and, all else equal, earnings are lower in tracts with a higher percentage of minority workers at every pollution burden percentile.
Results for Analysis of Census Tract Earnings as a Function of Pollution Burden Percentile, Workers’ Race and Ethnicity, and Interactions Between Pollution Burden Percentile and Workers’ Race and Ethnicity with Newey–West (HAC Robust) Standard Errors (Model 2)
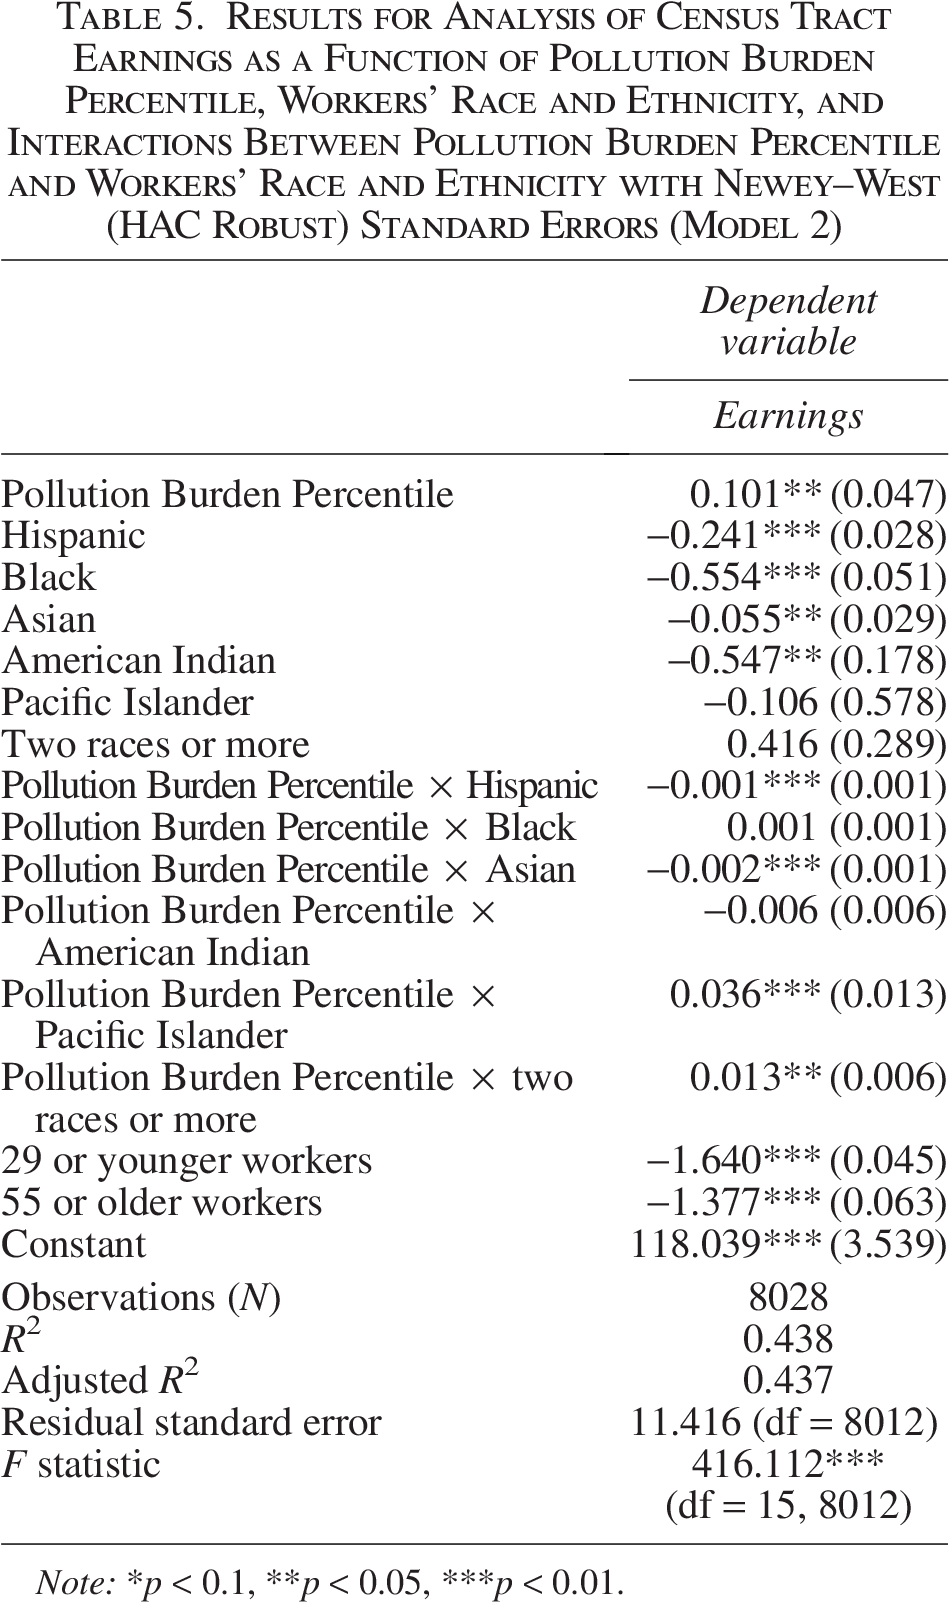
Note: *p < 0.1, **p < 0.05, ***p < 0.01.
Alone, a higher pollution burden percentile of a White-non-Hispanics-only census tract is estimated to increase the percentage of workers earning more than $3,333. Thus, it seems reasonable to argue that White workers, indeed, are compensated through higher wages to work in more-polluted areas.
In a tract at the 0th percentile rank of pollution burden, increases in Hispanic, Black, Asian, American Indian, and Pacific Islander workers are estimated to reduce earnings. But with interaction terms, we must examine the full effects. The full effects of race and ethnicity on earnings are revealed by the coefficient for each race and ethnicity alone, the coefficient for each race and ethnicity’s interaction term, and the level of pollution burden. For example, all else constant, the marginal effect of Black workers’ share on earnings is as follows:
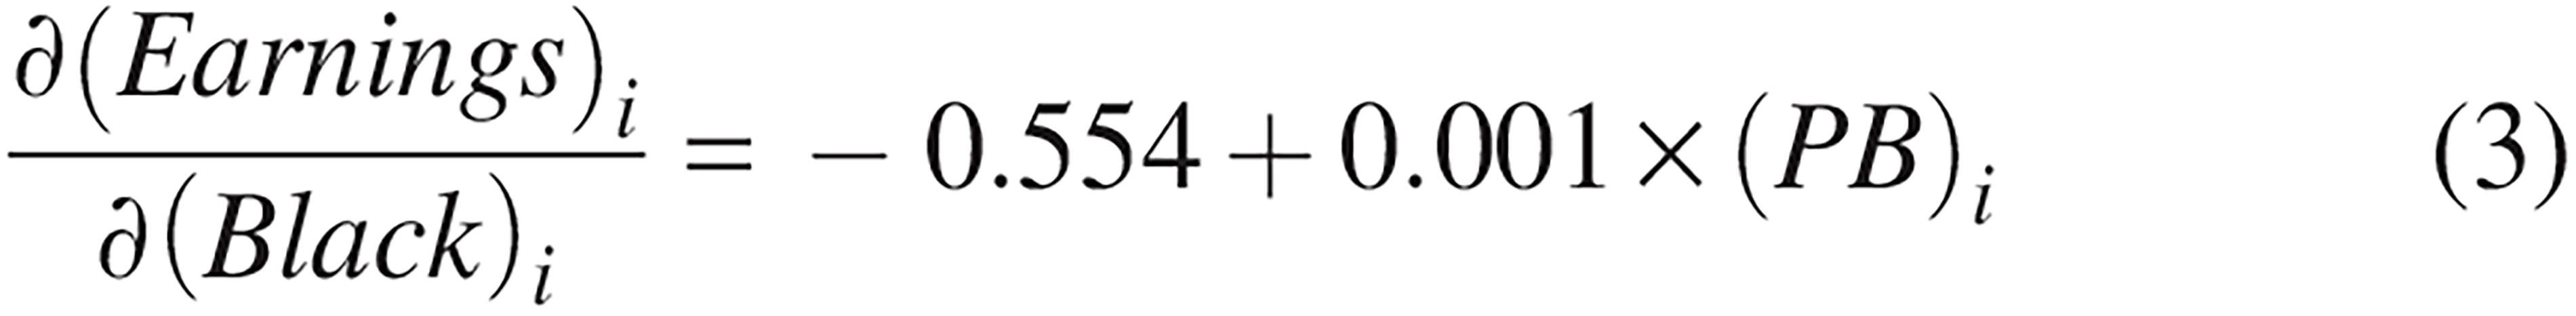
As
For Asians, both the direct effect and the interactive effect are negative (−0.055 and −0.002) and statistically significant, indicating tracts with Asian workers are compensated less at every pollution burden, with the gap rising with increases in the percentile. Similar patterns are observed among Hispanic and American Indian workers.
Of course, exactly why this might be the case for the Black, Hispanic, American Indian, and Asian workers is unclear—whether it is because they are, on average, less knowledgeable regarding tract-level pollution; more prioritized to make ends meet than to consider pollution costs, perhaps because they have fewer job opportunities due to systemic discrimination; or because they are less risk-averse, despite full knowledge, perhaps as a result of additional hardships due to systemic discrimination. According to economic models, labor-market risk-response wages are affected by marketplace discrimination, risk-aversion (or risk-seeking) preferences of individuals, and also information (a)symmetry and knowledge of the risks. 53 Supplementary Figures S2, S3, S4, S5, and S6 illustrate the full effects of racial and ethnic groups on earnings, varying pollution burden.
CONCLUSIONS, DISCUSSIONS, AND SOME POLICY IMPLICATIONS
According to our estimates, there is a strong association between race and ethnicity and workplace ambient pollution, consistent with EJ concerns and suggestive of underlying structural inequalities in labor force characteristics and occupational sorting. Hispanic, Black, and Asian workers are disproportionately working in highly polluted census tracts, and these findings are consistent with past studies on environmental disparities. 54
Pacific Islanders are found to work in less-polluted areas. However, this finding lacks clear theoretical ground and warrants further research. Such research could focus on this group’s geographic distributions, industry clustering, and/or cultural factors that could contribute to this trend.
Beyond race and ethnicity, our findings also indicate a negative association between female workers and workplace ambient pollution burden. Middle-aged workers (30–54) are estimated to work in the most-polluted tracts, all else constant. The negative association with females and pollution burden could suggest potential differences in occupation, location, industry, or risk-aversion compared with males. The pattern observed for younger and older workers could suggest they may be employed in industries or jobs that differ from middle-aged workers—but more analysis is needed. Still, the fact that older workers are less exposed to pollution burden is good because, in general, older people are more susceptible to harm from pollution (as are children).
The income findings suggest that higher-paying jobs are associated with more-polluted areas, holding constant other factors. A labor economics explanation is that, all else equal, riskier jobs require higher wages as compensation for higher risk exposure. We do find evidence of this, but the indication that racial and ethnic minorities are often compensated less than White non-Hispanics is disquieting.
Our findings from the interaction between pollution burdens and race and ethnicity in relation to earnings provide a starting point to investigate some underlying causes of the relationship between worker race and ethnicity and workplace pollution burden, but suggest the need for further research to capture the variation in trade-offs between pollution and income across racial and ethnic groups.
In addition to lacking information on occupational sorting, with these data, we are unable to assess whether racial and ethnic minority workers are more likely to work outdoors (or indoors), leading to potential misclassification of their actual pollution burden, rather than just their exposure to the ambient burden in the tract. We lack the ability to observe geographic mobility to chart the individuals living in one census tract and working in another, so we do not know whether people are receiving more, less, or the same amount of pollution at home and at work. When looking at home-to-work census tracts, LODES only provides crude data about the total population and industries but does not provide breakdowns of race and ethnicity or gender, limiting our ability to analyze commuting patterns at a more granular level. All these areas call out for additional research as we try to go beyond Kim and Kwan’s identification of the problem of NEAP to assess the EJ reality of overall exposure.
Still, this analysis is one of the first to extend our EJ understanding beyond the census locations of people’s residences to the census locations of their workplaces. And this extension responds to calls for such information, especially in the health literature. 55 Research has long shown that racial and ethnic minority groups are disproportionately pollution-impacted in their places of residence. Our exploratory study finds evidence that these disparities extend to ambient pollution in their areas of employment. Exposure at both home and work exacerbates the illnesses caused by pollution burden and appears to be another instance of systemic environmental injustice. Another piece of this puzzle would be to understand if there are any differences in pollution exposure during commutes.
Furthermore, beyond their implications for future research, these results have policy implications. For example, though now in abeyance, the Justice40 Initiative responded to embedded residential disparities by requiring that 40% of benefits from certain federal investments flow to disadvantaged communities. 56 The results reported here imply that such policies should also consider disadvantaged work areas.
Given the findings, existing state-level environmental programs, such as the California Clean Air Technology Initiative, could utilize this evidence to prioritize resources in places with higher levels of work-area ambient pollution and disproportionately large minority workforces, such as the San Joaquin Valley and the South Coast Air Basin. California’s Central Valley is highly polluted, and a high proportion of its agricultural workers spend a significant amount of time outside, so we can infer that the ambient pollution is highly relevant to their pollution while working.
But more importantly, efforts should also focus on addressing the systemic inequalities underlying the observed racial and ethnic disparities in workplace environments, including through measures such as education. For example, in many areas, owners of houses for sale must disclose nearby problems, such as environmental hazards. Perhaps employers should be required to make the same types of disclosures.
There are many reasons that racial and ethnic minorities in the United States suffer health disparities, but there can be no doubt that one reason is disproportionate exposure to harmful pollutants. Considering ambient pollution both at home and at work provides more pieces of the puzzle that can help us improve public health.
AUTHORS’ CONTRIBUTIONS
L.W.: Conceptualization, methodology, writing—original draft, and visualization. G.Z.: Methodology, writing—original draft, and writing—review and editing. H.E.C.: Original idea, conceptualization, writing—review and editing—and project management.
Footnotes
ACKNOWLEDGMENTS
The authors are grateful for the comments and suggestions from colleagues of the “Lightning Talk: Environmental Policy and Administration” session of the 82nd Midwest Political Science Association (MPSA) Annual Conference. They are also grateful for the feedback from their two anonymous reviewers.
AUTHOR DISCLOSURE STATEMENT
The authors declare no competing interests.
FUNDING INFORMATION
L.W., G.Z., and H.E.C. are financially supported by the Division of Politics and Economics, Claremont Graduate University. G.Z. gratefully acknowledges the financial support of the Lincoln Fellowship in Land Policy at Claremont Graduate University.
Supplemental Material
Supplementary Material
Please find the following supplemental material available below.
For Open Access articles published under a Creative Commons License, all supplemental material carries the same license as the article it is associated with.
For non-Open Access articles published, all supplemental material carries a non-exclusive license, and permission requests for re-use of supplemental material or any part of supplemental material shall be sent directly to the copyright owner as specified in the copyright notice associated with the article.