
Abstract
Although attention to the health implications of climate change is growing, little work explores either local risks or the health effects of long-term exposure to multiple, overlapping events. Understanding the health impacts of cumulative exposure to climate extremes at the subnational level is crucial to effective climate adaptation and public health interventions. This study examined county-level exposure patterns to extreme climate events, using an innovative cumulative index of extreme heat, drought, and storms and the association with county-level all-cause, age-adjusted premature mortality in the United States. Results demonstrate that counties with higher non-Hispanic Black populations, lower educational attainment, and higher poverty levels were associated with multiple, overlapping climate extremes. Our findings also indicate that exposure to climate extremes significantly increased the risk of premature mortality, even when controlling for socioeconomic vulnerability. Counties exposed to above-average levels of extreme heat, drought, and storms had 25 additional premature deaths per 100,000 residents compared with those experiencing none. These results demonstrate that although counties with vulnerable populations are more likely to be exposed to multiple climate change events, repeated and overlapping climate events serve as an additional potential form of cumulative disadvantage, contributing to preventable mortality beyond other known social and economic determinants. This research underscores the urgent need for locally targeted public health interventions and climate adaptation strategies, particularly in socially and environmentally vulnerable communities. Our index offers one such tool for decision-makers to identify at-risk counties and tailor responses to mitigate their health challenges.
INTRODUCTION
Climate change is described as both the most pressing health threat facing humanity and the greatest opportunity for public health. 1 Extensive existing research details the health risks and consequences of climate change. 2 The health impacts of climate change are complex and multifaceted and operate via multiple pathways and over varying time scales. For instance, there are direct mortality impacts, such as immediate risks of death from exposures during or following a climate-related event, especially through disasters. 3 More indirect pathways develop over longer periods of time.
Growing numbers of storms, changes in temperature and precipitation, and increasing exposure to a “climate penalty” of polluted air, water, and food are indirectly linked to increased risk of disease and deaths in both short-term and longer time frames. As temperatures rise, heat-related illnesses become increasingly prevalent. 4 Precipitation changes threaten food and water supplies and safety. Extreme weather events and coastal flooding cause injury, disease, and death but also exacerbate already declining cardiovascular and respiratory health from increased air pollution. 5 Exposures may also operate via mental health, linking to increased rates of anxiety, stress, and depression, 6 which may lead to additional risks from health-compromising behaviors such as cumulative exposures to inadequate sleep, physical inactivity, tobacco use, and substance use. 7
In recent years, the United States has experienced more frequent and intense weather events connected to climate change. 8 Yet, climate events are not equal in their breadth or impact. It remains challenging to determine the mortality consequences of specific events due to the variability of the events, overlapping events, and challenges of the classification of deaths. 9 For instance, a hurricane’s direct and indirect consequences depend on the size and location of landfall. Classification of deaths due to droughts or air pollution may be challenging because of comorbidities, cause-specific disease etiology, and the importance of prolonged exposures. As such, a focus on singular events potentially leads to undercounts of deaths and lasting impacts from climate-related events, especially in the case of comorbidity. There is reason to believe that exposure to multiple climate events over time places communities at higher risk of preventable mortality.
Geographic and social location largely shape a person’s exposure to climate events and changing weather. Risks of drought, extreme heat, precipitation fluctuations, storms, and flooding have distinct regional patterns, with some areas experiencing an increased risk of multiple, overlapping climate events operating on mortality through multiple pathways beyond geography. For instance, excess mortality by extreme heat may vary by the built environment through access and use of air conditioning or tree coverage. 10 The demographic vulnerability of a community may also drive variations in the health burdens of climate change. The elderly, children, and those with preexisting conditions are more sensitive to heat, poor air quality, and other climate-related environmental changes. 11
Climate change also occurs within the context of persistent racial and economic inequality, discrimination, and segregation. 12 In the United States, populations most at risk for the health effects of climate change include low-income communities, communities of color, and indigenous communities. 13 These groups are often disproportionally exposed to climate risks and have compounded disadvantages due to a lack of protective resources and services to mitigate and adapt to the rise of threats, climate events, or changes to their local environments. 14 Vulnerable populations also experience a higher burden of comorbidities that may place them at additional risk. 15 Moreover, climate events can also exacerbate existing economic inequality, as these disasters have significant socioeconomic impacts. For example, Hill et al. (2019) show that air quality has particularly detrimental effects across areas with higher levels of income inequality.
Despite growing attention to the justice implications of climate change, little remains known about the intersection of social and economic inequality and environmental exposure in shaping mortality outcomes. Growing numbers of climate-related events, including changes in temperature, precipitation, and storm events, demonstrate consistently negative relationships with both health and mortality. 16 Research often links independent climate change measures via extreme weather conditions, air and water quality, and disasters to various health outcomes. Yet, the focus on singular measures of climate events frequently overlooks the increasing concentration of climate-related events and the disproportionate climate burden of this concentration within disadvantaged communities. Accordingly, we focus on the distribution of multiple climate events across communities and the relationships with all-cause premature mortality rates across vulnerable and disadvantaged communities in the United States. By focusing on an innovative, decadal account of climate-related events, we aim to provide a fuller, comprehensive understanding of the sum distribution of heat, drought, and storms across counties in the United States. This study aims to determine the association between an index of climate events and county-level all-cause age-adjusted preventable mortality. Second, we aim to understand the strength of this relationship when controlling for measures of community disadvantage. By providing an empirical description of climate burden, we provide insights into multiplicative forms of community disadvantage.
METHODS
Data and variables
We primarily rely upon health data from the County Health Rankings and Roadmaps (CHRR) project (https://www.countyhealthrankings.org/reports). Annually, since 2010, CHRR has published health outcomes, health factors, and a range of additional county-level data sources. The CHRR project is dedicated to improving health outcomes for all by building a reliable and sustainable source of local and accessible data that communities can use to make decisions about community health and well-being. Additional data include climate data from multiple sources, including the National Oceanic and Atmospheric Administration (NOAA) and United States Drought Monitor (USDM), and vulnerability data from the Centers for Disease Control and Prevention (CDC), as described in detail below. Our data include observations of 3,108 U.S. counties. We focus on county-level data due to data limitations at smaller geographic scales and the importance of county governments as decision-making entities for climate mitigation and public health.
Dependent variable
Our dependent variable is age-adjusted premature mortality, a measure of avoidable or unnecessary mortality. Age-adjusted premature mortality is the number of county-level deaths to residents under the age of 75 per 100,000. We employ age-adjusted premature mortality data from the 2021 County Health Roadmaps and Roadmaps data release, which includes mortality between 2017–2019 and pre-dates the COVID-19 pandemic. The CHRR age-adjusted premature mortality measures are constructed from the National Center for Health Statistics Mortality Files drawn from the National Vital Statistics System. 17 Because premature mortality measures avoidable or unnecessary mortality, it is often used to track populations’ health and inform policymakers about undesirable health patterns. 18 Premature mortality also captures increasingly common indirect deaths from exposure to climate events, 19 which fail to be captured in more direct cause-specific measures.
Independent variable
Our main independent variable is above-average climate extremes, a categorical climate index that measures above-average events in a county. We constructed this measure from three county-level measures of climate-related events from 2010–2019: extreme heat, drought, and damaging storms, ranging from 0–3, as described below. Our selection of climate change indicators is guided by the extensive literature documenting the consequences of climate change. 20 Additionally, we aimed to generate a simple, summative measure with clear interpretive advantages for local-level communities.
Extreme heat events represent occurrences of hotter than usual days. In general, extreme heat events are persistent, with increasing intensity, frequency, and duration. 21 Heat data are derived from the CDC’s National Environmental Public Health Tracking Network. 22 This tracking system contains data on population health and environmental hazards, including data on extreme heat events drawn from the NOAA’s National Center for Environmental Information nCLIMGRID data. This dataset contains small area (5 kilometer gridded) information on daily temperature (maximum, minimum, and average) and precipitation. This gridded raw data are used to detect extreme heat events. The Environmental Public Health Tracking data reports periods in which a temperature threshold is surpassed for more than 2 days from May to September. Using this, we developed a count of the number of heat events per year for every county from 2000–2019 and calculated the average number of extreme heat events for the decade. We then identified the counties that have experienced above-average heat events in this time period and used this as a dichotomous marker, noting which counties have experienced extreme heat in this time period.
Second, we leveraged a similar constructed measure for drought that reports the total number of weeks that 50% or more of a county was in severe, extreme, or exceptional drought. Drought data are from the USDM drawn from the CDC’s Tracking Network. USDM data are collaboratively produced by NOAA, the U.S. Department of Agriculture, and the National Drought Mitigation Center at the University of Nebraska. Unlike other drought measures (e.g., Palmer Index, Standard Precipitation Index), USDM data synthesize multiple drought measures and engages close to 500 experts nationwide to “ground truth” drought conditions and report drought categories (abnormally dry, moderate drought, severe drought, extreme drought, and exceptional drought). The Tracking Network takes weekly drought data for each county and reports a count of the number of weeks that 50% or more of a county experienced drought conditions, including severe, extreme, or exceptional drought. We used this to develop our measure of drought across the decade (i.e., the number of weeks in a year that 50% or more of a county experienced severe, extreme, or exceptional drought from 2010–2019). Following this, we developed a dichotomous indicator noting which counties have experienced above-average drought conditions.
Our final climate-related event is extreme storms. We relied on NOAA’s National Center for Environmental Information’s Storm Events database to construct a measure of the number of damaging storms that occurred in a county from 2010–2019, excluding heat-related events (i.e., to reduce redundancy). This database contains information on damaging storms and significant, intense weather events, including cold weather events, convective storms, marine hazards, and other damaging events, such as wildfires. We used these data to construct a count of the number of severe and damaging storms reported in a county per year. We calculated the average severe storm events for this period and used this information to construct a dichotomized measure to identify which counties experienced above-average damaging storms from 2010–2019.
With these three dichotomous variables (counties that have experienced above-average heat, drought, or damaging storms), we constructed a measure of a county’s exposure to climate extremes that ranges from 0 to 3. Some counties may have experienced no above-average events, although others may have experienced one, two, or all three climate extremes in the included time period (2010–2019). Typically, deviations from longer-term historical averages are used to identify climate extremes. However, climate attribution science notes that climate-related events increased substantially in the last decade. 23 Along with this, there is a pressing need to better understand the population health consequences of recurrent, overlapping climate extremes.
Control variables
Control variables included county-level measures of: poverty, unemployment, less than college education, non-Hispanic black, rurality, uninsured, obesity, and smoking. Control variables were each standardized to place them on a standard scale (i.e., mean of 0, with standard deviation of 1) and facilitate comparisons. Measures of poverty and unemployment are drawn from the Centers for Disease Control and Prevention and the Agency for Toxic Substances and Disease Registry’s Social Vulnerability Index (CDC/ATSDR SVI) and the Federal Emergency Management Agency’s Resilience Analysis and Planning Tool (FEMA RAPT). Rurality data were derived from the USDA Economic Research Service Urban Influence Codes (UIC). Other demographic data and health data are from the CHRR 2020 data release, including the county’s educational attainment, racial composition, population density, and prevalence of uninsurance, obesity, and smoking. The control variables are guided by the specific focus on operationalizing social, economic, and health factors that pattern mortality and are established determinants of population health.
Poverty was included as the federal poverty ratio of household income to the poverty level, with the percentage poor reported as the percentage of a county with less than 1.00 of the federal poverty line. We leveraged data from 2010–2014 for the county-level poverty rate. Unemployment is the total population aged 16 and above currently unemployed and in the labor force, using 5-year estimates 2015–2019. Control variables from the 2020 CHRR data release leverage county-level data from 2014–2018. Education is a well-known determinant of health and is often used to understand population health patterns. 24 Less than college education included educational attainment as the percentage of adults aged 25–44 in a county with less than a college education. Rurality was defined from the UICs and recoded to a categorical measure of hierarchical urban networks. 25 Measures included metropolitan = 1 (UIC 1–3), non-metro micropolitan = 2 (UIC 4–6), or non-metro noncore = 3 (7–9). We included three health-related variables that are linked to mortality and may operate as potential pathways between climate-related stressors and mortality. Smoking measures the percentage of current smokers by county as provided to CHRR through the Behavioral Risk Factor Surveillance System. Obesity was based on the percentage of the age 18 and older population with a body mass index greater than or equal to 30 kg/m2 and derived from the Diabetes Surveillance System. Uninsured included the percentage of the county under the age of 65 without health insurance. Health care is a resource that is important for communities in the event of profound heat, drought, and damaging storms.
Analysis
First, we demonstrate climate disadvantage by mapping the overlap in climate-related events by county and providing descriptive statistics and tests of mean differences of the summed climate extremes across county-level characteristics in the U.S. Preliminary analysis revealed significant spatial clustering in Ordinary Least Squares regression residuals, as indicated by the graphing of the residuals and a significant Moran’s I (p = 0.000), highlighting the importance of spatial models. We employed a spatial lag regression analysis using maximum likelihood estimation to model the relationship between climate extremes and premature mortality, accounting for spatial dependence and controlling for county-level socioeconomic status, race, rurality, and health controls. Specifically, we use a contiguity-based spatial weight matrix to account for adjacent counties sharing health care systems and other resources that potentially shape mortality. The contiguity-based spatial lag model provided the highest log-likelihood, best overall fit (Pseudo R2 = 0.65), and most reduction in spatial autocorrelation (Moran’s I = 0.018) compared with other spatial specifications, including spatial error and hybrid models (Pseudo R2 < 0.63; Moran’s I > 0.05). This analytical approach is conceptually and analytically appropriate. Previous research indicates that health outcomes, including county-level mortality, are spatially clustered. 26 A spatial lag model or spatial autoregressive analysis allows us to model the impact of spillover effects on premature mortality patterns, providing an avenue to examine the direct and indirect impact of climate extremes on premature mortality.
Tests of model assumptions and additional analyses support relying on this approach. Multicollinearity tests demonstrated independence of variables (i.e., Variance Inflation Factors <2.8; condition indexes <8). Additional model diagnostics showed no violations. As robustness checks, we also estimated models with a log-transformed dependent variable and a generalized linear model weighted by the logged population size (i.e., to adjust for smaller counties) along with state-fixed effects. Results were consistent across all models. We present the spatial lag model with non-transformed variables for ease of interpretation.
RESULTS
Climate disadvantage
Table 1 outlines the distribution of counties experiencing extreme events in the contiguous United States, with 629 counties experiencing no above-average climate extremes, 1,328 counties experiencing one above-average event, 1,005 counties experiencing two above-average events, and 146 counties experiencing above-average heat events, drought, and damaging storms. Figure 1 shows the geographic patterns of above-average droughts, heat events, and damaging storms in U.S. counties. Counties in the South and Midwest demonstrated above-average heat events in the 2010–2019 time period. Above-average drought was most common in the West region of the continental United States, with some counties in the South and Midwest also experiencing above-average drought. Damaging storms were found throughout the U.S. regions, though the upper Pacific Northwest was less likely to experience extreme damaging storms. Most counties that experienced all three types of extreme events are in the South or Midwest.

Extreme climate events in the United States by country, 2000–2019.
Exposure to Above-Average Climate Extremes in the Contiguous United States

Includes: heat, droughts, extreme storms.
The availability of county-level age-adjusted premature mortality data limits our regression analysis sample to 3,071 counties. Table 2 provides the calculated means of included variables for this sample based on the number of county-level above-average climate extremes exposure. Average mortality rates were progressively higher as counties experience more climate extremes.
Variable Means by Number of Above-Average Climate Extremes and Analysis of Differences
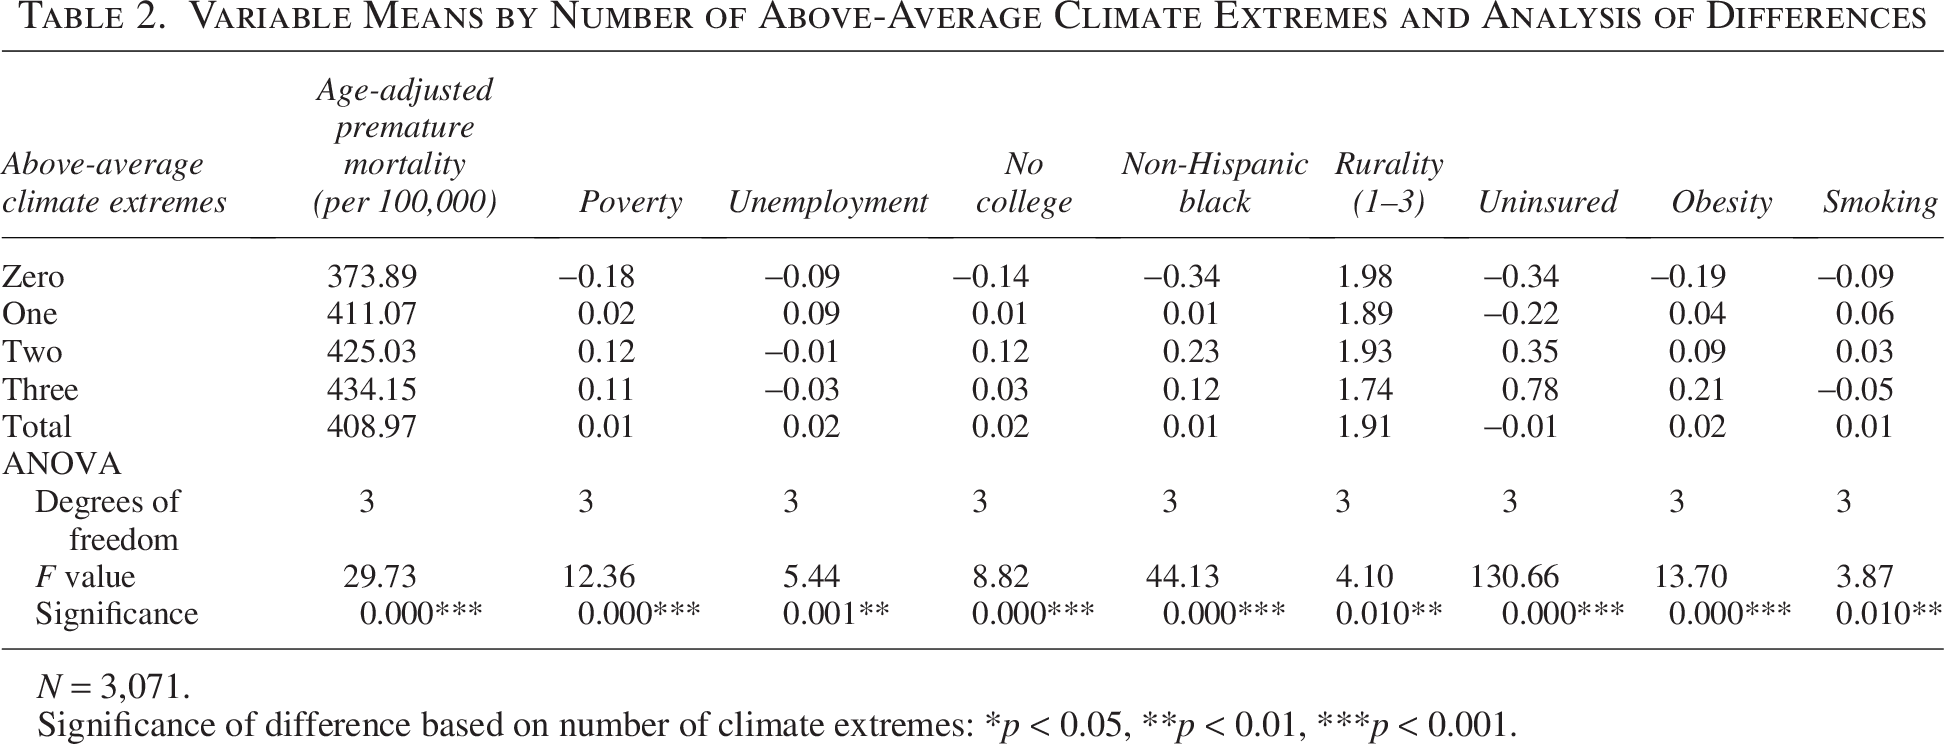
N = 3,071.
Significance of difference based on number of climate extremes: *p < 0.05, **p < 0.01, ***p < 0.001.
Descriptive statistics and tests of mean differences also demonstrate patterns in characteristics of counties experiencing climate extremes. One-way analysis of variance models find statistically significant differences for all included variables based on the level of climate extremes. Counties with no exposure to above-average climate extremes have lower-than-average rates of poverty, population with no college education, non-Hispanic Black population, uninsurance, obesity, and smoking. We also use paired t-tests to compare means for counties experiencing zero above-average climate extremes versus one or more above-average climate extremes, demonstrating significant differences in poverty, college education, percent black, uninsured, obesity, and smoking (p = 0.000 for all comparisons). On the other hand, counties that were exposed to two or three above-average climate extremes had above-average percentages of their population that are in poverty, less than a college education, non-Hispanic Black, uninsured, and obese. Paired t-tests comparing means between counties with zero or one above-average climate extreme versus two or three climate extremes demonstrate that these differences are significant (p = 0.000 for all). Ancillary analysis of the unstandardized county-level variables (available upon request) indicates that the average percent of the population that is non-Hispanic Black in all counties is 9.16%, but counties that have experienced no above-average climate extremes have a mean of 4.11% of their populations that are non-Hispanic Black. Counties that have been exposed to two and three above-average climate extremes have a mean of 12.26% and 10.66% of their populations that are non-Hispanic Black, respectively. This is especially notable considering that overlapping climate events often occur in rural counties, whereas non-Hispanic Black concentration tends to be higher in urban metropolitan areas. These descriptive statistics and tests suggest that socially vulnerable counties are more likely to be exposed to above-average climate extremes over long periods of time.
Climate extremes exposure and premature mortality
Table 3 depicts the results of a spatial autoregressive (spatial lag) model to test the association between exposure to climate extremes and county-level all-cause age-adjusted preventable mortality. Exposure to a higher number of above-average climate extremes is positively associated with higher premature mortality. Compared to counties with no exposure to above-average climate extremes, counties with one above-average extreme experienced an average of 12.27 more deaths among residents under age 75 per 100,000 population (age-adjusted), net other factors (p = 0.000). Counties exposed to two above-average extremes had 16.38 more deaths (p = 0.000). Counties exposed to three above-average extremes had 24.92 more deaths (p = 0.000). These results demonstrate the potential cumulative impacts of long-term exposure to climate extremes. Counties exposed to above-average heat events, drought, and damaging storms over the 10-year period also experienced the worst health outcomes, even when controlling for other common predictors of health. Post estimation of spatial autoregressive models provides direct, indirect (i.e., spillover), and total effects for the independent variables in the models. Table 4 reports these effects for extreme climate events and highlights that mortality associated with climate extremes has associations beyond specific county borders. This suggests that the population health consequences of extreme climate events occur via multiple pathways.
Spatial Regression of County-Level Age-Adjusted Mortality on Climate Extremes
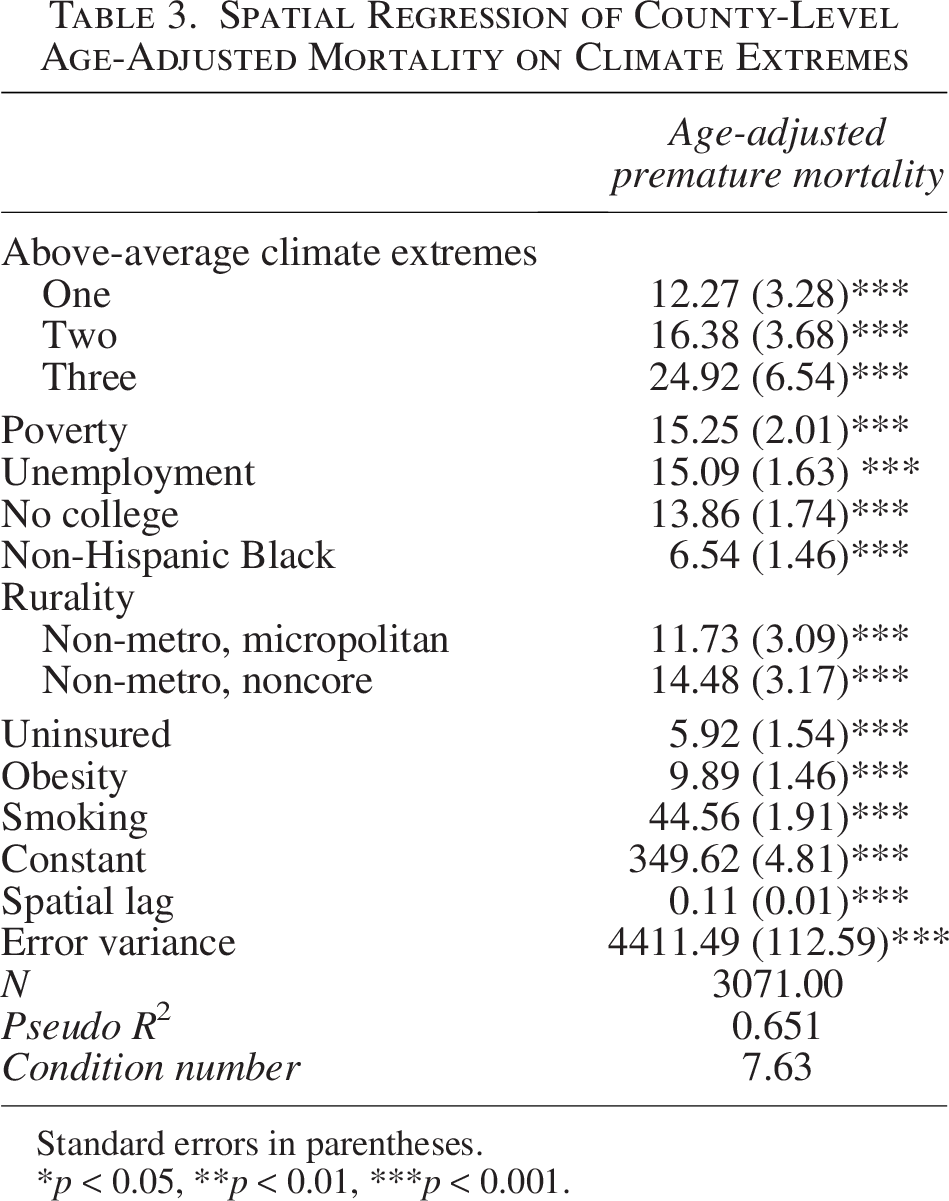
Standard errors in parentheses.
p < 0.05, **p < 0.01, ***p < 0.001.
Direct, Indirect, and Total Effects
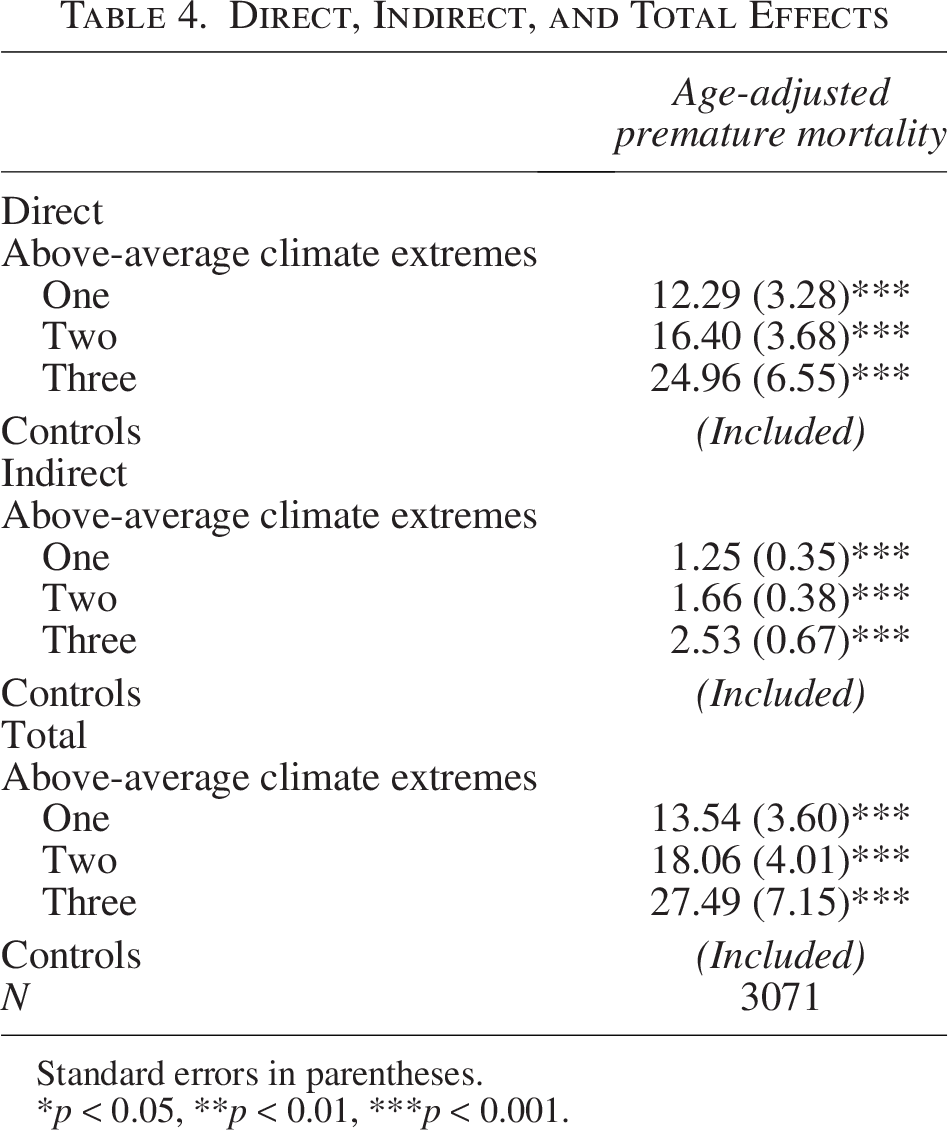
Standard errors in parentheses.
*p < 0.05, **p < 0.01, ***p < 0.001.
Our analysis controlled for measures of social vulnerability, including poverty, unemployment, less than college education, non-Hispanic black, rurality, uninsured, obesity, and smoking. All of these variables were statistically significant and associated with higher mortality. Notably, the association between county-level exposure to climate events and premature mortality persisted even when controlling for a range of socioeconomic factors and health behaviors. This suggests that exposure to climate events presents unique challenges beyond other common predictors of health outcomes.
DISCUSSION
This research demonstrates that communities exposed to climate extremes had higher social vulnerability. Previous work links minoritized groups’ disproportionate exposure to climate change impacts to worse health outcomes and widening health disparities in communities of color. 27 Although these data are emerging at the national and state or province level, our research provides a better understanding of patterns at a more local level.
Furthermore, although existing work highlights the link between individual climate event types and mortality, 28 our research provides evidence that multiple, overlapping climate extremes are associated with health. We also demonstrate that exposure to multiple, overlapping climate extremes represents an additional form of community vulnerability beyond established social vulnerability measures. Even when controlling for other forms of disadvantage, counties that experienced more climate extremes had higher age-adjusted premature mortality. The results demonstrate that these counties may have experienced broader forms of latent disadvantage. For instance, this may indicate a selection effect, where a left-behind group was unable to move out of these counties, or it could indicate a lack of investment in counties facing climate extremes. 29
Our research also expands on previous climate work in our conceptualization of climate change. One of the strengths of our approach is using the last decade as a starting point to construct an intuitive measure of climate extremes. The simplicity of our categorized measure offers local governments the opportunity to address county-level exposures relative to other communities, with opportunities for prevention or remediation. Potential time lags between climate events and subsequent mortality patterns add to the complexity of constructing local climate measures. The most recent Intergovernmental Panel on Climate Change (IPCC) report emphasizes the need to consider that multiple and recurrent climate extremes are likely to occur, and these extremes will interact with other non-climate-related risks. 30 Using more recent data to construct indicators of climate extremes also provides a good origin for understanding more proximate impacts and considering the community-level burden.
Limitations
This study was focused on all-cause premature mortality. Identifying deaths specifically caused by climate-change-related events remains an ongoing challenge in disease classification, appropriate time lags, and consistent criteria across states. 31 Yet, further refinement will help to establish better focus on mechanisms. Although this observational study does not make any causal claims, the temporal ordering suggests that mortality rates follow the exposure to climate events, limiting reverse causality concerns. All data were aggregated at the county level, limiting any ability to consider individual-level inferences. Data at smaller spatial scales are limited for several of the variables used in this study, including the health outcome measure analyzed. Although we included several potential confounders and addressed collinearity concerns in variable selection, we remained unable to control for potential omitted variables, such as other demographic factors and state and local policy actions to mitigate climate change impacts.
Constructing local measures of climate change-related events is complex; droughts, extreme temperatures, floods, and other climate-related disasters occur on various spatial and temporal scales. And although climate and weather are not synonymous, climate change will amplify severe weather and intensify natural hazards. Putting aside the direct impacts of extreme climate events, i.e., mortality and morbidity from excessive heat, drought, or damaging storms, no clear guidance exists on when recurrent climate events may start to shape population health patterns. Typically, deviations from long-term (often 100-year) historical averages are used to identify extreme events. We took a slightly different approach, using the last decade as a starting point. Our approach is guided by reports from the IPCC and other research noting the ongoing consequences of climate change in contributing to increasing extreme events. 32 Ancillary tests used more conservative cut-offs for climate burden (e.g., 75th percentile) and showed similar results. Additional testing used standardized and various combinations of climate change variables to ensure results were robust, even when the independent variable captured wider variation of exposure to events, demonstrating similar results.
CONCLUSION
Understanding the health impacts of repeated exposure to climate extremes is critical as severe weather events increase amid climate change. We show geographic and demographic patterns in exposure to multiple, overlapping events. Our results also demonstrated that counties with multiple above-average climate extremes faced worse mortality, with repeated exposures serving as an additional form of social disadvantage. These health implications of climate extremes persisted, even when controlling for other measures of vulnerability. These findings can inform policymakers, decision-makers, and future research.
County-level decision-makers in the United States need better data to understand their exposure to climate extremes and the health implications. Investment in climate mitigation and adaptation and health resources should reflect a county’s long-term risk. Our research provides new information on these risks and associations. Although data exploring these links is emerging at the national and state or province level, little data are available for local decision-makers. Local governments often control both the funding and the policies that shape climate adaptation and mitigation strategies for public health. Better information on the cumulative risks of climate change is critical to health promotion. This research provides a new approach to measuring exposure to climate events. Our index captures a decade of exposure to above-average extreme events. Future research could leverage this approach to examine association with other health outcomes. Even without further exploration, this research demonstrates patterns in exposure to climate events and its association with increased county-level mortality.
AUTHORS’ CONTRIBUTIONS
M.H.S.: Conceptualization, methodology, formal analysis, data curation, writing—original draft, writing—editing and reviewing. D.M.D.: Conceptualization, methodology, formal analysis, resources, data curation, writing—original draft, writing—editing and reviewing, supervision, project administration, funding acquisition. J.M.S.O.: Conceptualization, methodology, formal analysis, resources, writing—original draft, writing—editing and reviewing, supervision, funding acquisition. Previous drafts of this article were presented at the annual meetings of the American Political Science Association and the Southern Demographic Association.
Footnotes
AUTHOR DISCLOSURE STATEMENT
No conflicts of interest to disclose.
FUNDING INFORMATION
The authors are grateful to Xanthippe Wedel and Carlos Zambrana for their assistance on this project. This research has been supported by a grant from the County Health Rankings and Roadmaps program, a program of the University of Wisconsin Population Health Institute with support from the Robert Wood Johnson Foundation. The views expressed are those of the author(s) and do not necessarily reflect the views of County Health Rankings and Roadmaps program or the Robert Wood Johnson Foundation.