
Abstract
Typologies are omnipresent both in everyday life as well as in the sciences. Epistemologically, there are several systematic ways to build typologies, such as qualitative, theory-based descriptions on one end and quantitative, exploratory statistical means on the other end of the spectrum. Both have their specific advantages and disadvantages, which can be bridged by applying set-theoretic methods, such as Qualitative Comparative Analysis (QCA). The contribution of this paper is substantial and methodological: First, we show how QCA can enhance our understanding of media systems by building a typology that draws on Hallin and Mancini’s framework. The main improvement of QCA is the ability to identify ideal types as well as border cases. In our analysis, we move beyond the widely discussed case of Great Britain and take a closer look at further border cases such as Austria, Belgium, France, the Netherlands, and Portugal. Second, QCA has been scarcely applied to build typologies and if so, only in neighboring disciplines. Thus, we aim at familiarizing comparative political communication scholars with this method.
Keywords
Typologies are an important way of organizing the complex relationships between social phenomena. They help to assign single cases to groups that share similar characteristics. According to McKinney (1969: 1), “types and typologies are ubiquitous, both in everyday social life and in the language of the social sciences. Everybody uses them, but almost no one pays any attention to the nature of their construction.” Consequently, establishing types and typologies has a long-standing tradition in the social sciences (Lazarsfeld [1937] 1993; Weber [1904] 1991). For comparative social science research, typologies are particularly useful. They help to structure the complex phenomenon of political communication in different contexts, organize the objects of study, and are useful to analyze, compare, and interpret the units of analysis. Recently, several scholars have dealt with the challenges of typology building (e.g., Collier et al. 2008; Goertz and Mahoney 2005).
One important example in political communications research is Hallin and Mancini’s (2004) media system typology. Their book Comparing Media Systems has inspired and guided research in this field but also gained criticism, especially because of its lack of standardized, empirical validation. Ten years after the original publication, a study by Brüggemann et al. (2014) revisited the theoretical framework and provided operationalization and standardized measurement. This study could validate most of Hallin and Mancini’s theoretical assumptions, but resulted in a typology with four models. However, although the study accounts for the major criticisms of Comparing Media Systems, the new typology lacks the differentiated discussion of single countries found in the initial book. Therefore, we aim to fill in this gap and advance the typology of Brüggemann et al. by combining their standardized measurement with a detailed, case-oriented analysis.
To do so, we introduce a systematic and transparent procedure of building typologies by using the method of Qualitative Comparative Analysis (QCA). We use the data collected by Brüggemann et al. (2014) and apply QCA to provide a more thorough account of the differences between the single media systems under study (please see the original study for the precise sources and operationalization: Brüggemann et al. 2014: 1046–51).
As Hallin and Mancini’s (2004) original framework, the scope of our study is limited to Western industrialized democracies. It appears plausible that other countries (e.g., authoritarian regimes, transitional economies, or emerging nations) may require additional dimensions, such as press freedom or further indicators regarding ownership structures. However, we are confident that our analysis constitutes an important step toward such a universal typology of media systems. As a starting point, we focus on the press market as the traditional pillar of the media system and deliberately rely on data that remain relatively constant over time. Further studies should also reflect the commercialization and digitalization of media systems by including more data on the countries’ economic situation, online market, and Internet use.
Building Typologies with QCA
There are different ways of building typologies, most commonly theoretical heuristics and empirical classifications (Bailey 1994; Fiss 2011). Both approaches have their advantages and disadvantages: Theoretical heuristics focus on individual cases and in-depth explanations, while empirical, standardized approaches stress variables and general similarities. However, there are possibilities to combine the two. One way to elegantly use the “best of both worlds” is QCA. 1 It enables combining in-depth qualitative analysis with systematic cross-case comparisons. In this vein, we argue that QCA is particularly useful to identify different variants of a given phenomenon as it is done when building typologies.
QCA in the Social Sciences
In recent years, more and more studies in media and communication science used QCA to identify causal relationships between conditions and outcome (Brüggemann and Kleinen-von Königslöw 2013; Downey and Stanyer 2010; Humprecht and Büchel 2013; Stanyer 2012). QCA is based on set theory, meaning that “variables” (called “conditions”) constitute sets, whereas cases are either members or nonmembers of these sets. Consequentially, Boolean algebra is used to calculate set-theoretic relations. While linear algebra uses correlations to describe relations between variables, Boolean algebra describes relations of necessity and sufficiency between sets. The basic premise of QCA is that outcomes can be explained by combinations of conditions, using the so-called “truth table” that lists all possible combinations of conditions to identify combinations that are sufficient for an outcome. 2 QCA has been welcomed by many social scientists because it enables a constant dialogue between theory and evidence, between data and results, throughout the analytical process.
While QCA has been used in many studies within different social science disciplines to identify set relations between conditions and outcomes, its application to build typologies is less established. One such study by Fiss (2011) was published in a top-ranked management and business journal. Further studies by Kvist (2006, 2007) illustrated the approach by using examples of policy research and business analysis. In the paper at hand, we demonstrate how QCA is used to build empirical typologies with an example that is well known in media and communication science. We hope that this helps to spread the knowledge of this fruitful approach in comparative political communication research.
Key Concepts of QCA
As Doty and Glick (1994) point out, typologies are a unique form of theory building as they are complex theories that describe the causal relationships of contextual, structural, and strategic factors, thus offering configurations that can be used to predict an outcome of interest. Because typologies are by definition set-theoretical, QCA is particularly well suited for this kind of thinking. Set theory is not restricted to simple binary values (membership vs. nonmembership): Using so-called fuzzy sets can show how well a case is represented by a certain type. This is useful to identify both cases that belong to one distinct ideal type as well as border cases that show membership degrees in more than one type. Fuzzy sets consist of elements that can take membership scores between 0 and 1, with 0.5 being the qualitative anchor that divides members and nonmembers of a set.
When building typologies with QCA, membership scores have to be calculated for each theoretical case. This is done by a procedure called calibration. During calibration, the researcher has to decide what the qualitative anchor-point of 0.5 corresponds to in the original scale. A logistic function is then used to transform original values into fuzzy sets (Schneider and Wagemann 2012: 32–41). Next, the data are arranged in a matrix, the so-called truth table (Schneider and Wagemann 2012: 91–116). One row in the truth table displays one set of cases that show the exact combination of conditions that the truth table row depicts. In the logic of typologies, we assume that each combination of conditions in the truth table stands for one set of cases, respectively, for a sufficient condition if a “traditional” outcome is analyzed. 3 Next, Boolean minimization (see Schneider and Wagemann 2012: 104–16) reduces the number of original dimensions needed to describe each type, thus simplifying the overall formula found with the truth table. This step identifies similar patterns between single cases and groups them together. 4 Subsequently, the solution terms that are produced by the analysis contain different cases and can be interpreted as types. For each case, a membership degree is provided that shows how well the case is reflected by the respective solution term (or “type”). And as the analysis is based on a systematic comparison of individual characteristics, it is possible that single cases appear in several types. Finally, a strict case-oriented interpretation can identify ideal cases, border cases, and typical cases of each type, thus combining the advantages of a quantitative, variable-oriented procedure and qualitative, case-oriented interpretation.
Advantages Compared with Linear Algebra
So how does this application of QCA differ from other, more established methods in linear algebra, such as cluster analysis? As the two approaches are based on different logics (belonging to sets in set theory vs. measures of proximity in cluster analysis), the proceeding and interpretation will vary. QCA is considered to be a combination of variable-oriented analysis and case-oriented interpretation, while “traditional” statistical methods such as cluster analysis are completely variable-oriented. Consequentially, the interpretation of a cluster analysis will focus on the variables (“dimensions”) and interpret them with regard to the clusters (“types”). This is made possible by calculating averages of all variables for the different types (“cluster centers”). The disadvantage of this method is that calculating averages always means losing important information about single cases. Outliers, extreme cases and border cases (that are close to several types) cannot be identified anymore. The cluster centers always describe the average, typical case. With QCA, in contrast, the interpretation will focus on single cases and the combinations of conditions they show, thus being able to identify and describe border and extreme cases. The types can be interpreted precisely as the solution paths show the exact combination of conditions that are contained in each type. Thus, it is also possible to calculate fuzzy set membership scores regarding the different solutions (“types”) for each case, which facilitates the identification of border cases (that are represented by several types) and outliers as well as distinct cases (that strictly belong to one type only).
In short, the approach using linear algebra is variable-oriented, while QCA provides a case-oriented interpretation of a variable-oriented analysis, keeping more information about single cases intact. In addition, cluster analysis by definition produces results with maximum discriminatory power, while QCA allows cases to have multiple memberships. This is ideal for the identification of outliers, typical and border cases by inspecting the fuzzy set scores. QCA allows a finer-grained interpretation with a precise description of the peculiarities of each single case with regard to the typology. We will demonstrate the application and the heuristic value of QCA for building typologies in our analysis of media system typologies.
Typologies of Media Systems
To build a typology of media systems, we use the empirical dimensions provided by Brüggemann et al. (2014) that provided a valid account of the original framework. Their operationalization is based on Hallin and Mancini’s (2004) model and adapted for quantitative measurement. In the following, we briefly discuss the subindicators used by Brüggemann et al. to operationalize the four dimensions of their typology. 5
Hallin and Mancini’s (2004) original media system typology is based on four dimensions of media systems: “Media market,” “journalistic professionalism,” “political parallelism,” and “role of the state.” Brüggemann et al. (2014) suggest relabeling the dimension of media market to inclusiveness of the press market as this label implies the question of whether the press only reaches out to the elites or to a broader mass audience. More specifically, they refer to the reach among women and men, or among different segments of society, such as the working class (Hallin and Mancini 2004: 22–26).
The dimension political parallelism measures to which extent journalism reflects ideological and party political lines in a given country. The concept was operationalized by drawing on indicators such as the extent to which media coverage is shaped by journalists’ political affiliations, the degree to which audiences consume media according to their political preferences, the separation between news and commentary, political bias in news reporting, and the public broadcasters’ dependence on the government (Brüggemann et al. 2014).
For the dimension journalistic professionalism, Brüggemann et al. (2014) used the following indicators: the degree of professional autonomy that journalists enjoy as a group, the development of distinct professional norms, and the extent to which journalists are oriented toward an ethic of serving the public interest.
Finally, Brüggemann et al. (2014) divided the dimension role of the state into three subdimensions that showed high levels of internal consistency and are relatively independent of each other. The three dimensions are the strength of public broadcasting, the amount of direct and indirect press subsidies, and the degree to which states regulate their media markets through ownership regulation.
For each dimension, sets of indicators were introduced drawing on different sources of data, such as the World Press Trends compilation, the European Election Study, the World Value Survey, and the European Audiovisual Observatory (EAO). Brüggemann et al. (2014) used these indicators in a cluster analyses to validate and refine the typology by Hallin and Mancini (Hallin and Mancini 2004). Please also see Brüggemann et al. (2014: 1046-1051) for an extensive list of all data sources. They use cross-national studies to ensure comparability and provide reliability analyses to ensure the robustness of their indicators.
We argue that QCA is an adequate approach to complement and further advance this endeavor because the theoretical concepts behind the dimensions and models to be analyzed have a set-theoretic design. Therefore, we opt for a set-theoretic analysis strategy and turn to QCA.
Analytical Strategy
The analysis we applied to identify typologies of media systems consists of three steps. It is a variation on the “two-step approach” that Schneider and Wagemann (2006) introduced. The original “two-step approach” is based on the idea that macro-level (or “remote”) conditions are identified in a first step. The resulting solution paths (i.e., combinations of conditions that are sufficient for an outcome) will then be used again as conditions in a second analysis, combined with meso- and micro-level (or “proximate”) conditions. It is easy to calculate fuzzy set membership scores (see Schneider and Wagemann 2012: 47–51) for these “combined conditions” by applying the respective formulae for conjunctions (returns the minimum value on all conditions), disjunctions (returns the maximum value on all conditions), and negations (1 minus the value of the condition). This approach is useful not only for multilevel designs (“remote” and “proximate” conditions), but also for simply reducing the number of conditions in each step of the analysis—which is how we use it. This application of the “multistep approach” is very similar to classical construction of indices. We apply this approach for typology building by analyzing two different sets of conditions separately. In a final step, the resulting solution paths (i.e., typologies in our case) are combined to result in a typology. In the following, we discuss the calibration of all dimensions into fuzzy sets before turning to the main findings.
Calibration
For the application of Boolean algebra, the original scales have to be calibrated into fuzzy sets. The calibration is an important step because cases are assigned to being members or nonmembers of particular sets with this procedure. It is recommended to not simply rely on “statistical” measures for the calibration but base each decision on case knowledge by the researcher (Schneider and Wagemann 2010). For instance, it would be inappropriate to transform an interval scale into values between 0 and 1 while retaining the same distances between cases, or simply use the mean as threshold for membership, as this would defy the purpose of fuzzy sets and their membership threshold (Schneider and Wagemann 2012). However, it is a fruitful strategy to identify big “gaps” in the data between specific cases, indicating that the respective two “groups” of cases are placed among different “ranges” of the respective variable. These “gaps” can thus be used as anchor-points for the calibration, but additional theoretical clarification is necessary in any case to justify the decisions. As the nature of calibration can be controversial and is intensively discussed in the methodological community, we provide a detailed account of this procedure in detail to allow for a transparent interpretation of the results. The values assigned to each case can be found in Table 1 (both the original z values by Brüggemann et al. 2014, and calibrated data).
Original Z Values and Fuzzy Set Values of the Dimensions.

High inclusiveness of the press market
At the extremes of the original z values, Greece has the lowest (GR 6 : −2.09) and Sweden the highest (SE: 1.61) value. There is a distinct “gap” in the data between Portugal and Germany, which shows that Germany, Switzerland and the Scandinavian countries score relatively high (SE, FI, NO, CH, and to a lesser degree DE). This is in line with Hallin and Mancini’s theoretical typology stating that those countries belong to the “set” of cases with an inclusive press market. Portugal, Austria and Great Britain score lower, followed by the Netherlands and Italy. Because Italy has been found to have a comparatively weak press and limited newspaper circulation, this country is treated as a nonmember of the outcome set (Cornia 2013; Mazzoleni 1987, 2004). In contrast, Portugal, Austria, and Great Britain were more difficult to calibrate. However, the existing literature suggests that the Austrian press market is less inclusive, while Portugal can be considered to belong to the set of this outcome: According to Trappel et al. (2011), Austria’s press market generally resembles the one of Portugal with one important exception, namely, its low performance regarding the “equality and interest mediation” function. By “equality and interest mediation,” the authors mean the degree to which a media system offers external diversity of media outlets that reach out to a large amount of citizens and report about minority claims. Thus, this indicator can be considered being close to our dimension of an inclusive press market. Trappel et al. find in their ten country study that Austria scores lowest on this indicator, while Portugal scores average. Based on these findings, we decided that Austria should not be a member of the “inclusive press” set, while Portugal should belong to this set with a relatively low membership degree. Correspondingly, the three anchor- and threshold-points of 0.95, 0.5, and 0.05 are set to 1, 0, and −0.6, respectively, resulting in a set with Austria being just out of the set and Portugal only just a member of the set.
High political parallelism
The original z values range from Finland (FI: −1.36) to Spain (ES: 2.1). Spain is followed by Italy (IT: 1.74), Greece (GR: 1.43), France (FR: 0.62), Austria (AT: 0.35), and the Netherlands (NL: 0.19). According to Hallin and Mancini (2004), the Mediterranean countries are characterized by high political parallelism. Austria is also considered to be a member of this set because Austrian daily newspapers usually have a strong political alignment (Anagnostou et al. 2012). Furthermore, Trappel et al. (2011) argue that Austria performs significantly lower on the indicators “rules and practices on internal pluralism” and “independence of the news media from power holders” than, for instance, the Netherlands. Hence, the thresholds for direct calibration were set to 2, 0.3, and −1, resulting in a set with Austria as a member and the Netherlands just out of the set.
High journalistic professionalism
Originally, the z values range from Italy (IT: −2.00) to Denmark (DK: 1.31). A qualitative assessment of the data reveals a remarkable gap between the cases of Ireland (IE: −0.27) and Germany (DE: 0.21). According to Hallin and Mancini (2004), Germany is a democratic-corporatist country and thus considered to have high journalistic professionalism. Ireland, in contrast, has been found to have lower levels of journalistic professionalism (Marron 1996). These findings, as well as the fact that there is a rather big “gap” between the two cases, support the decision to include Germany as a member of the set of countries with high journalistic professionalism and to exclude all countries with lower values. In line with these decisions, the anchor- and threshold-points are set to 1, 0, and −0.5.
High investments in public broadcasting
The values for the strength of public broadcasting services (PBS) range from the United States (US: −2.80) to Denmark (DK: 1.41). This reflects the assumptions by Hallin and Mancini (2004) that democratic-corporatist countries strongly invest in PBS, while it is marginalized in the United States. The most significant gap is situated between France (FR: −0.02) and Italy (IT: −0.29). According to previous research, the French state spends nearly twice as much money on its PBS compared with Italy (Nielsen and Linnebank 2011). Hence, it is plausible to include France in the set and treat Italy as a nonmember and set the threshold for membership between France and Italy. Correspondingly, the anchor- and threshold-points were set to 1, −0.1, and −1.
Strong ownership regulation
This dimension consisted of an ordinal scale, which led to little variance in the data. Only five different values represented all cases in the sample: −2.04 (FI), −0.99 (DK, IE, NL, ES), −0.46 (NO, SE), 0.06 (BE, IT, PT, US), and 1.11 (AT, FR, DE, GB, GR, and CH). The dimension consisted of three indicators, namely, cross-media ownership regulation, television ownership regulation, and press ownership regulation. Therefore, we decided to only include the cases with all three forms of ownership. In other words, only cases with the highest value (1.11) were treated as members, while the remaining cases were considered as nonmembers of this set. Thus, the thresholds for the calibration are set to 1.1, 1, and −1, respectively.
High press subsidies
The scale for the dimension press subsidies ranges from the United States (US: −1.66) to Sweden (SE: 1.48). 7 The cases Norway (NO: 1.26) and Sweden (SE: 1.48) have the highest values and are distinct members of this set. These countries are followed by Italy (IT: 0.75) and France (FR: 0.34), two countries that are also linked to higher amounts of press support (Hallin and Mancini 2004). Likewise, the cases of the United States (US: −1.66) and Ireland (IE: −1.06) are distinct nonmembers of this set. Germany, with a value of −0.49, also has little direct press support. However, the German state strongly subsidizes the press sector via indirect means, for example, value-added tax (VAT) reduction (Nielsen and Linnebank 2011). Therefore, Germany was assigned to the set of press subsidies, even though it is rather at the lower end of the scale in this group of countries. This is reflected in the calibration that assigns fuzzy set values above 0.95 to Norway and Sweden while all other member cases lie between Germany (−0.49) and Italy (0.75). These cases, thus, have values between 0.5 and 0.95 on the scale. Moreover, a further anchor-point (for being “fully out” of the set of countries with some degree of press subsidies) is set between Ireland and the United States. Thus, the anchor- and threshold-points are 1, −1, and −1.5.
Findings
In the study at hand, the application of QCA for typology building consists of three steps. Each step offers valuable insights into the grouping of the single cases and shows how the typology is built. First, the dimensions press market, political parallelism, and journalistic professionalism are analyzed. Second, the dimensions drawn from Hallin and Mancini’s (2004) broader category “role of the state” are analyzed together. This “multistep approach” has several advantages: First, it helps to reduce the number of conditions in each step; second, it ensures an equal methodological treatment of the subdimensions and avoids an overevaluation of the dimension role of the state. This aspect is problematic in the cluster analysis by Brüggemann et al. (2014): Their cluster analysis treats all six single variables the same, regardless of the fact that half of them actually belong to the same original dimension as described by Hallin and Mancini (2004). By dividing the conditions up into two “blocks”, the multistep approach to QCA thus helps to get a more even weighting of the single dimensions. The analysis is carried using the software fsQCA. 8
First Step
In the first step, the three conditions “inclusiveness of the press market”, “journalistic professionalism”, and “political parallelism” are analyzed. A closer look at the truth table (Table 2) hints to a first result: With two small exceptions (Austria and Portugal; in line with the findings in Brüggemann et al. 2014), the cases belonging to Hallin and Mancini’s polarized-pluralist and democratic-corporatist models clearly group together. The Southern European countries and Austria (GR, ES, FR, IT, AT) are characterized by the combination of a “noninclusive press market”, “low professionalism”, but “political parallelism”—which is in line with the depiction of the polarized-pluralist model by Hallin and Mancini (2004). Furthermore, Germany, Switzerland, and the Scandinavian countries (DE, CH, FI, SE, NO) form another type, showing an “inclusive press market”, “journalistic professionalism”, and a “lack of political parallelism”. This group is the antipode of the polarized-pluralist model, which is also consistent with Hallin and Mancini (2004).
Truth Table First Step.

Note. GR = Greece; ES = Spain; FR = France; IT = Italy; AT = Austria; DE = Germany; CH = Switzerland; FI = Finland; SE = Sweden; NO = Norway; BE = Belgium; US = United States; DK = Denmark; NL = Netherlands; IE = Ireland; GB = Great Britain; PT = Portugal.
By minimizing the truth table according to the rules of Boolean algebra, a solution with two solution paths results: First, the absence of high political parallelism leads to a group consisting of liberal and democratic-corporatist countries (FI, DK, NO, US, BE, DE, SE, GB, IE, PT, CH, NL). Second, the combination of a noninclusive press market and low journalistic professionalism describes Greece, Spain, France, Italy, Ireland, Great Britain, and Austria. This latter combination will be used again in the last step of the analysis. Therefore, we label this combination weak press for a better understanding.
Second Step
In the second step, we analyze the dimension “role of the state”, which has been found to consist of three independent subdimensions: “strength of public broadcasting”, “ownership regulation”, and “press subsidies”. The truth table in Table 3 shows that the Scandinavian countries (FI, SE, DK, NO) and Spain are grouped together. These countries are characterized by a “strong public broadcasting system”, “little ownership regulation”, and “higher amounts of press subsidies”. The second group of countries contains Great Britain, Germany, Switzerland, Austria, and France. These countries share the characteristics of a “strong PBS”, “high press subsidies”, and “ownership regulation”.
Truth Table Second Step.

Note. GR = Greece; ES = Spain; FR = France; IT = Italy; AT = Austria; DE = Germany; CH = Switzerland; FI = Finland; SE = Sweden; NO = Norway; BE = Belgium; US = United States; DK = Denmark; NL = Netherlands; IE = Ireland; GB = Great Britain; PT = Portugal.
Next, minimizing the truth table by means of Boolean algebra leads to more parsimonious sets. The result consists of two solution paths: The first solution path describes countries with high amounts of press subsidies (SE, NO, IT, FR, BE, DK, FI, GB, GR, ES, PT, AT, NL, CH, DE). This solution contains democratic-corporatist and polarized-pluralist media systems. The second solution path is characterized by low investments in the public broadcasting system and low degrees of ownership regulation. This solution path features the United States, Portugal, Ireland, Belgium, the Netherlands, and Italy. This combination signifies a weak role of the state and, thus, we label it deregulated media market.
Third Step
Finally, all four new conditions are analyzed together. To do so, we include all four dimensions in the final analysis (i.e., all four conditions that resulted in the first and second step of the analysis). The truth table shows that the democratic-corporatist countries (DE, CH, FI, SE, DK, NO) share similar conditions, namely, “high degrees of press subsidies”, “regulated media markets”, and “low degrees of political parallelism” (Table 4). This means that journalistic professionalism and newspaper readership is also high in those countries, which is in line with Hallin and Mancini’s (2004) theoretical assumptions. Furthermore, the polarized-pluralist countries (Greece, Spain, France, and Austria) have a “stricter regulated media market”, a “weak press”, “high political parallelism”, and “high press subsidies”.
Truth Table Third Step.

Note. GR = Greece; ES = Spain; FR = France; IT = Italy; AT = Austria; DE = Germany; CH = Switzerland; FI = Finland; SE = Sweden; NO = Norway; BE = Belgium; US = United States; DK = Denmark; NL = Netherlands; IE = Ireland; GB = Great Britain; PT = Portugal.
Next, the truth table is minimized again using Boolean algebra. This procedure results in four solution paths that represent four types of media systems. Two paths show distinct features of Hallin and Mancini’s (2004) typology and represent the liberal and polarized-pluralist model. The democratic-corporatist model, however, is broken down into two new models in this analysis. We name these two new models the press-oriented model and the corporatist model. These models are both characterized by low political parallelism and high press subsidies. It is important to note that all countries have membership degrees in all models. However, they are calibrated and grouped relative to the other cases in the sample. Therefore, the presence or absence of single conditions has to be interpreted in comparison with all cases of the sample. The fuzzy set values are shown in Table 5.
Fuzzy Set Values of Models.

The set of countries belonging to the press-oriented model includes Norway, Denmark, Finland, Sweden, the Netherlands, Belgium, Switzerland, Germany, and Portugal. Norway shows the highest membership scores for this solution and can be considered typical, while the Netherlands shows the lowest membership score (see Table 5 and Figure 2). Regarding the conditions, this solution path is characterized by low political parallelism, high press subsidies, and has no weak press (i.e., high newspaper circulation and high journalistic professionalism).
The solution path for the corporatist model comprises Norway, Denmark, Finland, Sweden, Switzerland, Germany, and Great Britain. Denmark, Finland, and Norway show the highest membership scores, while Sweden, Germany, and Switzerland show the lowest membership scores (see Table 5 and Figure 2). This combination of conditions is similar to the press-oriented system. However, it features a regulated press market (instead of the absence of weak press). In brief, the corporatist system is characterized by low political parallelism, comparatively high press subsidies, and a regulated media market. Except for Great Britain, all cases in this second solution were present in the first solution paths as well. The theoretical implications of these two “related” models will be discussed later.
The solution path for the liberal model includes only two cases, namely, Ireland and the United States. In line with Hallin and Mancini (2004), the United States shows the highest membership score and can, thus, be considered typical for this media system. Regarding the conditions, it shares low degrees of political parallelism with the two democratic-corporatist systems, but combines this with low press subsidies and a highly deregulated media market.
Finally, the solution path for the polarized-pluralist model contains Italy, Greece, Spain, France, and Austria. Italy and Greece show the highest membership scores, which supports Hallin and Mancini’s (2004) claim that these two countries are the ideal types of this media system model. The solution path for the polarized-pluralist model is characterized by high press subsidies, strong political parallelism, and a relatively weak press.
Figure 1 visualizes the four solution paths discussed above. They can be interpreted as four models of media systems. These findings widely confirm the theoretical assumption made by Hallin and Mancini (2004). Furthermore, QCA validates the results of the cluster analysis by Brüggemann et al. (2014). However, the empirical analysis in this study helps to eliminate some of the theoretical uncertainties.
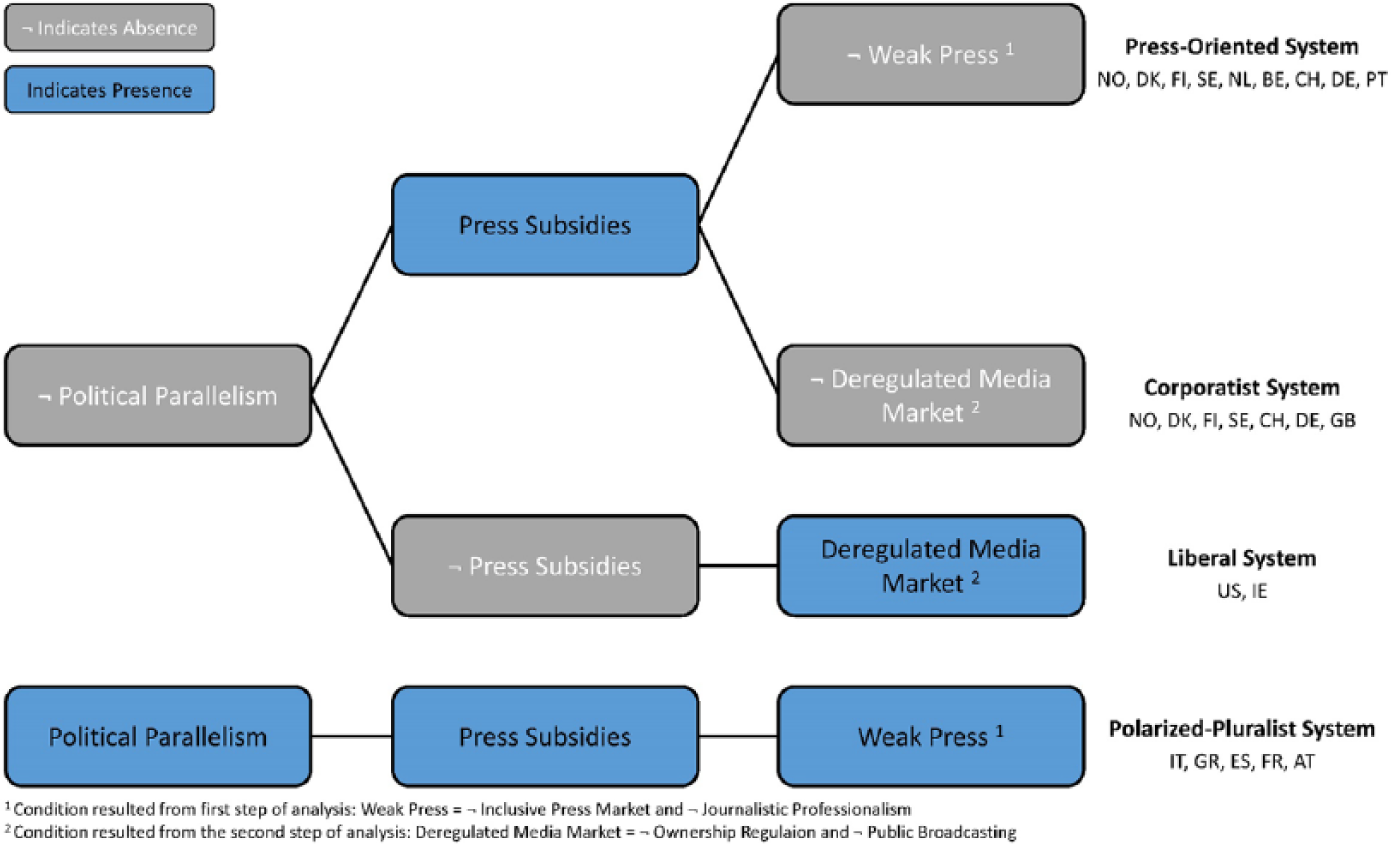
Solution paths.
Discussion
In our analysis, we find four models of media systems that widely confirm the theoretical assumptions. Moreover, a range of border cases are identified that deserve further explication. Our results show that the theoretical polarized-pluralist model and the liberal model are very well reflected in our typology, while the democratic-corporatist model can be described more precisely (see Figure 2).

Bar chart of fuzzy values for models.
The democratic-corporatist system is divided into two groups in our analysis. These two new models differ with respect to their media markets: The press-oriented model shows the relative absence of a weak press, while the corporatist model features a regulated media market instead (while keeping all other conditions the same). These models are not exclusive and consist partly of the same cases, namely, Germany, Switzerland, and the Scandinavian countries (NO, FI, SE, DK, DE, CH). Those countries show characteristics of both models. Thus, their media system could also be described by combining our two labels: It is a press-oriented corporatist model. Set-theoretically speaking, they could be combined with a disjunction to create a type incorporating both of these aspects.
In contrast, the Netherlands, Belgium, and Portugal are only included in the press-oriented model. These are countries that do not have a weak press but a highly deregulated media market. This finding suggests that the media markets of the Netherlands, Belgium, and Portugal are more liberalized than those of Germany, Switzerland, and the Scandinavian countries, which is in accordance with the findings of Brüggemann et al. (2014). Thus, the Netherlands, Belgium, and Portugal can be considered hybrid media systems that show characteristics of several models. Belgium and the Netherlands mainly share characteristics of the press-oriented model. However, those countries spend less on PBS than corporatist countries (NL: 0.34; BE: 0.25) and have fewer press subsidies (NL: 0.71; BE: 0.89).
Portugal, in contrast, shares characteristics of the polarized-pluralist and the liberal model. However, Portugal has less political parallelism than countries of the polarized-pluralist model and more press subsidies than the liberal media system. Interestingly, Portugal is labeled “polarized-pluralist” by Hallin and Mancini (2004). However, this country has been argued to “diverge significantly” from the polarized-pluralist model and to “move away” from the political parallelism that characterizes Spain, Italy, and Greece (Hallin and Mancini 2012: 292). Our results confirm this observation and show that Portugal is nowadays closer to democratic-corporatist countries, mainly because of its higher values for “inclusiveness of the press market”.
Furthermore, Great Britain is included in the corporatist model. This country shares characteristics of democratic-corporatist (comparatively “low degrees of political parallelism”, higher “press subsidies”, and “regulated media market”), liberal (“no political parallelism”), and even polarized-pluralist models (a comparatively “weak press” and “low professionalism”). Hallin and Mancini (2004) assigned Great Britain to the “liberal” media systems. However, critics point out that Great Britain varies from the ideal type of this model. For instance, Humphreys (2012) and Norris (2009) argued that Great Britain is characterized by a strong PBS and has an ideologically polarized press, and thus does not fit the liberal model. Moreover, Nielsen and Linnebank (2011) find that Great Britain shows high amounts of indirect press subsidies, a feature that has been linked to polarized-pluralist or democratic-corporatist media system types. Indeed, our findings suggest that Great Britain shares characteristics of all three original models.
A possible ad hoc explanation regarding the two different democratic-corporatist systems is that they differ in two dimensions of media systems: The press-oriented system reflects the journalistic side of media systems (relative “absence of weak press”), while the corporatist system reflects the role of the state (“regulated media market”). Germany, Switzerland, and the Scandinavian countries belong to both groups and include both the journalistic as well as the regulative aspects of media systems.
In the polarized-pluralist system, France and Austria are notable exceptions (see Figure 2). These countries clearly belong to this model, but also show high membership scores (below 0.5) in other media system models. France shares characteristics of the corporatist system. This is due to its comparatively low score of political parallelism (FR: 0.61), which is considerably lower than those of Spain (ES: 0.95), Italy (IT: 0.93), or Greece (GR: 0.89). France can, thus, be considered less polarized-pluralist than the other three Southern European countries.
Similarly, Austria also has a lower membership value in the set of political parallelism (AT: 0.51) and a higher nonmembership value in the corporatist model. The country differs from other polarized-pluralist countries regarding its higher value for the condition inclusive press market (AT: 0.39). Interestingly, Austria has been assigned to the democratic-corporatist countries by Hallin and Mancini (2004). However, previous research finds that Austria shows striking similarities to the Mediterranean countries, for example regarding journalistic professionalism (Karmasin et al. 2011). In other words, Austria can be considered a hybrid system combining democratic-corporatist elements ("inclusive press market") as well as polarized-pluralist ones (“high degrees of political parallelism”, a “weak press”).
The liberal media system model consists of distinct cases, namely, the United States and Ireland. However, Ireland’s membership values for other models are slightly higher than those of the United States. This finding underlines the assumption that the United States is the ideal type of the liberal model.
A considerable amount of cases is reflected in several models, yet they share characteristics with different media systems that vary fundamentally from each other. In that sense, they can be considered hybrid media systems that incorporate different elements from various media system models. The Netherlands and Belgium, for instance, have a “deregulated media market” but “no weak press”; Great Britain represents the exact opposite. They are, thus, also similar to Germany, Switzerland, and the Scandinavian countries that tend to show both of these aspects. To round off the discussion, we will provide further insights into the advantages, challenges, limitations, and promising outlooks of the analysis at hand in the following conclusion.
Conclusion
Our study largely verifies the theoretical models of polarized-pluralist and liberal media systems as suggested by Hallin and Mancini (2004). Although there are some cases deviating from the classification of the original typology, the underlying combinations of conditions confirm the theoretical assumptions. The democratic-corporatist model, however, is divided into two specific groups of cases. This result hints at necessary qualifications in the original framework of Hallin and Mancini (2004). By applying the case-oriented approach of QCA for our study, we are able to identify both border and ideal cases and describe them in a precise manner. Table 6 provides a comparison of outliers identified in the cluster analysis (see Brüggemann et al. 2014). Besides being able to describe the border cases precisely, analyzing the data via QCA also identifies two further outliers that are drowned in the noise of the cluster analysis.
Comparison of Outliers Identified in the QCA versus the Cluster Analysis.

Note. QCA = Qualitative Comparative Analysis.
The application of QCA for typology building has some advantages over other methods, but it also implies several challenges. In the following, we discuss the advantages as well as challenges of this approach and finally point to possible limitations of this paper.
Advantages
As our analysis has shown, QCA has some striking advantages for the purpose of typology building. In our example, all four models require only three conditions to be characterized. This shows that QCA offers a parsimonious and intuitive way of building typologies. This is achieved by the minimization of conditions according to the rules of Boolean algebra. By minimizing, we can exclude conditions that logically do not add to a significant typology. In contrast, using all four conditions to describe the cases (by simply writing down what combination of conditions each case shows) is what is shown in the actual truth table rows just before the minimization. In fact, the truth tables are very useful for a first idea of how cases group together and what combination of conditions they share. However, relying only on the truth table would result in complex and overspecified models that would, in some instances, create several single-case models. Similarly to cluster analysis, it is eventually a trade-off between many accurate, but complex models and a smaller number of less accurate, but parsimonious models. By reducing the number of conditions, the QCA approach to typology building enables the reduction of the number of models, which results in parsimonious typologies.
Furthermore, QCA differs from methods using linear algebra regarding its cognitive interest. While explorative approaches based on traditional, quantitative statistics focus their interpretation on the models with regard to original variables, explorative analyses based on set theory focus on the cases with regard to the models. In other words, both the description of single cases as well as the combinations of conditions are in the center of interest. Using QCA for typology building also sheds further light on the interactions between the conditions. The approach highlights the systematic similarities between the cases constituting the models. Insofar, QCA is suited as a third way between mere quantitative or qualitative approaches and is useful to bridge these different approaches — which is especially useful when building typologies. It is perfect for middle-N samples with too little cases for robust statistical calculations, but too much for in-depth qualitative case studies that we find so often in cross-country comparative research.
Finally, QCA allows for calculating fuzzy set scores for all cases, regardless of whether they are set members or nonmembers. These fuzzy set scores reflect the degree to which a case falls into or outside a set. As membership scores for combinations of conditions can be calculated easily, it is possible to have a gradual measure of membership and nonmembership. Thus, it is possible to compare fuzzy values of single cases for all models. This can be visualized by using bar charts that display the membership scores of each model for each case. By doing so, outliers, typical as well as border cases can easily be identified. In the analysis at hand, we show this visual strategy in Figure 2. 9
Challenges
QCA is very sensitive regarding researcher decisions and it is, thus, necessary to pay close attention to the particular steps of the analysis (also see Schneider and Wagemann 2010). One challenge is the calibration of data. The calibration is crucial for determining the outcome of a QCA, because it decides on whether a case is a member or nonmember of a set. Thus, it is important that this step is done with the necessary attention, and that all decisions are reported transparently. The accompanying justification regarding anchor-points and threshold-levels should refer to the theoretical knowledge to legitimize the decisions.
Furthermore, QCA benefits from clear and sparing labels. This is especially crucial in a multistep approach, because conditions are combined based on the outcomes in a first step and used again in later steps of the analysis. These new conditions have to be labeled with caution to enable further theory building and avoid confusion. The labels should reflect the underlying assumptions, yet they should not be confused with other conditions. Moreover, labels should not simply describe the full solution path but synthesize the conditions in an intuitive way to create a better understanding of the respective step. The importance of labeling also refers to the types that result from the analysis. In sum, the researcher has to make sure that the labeling balances a parsimonious wording, discriminatory power, and distinctness of the concepts as well as transparency. This is, of course, a difficulty that is shared by QCA and cluster analysis.
Finally, interpreting the results can be challenging. Compared with quantitative methods based on linear algebra, QCA is more case-oriented in interpreting results. Therefore, only describing the solution paths that resulted from a QCA would be a variable-oriented interpretation that does neither meet the requirements of Boolean algebra, nor use its potential to the fullest. When using QCA for typology building, the researcher has to interpret the cases in the light of the resulting solution paths to identify and explain outliers as well as typical constellations of conditions. In that sense, it is not only an interchange between cases, conditions, and solutions, it similarly is a back and forth process between theory and practice, between “ideas and evidence” (Ragin 2000).
Limitations and Outlook
There are several limitations to the exercise we demonstrated in this study: First, the analysis relies on secondary data that were collected in the context of another project. Therefore, some calibration decisions were difficult because the data lacked sufficient variance. For example, the condition “ownership regulation” originally consists of three nominal variables and, thus, only had four values. We only appointed cases to set members that had high values on all the underlying scales. However, a less rigorous calibration would have had considerable impact on the results obtained.
A further limitation of this study is rooted in the data distribution. Our calibration led to skewed scales, for example, in the case of political parallelism (small number of members) or press subsidies (small number of nonmembers). However, we argue that this skewed distribution actually reflects the reality of our seventeen cases best. Fortunately, QCA is not nearly as sensitive to skewed distributions as approaches based on linear algebra.
Finally, the scope of the study is limited to some degree: The empirical sample only contains Western democracies and, as such, can mainly draw conclusions about Western, established, high-income democracies, limiting the generalizability of the study. It is likely that the framework by Hallin and Mancini (2004) needs to be complemented with further dimensions, such as press freedom (e.g., looking at emerging nations) or foreign media ownership (e.g., looking at Eastern Europe), to discriminate countries beyond the Western media systems. It is an open empirical question whether the addition of further dimensions would lead to new models additional to the “Western” ones, completely changed models, or further “hybrid” models of media systems.
Furthermore, just like the original typology by Hallin and Mancini, the study does not include data on the digital media environment, but remains mainly in the old, “analogue” world of mass media. There are two main reasons for this: First, one important aim of the study is to empirically test and cross-validate the theoretical model of Hallin and Mancini (2004), who do not include online media in their study. Second, our data sources stem from 2008–2010, which would imply using distorted and outdated data on the volatile and ever-changing digital world. Third, there is hardly any variation for such data on the country level within the world of Western, established democracies: The so-called “digital divide” can mainly be found between socioeconomic classes within countries, as well as between the global North and the global South. To conclude, an update of the dimensions that establish media systems would need to encompass indicators regarding online media and Internet access, such as the Internet penetration, the amount of advertisement capital invested in the web (versus broadcast and print media), and the degree to which citizens source political information online. Expanding the empirical sample beyond the West and complementing the dimensions with indicators relating to press freedom, foreign ownership, and data on the online environment is a logical next step to further pursue the quest for a universal media system typology.
Regardless of these limitations and challenges of application, we feel that QCA is a very fruitful approach for typology building. The results of our example proved to enhance, diversify, and refine the original, theoretical media systems typology by Hallin and Mancini (2004). In addition to the analysis by Brüggemann et al. (2014), QCA proves to be a very useful approach to combine theoretical and empirical typologies and cross-validate unique claims and results by different approaches. There is much added value from the QCA with regard to the precise identification and description of typical cases, border cases, and outliers, thus bridging the gap between big-N quantitative, variable-based approaches and low-N qualitative, purely case-oriented techniques. Looking specifically at border cases, typical cases, and outliers is very rewarding for the researcher and, as we believe, the most interesting thing for the reader as well. The practice of typology building can, therefore, only benefit both conceptually and empirically from a set-theoretic, case-oriented orientation. Thus, we make a case for more research to extend this approach and further show its utility in developing empirical typologies.
Footnotes
Declaration of Conflicting Interests
The authors declared no potential conflicts of interest with respect to the research, authorship, and/or publication of this article.
Funding
The authors received no financial support for the research, authorship, and/or publication of this article.