
Abstract
Purpose:
Aerodynamic particle size distribution (APSD) determination is a key quality attribute for inhaled therapeutics. The next-generation impactor is the gold standard for APSD determination; however, it suffers from lengthy analysis times due to the need for high-performance liquid chromatography (HPLC)-based quantitation. In this work, a novel method employing image analysis is developed to derive APSD metrics from dry powder inhalers.
Major Findings:
Analysis of neat active pharmaceutical ingredient (API), API/lactose blends, and stressed blend samples is demonstrated. The method shows sufficient resolution to differentiate between different sizes of neat API and within lactose blends. In addition, the results obtained from image analysis are comparable to the HPLC derived results.
Conclusions:
This study establishes the feasibility of image analysis for faster APSD determination.
Introduction
Dry powder inhalers (DPIs) are commonly used for the targeted delivery of therapies into the lung.1–4 These products typically consist of a micronized active pharmaceutical ingredient (API) blended with a carrier powder such as lactose. The blend is subsequently loaded into a capsule or blister and delivered to the patient via an inhaler. Multiple frontline treatments for asthma, chronic obstructive pulmonary disease, and cystic fibrosis are delivered via DPI, capitalizing on dry powders’ stability and ease of use.2–6
A critical quality attribute for dry powder inhalation products is aerodynamic performance. It has been shown that the aerodynamic particle size distribution (APSD) can significantly influence clinical efficacy.1,6,7 The APSD of a particular therapy will dictate in which region of the lungs the API will be deposited. Depending on the indication, different regions of the lungs may need to be targeted. The APSD can be modulated to optimize API delivery to these regions. Different factors affecting APSD include particle density, shape, and size.6,7 Generally, particles possessing an aerodynamic diameter of <5 µm are considered inhalable.8,9
The gold standard for APSD determination is the next-generation impactor (NGI).1,2,6,7,10–13 Following DPI actuation, the aerosolized drug product flows through the NGI, carried by a constant-velocity air stream over a series of seven different stages containing specific size cutoffs.7,10–12 Particles fall out of the airflow by differential inertia and impact onto the collection cups. 1 The API is subsequently extracted from each NGI component using a solvent and analyzed by liquid chromatography (LC) to quantify the mass of API in each component. The resulting mass distribution is used to derive three key values: median mass aerodynamic diameter (MMAD), the median aerodynamic diameter of all particles in a sample; fine particle fraction, the percentage of particles in a sample below 5 µm; and geometric standard deviation (GSD), which represents the broadness of the APSD.1,6,7,10,14
One significant hindrance to APSD determination by NGI is the time- and resource-intensive nature of the analysis. While actuating a dose into the NGI may only take a few seconds, a significant amount of time is dedicated to downstream processing. The drug must be recovered from the impactor components and subsequently analyzed by high-performance LC (HPLC). While short HPLC methods can be developed, the sheer number of samples can lead to long run times. 1 Therefore, it would be highly desirable to develop methods that can accurately determine APSD metrics from NGI runs while simultaneously decreasing the analysis time to enable higher throughput analysis. Faster analysis of NGI runs would lead to quicker drug product development and ultimately shortened timelines.
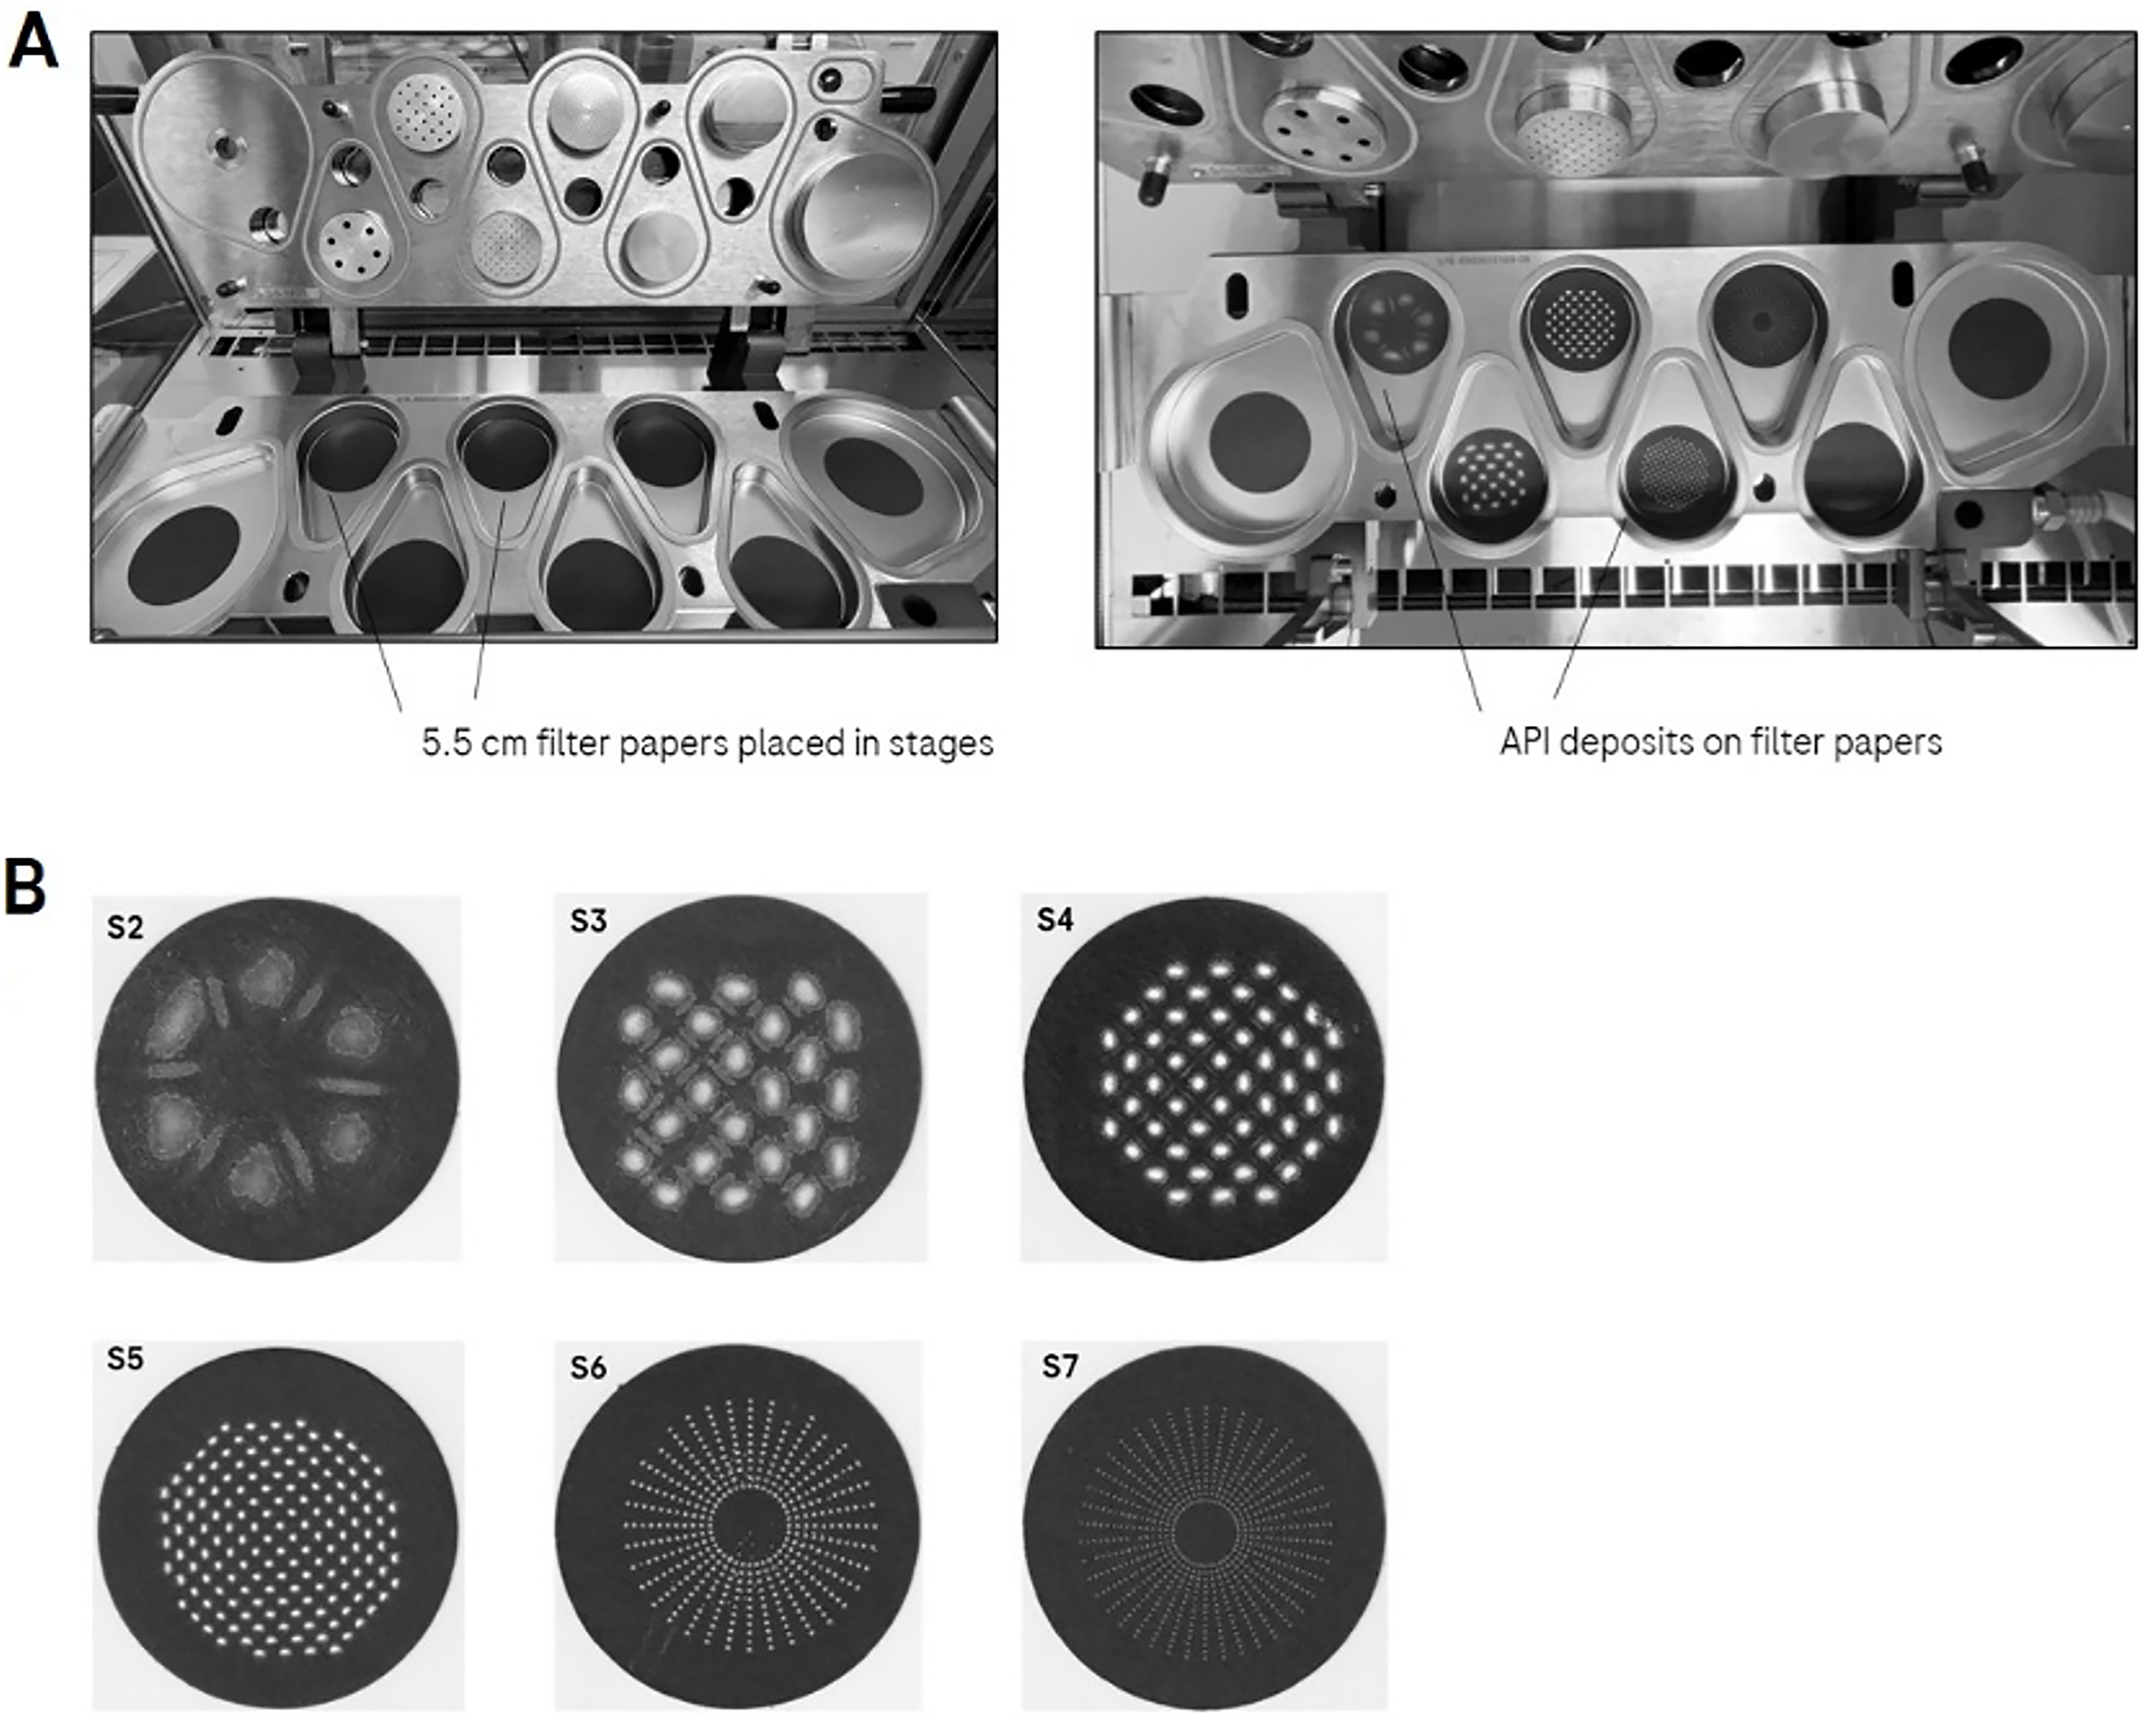
Image segmentation is used extensively in biology to quantify particle abundance and is used as a high-throughput analysis technique.15–17 Given that the NGI deposits API in a consistent pattern in the collection cups (Fig. 1B), we hypothesized that digital image analysis could efficiently analyze the APSD from an NGI run. In this study, we apply digital image segmentation techniques to analyze NGI data. We demonstrate the suitability of this method for neat API, lactose/API blends, and stability determination.
Methods and Materials
This article does not contain any studies with human or animal participants.
Blend and capsule preparation
Formulations were composed of an investigational API mixed with lactose using a Turbula mixer. For all NGI assays, neat API or API/lactose blends were filled manually into no. 3 HPMC capsules (Capsugel, Morristown, NJ). Capsules were actuated using a custom medium-high resistance RS01 DPI (Berry, Evansville, IN). ML001 or SV003 grade lactose (DFE Pharma, Germany) was used for the blends.
An NGI configuration with a rubber mouthpiece, induction port, and preseparator (MSP Corporation, Shoreview, MN) was used. A 50 L/min flow rate was used for all NGI analysis. The airflow was mediated by a critical controller and vacuum pump (Model TPK 2100-R, Copley Scientific Ltd, UK).
API PSD measurements
A Malvern Mastersizer 3000 equipped with the HydroMV accessory was used to obtain laser diffraction measurements to determine the particle size distribution (PSD) of all API samples. A dispersant consisting of 0.2% v/v Span85 in heptane was used, and the optical properties were optimized using the Malvern Mastersizer software.
Image analysis of PSD
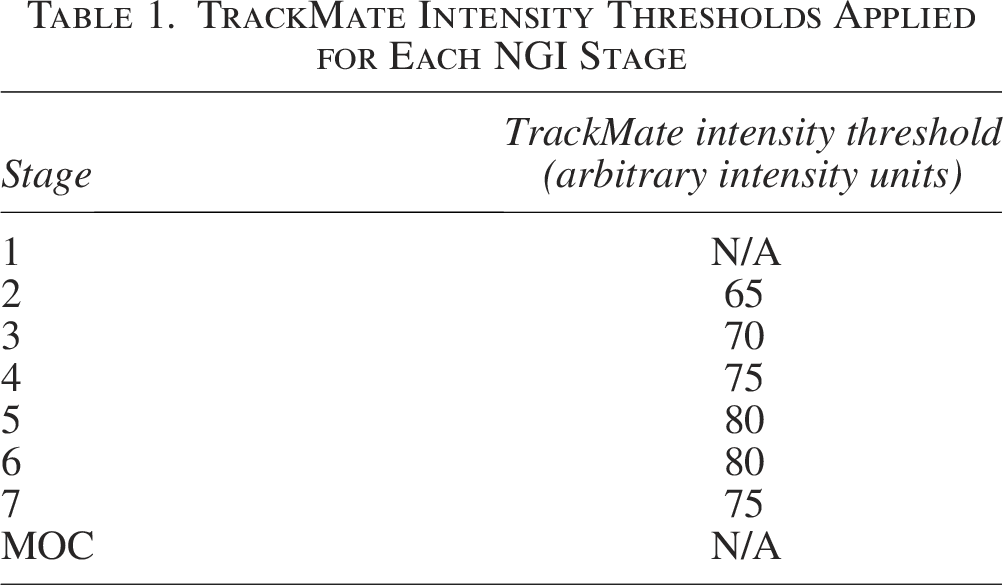
To capture API particles for imaging, black 5.5 cm diameter filter papers (Ahlstrom, Finland) were placed in each NGI collection cup directly below the NGI nozzles (Fig. 1A). It should be noted that the filters remained in place and their positioning did not vary pre- and postcapsule actuation. After capsule actuation, the filter papers were removed and scanned on a Canon LiDE 400 flatbed scanner at 600 DPI using Canon IJ Scan Utility Software (Canon, Japan). The resulting scan was separated into eight images, one for each filter paper. Images were compressed from 1344 × 1344 pixels to 672 × 672 pixels and converted to 32-bit format. TrackMate, an additional component of FIJI software, was used to threshold the imaged filter papers for regions of interest (ROI) that contain the desired signal. General detection thresholds for each stage are described in Table 1. Due to the innate variability between samples, the detection threshold varied within ±10 arbitrary intensity units and was adjusted while viewing the images. This process was done manually to ensure the API spots were fully encompassed by the ROIs and that regions of the filter paper without API were not included as ROIs. The total intensity values of each ROI were summed to yield the net intensity of all ROIs on a filter paper (Fig. 1). To determine MMAD, FPF, and GSD, the sum of all ROI pixel intensities for each stage was input into Copley Inhaler Testing Data Analysis Software (Copley Scientific Ltd., UK). All conditions were run and analyzed in triplicate. For all figures showing the drug distribution across the different NGI stages, straight lines connecting values from adjacent stages were used to allow the reader to quickly visualize the differences in the distributions.
TrackMate Intensity Thresholds Applied for Each NGI Stage
API recovery for LC analysis
Prior to capsule actuation, stages and the preseparator were coated with a 1% mixture of Tween-20 (Croda Inc., Plainsboro, NJ) in ethanol (KOPTEC, King of Prussia, PA). After actuation, the drug was recovered from the capsule by soaking for 10 minutes in a 100 mL volumetric flask containing 75:25 H2O/acetonitrile solvent (Avantor Performance Materials LLC, Radnor, PA). The DPI was recovered for 10 minutes in a 50 mL beaker containing a 1:1 mixture of H2O/MeOH (Honeywell—Burdick & Jackson, Muskegon, MI). The induction port and preseparator were filled with 5 and 20 mL of 75:25 H2O/acetonitrile solvent, respectively, and rotated for 10 minutes on a Sample Preparation Unit (Model SPU 2009, Copley Scientific Ltd., UK). The collection cups were recovered using an NGI Assistant (MSP Corporation, Shoreview, MN). During NGI assistant extraction, each collection cup was filled with 10 mL of 75:25 H2O/acetonitrile solvent and rocked for 30 minutes at 60 rotations per minute.
Chromatographic conditions
Samples were run on a Waters ACQUITY UPLC BEH Shield RP18 1.7 µM column (Waters, Pleasanton, CA) in an Agilent 1290 Infinity II LC system in isocratic mode with a mobile phase of 75:25 H2O/acetonitrile with a 7 µL injection volume and a 0.5 L/min flow rate. Waters Empower software was used for peak identification and integration.
Results and Discussion
Neat API screen
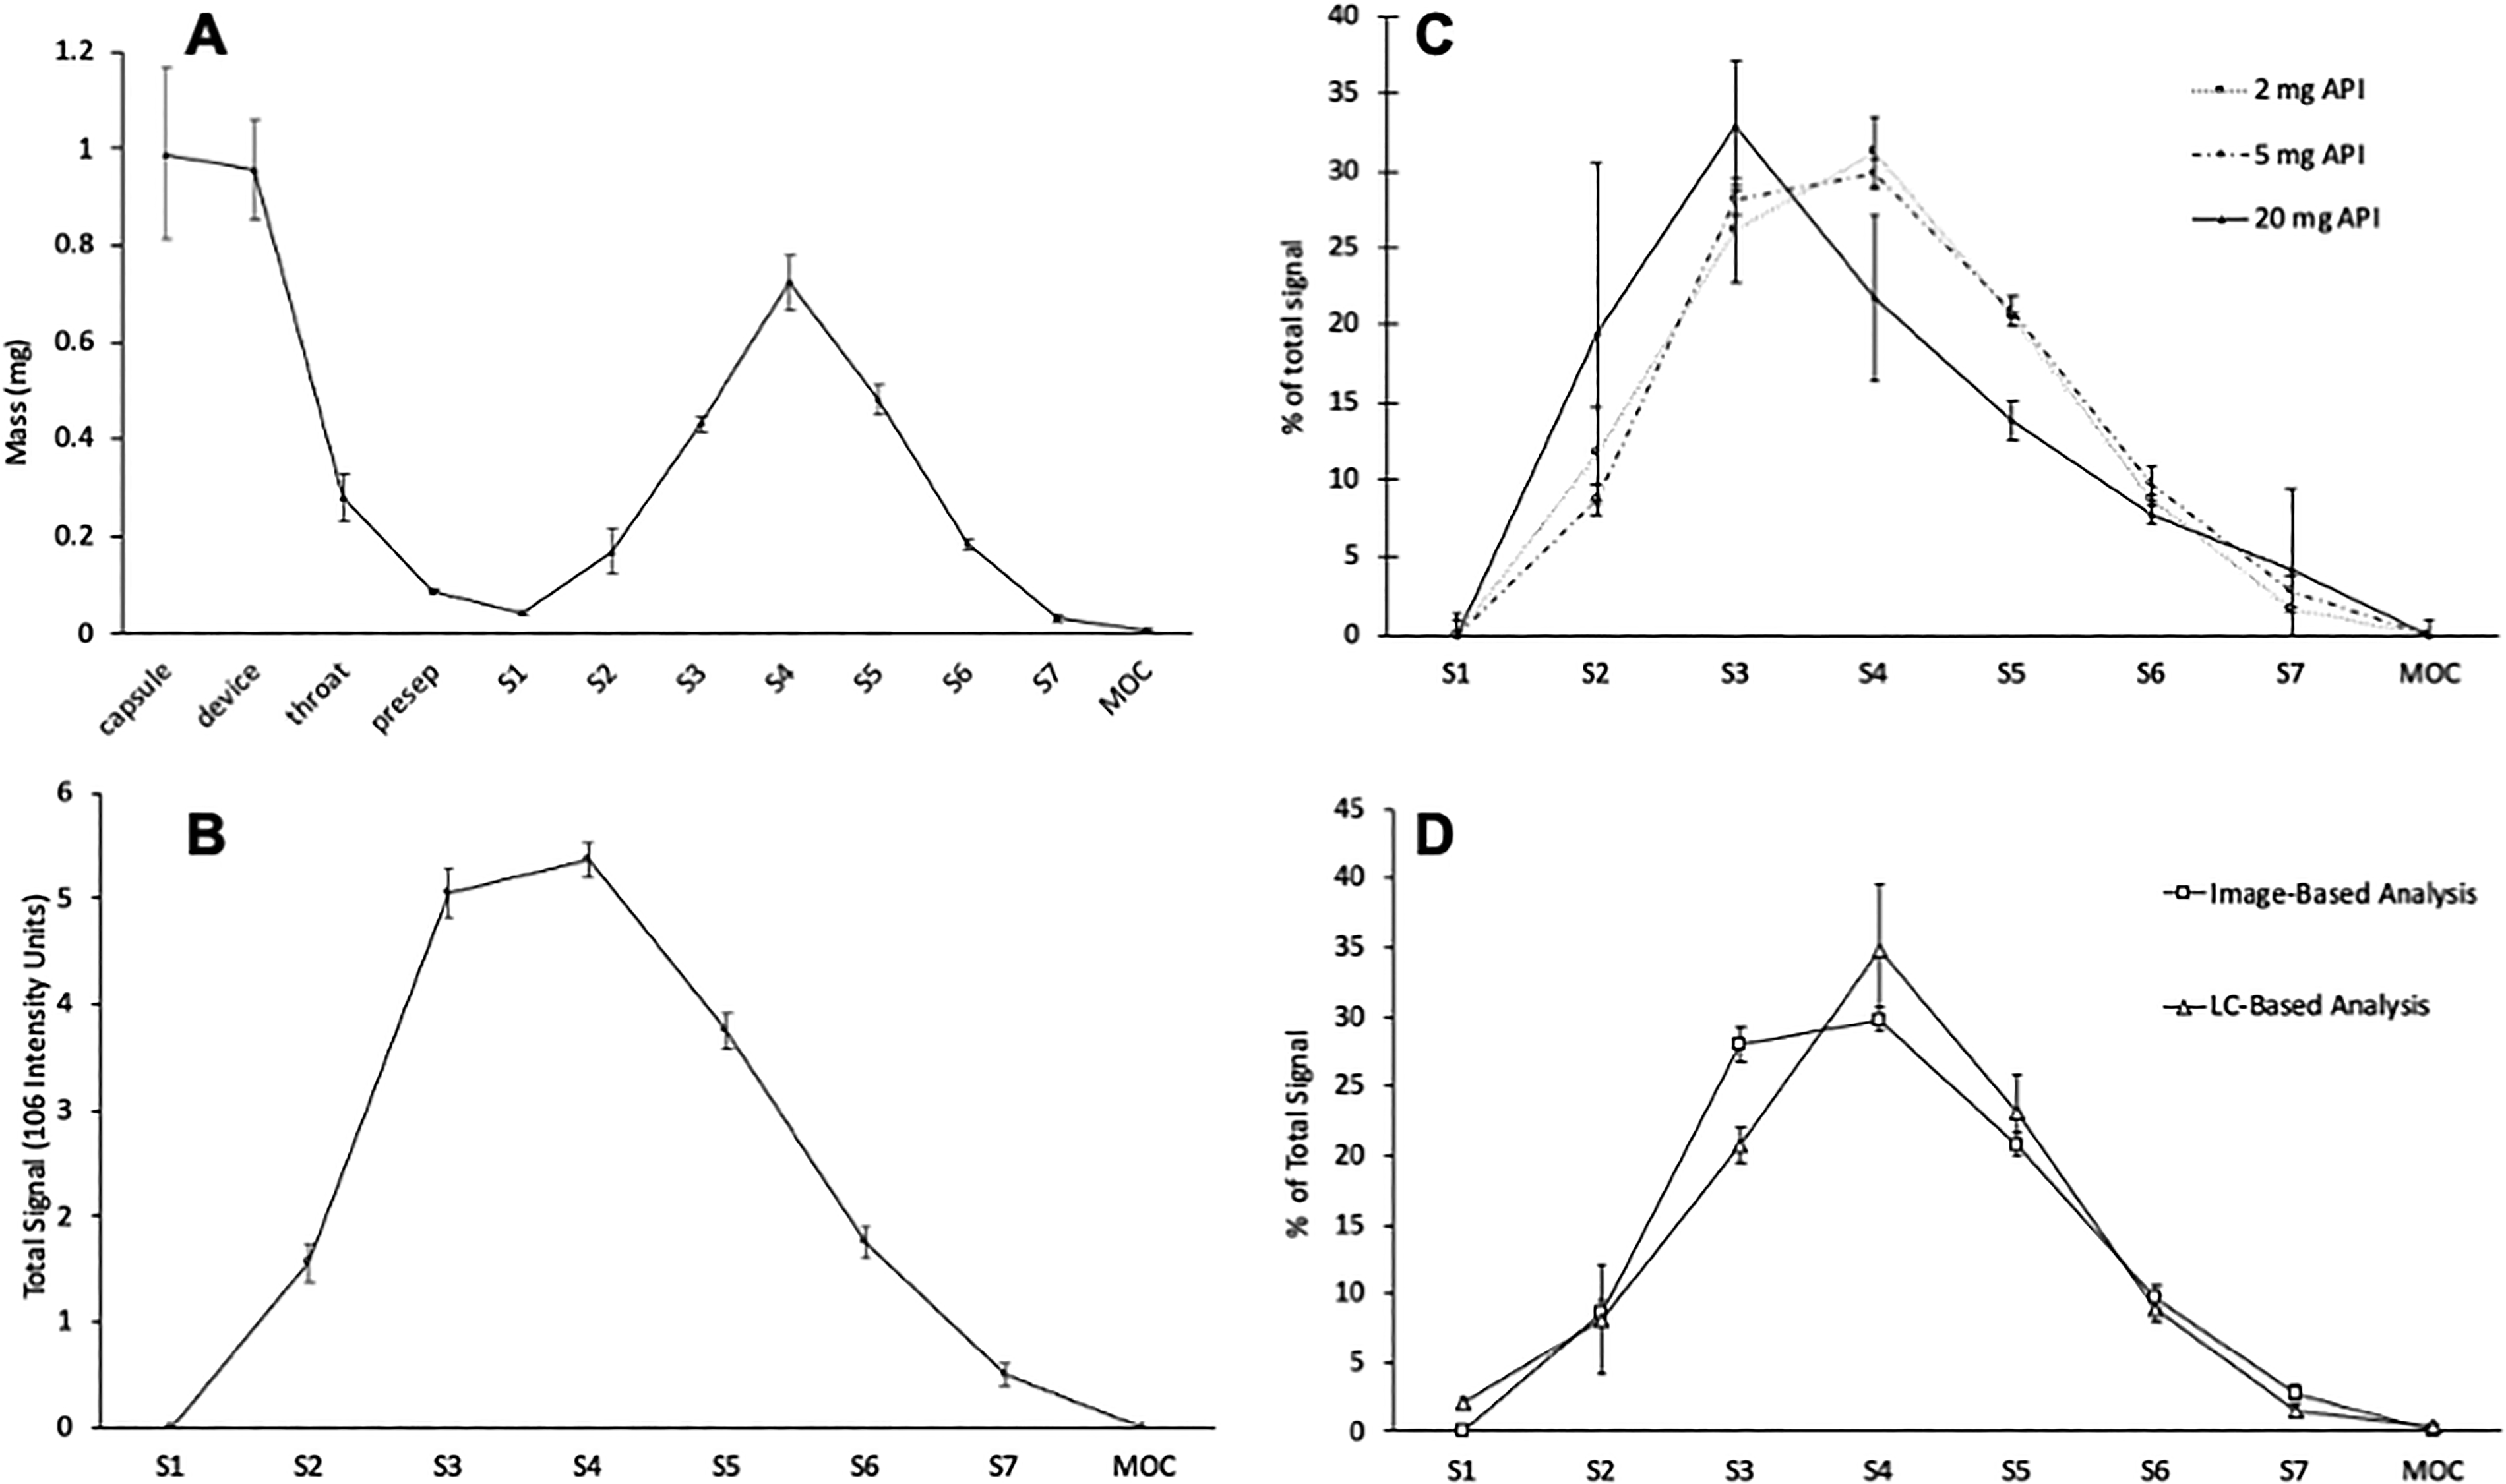
DPI formulations are often composed of a micronized API blended with a carrier such as lactose. However, to demonstrate the feasibility of the image-based approach, a simplified system consisting of neat, micronized API in capsules was initially investigated. Figure 1 shows images of the system setup and the resulting API deposits on the black filter paper. Briefly, capsules containing 5 mg of micronized API (D10 0.73 μm, D50 1.9 μm, and D90 4.4 μm) were actuated onto black filter paper placed in each of the NGI cups. The filters were subsequently removed, scanned, and subjected to the image analysis workflow. In parallel, 5 mg capsules were analyzed by HPLC to compare with the imaging results (Fig. 2A). Three capsules were actuated for each analysis method. Results from the image analysis can be observed in Figure 2B. To compare the distributions derived from image analysis and LC, the amount of signal in each stage (mass or arbitrary intensity units) was expressed as a percentage of the total signal for S1-MOC. An overlay of the distributions obtained by LC and image analysis is shown in Figure 2D and appear to be similar. Further similarity is observed when MMAD, FPF (% impactor mass), and GSD were calculated for both LC and image-based analysis. Table 2 shows very similar values obtained for all three calculated parameters across the two measurement techniques. These results show that image analysis can provide similar metrics to traditional LC-based measurements.
Comparison of APSD Metrics of 5 mg Capsules Containing D50 1.9 μm API Acquired by Image Analysis and LC
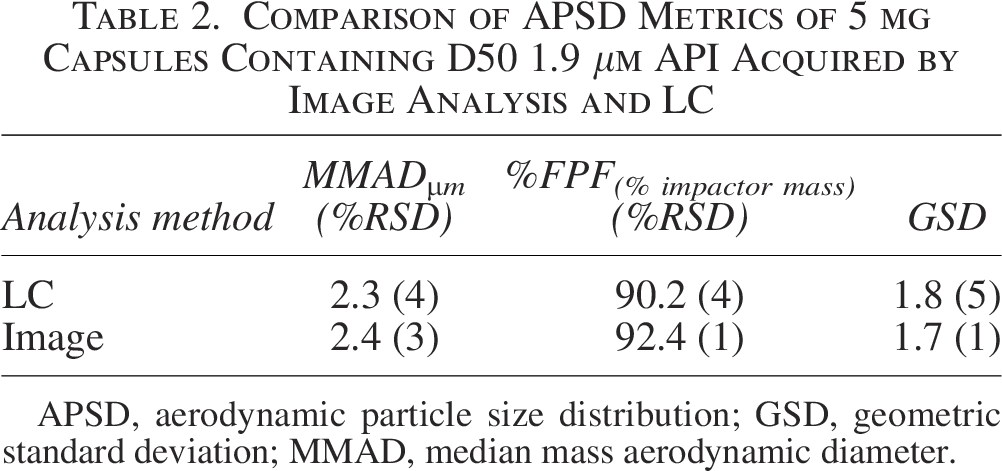
APSD, aerodynamic particle size distribution; GSD, geometric standard deviation; MMAD, median mass aerodynamic diameter.
While the LC and image-derived distributions were similar, it was observed that the image-based method appeared to overestimate the percent signal in S3 and underestimate S4 when compared to LC. It was hypothesized that this may be occurring due to the 2D nature of the scan, which could miss any contributions derived from “stacking” API in the Z dimension. This effect would be more apparent in the stages containing a more mass of API such as S4 and S5. To investigate this, two additional capsule fills were generated (2 and 20 mg) and tested by image analysis. Figure 2C shows that the 2 and 5 mg capsules behaved similarly. However, the distribution of the 20 mg capsule was significantly shifted left, toward the earlier stages. This supports the hypothesis that S4 and S5 could be underestimated due to a stacking effect and demonstrates a limitation of the method for high drug load analysis. One possibility for the difference in distributions is that the filter was not coated while the LC samples were collected with a Tween-20 coating. To test this, capsules were actuated onto filters, and the drug was recovered using the same recovery solvent as the LC samples. The two sets of distributions were virtually identical, supporting the hypothesis that the image-based analysis was causing a shift in the distribution, not the lack of coating.
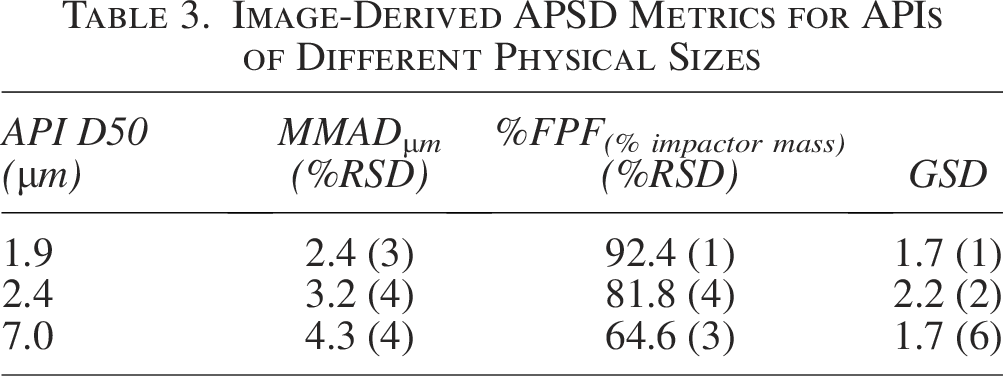
The image-based workflow should ideally be capable of discriminating between different sizes of API. To test this, capsules were filled with 5 mg of micronized API with a D50 of 2.4 and 7.0 μm and subjected to the NGI-image analysis workflow. Results in Figure 3 show a clear difference in the distribution of all three sized APIs. Furthermore, the calculated APSD parameters also demonstrate distinct aerodynamic properties for all three sizes (Table 3). The difference between the APSD metrics was confirmed via single-factor ANOVA with a post hoc Tukey test (S1). It is also important to note that the results were obtained with a high degree of reproducibility, as evidenced by the low (<6%) RSD for all determined parameters. These results demonstrate the ability of the image-based method to differentiate APIs of different physical and aerodynamic sizes.
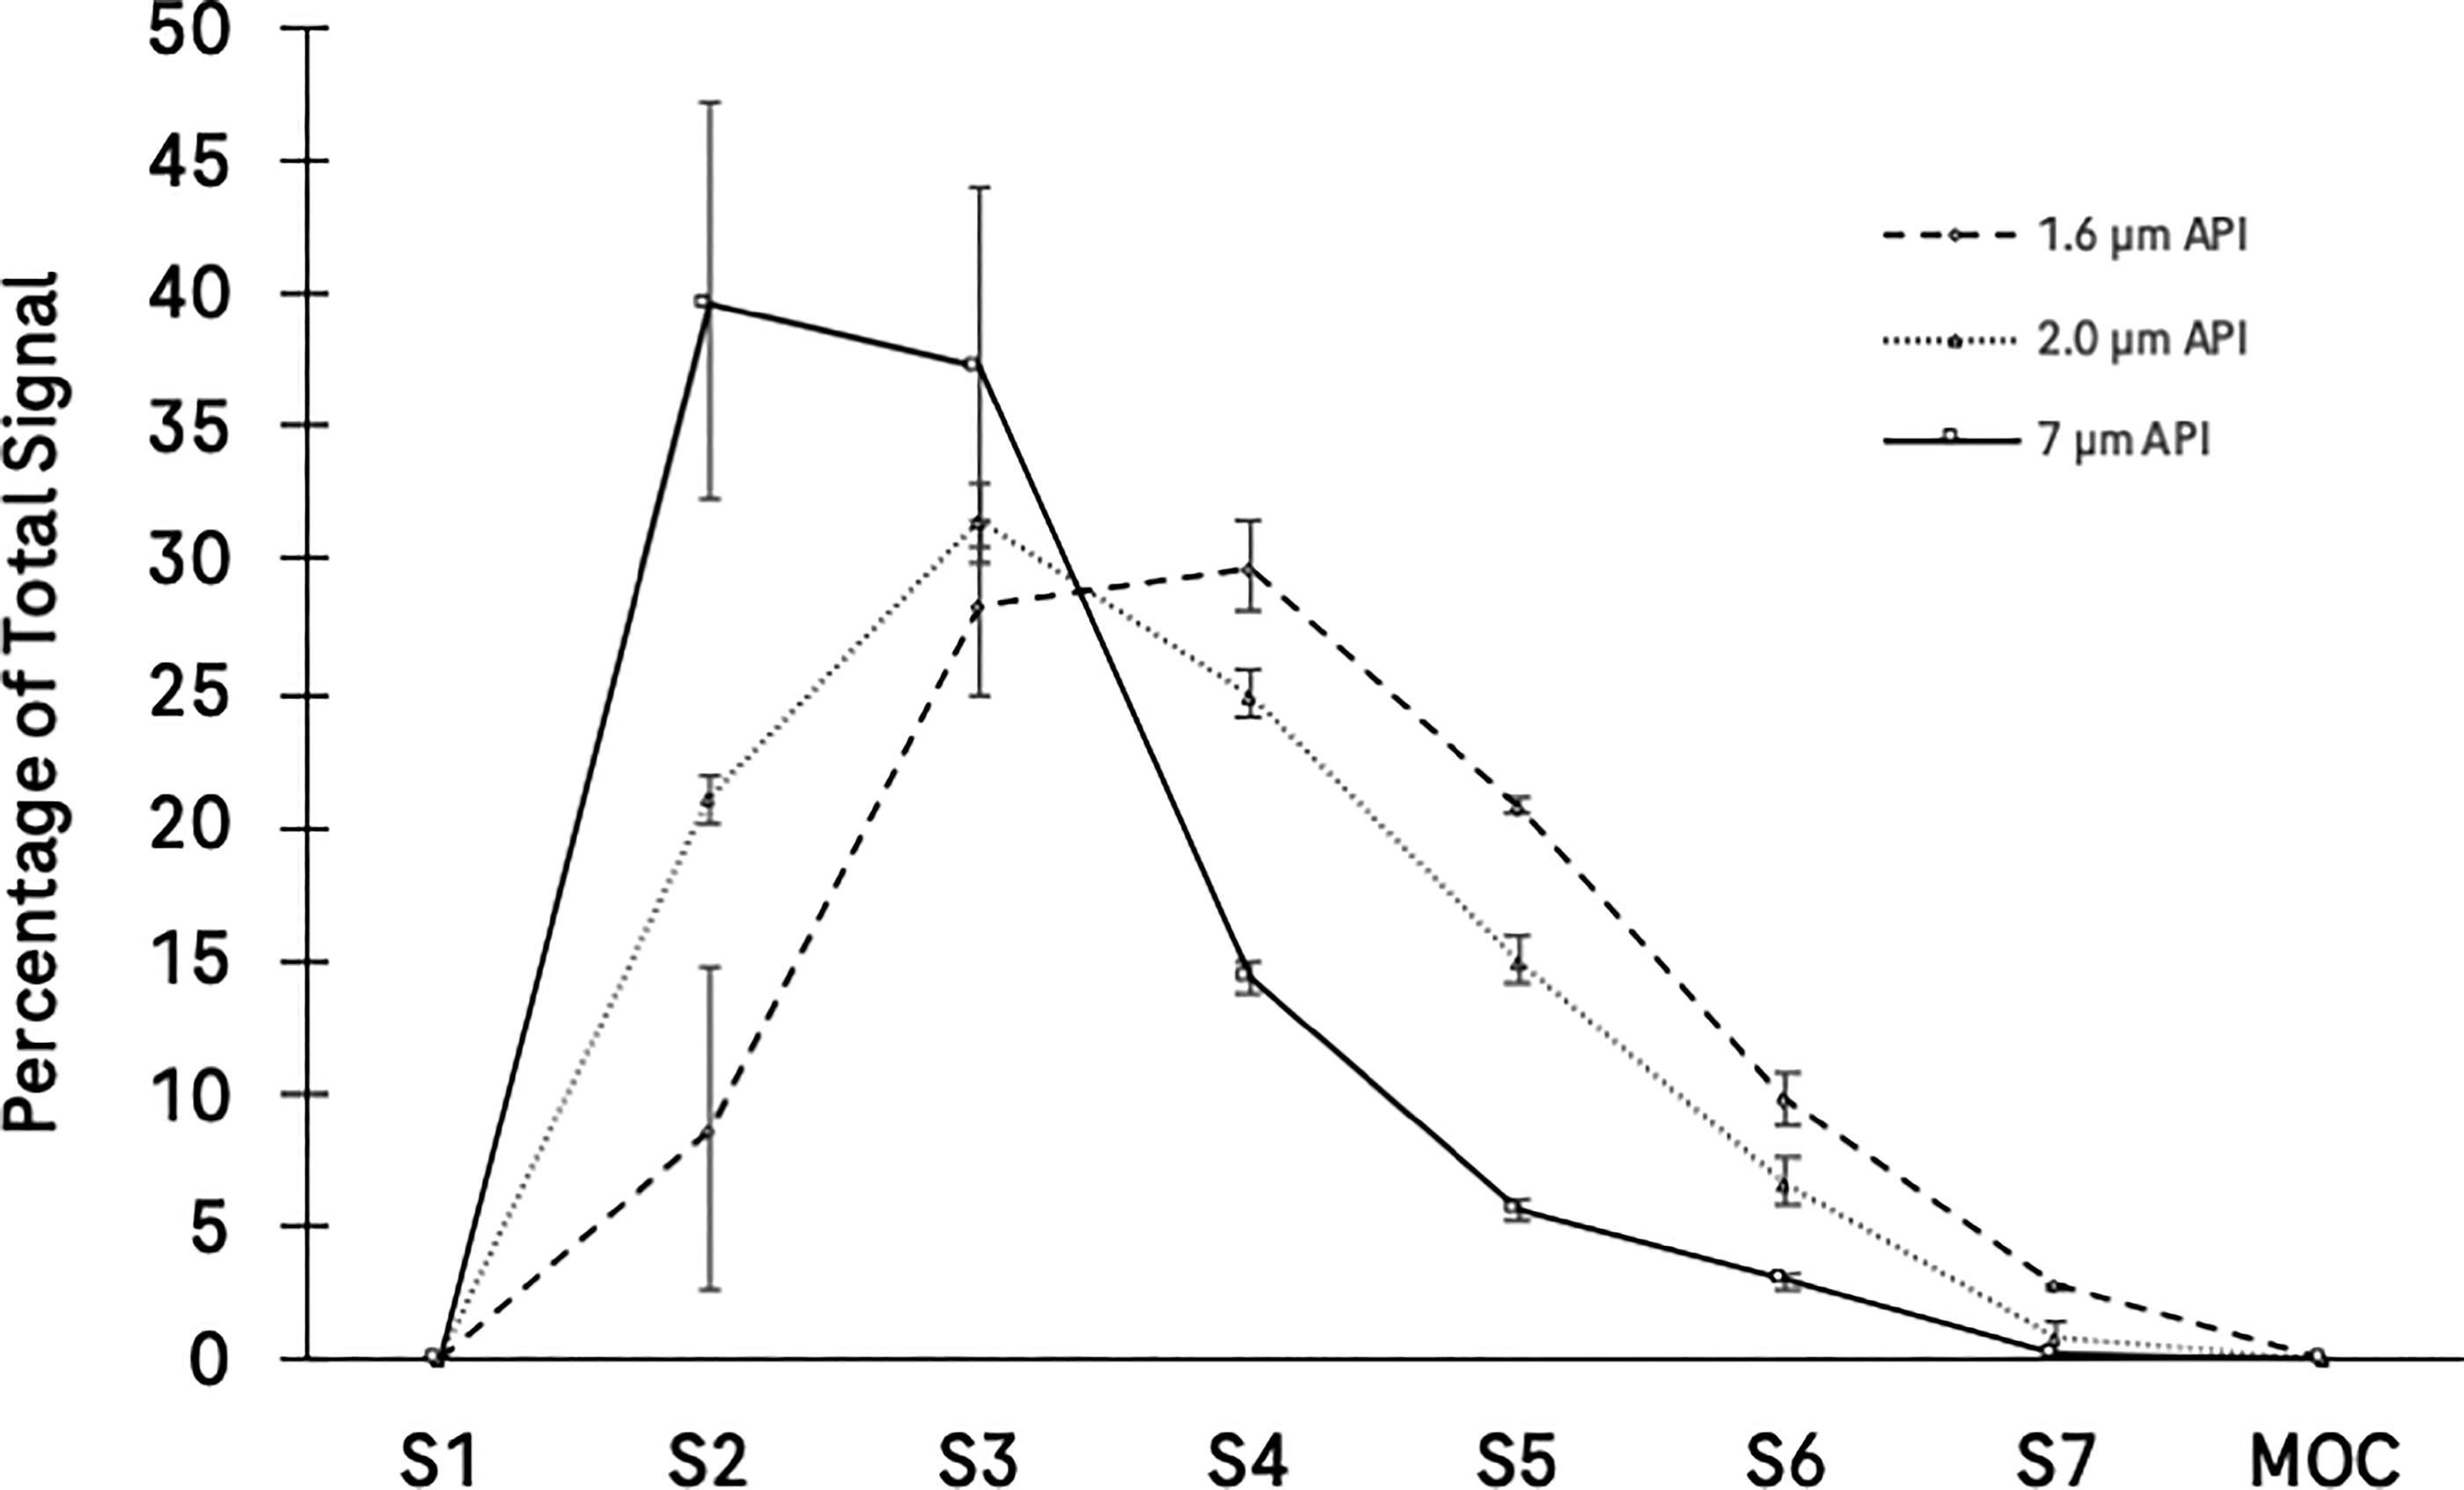
Image analysis distributions derived from analysis of capsules containing API of three different sizes.
Image-Derived APSD Metrics for APIs of Different Physical Sizes
Blend analysis
While the image analysis method can differentiate between different sizes of neat API, the utility of the method could be limited, as most DPI products use a carrier such as lactose blended with the API. To assess the capability of the method to analyze carrier-based DPIs, blends composed of 5% API possessing a D50 of 1.9 μm and ML001 lactose (20 mg blend per capsule) were subjected to the image analysis workflow. Figure 4A shows the distribution obtained after image analysis. Due to the visual nature of analysis, lactose in the blend could influence the image analysis results, potentially biasing the results. To investigate the effect of lactose on the workflow, a capsule was filled with 19 mg of lactose and analyzed. As shown in Figure 4A, there is a significant amount of lactose that is present in stages 2–4 that overlaps with the blend distribution. The presence of lactose in these stages could influence the blend analysis and bias the distribution towards the earlier stages. To deconvolute the API signal from the lactose, distributions were generated for a set of three lactose-only capsules, and the intensity values for each stage were averaged and subtracted from the corresponding blend stages. The results in Figure 4B show good agreement between the lactose-subtracted image analysis distribution and the LC-derived distributions.
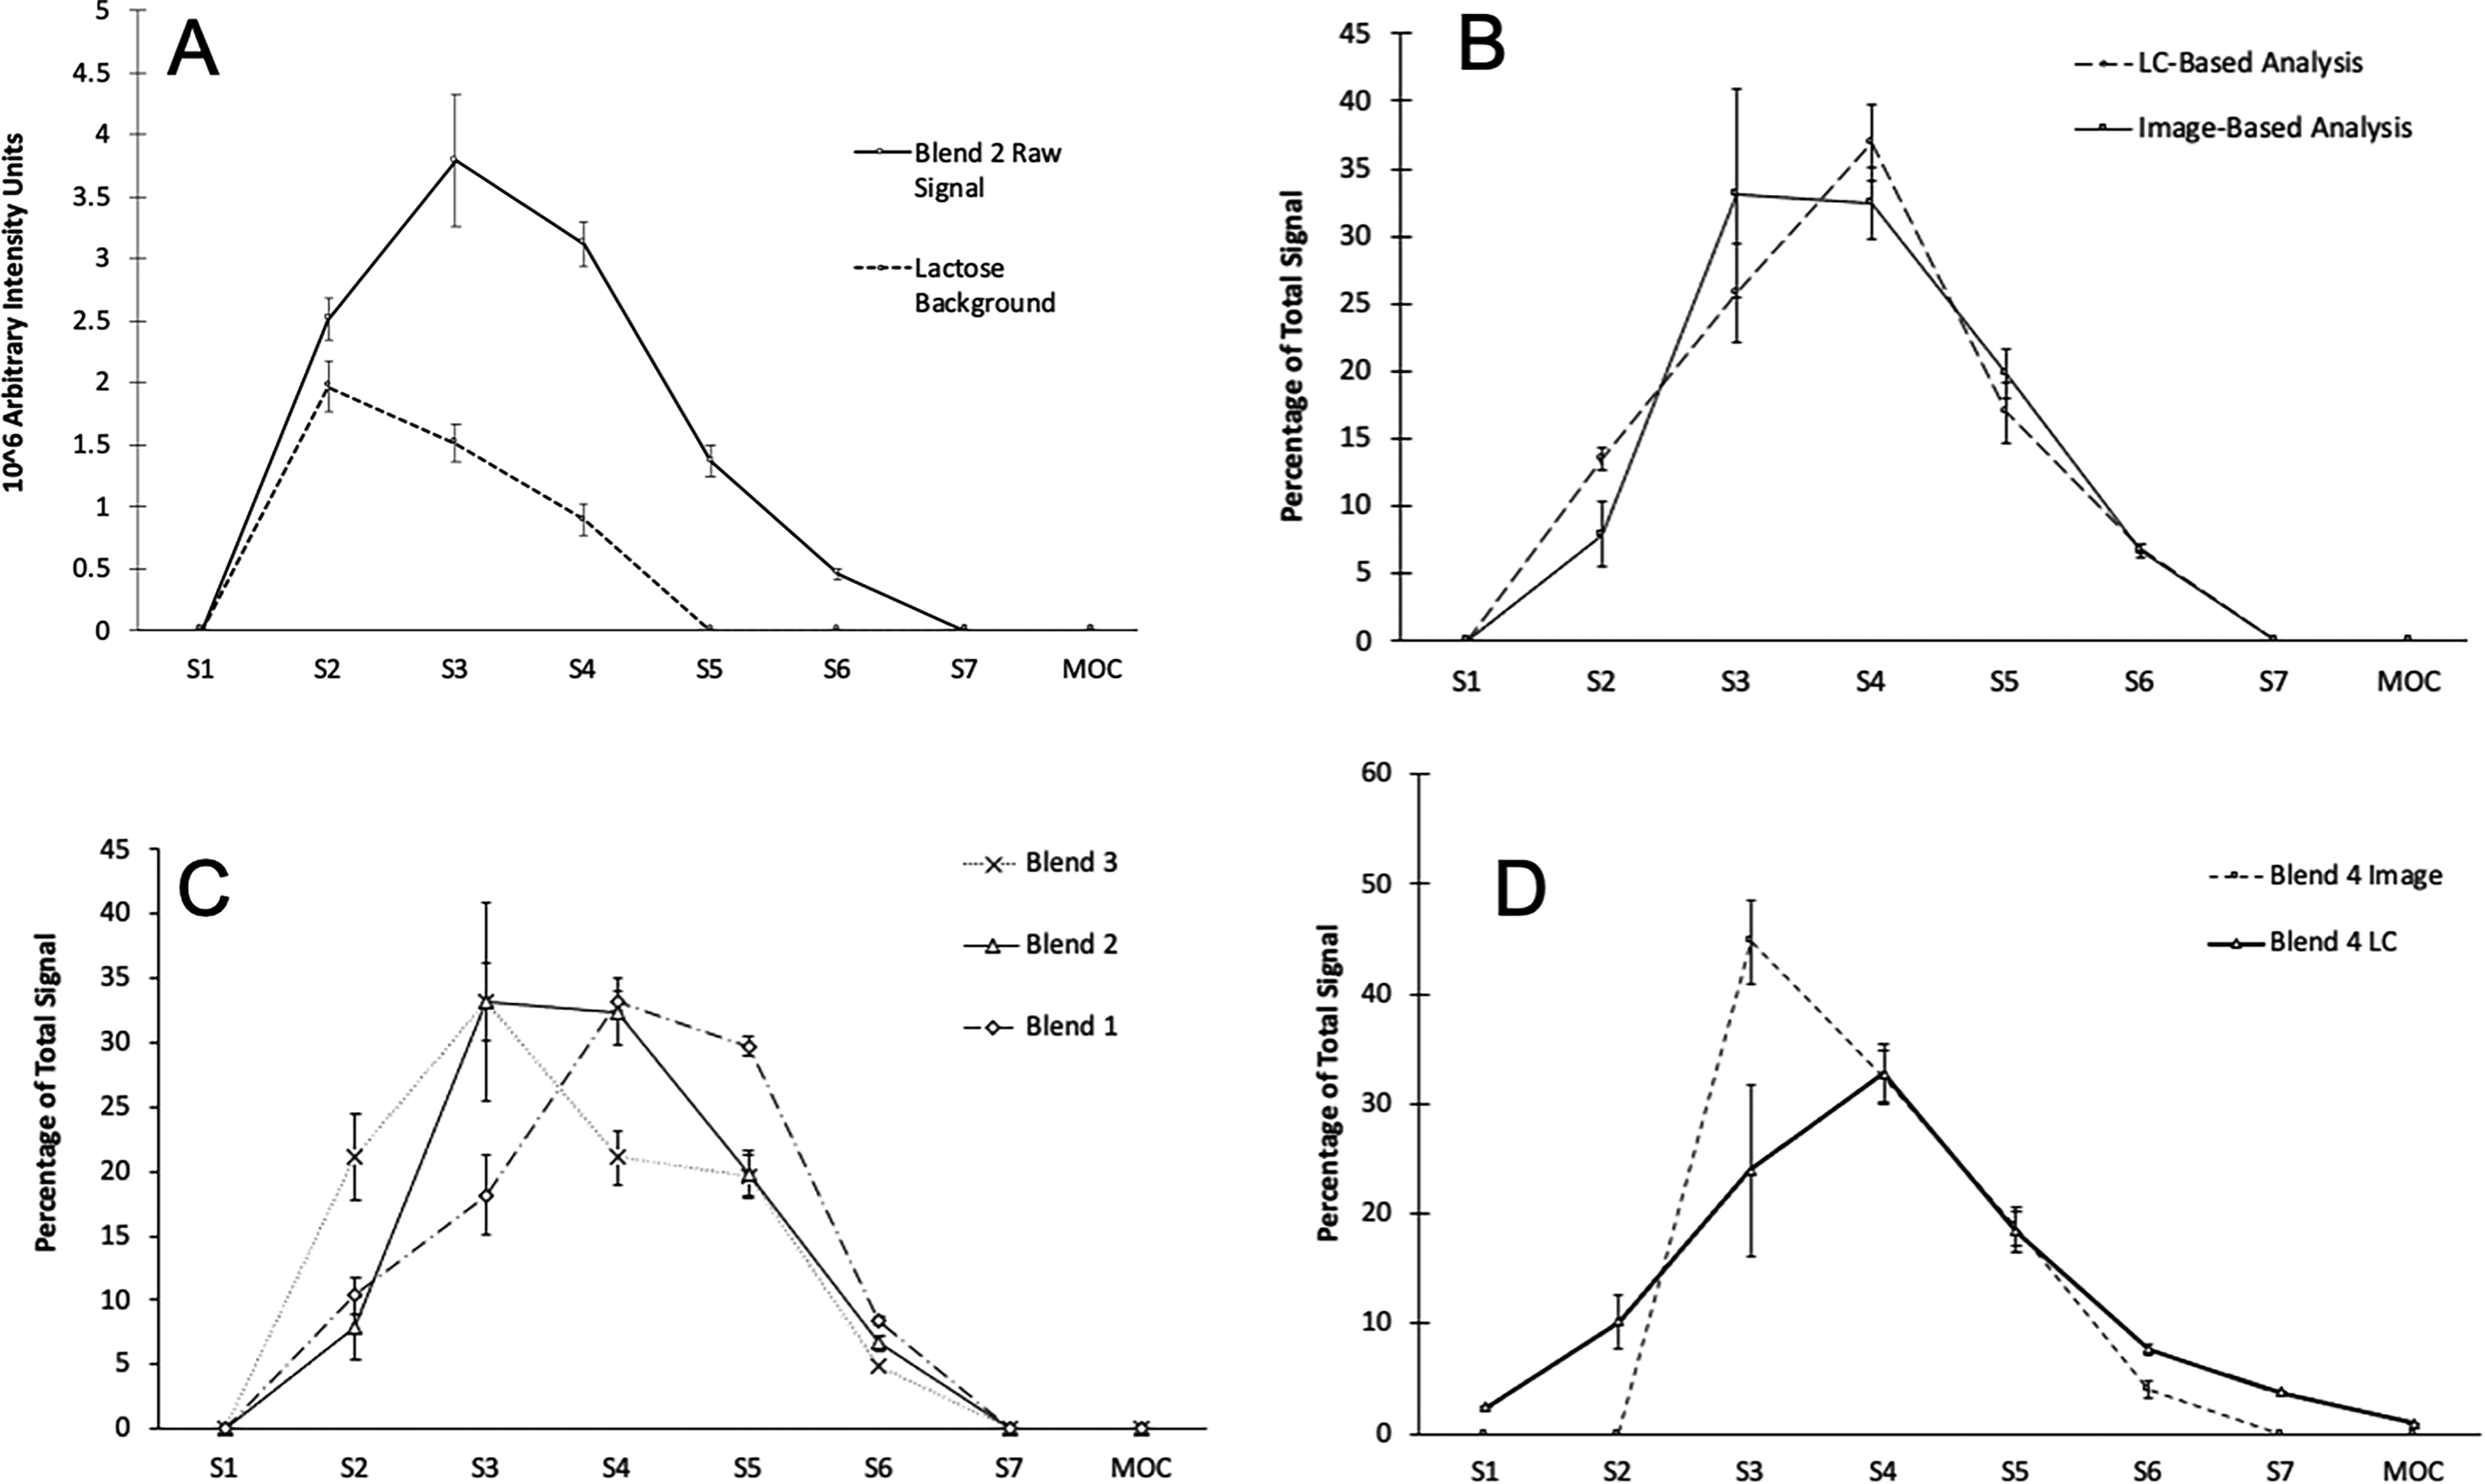
A suitable NGI method should be capable of differentiating between blends containing API of different physical sizes. To test this, two additional blends composed of 5% API and 95% ML001 lactose with API possessing a D50 of 1.6 and 2.4 μm (blends 1 and 3, respectively) were tested. The resulting image analysis distributions are shown in Figure 4C. Lactose background subtraction was performed for all blends tested. Three distinct sets of distributions can be observed, demonstrating the method’s ability to differentiate between blends. In addition, MMAD/%FPF/GSD were determined and compared to LC-derived values (Table 4). A one-way ANOVA with post hoc Tukey test was performed on the MMAD and FPF results from Blends 1–3 (S2). Results show that the MMAD is significantly different between all blends tested, while the FPF results show that blends 1 and 2 possess similar values. The image-based and LC methods have good agreement for all samples tested, further demonstrating the usefulness of the image-based workflow.
Comparison of LC and Image-Derived APSD Metrics for Different Blends

The effect of using a different lactose grade on the method was also investigated. Capsules containing 20 mg of 5% D50 1.9 μm API and 95% SV003 lactose were actuated and subjected to the image analysis workflow. Blank capsules containing 19 mg of SV003 lactose (Blend 4) were also analyzed to determine whether background subtraction would be necessary. Interestingly, the capsules containing only lactose showed no visual deposition on the black filters. The lack of lactose deposition is likely because the D10 (31 um) of the lactose is above the cutoff of the preseparator. As a result, API-containing capsules could be analyzed directly, without the need to subtract a lactose signal. Figure 4D shows an overlay of LC and image-analysis results. In this case, the distributions and certain APSD metrics (MMAD and FPF) are different (Table 4). This is most likely due to the lower amount of impactor mass in this blend (0.18 mg) compared with the other blends analyzed (0.33–0.41 mg) which prevents stages containing lower mass deposited from being detected accurately. While this is a limitation of the method, more sensitive imaging and analysis software could circumvent this in the future. In addition, it would be of interest to test the general applicability of the deconvolution method for different grades of lactose in the future.
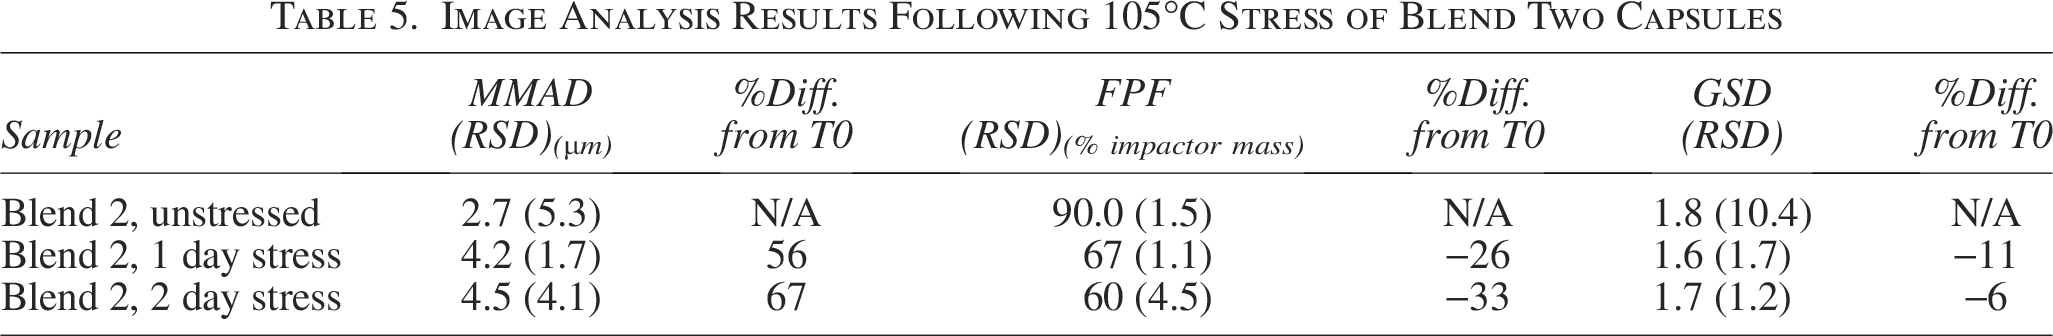
Changes to the APSD on stability are undesirable for product quality and should be captured by a suitable NGI method. To determine if the image-analysis method could capture changes to the APSD, capsules containing Blend 1 and ML001 lactose were stressed at 105°C (above the Tg of the API to drive particle fusion) for 24 and 48 hours and subjected to the image-based workflow. Capsules containing ML001 lactose were used to generate a background to subtract from the blends, as heating could also affect the aerodynamics of the lactose. Figure 5 shows a clear shift toward the earlier stages of the NGI over the course of the experiment, indicating a change in the APSD as the capsules are exposed to heat. APSD metrics shown in Table 5 also demonstrate a change upon stress compared with the unstressed samples (T = 0). These results demonstrate the potential of the method to determine APSD changes on stability.
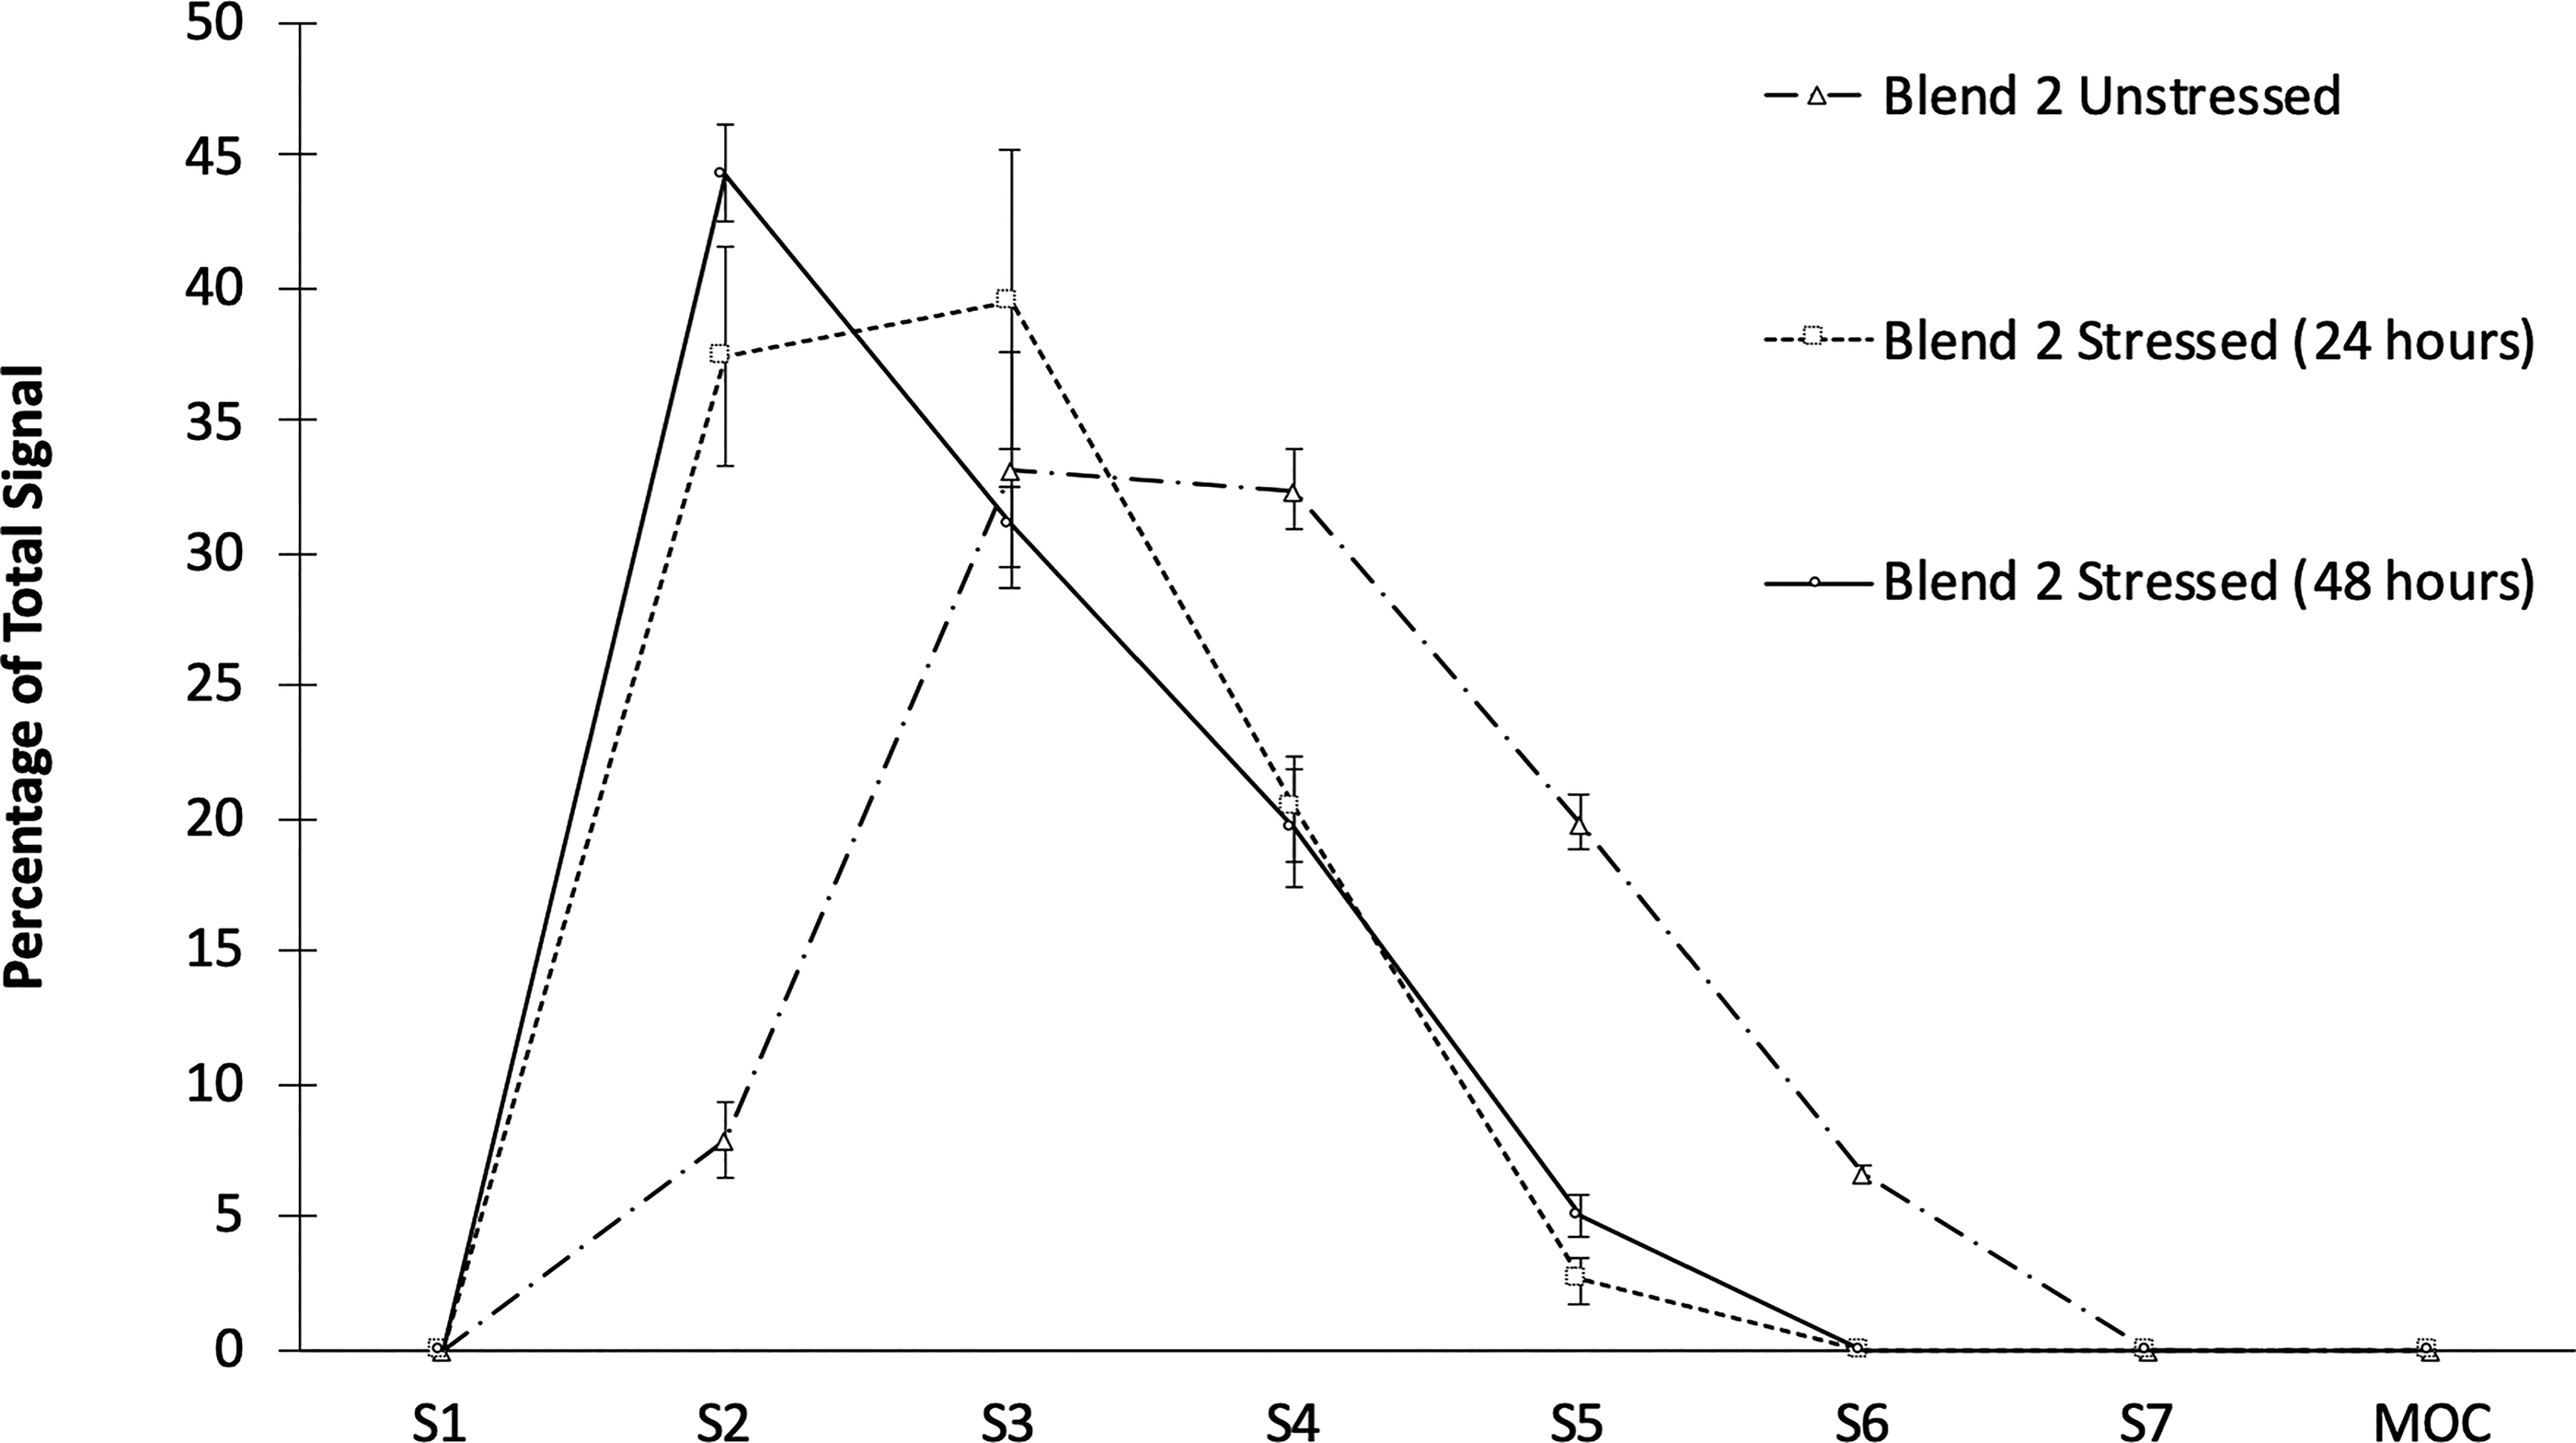
Distributions obtained using image analysis of capsules subjected to 105°C stress for 0, 24, and 48 hours.
Image Analysis Results Following 105°C Stress of Blend Two Capsules
Conclusions
In this work, digital image analysis is shown as an efficient method for collecting and processing NGI data. The developed workflow was used to identify and differentiate between neat API of different physical sizes and within lactose blends. APSD metrics such as MMAD, FPF, and GSD were obtained from the method. One significant drawback to the method is the lack of mass information, which prevents the determination of fine particle dose. However, when compared with traditional LC-based quantitation, image analysis yielded significantly shorter analysis times. In addition, the developed approach could be improved by using a more specific and sensitive imaging technique to obviate the need for lactose subtraction by measuring the API only. While this method was developed and applied for NGI testing, many laboratories use the Andersen impactor for APSD determination. We believe the developed method, with some modifications, could also be applied to Andersen impactors. Image-based APSD determination has a potential to shorten development timelines by providing accurate and rapid analysis of DPI formulations.
Authors’ Contributions
The article was written through contributions of all authors. All authors have given approval to the final version of the article.
Footnotes
Author Disclosure Statement
The authors do not have any conflicts of interest.
Funding Information
This research did not receive grant funding from any sector.
Supplemental Material
References
Supplementary Material
Please find the following supplemental material available below.
For Open Access articles published under a Creative Commons License, all supplemental material carries the same license as the article it is associated with.
For non-Open Access articles published, all supplemental material carries a non-exclusive license, and permission requests for re-use of supplemental material or any part of supplemental material shall be sent directly to the copyright owner as specified in the copyright notice associated with the article.