
Abstract
Background:
International compendia specify setting the flow for testing dry powder inhalers (DPIs) with the pressure ratio across the flow control valve ≤0.5. This guidance derives from thermodynamic theory, but there is no requirement that the flow control equipment demonstrates adherence to this theory. There is therefore a need to define and test for acceptable flow control valve performance, enabling DPI manufacturers to determine whether their test equipment is achieving the expected flow control. Herein, we present flow control data for two valves common in the inhaler testing community and describe the need for qualification specifications for flow control equipment with such valves.
Methods:
We devised a simple laboratory apparatus and method for determining the mass flow rate through two common flow control valves in their commercial configuration. In the test method, the pressure ratio across the valve is lowered from ∼0.7 to 0.3. This range of pressure ratio covers the standard test requirement that the pressure ratio must be 0.5 or less and maps the transition of compressible flow through the valve to the point where the air flow theoretically remains constant.
Results:
A common industrial valve, mentioned specifically in Pharm. Eur. 2.9.18 and in earlier editions of United States Pharmacopeia 601, exhibits nearly constant flow when the pressure ratio is <0.5. Another valve in widespread use exhibits a continued slight increase in mass flow rate even as the pressure ratio is decreased below 0.5.
Conclusions:
Inhaler testing laboratories should test whether their equipment exhibits the constant flow condition that is often assumed when the pressure ratio across the flow control valve is 0.5 or smaller. Quantitative specifications, yet to be developed, for qualifying commercial flow control equipment must account for both the transient start-up and the steady-state flow in DPI testing.
Introduction
The testing of dry-powder inhalers (DPIs) presents unique challenges since particles leave such devices only when the air starts to move through the device, entraining and dispersing the particles into a total dose tube, a cascade impactor, or other particle sizing instrument. For testing particle size with cascade impactors, the intertwining of the air flow start-up and the particle dispersion1–4 confounds the interpretation of the impactor data because the timing of the dose release is likely unknown and because the impactor performance is calibrated for steady-state air flow.5,6
In an attempt to balance the desire to test DPIs under realistic user conditions and the constraints of the cascade impactor and other equipment attributes, pharmacopeial compendia require that the flow rate be controlled by setting the flow control valve, with an appropriate vacuum pump, so that the ratio of the pressure downstream to the pressure upstream of the flow control valve is 0.5 or less when the flow reaches its steady-state value. This specified pressure ratio derives from the theory of adiabatic heat transfer in the expansion of an ideal gas. According to this theory, the flow rate reaches and maintains sonic velocity at the valve when the pressure ratio becomes smaller than a certain value based on its heat capacity properties. For air at typical laboratory conditions, this maximum and fixed velocity occurs when the pressure ratio is ≤0.528; this value has been expressed conservatively and approximately as 0.5 in the United States Pharmacopeia (USP) 7 and similar protocols worldwide.
It is rare to find tests of flow control valves that examine whether the flow rate of air does indeed reach a constant value when the pressure ratio is 0.5 or less. Roberts 8 recently explained a test apparatus for this purpose and included test data for the Parker valve model 8FV12LN. This valve is important because it is identified in the USP, 7 the European Pharmacopoeia (Pharm. Eur.), 9 and other pharmacopeial compendia as an example flow control valve for testing dry powder inhalers. Strangely, the USP and related compendia associate with this Parker valve a test protocol with the valve fully open when tested, 10 a condition that is wholly inappropriate for inhaler testing methods.
Currently, then, the inhaler testing community broadly accepts, without question and without experimental data, that thermodynamic theory prevails in the flow control equipment in routine practice for testing DPIs. This situation is uncharacteristic of the common quantitative diligence of inhaler testing scientists and ignores the regulatory mandate that test equipment must have qualification criteria (e.g., paragraph IV.F.5, page 25 of reference 11 ). Because of the lack of attention to this subject in the public literature, there are also no established specifications for what qualifies as an acceptable flow control valve nor, more importantly, acceptable flow control equipment with such valves.
In the following article, therefore, we explain a test protocol and test data for two valves of the type that are common in the testing of dry-powder inhalers. We test these valves on a fixed test bed wherein the valves “stand alone.” We also test them in the configuration in which these valves are part of commercial flow control equipment for testing dry-powder inhalers. These results show that thermodynamic theory is sufficient to describe the flow through one valve, both stand-alone and in a commercial flow control device, but is not sufficient to describe the flow through the other valve, whether tested alone or in a commercial flow control device. Quantitative specifications, therefore, are needed for flow control equipment based on these or comparable valves. Sufficient specifications are not immediately obvious but must include the flow transient as well as the flow at steady state.
Theoretical Considerations
The theory of adiabatic expansion of a gas through a nozzle12,13 results in a simple expression for the mass flow rate (
Here,
Equation 2 leads to the common remark inside the community of inhaler testers to the effect that the flow rate through the control valve in the testing of DPIs depends on the first power of the pressure upstream of the valve (
In addition, the theory states that the Mach number reaches its maximum value of 1.0 when the ratio of the downstream pressure to the upstream pressure reaches a value that depends on the heat capacity ratio
Equation 3 leads to the common understanding inside the community of inhaler testers that the flow rate reaches its maximum value when the pressure upstream is at least twice the downstream pressure (
The major question that we address in this article is simply whether the flow, controlled with practical commercial equipment, behaves as anticipated from equations 2 and 3. There is a lack of data and of test methods for answering this question. And consequently, there is no basis for defining an acceptable performance of the flow control valve as installed in practical equipment. We aim to remedy these matters in the following study.
Materials and Methods
The test equipment has two configurations with some identical components in each configuration. The two configurations enable the testing of (1) stand-alone flow control valves and (2) the same valves in a configuration the same as inside a commercial flow controller.
Roberts 8 has described the test equipment configuration for the testing of a stand-alone flow control valve, specifically showing the Parker valve 8FV12LNSS as the valve-under-test (Parker Hannifin Corporation, Jacksonville, AL, USA). In the current study, the additional valves tested in the stand-alone configuration were a Camozzi model 2830 and its panel-mount equivalent, model 2839 (Camozzi Automation, McKinney, TX, USA). The Camozzi valves each had 1/2” British Standard Pipe Parallel threads (BSPP female) at the inlet and outlet of the valve. Special fittings were necessary to connect these valves to the stand-alone valve test bed (fitting size 1/2” BSPP to 12AN, part number SET-BSP12AN12-00; Pegasus Auto Racing Supplies, New Berlin, WI).
The commercial flow controller configurations that were tested were the Model TrB III (AB FIA, Lund, Sweden) and the Model TPK 2000 (Copley Scientific, Nottingham, UK). These controllers were made with the Parker valve 8FV12LN and the Camozzi valve 2839, respectively, as their flow control valves. The equipment tested herein purposely does not represent the most current commercial offerings of these manufacturers but rather enables a demonstration of the methods and data analysis principles that apply to these and all similar valves and commercial equipment.
When testing the 8FV12LN valve in the configuration of the TrB III flow controller (Fig. 1), the pressure measurements upstream and downstream of the flow control valve were made with separate absolute pressure transducers that are standard with the TrB III product (Honeywell TruStability® Board Mount Pressure Sensors, Series HSC; 160 kPa full-scale). Item 4 in Figure 1 shows the interior of the TrB III with the sampling locations for these pressure transducers, indicated as P-up and P-down. These sampling locations are approximately one inside pipe diameter upstream and downstream of the control valve.
Apparatus for Testing Parker Valve 8FV12LN as Incorporated into the TrB III Configuration (air flow left to right).
When testing the Camozzi Valve 2839 in the “TPK” configuration, we used the same pressure gauges as in the stand-alone test bed 8 (upstream, Mensor CPT6020; downstream Dwyer Part Number 2000-75KPA-AHU2). These gauges were connected to the upstream and downstream sample ports located on the elbows leading to and from the Camozzi 2839 valve (the standard design inside the TPK Model 2000; Fig. 2). Item 4 in Figure 2 is an expanded view of the inside of the TPK 2000 showing these pressure sampling locations and how the air flow approaches and departs the Camozzi Valve 2839. The valve handle is available to the user on the left-side panel of the TPK 2000.
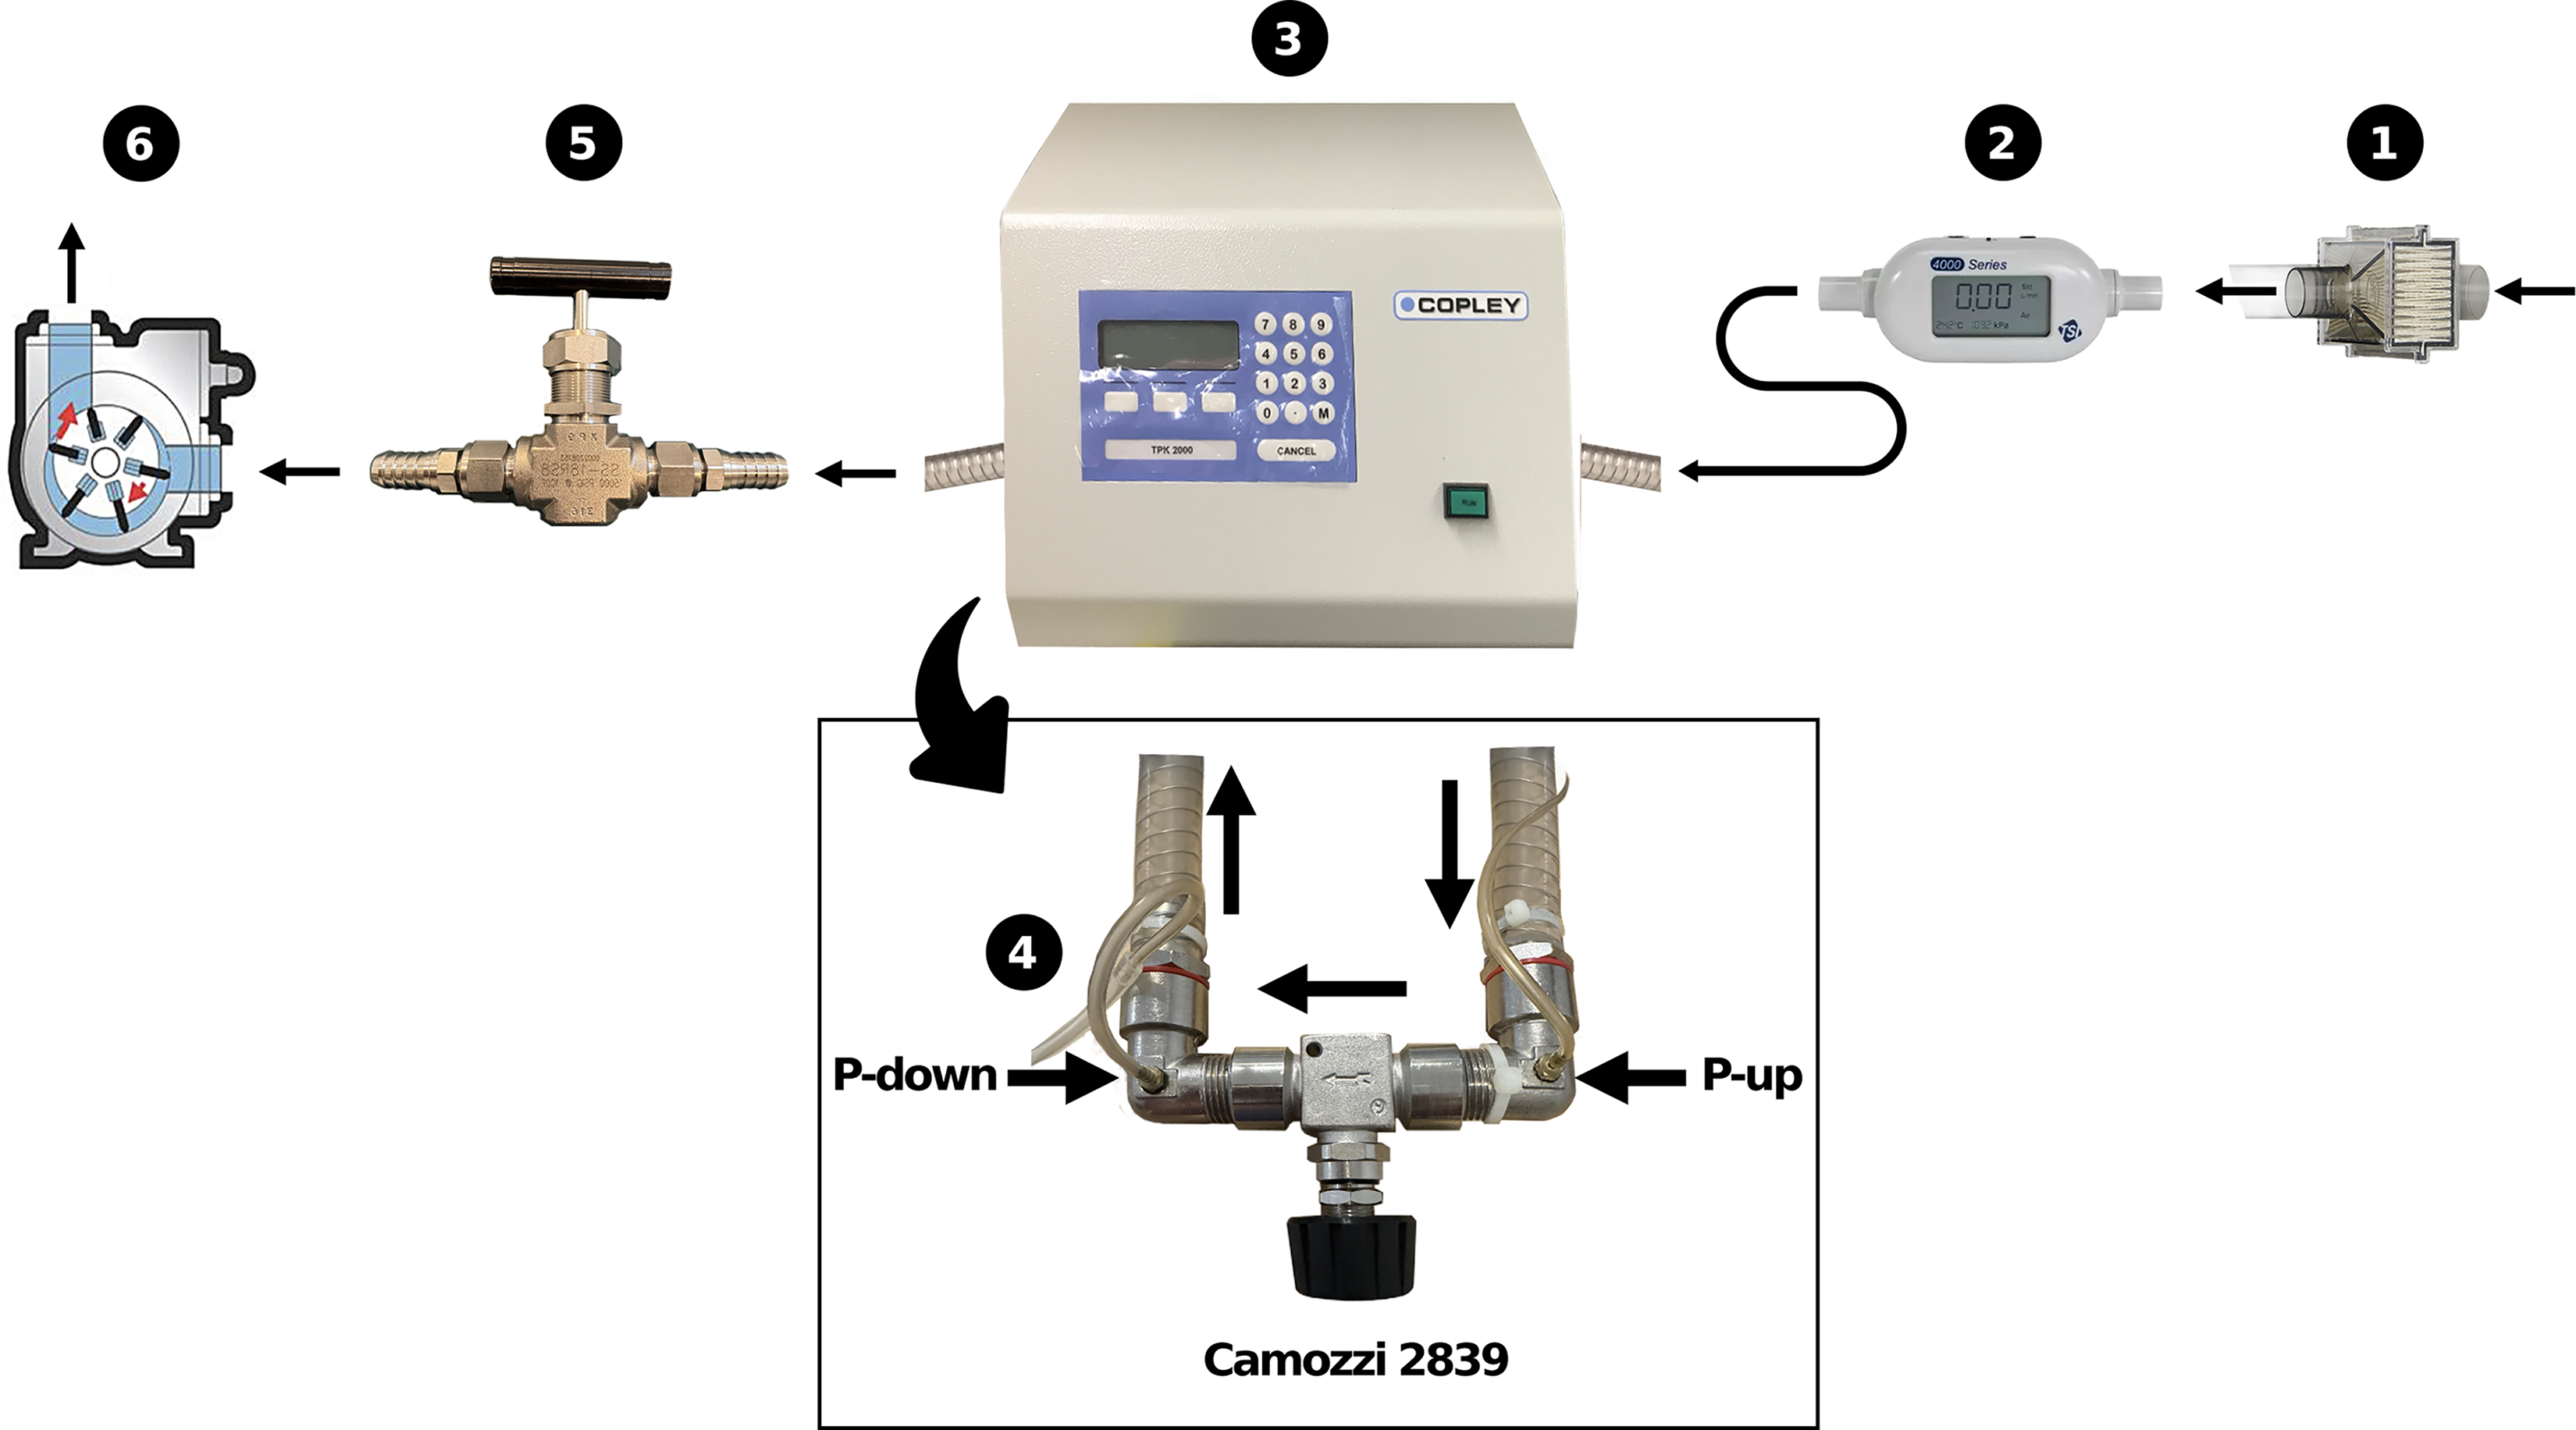
Apparatus for Testing Camozzi Valve 2839 as Incorporated into the TPK 2000 Configuration (air flow right to left).
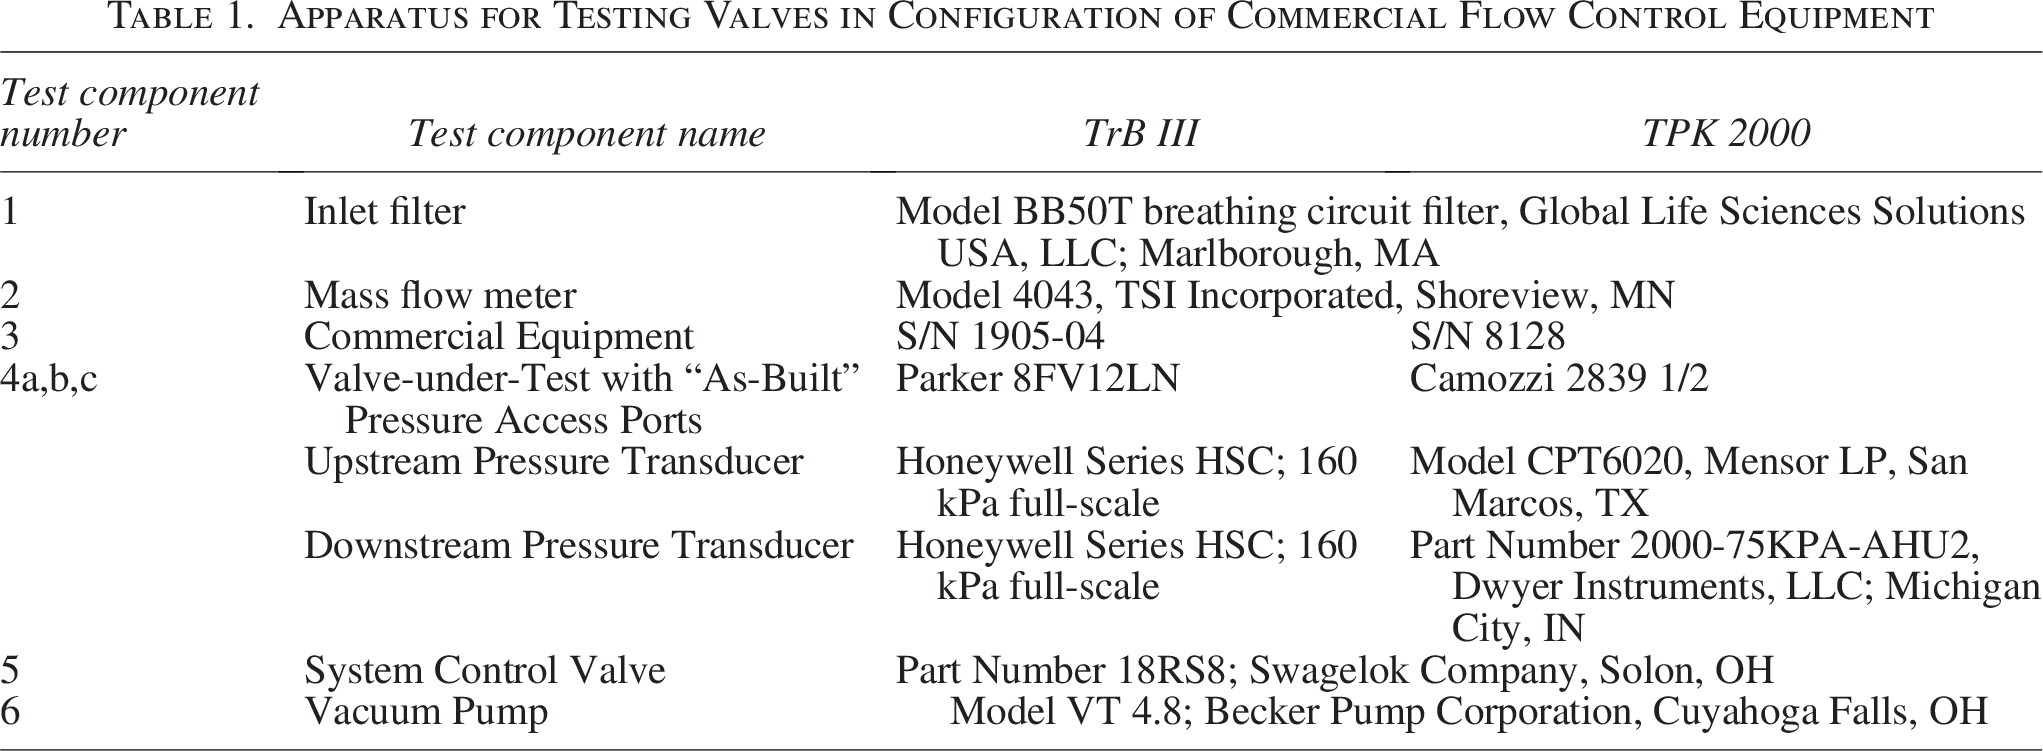
Whether testing the TrB III configuration or the TPK 2000 configuration (Figs. 1 or 2), we used the same inlet HEPA filter, in-line mass flow meter, system control valve, and vacuum pump (the same components as in the stand-alone valve test apparatus) 8 (Table 1).
Apparatus for Testing Valves in Configuration of Commercial Flow Control Equipment
The test protocol for the stand-alone test bed and for the commercial equipment configurations calls for the valve-under-test to be open a fixed amount, the vacuum pump to be turned on, and the flow rate adjusted with the system control valve so that the downstream pressure is only about 30% of the ambient pressure. Achieving these conditions requires some trial and error when testing a valve with unknown behavior. Once the desired range of operation is set, the valve under test must remain unchanged. Now, the first data point with the downstream pressure at about 30% of the upstream pressure is taken by recording the mass flow rate of air entering the system along with the pressure upstream and downstream of the valve under test. Next, the system control valve is closed slightly until the pressure downstream of the valve under test increases to 35% of the upstream pressure and then to 40%, and continuing in increments of 5% until the downstream pressure is ∼70% of the upstream pressure. At each value of the downstream pressure, we record the mass flow rate of air entering the system and the pressure upstream and downstream of the valve under test. In this way, the pressure ratio across the valve under test increases from about 0.3 to about 0.7 and, importantly, thoroughly covers values near the ratio 0.5, where theoretically the flow changes from choked to unchoked (see Roberts 8 for discussion of the terms “sonic,” “critical,” and “choked”). Typical air mass flow rates for these tests were ∼45 to 60 standard L/min (standard conditions T = 21.1 degrees C, P = 101.3 kPa).
Results and Discussions
We focus on the comparison of the stand-alone Parker 8FV12LN and Camozzi 2839 valves first in the fixed test bed and then in the configurations of the commercial flow control equipment. Additional data and comparisons are in the Supplementary Data associated with this publication.
Both in the fixed test bed (Fig. 3) and in the commercial equipment configuration (Fig. 4), the Parker valve 8FV12LN data follow the shape anticipated from equations 2 and 3. The mass flow rate is nearly constant when the Pd/Pu pressure ratio remains smaller than ∼0.5. As the pressure ratio is increased to 0.7, the mass flow rate continually decreases as expected.
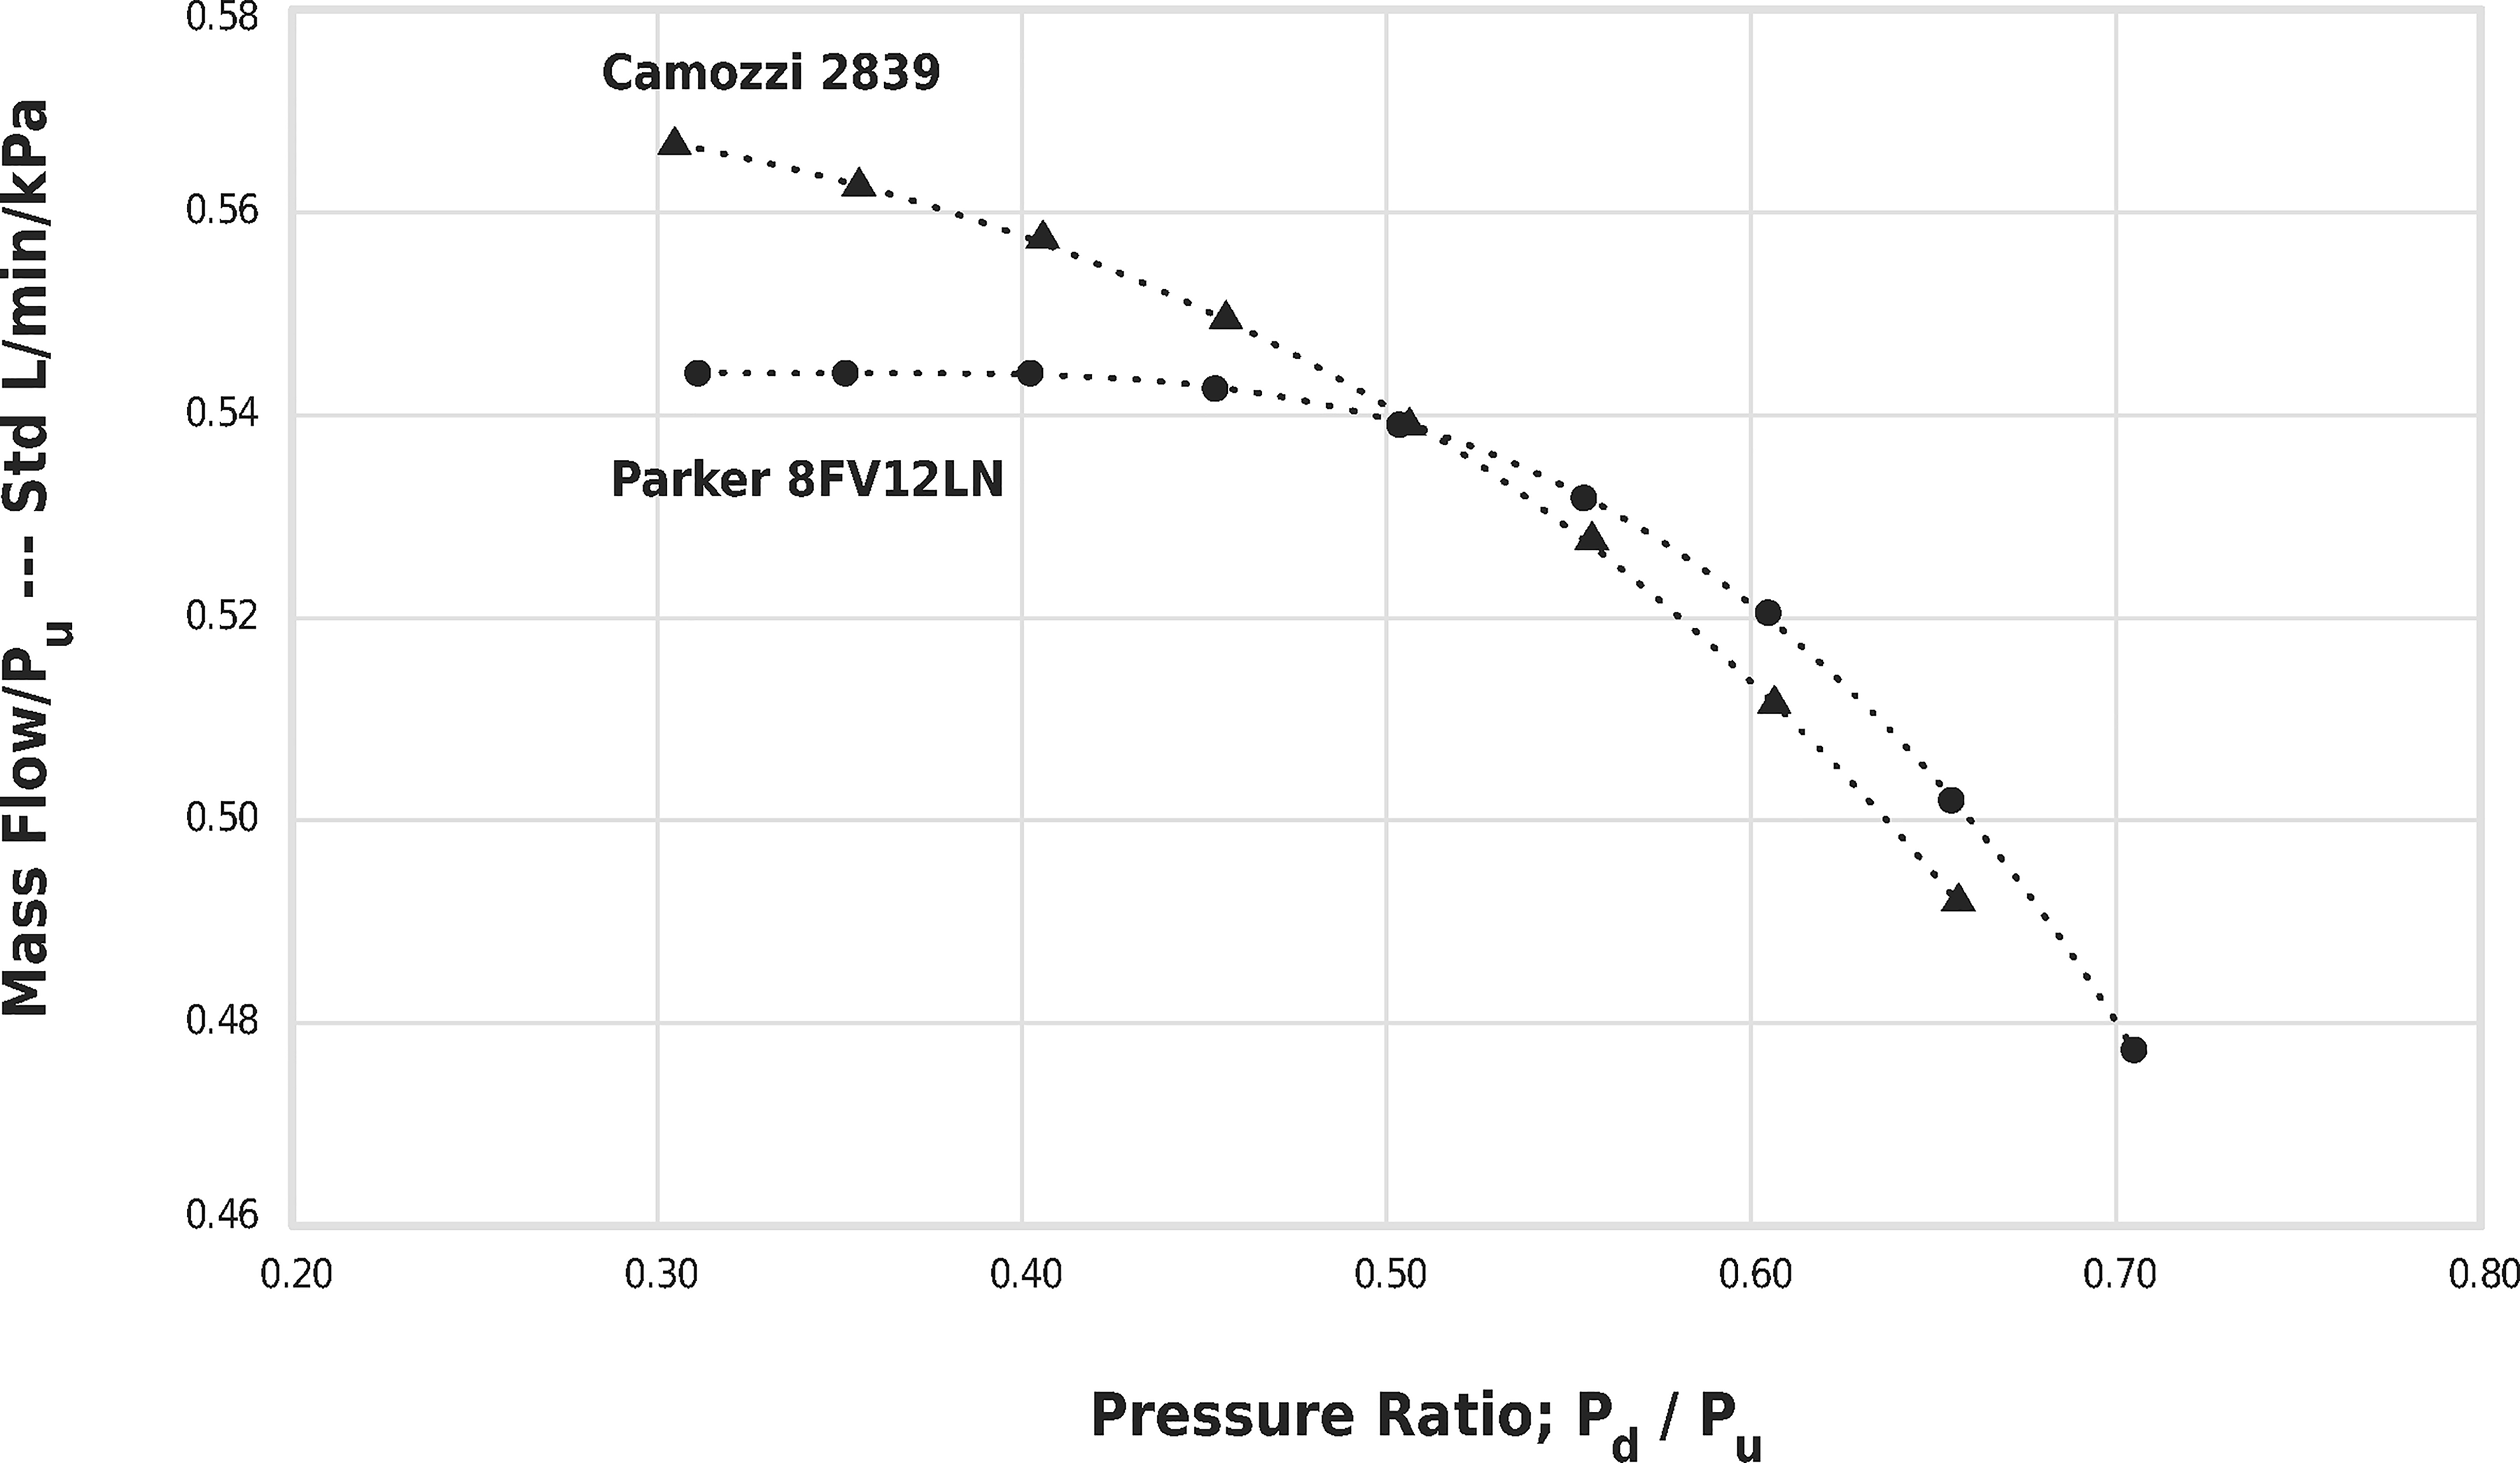
Camozzi 2839 and Parker 8FV12LN Valves in Fixed Test Bed.
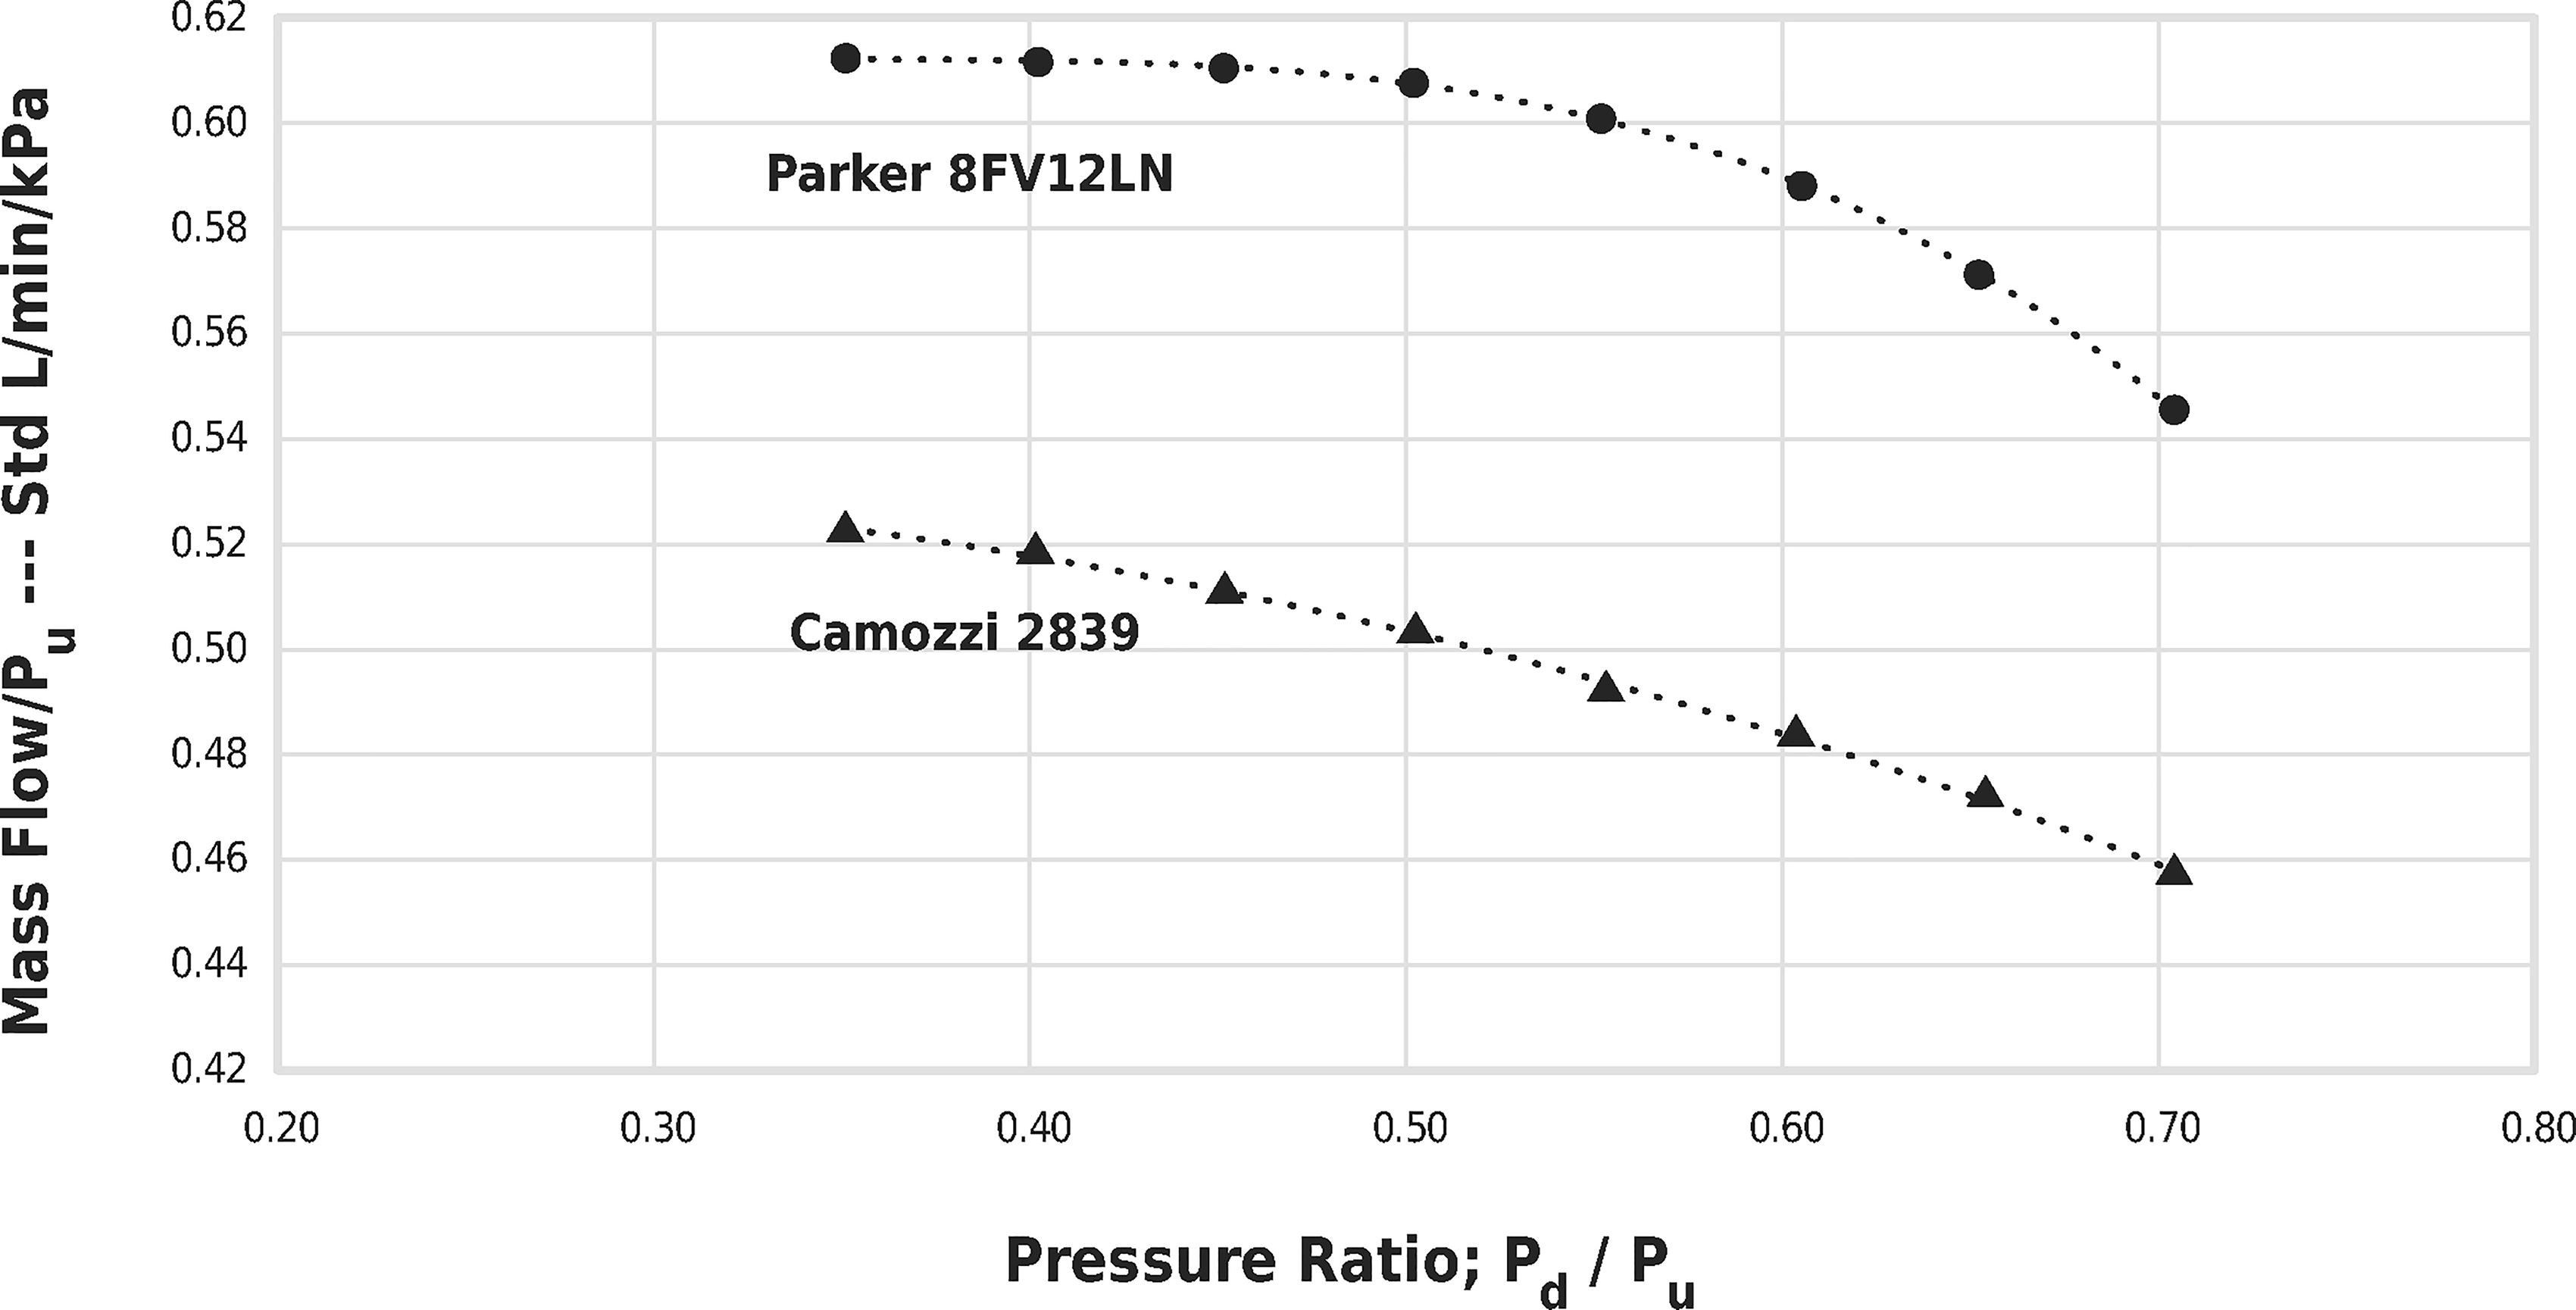
Camozzi 2839 and Parker 8FV12LN Valves in Commercial Equipment Configuration.
The Camozzi valve, however, exhibits a steady decrease in the mass flow rate as the pressure ratio increases, regardless of whether the pressure ratio is above or below the pharmacopeial target value of 0.5 that is based on thermodynamic theory. There is no indication of the behavior expected from equations 2 and 3. The lack of correspondence to thermodynamic theory is apparent when this valve is in the fixed test bed and in the commercial configuration. The unconventional location of the pressure sampling points in the TPK 2000 (elbows in Fig. 2) is a possible source of the deviation from expected behavior, but since the deviation appears in the fixed test bed and in the commercial configuration, the pressure sampling location cannot be the sole reason for the disagreement with thermodynamic theory.
We chose the vertical axis coordinate in Figures 3 and 4 (
Rate of Change in Mass Flow Rate at Tested Pressure Ratios (units of std L/min per kPa)
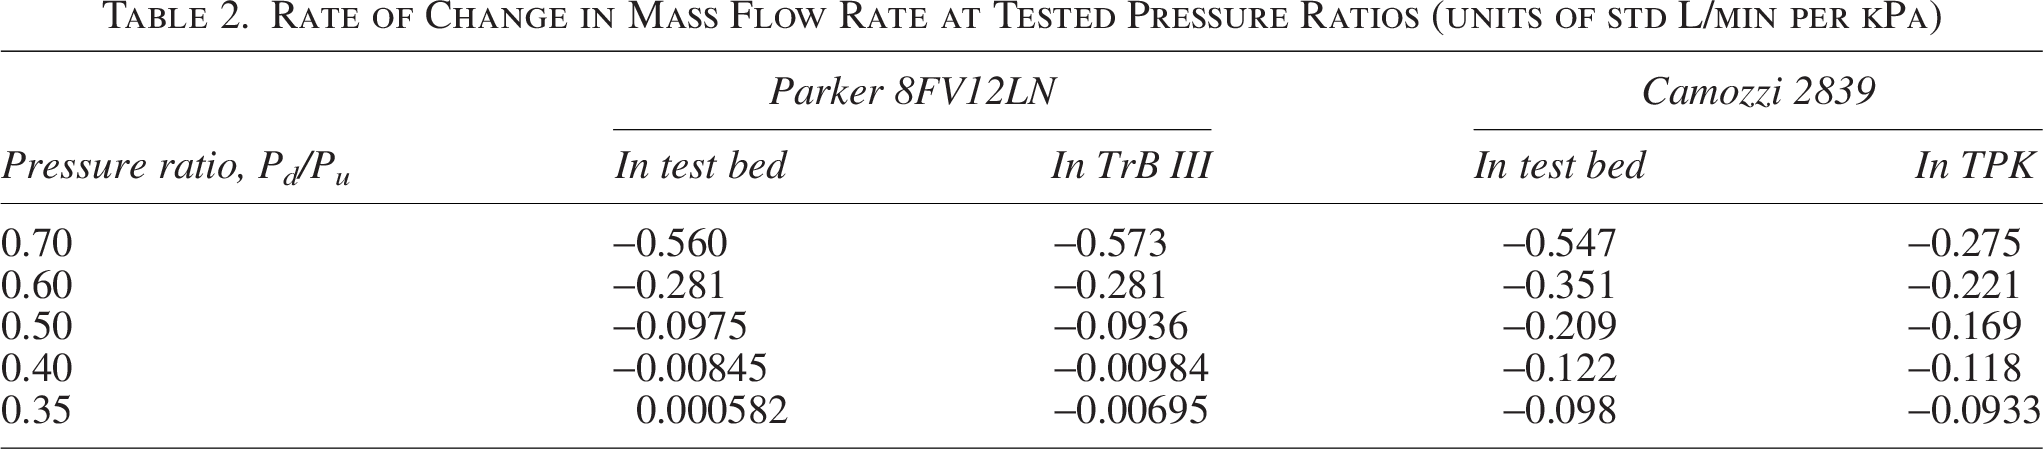
The quantities in Table 2 are key to the question of setting specifications for acceptable performance of a valve incorporated into commercial flow control equipment. A significant question is “How much change in the mass flow rate is acceptable for values of Pd/Pu smaller than 0.5?” Stated more broadly, we must address the question of whether it matters if the Camozzi valve deviates from the behavior anticipated from the thermodynamic theory. And furthermore, we must ask if the Parker valve is acceptable, even if its performance is much closer to ideal. At a typical pressure ratio of 0.4, the Camozzi 2839 exhibits >10 times the rate of change exhibited by the Parker valve. Is this difference important?
Control valve specifications
It may not be obvious why the performance of the flow control valve should be subject to quantitative specifications. After all, one of the first steps for testing a DPI, as stated in the USP 7 and related pharmaceutical handbooks, is setting up the steady-state flow by finding a valve position that yields the desired flow rate and with the pressure ratio smaller than 0.5. So, why should it matter if technicians in the same or different labs use the same or different flow control valves, some that follow thermodynamic theory more closely than others? Isn’t it sufficient that each steady-state flow rate is set correctly?
The importance of the flow start-up kinetics is a major driver for quantitative control valve specifications. In the standard DPI test protocol, the technician sets the valve to achieve the desired steady-state flow rate. In a DPI test, however, the vacuum pump (or other source) is on, and the flow begins when the solenoid valve is opened. At this starting point, the ratio of Pd/Pu is equal nearly to zero. The ratio then increases quickly to its steady-state value following the performance curve of the valves and equipment in question, curves depicted in Figure 5 as Path A and Path B. Paths A and B represent flow control valves and equipment that respectively DO NOT and DO approximately follow thermodynamic theory wherein the flow rate remains nearly constant when the pressure ratio is smaller than 0.5.
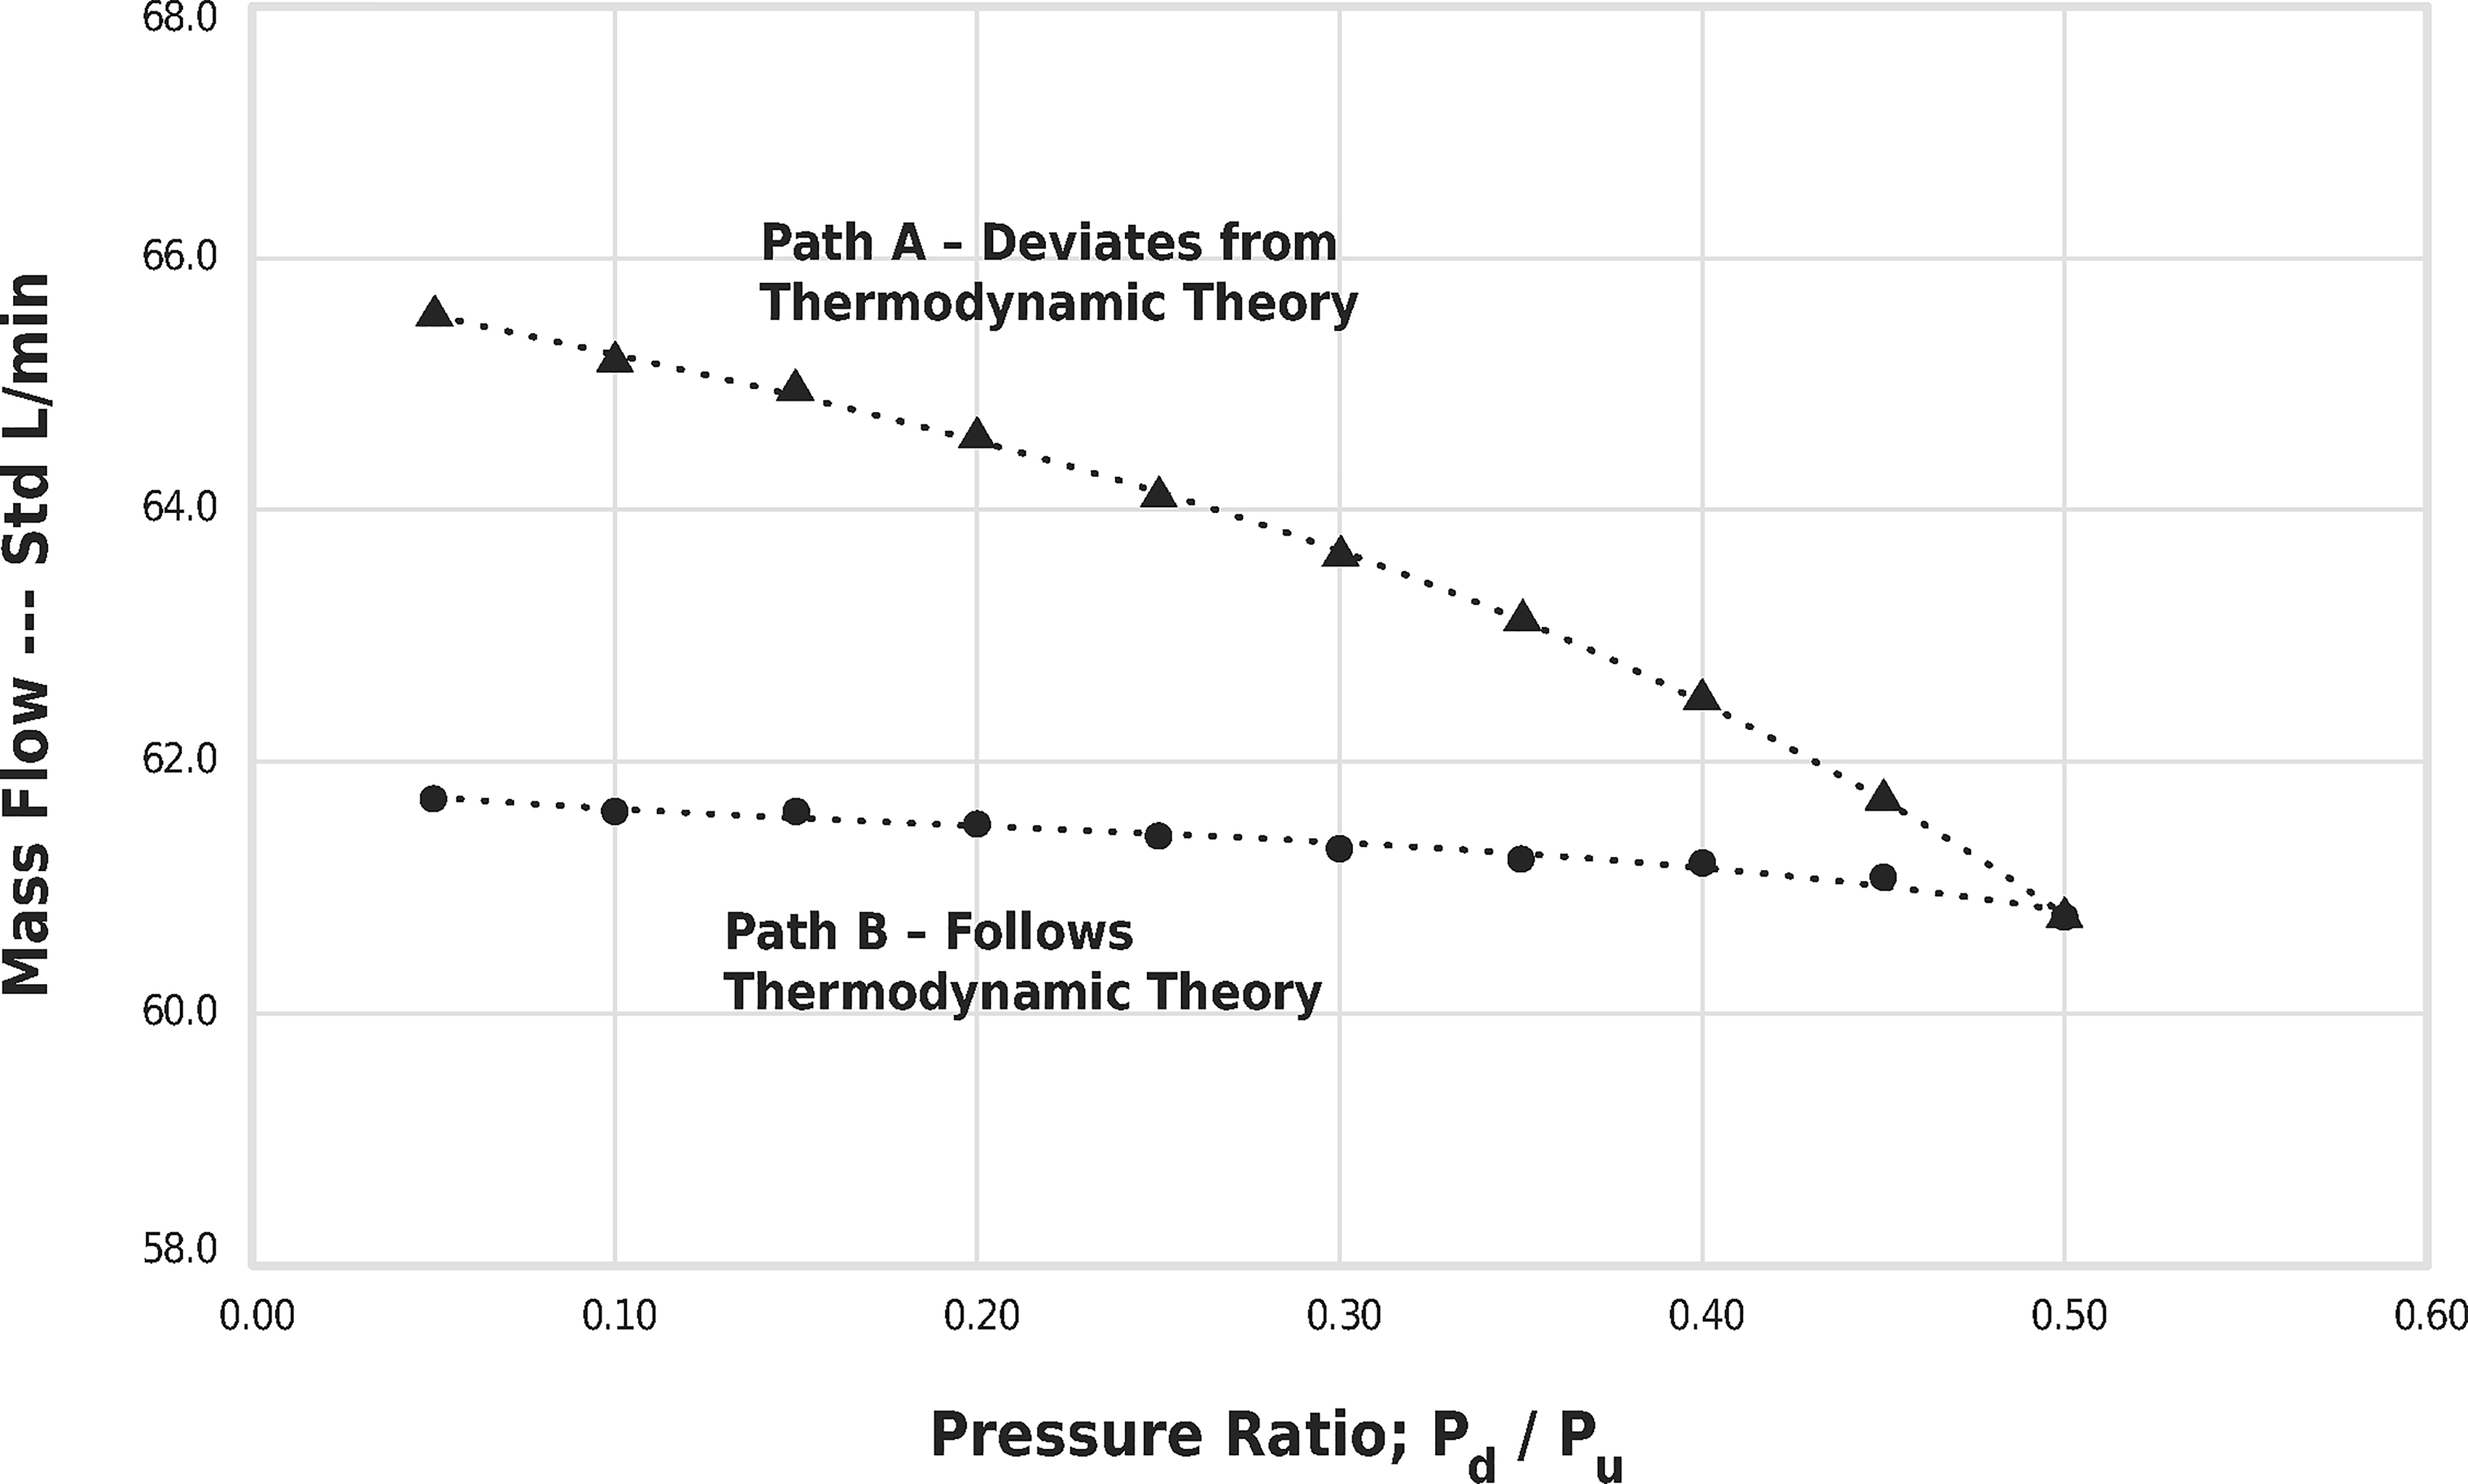
Flow Paths at DPI Start-Up with Valves that DO NOT (Path A) and DO (Path B) Follow Thermodynamic Theory.
With Figure 5 in mind, consider a generic manufacturer aiming to reproduce the cascade impactor results of an innovator drug product. Unknown to both the generic manufacturer and to the innovator, the flow control valves and equipment of the generic manufacturer follow Path A, and those of the innovator followed Path B. The flow rate will ramp up faster with the valves and equipment that follow Path A. (see the Supplementary Data for a derivation of the math that describes this situation, based on the flow start-up simulation work published by Versteeg et al. 3 ). The tests with the Path A valves could possibly result in a different, likely finer, particle size distribution, on average, than tests with the Path B valves.
In another hypothetical scenario, valves with the “Path A” performance can introduce testing variability because two technicians could set their steady-state flow rate at different values of Pd/Pu, such as 0.2 and 0.4. With “Path A” valves, different steady-state values of Pd/Pu mean that the start-up flow path for one test will be different than for the other. However, if the valves exhibit “Path B” shape, the start-up flow paths are identical for all values of Pd/Pu <0.5.
These scenarios are helpful to consider; and there may be others worth considering that indicate qualitatively how non-ideal flow behavior will affect a testing outcome. However, quantifying the effect of the non-ideal flow start-up path, which is a necessary part of establishing quantitative valve specifications, it not straightforward. One of the difficulties of DPIs is that every formulation and device has its own unique response to the air flow startup. Computational analyses combined with experimental data from representative dry-powder inhalers may be a first step toward an industry-wide consensus on what constitutes sufficient specifications for flow control equipment. The absence of specifications, as is currently the situation, seems untenable in light of the experimental data reported herein.
Conclusions
The present study identifies the problem of non-ideal flow control behavior in the testing of dry-powder inhalers. There are two aspects to the problem: (1) lack of data on flow control behavior for valves typical of the inhaler testing community, both in their “stand-alone” configuration and in the configurations found in commercial flow control equipment and (2) a lack of a theoretical understanding and related experimental validation studies to underpin quantitative specifications for flow control behavior.
We have established a valve test method and found that there is a clear difference in the performance of two valves common to the inhaler testing community, both in a fixed test bed where only the valve is subject to test and in their common commercial configuration inside flow control equipment. The Parker 8FV12LN valve identified in Pharm. Eur. 9 and older versions of USP <601> 7 , behaves rather close to the predictions of thermodynamic theory in that the flow rate is nearly constant when the pressure ratio across it, Pd/Pu, is <0.5. For the Camozzi 2839 valve; however, the flow rate continually increases if Pd/Pu continually decreases regardless of the value of Pd/Pu. These differences raise the issue of qualifying flow control equipment before placing that equipment into service, especially for multiple years without routine standardized testing. This absence of qualification of important equipment is quite unusual in the inhaler testing community. It is also an issue that could be yet another source of variability in inhaler test results. 16
Quantifying the effect of these observed behaviors, a necessary step for setting specifications, is difficult, however, because the main effect of the non-ideal behavior will likely be exhibited in the transient start-up of the air flow in the pharmacopeial method of testing DPIs. This flow transient has been modeled for ideal control valve performance 3 but not for the behavior reported herein.
The data acquired and theoretical considerations identified in this study will hopefully stimulate a vigorous consideration of this issue in the inhaler testing community. Future work directed at this issue will need to address the theoretical matters and to validate any predictions experimentally, perhaps with a range of industrial DPIs and possibly assisted by high-speed X-ray contrast imaging 1 and other advanced techniques.
Footnotes
Acknowledgment
The author very much appreciates Dr. Henk Versteeg, Loughborough University (UK), for his insights into air flow behavior and his willingness to respond to multiple e-mails on this subject.
Author Disclosure Statement
The author is an independent consultant in the field of inhaler testing.
Funding Information
No funding was received for this article.
Supplemental Material
Abbreviations Used
References
Supplementary Material
Please find the following supplemental material available below.
For Open Access articles published under a Creative Commons License, all supplemental material carries the same license as the article it is associated with.
For non-Open Access articles published, all supplemental material carries a non-exclusive license, and permission requests for re-use of supplemental material or any part of supplemental material shall be sent directly to the copyright owner as specified in the copyright notice associated with the article.