
Abstract
Blood pressure (BP) control is a core quality metric in value-based care (VBC). The Healthcare Effectiveness Data and Information Set (HEDIS) Controlling High Blood Pressure (CBP) measure uses the final BP reading of the calendar year, a method that overlooks well-documented seasonal variation—BP declines in summer and rises in winter. We evaluated the impact of this pattern on measured performance in a large health system. We conducted a retrospective analysis of monthly BP control rates (July 2019 to December 2025) across the Jefferson Health-Lehigh ambulatory network, totaling 78 months and approximately 7.6 million patient-months. Summer (June to August) and winter (December to February) rates were compared using paired t-tests and ordinary least square regression with seasonal adjustment. Year-end performance was assessed using both the HEDIS final-reading (December rate) and a rolling Q4 average (October to December mean). Standard VBC quality improvement initiatives with Q4 intensification were in place. BP control rates were significantly higher in summer (75.2%; 95% confidence interval [CI]: 73.5%–77.0%) than winter (73.1%; 95% CI: 71.2%–75.1%), a 2.1-percentage-point difference (paired t = 5.13, P = 0.002). This pattern was consistent across all 7 years. Within-year peak-to-trough amplitude averaged 2.8 percentage points in nonpandemic years. The rolling Q4 average exceeded the December-only rate in all years, with differences of 0.06–0.59 percentage points, reclassifying 60–520 additional patients as controlled annually. Seasonal BP variation is robust and inadequately addressed by current quality measures. Multi-reading or seasonally adjusted methods would improve measurement accuracy and fairness. Engagement with NCQA and CMS to pilot redesigned measures is recommended.
Keywords
Blood pressure (BP) control is central to cardiovascular risk reduction and a cornerstone of value-based care (VBC) performance measurement. Hypertension affects nearly half of US adults and remains the leading modifiable risk factor for cardiovascular disease, stroke, and chronic kidney disease. 1 Accordingly, BP control metrics feature prominently in Healthcare Effectiveness Data and Information Set (HEDIS) quality measures, Medicare Advantage Star Ratings, and commercial VBC contracts—directly influencing provider reimbursement, network inclusion, and resource allocation across the health care system.
The HEDIS Controlling High Blood Pressure (CBP) measure determines compliance based on the most recent or final qualifying BP recorded in the measurement year.2–5 This methodology, while operationally straightforward, assumes that a single endpoint reading adequately represents a patient’s year-round control status. That assumption is problematic when physiology varies systematically by season.
A robust evidence base demonstrates that BP is higher in winter and lower in summer, with office-measured differences of approximately 5 mm Hg in systolic BP, depending on the population and setting.6,7 The magnitude of seasonal variation is greater in older adults and in patients on antihypertensive therapy, precisely the populations captured by quality measures.6,8 Mechanistically, cold-induced vasoconstriction, sympathetic nervous system activation, reduced physical activity, and dietary changes all contribute to winter BP elevations.7,9 Indoor temperature, often overlooked, may be a stronger predictor than outdoor temperature during colder months, as individuals spend the majority of their time indoors. 10 Importantly, seasonal BP variation has been linked to cardiovascular mortality peaks in winter and to temperature-attributable CVD burden, predominantly cold-related deaths, across diverse geographies.11,12
Despite international consensus urging researchers and clinicians to account for seasonality when interpreting BP data, major US quality measurement frameworks do not integrate seasonal adjustment. 13 The European Society of Hypertension has explicitly recommended that seasonal variation be considered in both clinical care and research, yet the HEDIS CBP measure continues to rely on final-reading methodology that evaluates patients at whatever point in the seasonal cycle their last measurement happens to fall. 3
This creates a systematic measurement problem for health systems participating in VBC. Organizations whose patients’ final BP readings cluster in winter months, whether due to care delivery patterns, climate, or chance, will appear to underperform relative to peers whose readings cluster in warmer months. The measured difference reflects physiology and calendar timing, not necessarily care quality. Moreover, health systems that intensify quality improvement efforts in Q4 to maximize year-end performance may still find that seasonal physiology attenuates their gains.
The authors therefore sought to quantify the practical consequences of seasonal BP variation on measured performance in a large integrated health system. Specifically, the aims were to (1) characterize the magnitude and consistency of seasonal variation in BP control rates over multiple years; (2) compare year-end performance calculated via the HEDIS final-reading approach versus rolling-average alternatives; and (3) contextualize findings within the published literature to assess generalizability. Based on findings, the authors propose measurement reforms to better align VBC quality assessment with physiological reality and patient-centered population health goals.
Methods
Design and setting
A retrospective observational analysis of monthly BP control rates was conducted across the Jefferson Health-Lehigh ambulatory practice network. The study population included adults aged 18–85 years with diagnosed hypertension. The analysis period spanned 78 consecutive months from July 2019 through December 2025, encompassing approximately 7.6 million patient-months of observation across an estimated 694,000 unique patients annually.
The study population represents a rolling cohort; the specific patients comprising the numerator and denominator each month vary as patients enter and exit the hypertensive population through new diagnoses, disenrollment, aging in or out of eligibility, and other factors. This is consistent with how HEDIS measures function operationally, the denominator is refreshed annually, and the population is not static.
Data sources
Monthly performance data were extracted from an internally developed Hypertension Weighted Goal Performance Table using deidentified data, which tracks numerators (patients meeting BP control criteria) and denominators (eligible hypertensive patients) stratified by location regions, and aggregated system wide. BP control was defined per HEDIS CBP specifications as systolic ≤139 mm Hg and diastolic ≤89 mm Hg on the most recent qualifying measurement. 3 Measure specifications were verified against payer and HEDIS standards, which explicitly define the “final/most recent” BP reading as the compliance determinant.2–5,14
Operational context
Consistent with standard practice in VBC environments, the authors’ health system implements ongoing quality improvement initiatives targeting BP control throughout the year, with intensification during Q4 to maximize calendar-year performance. These efforts include proactive patient outreach, care gap closure campaigns, medication reconciliation, expanded access for BP rechecks, and provider-level performance feedback. This operational context is important for interpreting observed seasonal patterns: any winter decrement in BP control rates occurs despite, not in the absence of, concentrated efforts to improve year-end performance.
Seasonal definitions
Three seasonal categories were defined based on standard meteorological conventions used in prior BP seasonality research: Winter (December to February), Summer (June toAugust), and Transition (March to May, September to November). These definitions align with the European Society of Hypertension consensus recommendations for seasonal BP analysis.6,13
Analytic approach
Descriptive analysis
Monthly BP control rates (numerator/denominator) were calculated and graphed temporal trends to visualize cyclic patterns. For each calendar year, the following data was obtained: (1) the December “final-reading” rate per HEDIS methodology; (2) a rolling Q4 mean (October to December average); and (3) the annual mean across all available months.
Statistical comparisons
The summer versus winter BP control rates were calculated using paired t-tests (pairing by year, n = 7 complete years) and independent-samples t-tests (all monthly observations). Effect size was quantified using Cohen’s d for paired comparisons. Non-parametric confirmation was performed using the Mann–Whitney U test.
Regression modeling
An ordinary least squares (OLS) regression model was developed with BP control rate as the dependent variable and indicator variables for winter and summer seasons (transition months as reference), plus a linear time trend to account for temporal improvement. The winter–summer contrast and its 95% confidence interval (CI) were estimated from the regression coefficients and their variance–covariance matrix.
Within-year amplitude
For each calendar year, the peak-to-trough amplitude (maximum monthly rate—minimum monthly rate) was calculated to characterize intra-annual variability.
Bootstrap CIs
Year-specific seasonal differences were estimated with 95% CIs using 1000 bootstrap resamples.
Rolling average sensitivity analysis
To assess the robustness of performance measurement methodologies, a sensitivity analysis was conducted comparing rolling averages of different durations. Specifically, calculations were compared between rolling 4-month and rolling 12-month averages for BP control rates across the study period. The 12-month rolling average closely mirrored the shorter rolling window and the annual mean, with no statistically significant difference observed (mean difference = −0.22 percentage points; 95% CI: −0.60 to +0.16; P = 0.26). This analysis demonstrates that rolling or multi-reading approaches (regardless of window length) yield stable and comparable results, supporting their use as alternatives to single-point, seasonally sensitive measures.
All statistical tests were 2-sided with α = 0.05. Analyses were performed in Python 3.11 using pandas, scipy, and statsmodels.
Results
Seasonal pattern in population BP control
Across 78 months of observation (July 2019 to December 2025), monthly BP control rates demonstrated consistent seasonal variation characterized by winter nadirs and summer peaks (Fig. 1). Mean BP control was 75.2% (95% CI: 73.5%–77.0%) during summer months (June to August) compared with 73.1% (95% CI: 71.2%–75.1%) during winter months (December to February)—a difference of 2.1 percentage points. This seasonal difference was statistically significant in paired analysis by year (t = 5.13, P = 0.002, n = 7 years) with a large effect size (Cohen’s d = 2.10). The pattern was consistent across all 7 complete calendar years analyzed, with summer rates exceeding winter rates in every year except 2020, when pandemic-related care disruptions produced atypical patterns.
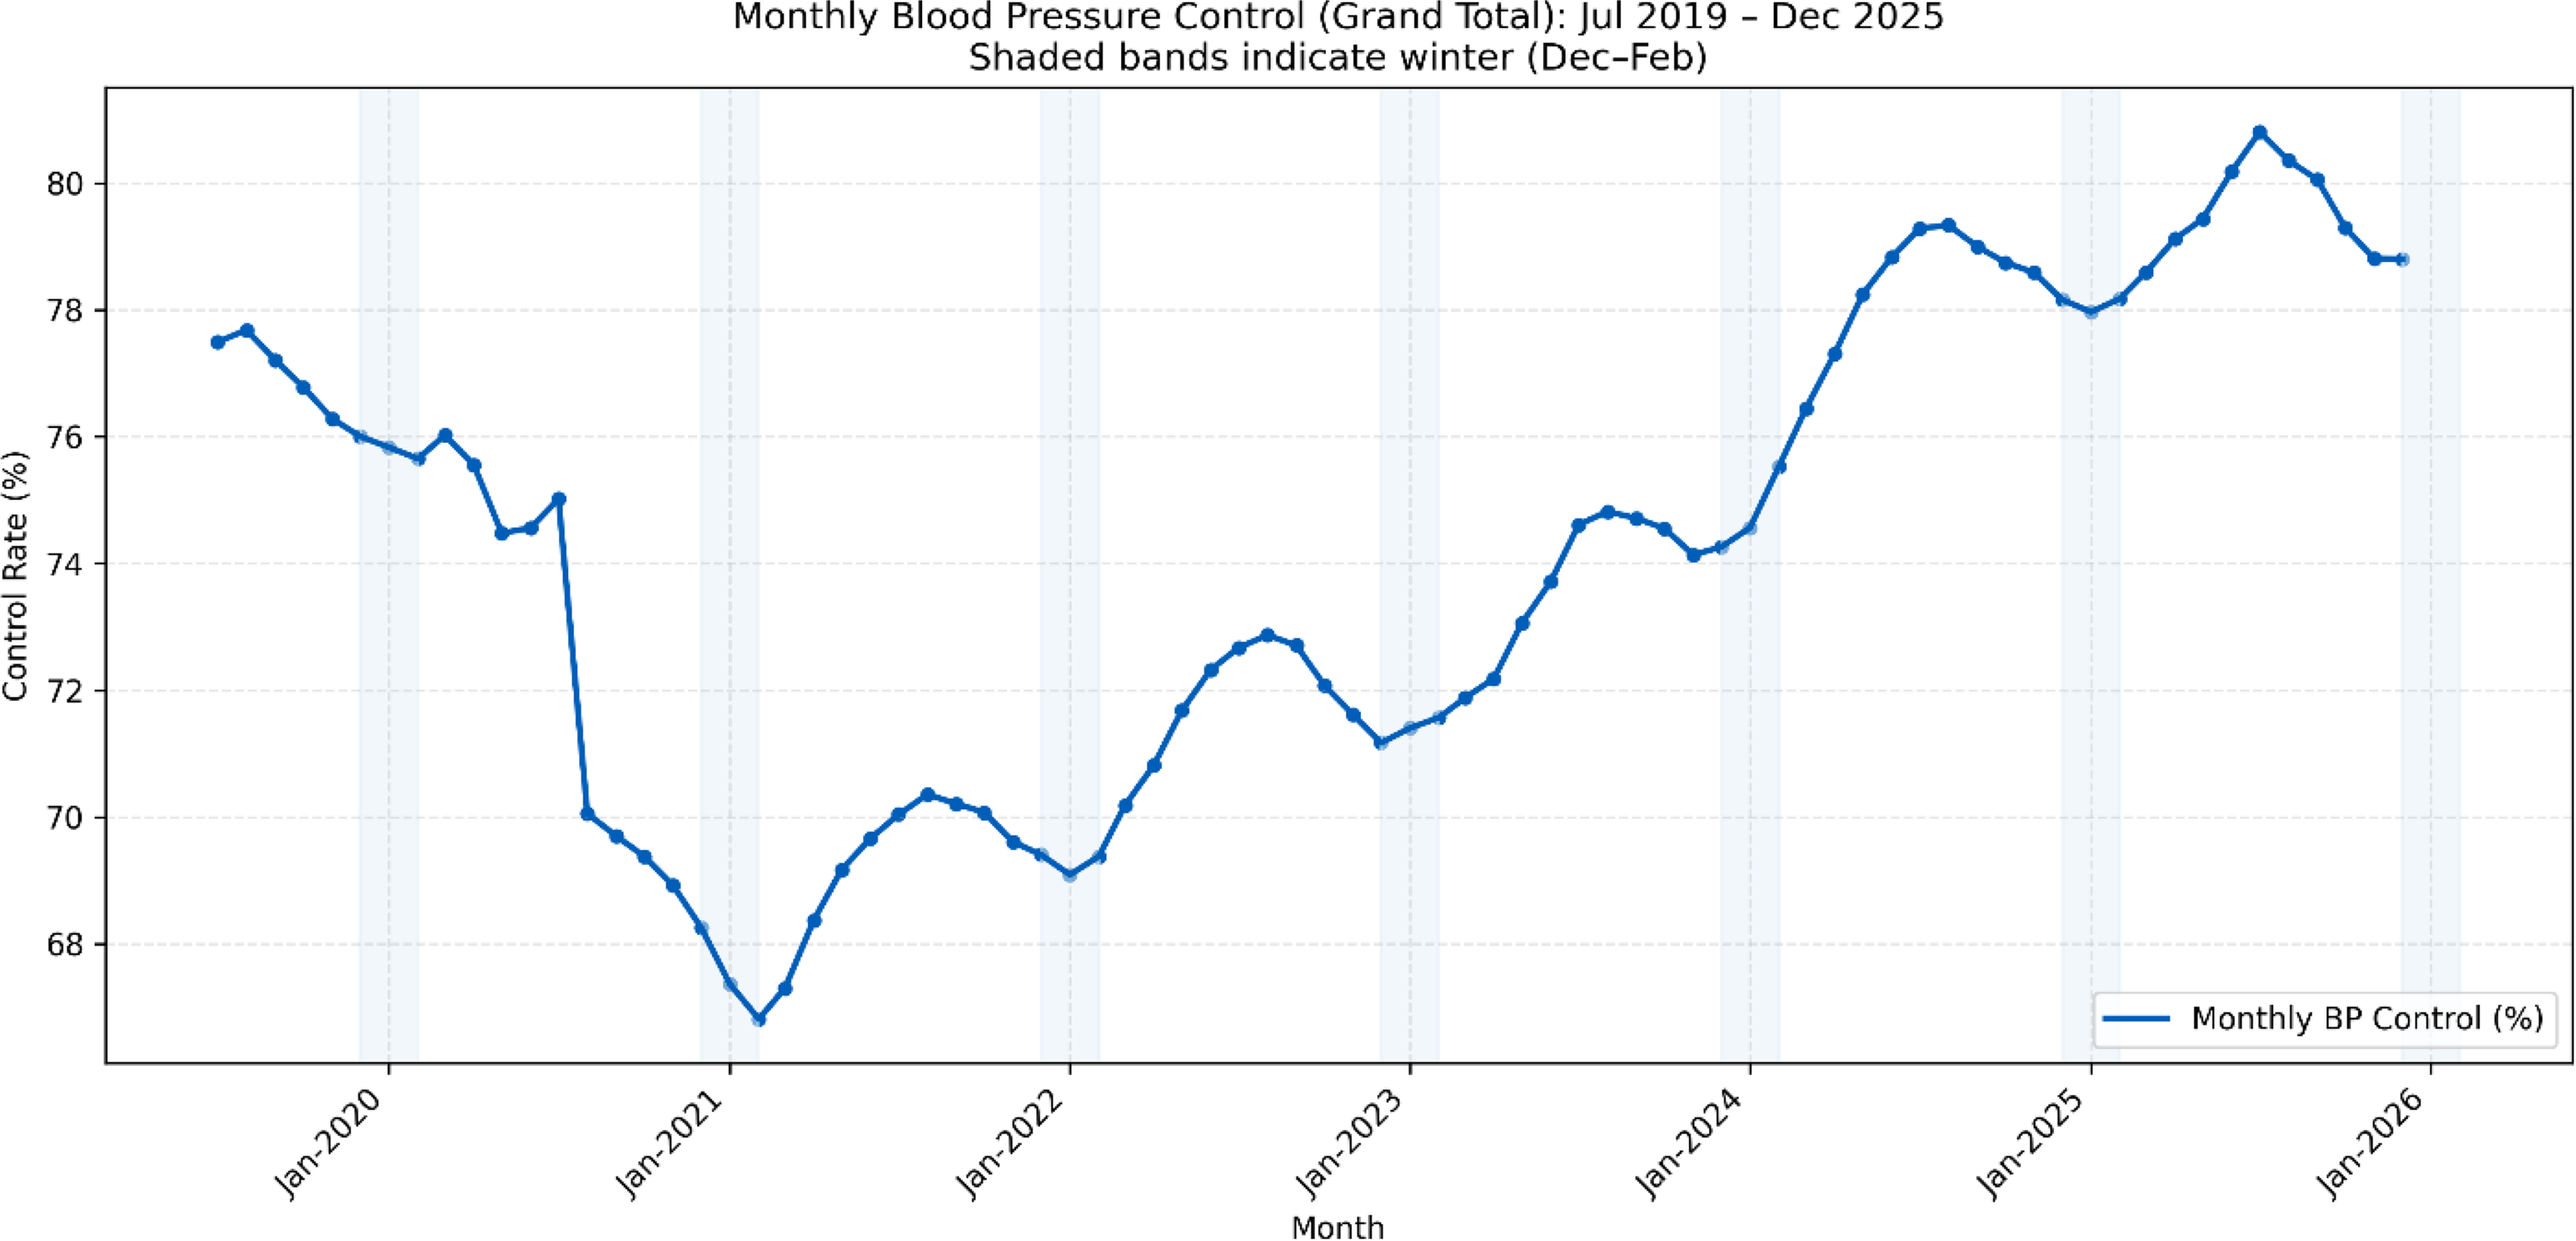
Seasonal pattern in BP control (grand total). BP, blood pressure.
Within-year amplitude
The mean within-year peak-to-trough amplitude was 4.0 percentage points (range: 1.7–7.8 pp). Peak control rates consistently occur during summer months, with July or August representing the annual maximum in 6 of 7 years. Trough rates occurred during winter months in all years, with December, January, or February representing the annual minimum. The largest amplitude (7.8 pp) occurred in 2020, likely reflecting COVID-19 disruptions to routine ambulatory care; excluding this outlier year, the mean amplitude was 2.8 percentage points (range: 1.7–4.8 pp).
Notably, these seasonal decrements occur despite intensified Q4 quality improvement efforts designed to maximize year-end performance. The persistence of winter nadirs in the face of concentrated operational intervention suggests the observed amplitude represents a conservative estimate of the underlying physiological effect.
Regression analysis
In an OLS regression model adjusting for seasonal effects and secular time trend, the winter–summer contrast was 2.14 percentage points (95% CI: 0.13–4.14 pp; P = 0.04). The model also identified significant time based improvement over the study period, with BP control rates increasing by 0.10 percentage points per month (P < 0.001), reflecting cumulative quality improvement efforts. The model explained 35% of variance in monthly control rates (R2 = 0.35), with the remainder attributable to factors such as practice mix variation, patient population shifts, and random month-to-month fluctuations.
Final reading versus rolling average performance
Table 1 compares year-end performance calculated using the HEDIS “final reading” approach (December rate) versus a rolling Q4 average (October to December mean). The rolling method yielded higher control rates than the December-only approach in all 7 years, with absolute differences ranging from 0.06 to 0.59 percentage points. While modest in percentage terms, these differences have meaningful population-level implications: across a denominator of 90,000–112,000 eligible patients annually, the measurement methodology difference translates to 60–520 additional patients classified as controlled each year (Table 1).
Year-End Blood Pressure Control Performance: Final Reading Versus Rolling Q4 Average
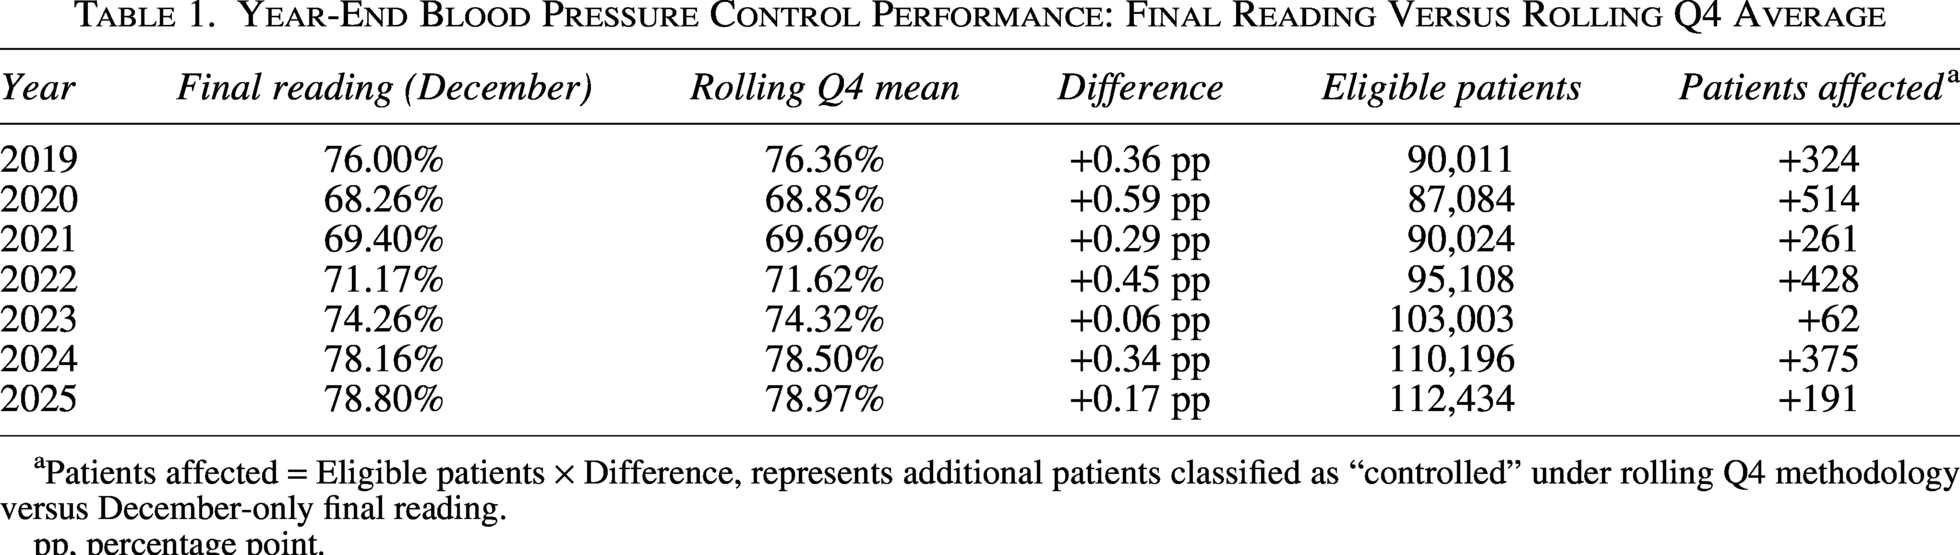
Patients affected = Eligible patients × Difference, represents additional patients classified as “controlled” under rolling Q4 methodology versus December-only final reading.
pp, percentage point.
The largest discrepancy occurred in 2020 (0.59 pp difference), consistent with pandemic-era volatility. In more typical years, the difference averaged approximately 0.3 percentage points, representing 300–400 patients annually whose control status depends on measurement methodology rather than clinical opportunity.
Congruence with published evidence
The observed summer–winter difference of approximately 2 percentage points aligns with expectations derived from the published literature. Meta-analyses report seasonal BP variation of approximately 5 mm Hg systolic (office measurements) and 3 mm Hg (home measurements), with BP lower in summer and higher in winter. 6 Applying an estimated slope of 0.4 percentage points of control per 1 mm Hg change in population systolic BP, a 5 mm Hg seasonal swing would predict a 2 percentage point difference in control rates, consistent with the author’s observations. The concordance between this health system data and international meta-analyses supports the generalizability of seasonal BP variation as a systematic influence on quality measurement.
Discussion
Principal findings
This analysis of 78 months of BP control data across a large integrated health system in the Northeastern United States confirms that seasonal variation materially affects measured performance in VBC. Summer BP control rates exceeded winter rates by 2.1 percentage points (P = 0.002), a pattern that was consistent across all 7 years studied and robust to regression adjustment for seasonal trends. This signal persisted despite intensive Q4 quality improvement efforts specifically designed to maximize year-end performance. This suggests the observed amplitude represents a floor rather than a ceiling for the underlying physiological effect.
Interpreting effect magnitude
The 2.1 percentage point summer–winter difference, while modest in absolute terms, warrants serious consideration for a few reasons.
First, the effect is highly consistent and statistically robust. The seasonal pattern appeared in every year of observation, survived adjustment for time trends, and demonstrated a large effect size (Cohen’s d = 2.10) in paired analysis. This suggests a reproducible phenomenon driven by well-characterized physiology.
On the population scale, modest percentages translate to substantial patient impact. In this system alone, measurement methodology differences reclassify 300–500 patients annually from “uncontrolled” to “controlled” or vice versa. Extrapolated across the approximately 500 health systems participating in Medicare Advantage and commercial VBC contracts, seasonal measurement bias could affect tens of thousands of patients’ attributed control status nationally—with downstream implications for provider payment, Star ratings, and resource allocation.
Finally, the current measurement approach creates systematic unfairness across health systems. Organizations with higher proportions of winter clinical activity, those in colder climates, and those whose patient populations are more temperature sensitive (older adults, treated hypertensives) will systematically underperform relative to peers. This undermines the validity of cross-system performance comparisons that drive value-based payment.
Alignment with published evidence
An important clinical consideration is whether providers already adjust antihypertensive therapy seasonally. If clinicians routinely intensify regimens in winter and de-escalate in summer (a practice recommended by some but not widely adopted), then the observed 2.1-percentage-point seasonal variation in control rates occurs despite compensatory pharmacologic intervention, suggesting the underlying physiological effect is larger than what aggregate performance data capture. Conversely, if seasonal titration is uncommon, the variation described here represents an actionable clinical opportunity: proactive winter medication adjustment, paired with planned summer reassessment, could attenuate seasonal performance swings while improving year-round patient outcomes.
These findings align closely with international evidence on seasonal BP variation. Meta-analyses report winter–summer BP differences of approximately 5 mm Hg systolic in office measurements, with larger effects in older adults and those on antihypertensive therapy.6,7 The inverse relationship between ambient temperature and BP is well characterized, operating through cold-induced vasoconstriction, sympathetic activation, and behavioral changes in physical activity and diet. 9 Indoor temperature (often overlooked) appears to be a stronger predictor than outdoor temperature during winter months, as individuals spend the majority of their time indoors. 10 Unfortunately, direct comparisons of winter BP control rates between states with different climates (eg, Florida vs. Maine) are not yet available in the published literature. Recent reviews highlight this as a critical gap and call for further research using national datasets. 15 Such analyses would help ensure that quality measurement and payment models account for geographic and climate-driven variation, promoting equity across health systems.
The concordance between this population-level control rate data and individual-level BP measurements from international cohorts supports the generalizability of these findings and underscores the need for future research and policy reform to address geographic variation in BP control and ensure fair benchmarking. Seasonal BP variation has been documented across Europe, Asia, and North America, with effect sizes proportional to seasonal temperature amplitude.6–8
Robustness of rolling average methodologies
Sensitivity analysis revealed that the 12-month rolling average produces results nearly identical to the 4-month rolling average and annual mean, with no significant differences. This finding underscores the stability and fairness of rolling or multi-reading approaches for BP control assessment. By minimizing the impact of transient seasonal fluctuations, rolling averages offer a practical and equitable alternative to the current single-point measurement paradigm. These results reinforce the recommendation to adopt rolling or seasonally adjusted methodologies for quality reporting, ensuring that performance assessment reflects sustained control rather than calendar timing.
Implications for quality measurement
The HEDIS CBP measure uses the “most recent” or “final” qualifying BP of the measurement year to determine compliance.2,3 This methodological choice, while operationally simple, embeds a systematic bias: patients whose final measurement falls in winter months are evaluated at their physiological maximum. The measure does not account for the well-documented reality that the same patient, with the same medication regimen and the same level of adherence, will have measurably different BP in July versus January.16,17
This creates a problematic incentive structure. Health systems may respond by intensifying winter medication titration; a clinically reasonable response in isolation, but one that risks summer hypotension, falls, and adverse events when temperatures rise, and BP naturally decreases. Alternatively, systems may game measurement timing, steering patients toward summer encounters for “final” readings—administratively rational but misaligned with continuous, patient-centered care.
The emerging NCQA Blood Pressure Control for Patients with Hypertension (BPC-E) measure, which incorporates longitudinal digital BP data, represents a step toward measurement reform. 18 However, BPC-E adoption remains limited, and the dominant HEDIS CBP methodology continues to anchor performance assessment for most VBC contracts. Expanded adoption of home BP monitoring and remote patient monitoring (RPM) represents a particularly promising approach. Recent CMS RPM reimbursement models create financial incentives for longitudinal BP monitoring that could simultaneously improve clinical management and provide measurement data less susceptible to seasonal office-visit bias. Time-in-range metrics derived from continuous or frequent home BP data would capture sustained control more accurately than periodic office readings while also generating the longitudinal dataset needed to characterize individual patients’ seasonal patterns and guide personalized therapy adjustments.
Recommendations
Based on these findings and alignment with international consensus, the authors propose the following reforms:
The case for action
Seasonal BP variation has been recognized in clinical and epidemiological literature for decades. Consensus statements from the European Society of Hypertension explicitly recommend accounting for seasonality when interpreting BP data. 13 Yet, US quality measurement frameworks continue to rely on final-reading methodologies that ignore this well-established physiology.
The persistence of winter decrements in this data, despite concentrated Q4 quality improvement efforts, demonstrates that operational interventions alone cannot fully overcome seasonal effects. Measurement reform is needed to align incentive structures with physiological reality, ensure fair comparison across health systems, and support patient-centered approaches to BP management.
The tools for reform are available: rolling averages require no new data; seasonal adjustment models are straightforward; and digital BP platforms enabling longitudinal measurement already exist. What remains is the collective desire to modernize quality measurement, considering evidence that has been proven over time.
VBC programmatic implications
Seasonal BP variation may also interact with risk adjustment models used in VBC contracts. If risk scores are calculated or refreshed at different points in the year than quality measures are assessed, the population’s apparent acuity and its measured performance may be temporally misaligned. A patient attributed during a winter risk assessment window may carry a higher apparent cardiovascular burden, while that same patient’s summer BP measurement may suggest adequate control, or vice versa. This interaction between seasonal physiology, attribution timing, and risk scoring deserves further investigation.
Additionally, the timing of population attribution relative to measurement creates a structural vulnerability. In many VBC arrangements, attributed populations are locked at a point in time (eg, beginning of the contract year or based on plurality of visits), while quality measurement occurs throughout or at the end of the year. Patients attributed during periods of higher utilization (eg, winter respiratory season) may differ systematically from those attributed during lower-utilization months, compounding seasonal measurement bias with attribution bias.
Multi-payer complexity further complicates seasonal measurement effects. While HEDIS CBP uses a calendar-year measurement period, commercial VBC contracts may define performance periods on different cycles (eg, fiscal year, rolling 12-month windows). A health system reporting to multiple payers with staggered measurement periods may find that the same patient appears controlled for one payer and uncontrolled for another based solely on when the final reading falls relative to each payer’s measurement window.
Limitations
Several limitations warrant consideration. First, this analysis draws from a single integrated health system in the Mid-Atlantic region; generalizability to health systems with different patient demographics or care delivery models requires further study. Published literature demonstrates seasonal BP variation across diverse geographies including Mediterranean Europe, East Asia, and the World Health Organization populations spanning 25 countries, suggesting this is a universal physiological phenomenon rather than a regional artifact. However, the amplitude of seasonal variation likely differs by latitude and climate—health systems in southern US states may observe smaller seasonal swings, while those in northern climates may observe larger effects.
Multi-site validation across US climate regions would strengthen the policy case for measurement reform. Within the study region, it was not possible to distinguish urban from rural subpopulations; indoor temperature regulation, housing quality, and heating access may modify seasonal BP amplitude, with rural and lower-income populations potentially experiencing larger seasonal swings due to less consistent indoor climate control. 10 Aggregate monthly performance rates were analyzed rather than patient-level longitudinal data, precluding examination of individual-level seasonal BP trajectories or adjustment for patient-specific confounders such as age, comorbidities, or medication regimen.
In addition, the study period includes the COVID-19 pandemic (2020–2021), which disrupted routine ambulatory care and introduced anomalous patterns—including the largest within-year amplitude observed (7.8 percentage points in 2020)—that may not represent typical seasonal variation. Also, the December “final reading” was compared to a rolling Q4 average as a proxy for the HEDIS methodology; however, the HEDIS specification uses the last qualifying BP of the calendar year regardless of month. Patients whose final encounter occurs in November rather than December would have their November BP counted, partially impacting the winter bias described.
While seasonal variation in measured control rates is described, it cannot be definitively attributed to physiological BP changes versus seasonal differences in patient visit patterns, medication adherence, dietary changes, physical activity, or other behavioral factors, although prior literature suggests temperature-mediated vasoconstriction is the dominant mechanism.7,9
Last, the absolute differences between the final-reading and rolling-average measurement approaches, while statistically significant, are modest in percentage terms (0.1–0.6 pp annually). The policy case for measurement reform rests on cumulative population impact (hundreds to thousands of patients per health system reclassified annually) and on fairness across health systems with differing seasonal care patterns, rather than on large effect sizes observable within any single organization.
Conclusion
Seasonal BP variation is predictable, physiologically grounded, and measurably impacts performance assessment in VBC. This analysis of 78 months of data across a large integrated health system demonstrates a consistent 2.1-percentage-point summer–winter difference in BP control rates (P = 0.002). It is a pattern that persists despite intensive Q4 quality improvement efforts designed to maximize year-end performance.
Current HEDIS methodology, which anchors compliance to a single final reading, systematically undervalues true year-round control and creates unfair comparisons across health systems with differing seasonal care patterns. At the population scale, this measurement bias reclassifies hundreds of patients per health system annually (and potentially tens of thousands nationally) based on calendar timing rather than care quality.
The solutions are technically straightforward: rolling averages, seasonal adjustment models, and longitudinal digital BP monitoring—all are feasible with existing data and infrastructure. Now, alignment is needed between quality measurement specifications and physiological evidence. A call is being made for NCQA, CMS, payers, and health system leaders to modernize BP quality measurement—ensuring that performance assessment reflects sustained control rather than a weather-dependent snapshot.
Author’s Contributions
J.S.: Conceptualization, Methodology, writing—original draft, writing—review & editing. D.C.: Investigation, resources, writing—review & editing. B.C.: Investigation, resources, writing—review & editing. E.G.: Investigation, resources, writing—review & editing. C.K.: Investigation, resources, writing—review & editing. All authors read and approved the final manuscript.
Data Availability Statement
The data that support the findings of this study are available upon request.
Footnotes
Author Disclosure Statement
No competing financial interests exist.
Funding Information
No funding was received for this article.