
Abstract
To date, most bundled payment programs have been voluntary in design. However, such programs are limited by provider and patient selection, the potential exacerbation of health disparities, and results with limited generalizability. In 2026, Medicare will address these concerns through the Transforming Episode Accountability Model (TEAM), the first mandatory program to require nationwide participation across multiple surgical procedures. To anticipate whether the TEAM model can provide generalizable evidence for scaling bundled payments nationwide, the authors used Medicare data to conduct a cross-sectional analysis comparing the characteristics of markets and hospitals selected to participate in TEAM with those that were not. The current study found that, although the 186 TEAM markets were larger than the 618 markets that will not participate, they were similar with regard to structural characteristics (e.g., Medicare advantage penetration, exposure to prior bundled payment programs) and population characteristics (e.g., education, income). The 727 TEAM hospitals differed from the 2155 others with regard to key characteristics, including teaching and safety-net status, profit margin, and patient volume. Overall, these findings suggest that TEAM may generate findings that can be generalized to all US markets while expanding the types of hospitals that have participated in bundled payment programs.
Over the past decade, the Centers for Medicare and Medicaid Services (CMS) has tested episode-based bundled payments as a strategy for improving health care value. Under bundled payments, clinicians and hospitals receive fixed reimbursement for defined care episodes. Those who maintain quality while increasing cost efficiency have the potential to share in savings, whereas those who do not may be required to pay penalties to CMS.
To date, most bundled payment programs have been voluntary in design. While they have been associated with cost savings with stable quality for both surgical and medical episodes,1–3 they are limited by concerns about selection among providers (i.e., selective participation by some clinicians but not others) and patients (i.e., “cherry-picking” certain patients over others).4–7 Implications of such selection include potential exacerbation of disparities in access to care as well as limited generalizability of model results.
In 2026, CMS will address these concerns through the Transforming Episode Accountability Model (TEAM), a mandatory program that moves beyond prior mandatory models that have focused on single conditions. As the first program to require nationwide participation across multiple surgical procedures, TEAM will mandate that hospitals in 180 selected US markets accept bundled payments for five common surgical procedures, covering episodes that span hospitalization and 30 days of post-acute care. This mandatory design is consistent with the goal of rigorously testing payment programs that can be certified by the CMS Office of the Actuary as a requirement for broader implementation.8–10
As policymakers chart a new direction for bundled payments through TEAM, empirical evidence is needed to anticipate the implications of its market-based mandatory design. In particular, it is unknown whether TEAM will engage communities that are representative of all US markets. This question is particularly salient given that joint replacement-focused mandatory bundled payment models, which used stratified randomization to target geographic markets based on procedural volume, led to the disproportionate exclusion of communities with a greater share of individuals adversely affected by health-related social needs. 11 A similar but modified randomization approach was proposed for TEAM 12 across a broader range of procedures.
To address this knowledge gap, the authors’ objective was to compare the characteristics of markets and hospitals selected to participate in TEAM with those across the country that were not selected to participate in the model.
Methods
TEAM design
CMS used stratified random sampling to select markets, defined by Core-Based Statistical Areas (CBSAs), for inclusion in TEAM. Acute care hospitals within selected CBSAs, identified as Metropolitan Statistical Areas (MSAs) or micropolitan Statistical Areas (mSAs), were required to participate. Inclusion was based on a variety of factors, including average episode spending, past exposure to other bundled payment models, and the number of hospitals (overall and safety-net). 13 In addition to acute care hospitals within included markets, hospitals in other markets (i.e., those not included through stratified randomization) were given a one-time option to voluntarily participate in TEAM if they were participants in recently concluded or active bundled payment programs. These programs included the Comprehensive Care for Joint Replacement Model, which mandated hospitals in selected markets across the country to accept bundled payments for lower extremity joint replacement; and the Bundled Payments for Care Improvement-Advanced program, which allowed clinicians and hospitals to voluntarily accept bundled payments for up to 32 different clinical episodes of care.
The model includes episodes for five surgical procedures: lower-extremity joint replacement, surgical hip/femur fracture treatment, spinal fusion, coronary artery bypass graft, and major bowel procedures. Episodes begin at hospital admission and conclude 30 days after discharge. The current study examined the characteristics of TEAM participant (treatment) and nonparticipant (control) markets, as well as the characteristics of hospitals within both groups.
Data
This study used publicly available data from CMS to identify hospitals selected for TEAM. 14 The authors then used 2022 Medicare Provider Analysis and Review (MedPAR) data to identify patients admitted nationwide under Medicare Severity–Diagnosis-Related Groups (MS-DRGs) corresponding to TEAM-eligible procedures: lower-extremity joint replacement (MS-DRG 469, 470, 521, 522), surgical hip/femur fracture treatment (MS-DRG 480-482), spinal fusion (MS-DRG 402, 426-430, 447, 448, 450, 451, 471-473), coronary artery bypass graft (MS-DRG 231-236), and major bowel procedures (MS-DRG 329-331). MedPAR data were used to obtain historical episode volume and patient-level characteristics. Data were chosen because CMS used data between January 2022 and June 2023 to select TEAM hospitals.
This study also used 2022 American Hospital Association Annual Survey data to obtain hospital characteristics, including ownership, urban versus rural location, teaching status, safety-net status, and market concentration (defined by Herfindahl–Hirschman Index). American Hospital Association data also include information on hospitals’ financial performance and risk-contracting experience, allowing the authors to contextualize TEAM participation in the context of overall risk exposure. Data from the 2022 American Community Survey were used to obtain market-level characteristics such as median household income, proportion of the population with incomes at or below the federal poverty level (FPL), and median education level.
Study sample
The study sample consisted of acute care hospitals within CBSAs and hospitalizations occurring at these hospitals for TEAM-eligible procedures. Following TEAM rules, 15 markets included two types of CBSAs: (1) MSAs as areas with a population of at least 50,000 and (2) mSAs as areas with a population of more than 10,000 but fewer than 50,000.
Markets were categorized into those randomized for, or containing hospitals that voluntarily opted into, the program (TEAM markets) and those randomized but not selected for the program (control markets). Acute care hospitals were assigned to these groups based on the market in which they were located: hospitals within TEAM markets were defined as TEAM hospitals, while hospitals in control markets were defined as control hospitals.
Statistical analysis
The authors used census regions to indicate the geographic distribution of TEAM markets and hospitals nationwide. They also determined the distribution of hospitals across geographic markets. The current study compared TEAM and control markets with respect to hospital, population, and market structure characteristics. This comparison included market exposure to prior bundled payment models, assessed by the average number of hospitals participating in those prior models.
This study also compared TEAM and control hospitals with respect to organizational characteristics. Chi-square tests were used to compare categorical variables, while t tests were used to compare continuous variables. Analyses were performed using Python version 3.12.4 Anaconda distribution and SAS version 9.4. The University of Pennsylvania Institutional Review Board approved the study.
Results
Market characteristics
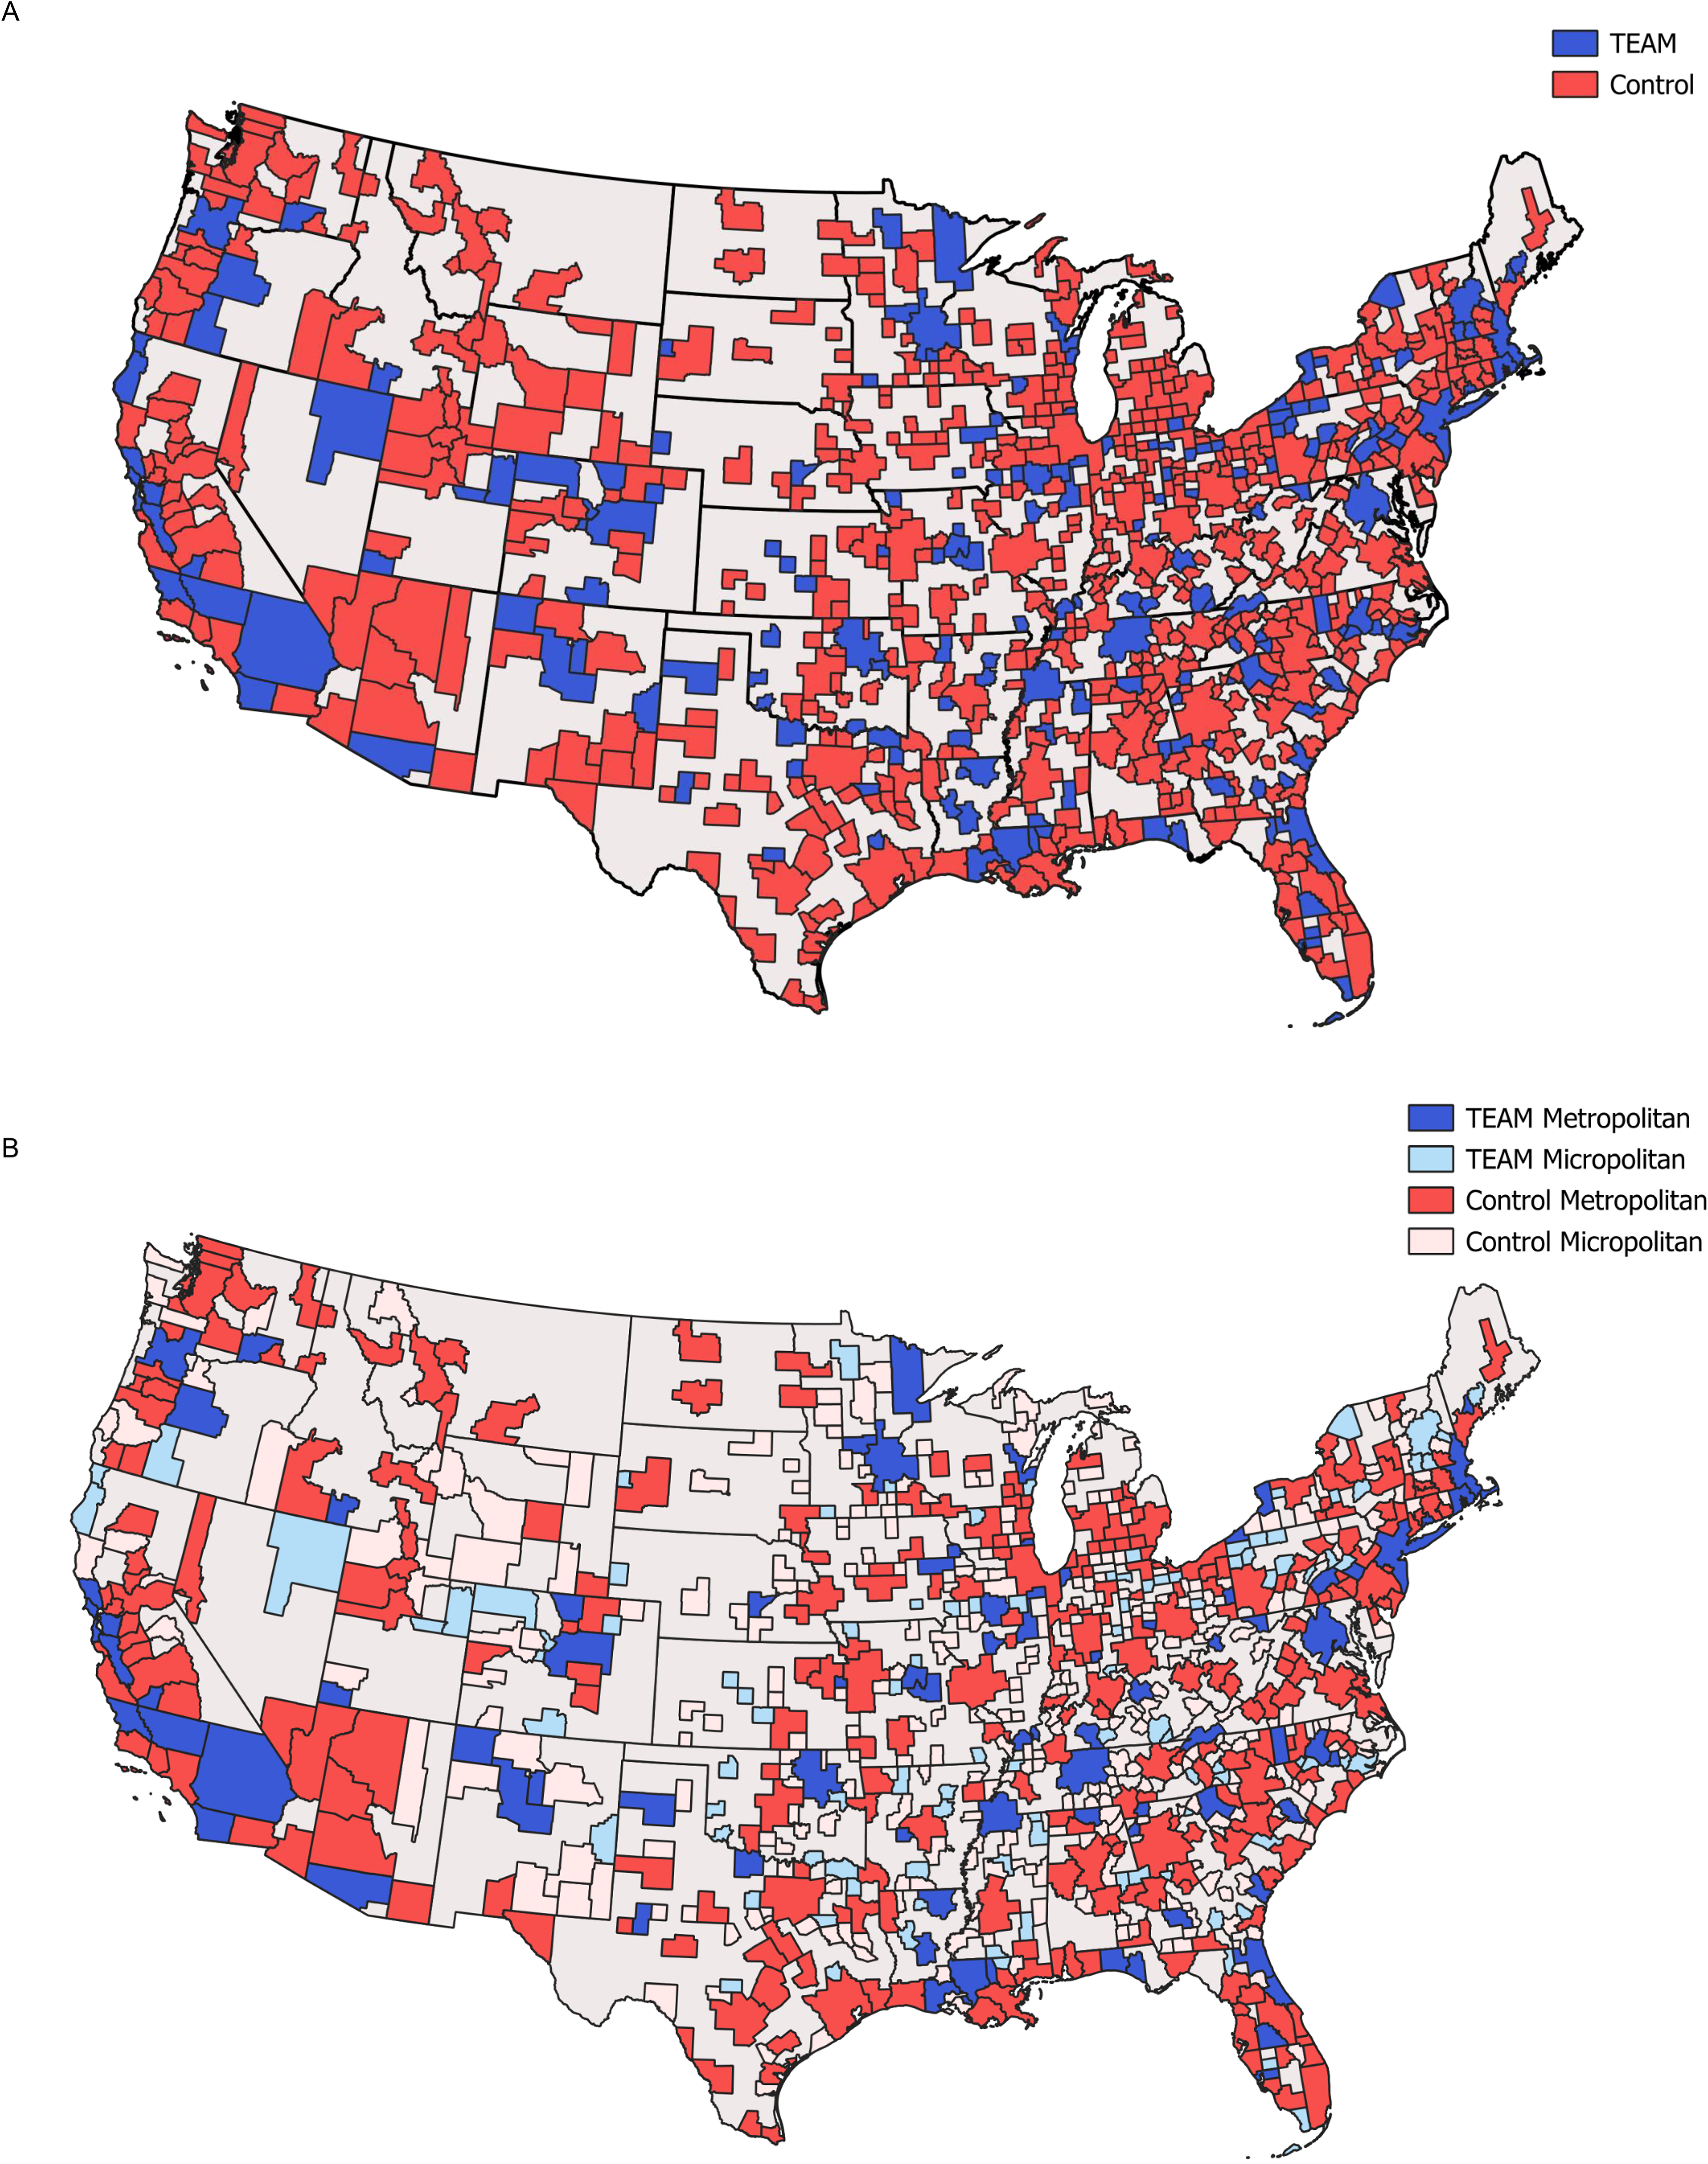
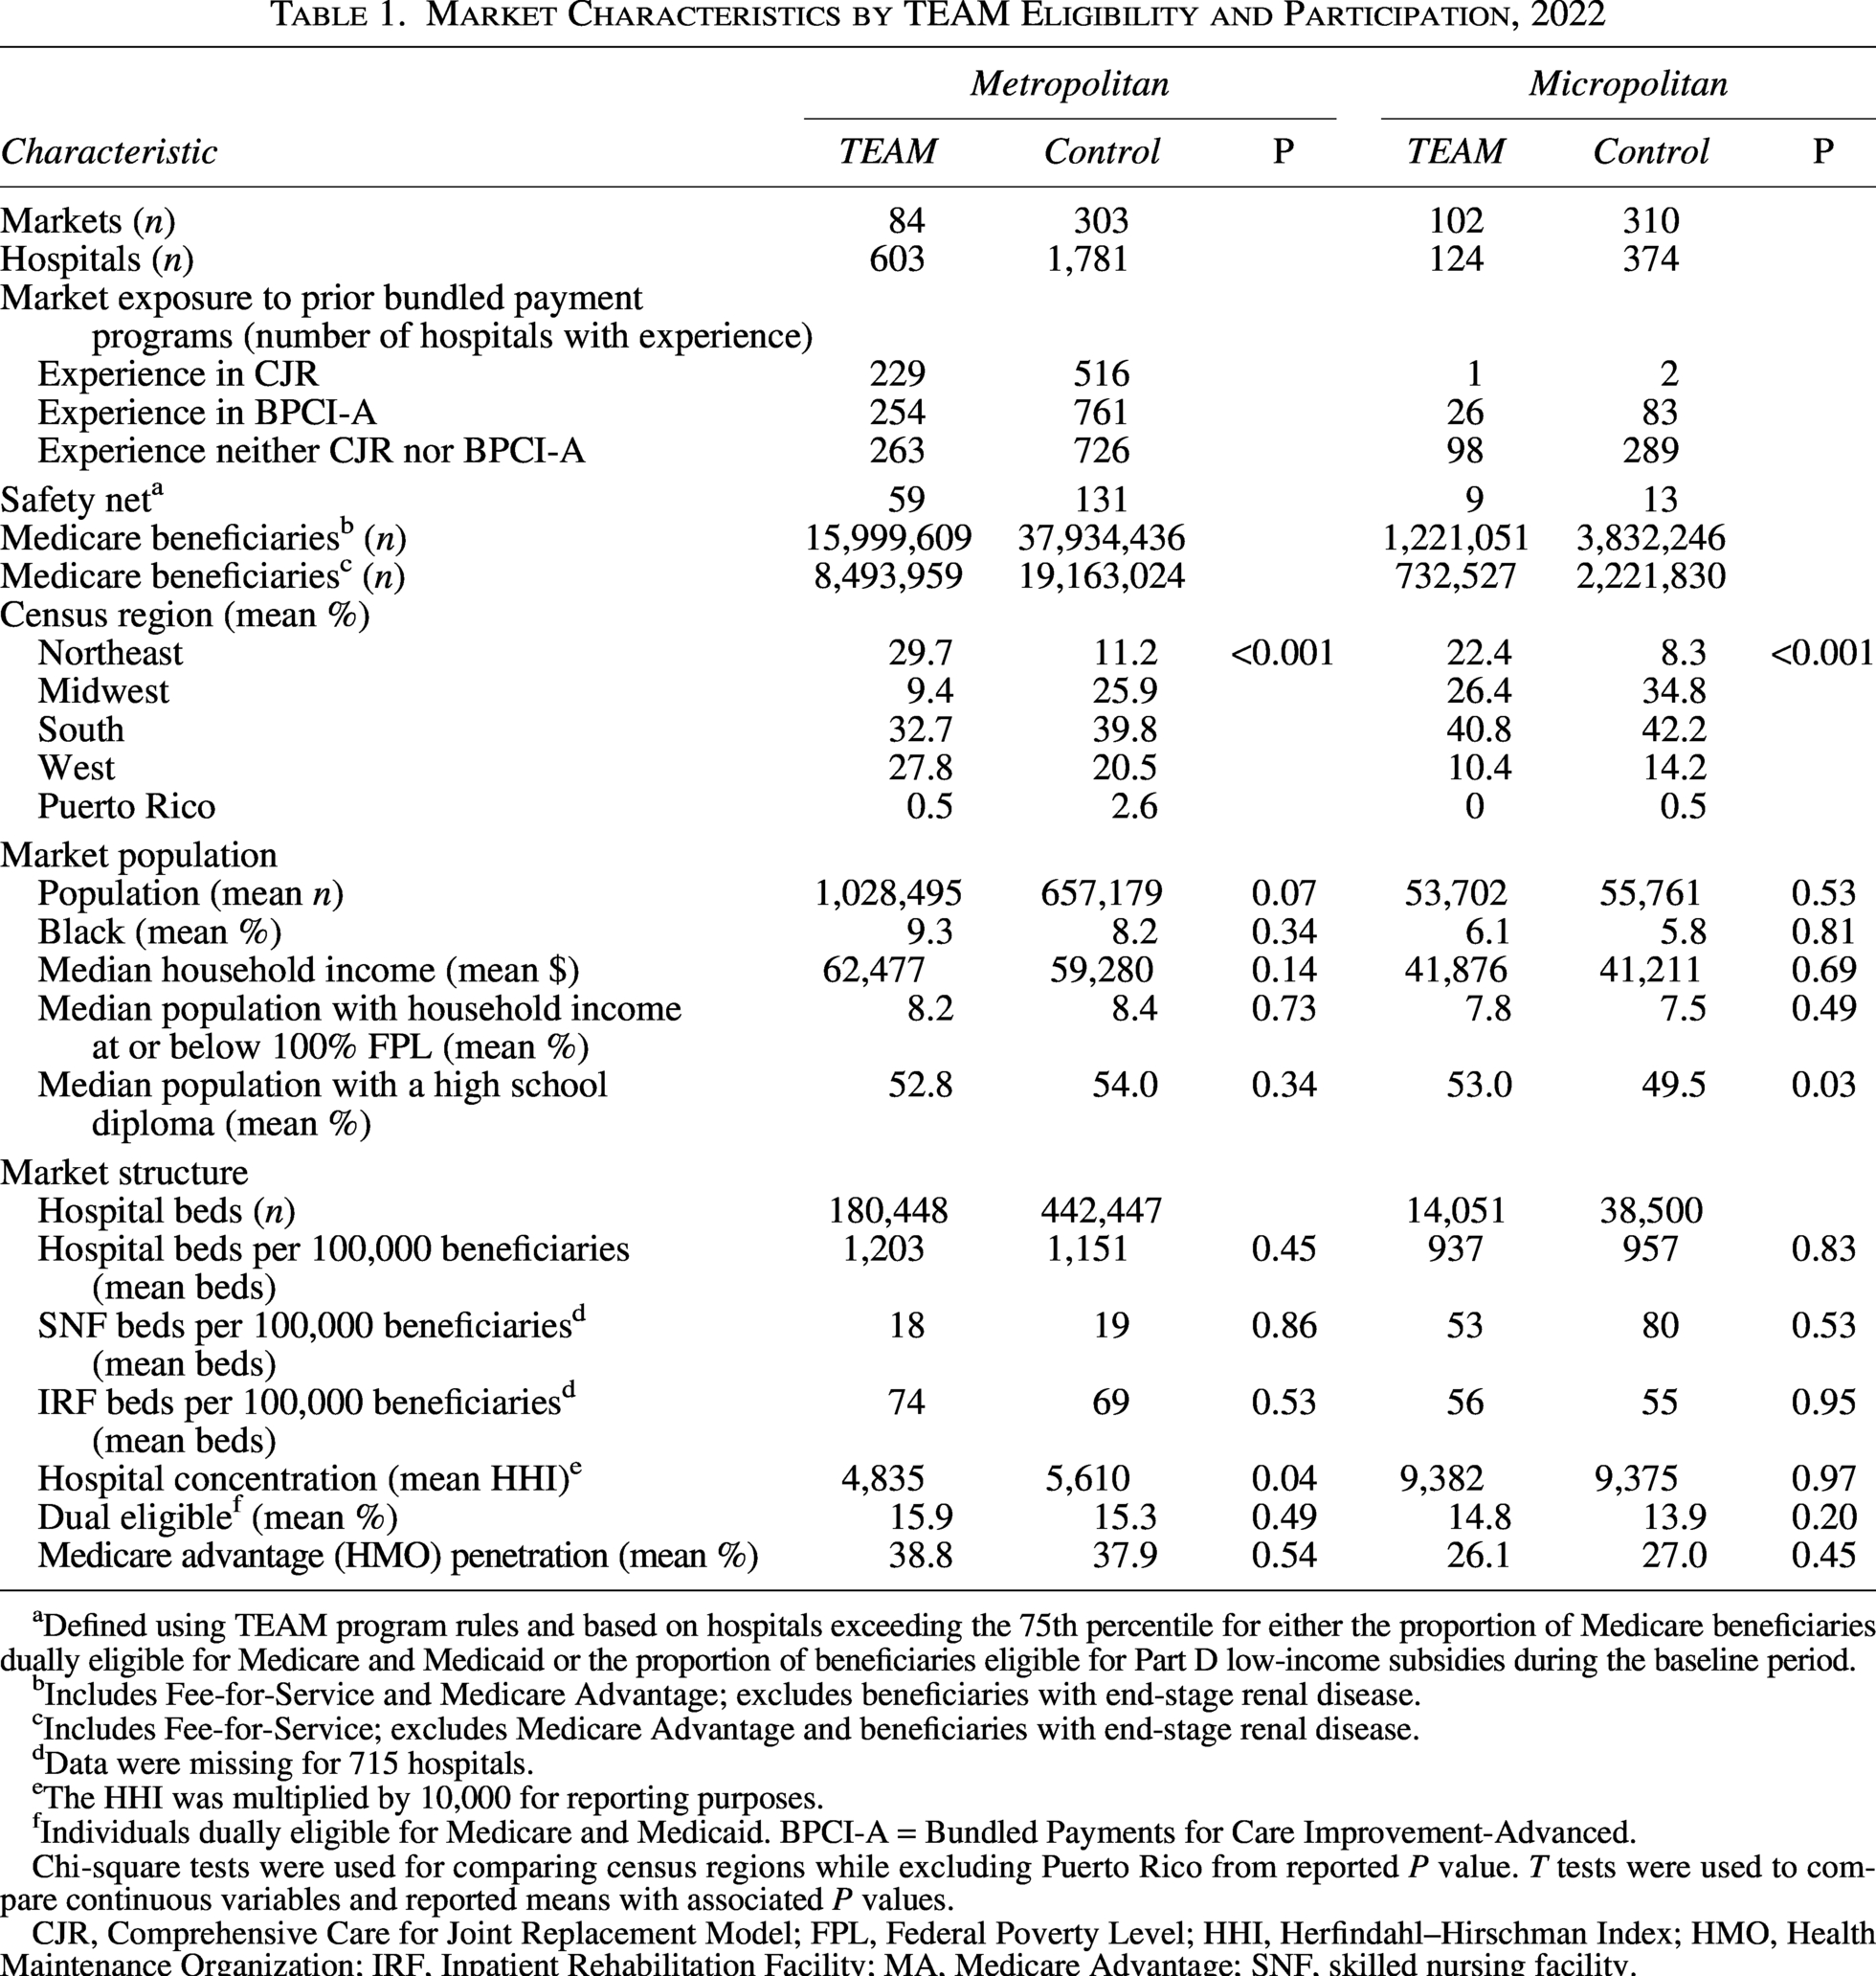
The study sample consisted of 186 TEAM markets (84 metropolitan and 102 micropolitan) and 618 control markets (303 metropolitan and 310 micropolitan), which were geographically distributed across the country (Fig. 1A, B). The Northeast had greater representation among TEAM markets compared with control markets for both metropolitan (29.7% and 11.2%, respectively; P < 0.001) and micropolitan markets (22.4% and 8.3%; P < 0.001) (Table 1). Conversely, the Midwest had lower representation among TEAM MSAs (9.4%) compared with control MSAs (25.9%) (Fig. 1B).
Market Characteristics by TEAM Eligibility and Participation, 2022
Defined using TEAM program rules and based on hospitals exceeding the 75th percentile for either the proportion of Medicare beneficiaries dually eligible for Medicare and Medicaid or the proportion of beneficiaries eligible for Part D low-income subsidies during the baseline period.
Includes Fee-for-Service and Medicare Advantage; excludes beneficiaries with end-stage renal disease.
Includes Fee-for-Service; excludes Medicare Advantage and beneficiaries with end-stage renal disease.
Data were missing for 715 hospitals.
The HHI was multiplied by 10,000 for reporting purposes.
Individuals dually eligible for Medicare and Medicaid. BPCI-A = Bundled Payments for Care Improvement-Advanced.
Chi-square tests were used for comparing census regions while excluding Puerto Rico from reported P value. T tests were used to compare continuous variables and reported means with associated P values.
CJR, Comprehensive Care for Joint Replacement Model; FPL, Federal Poverty Level; HHI, Herfindahl–Hirschman Index; HMO, Health Maintenance Organization; IRF, Inpatient Rehabilitation Facility; MA, Medicare Advantage; SNF, skilled nursing facility.
TEAM and control markets demonstrated similarities with regard to other market structural characteristics (Table 1). Control MSAs had a similar mean hospital bed count per 100,000 beneficiaries compared with TEAM MSAs (1151 vs. 1203; P = 0.45). TEAM and control markets also had similar percentage of mean dual-eligible beneficiaries in MSAs (15.9% vs. 15.3%; P = 0.49) and mSAs (14.8% vs. 13.9%; P = 0.20). TEAM and control markets were comparable with respect to Medicare advantage penetration among MSAs (38.8% vs. 37.9%; P = 0.54) and mSAs (26.1% vs. 27.0%; P = 0.45).
TEAM and control markets were also generally similar in prior exposure to the Bundled Payments for Care Improvement Advanced program, using the number of hospitals with participation as a measure of market exposure (Table 1). In contrast, TEAM MSAs (229/603; 38.0%) had greater exposure to the Comprehensive Care for Joint Replacement Model compared with control MSAs (516/1781; 29.0%).
TEAM and control markets shared many demographic and socioeconomic characteristics (Table 1). For instance, the two market groups were similar with respect to the proportion of Black individuals in the mean population among MSAs (9.3% vs. 8.2%; P = 0.34) and mSAs (6.1% vs. 5.8%; P = 0.81). Population income was also comparable between TEAM and control markets at both the MSA (8.2% vs. 8.4% of households with incomes at or below the FPL, respectively; P = 0.73) and mSA levels (7.8% vs. 7.5% of households with income at or below the FPL, respectively; P = 0.49). Similarly, population education was comparable between TEAM and control MSAs (52.8% vs. 54.0% of individuals with a high school diploma, respectively; P = 0.34).
In contrast, population differences between TEAM and control markets were observed with respect to the number of Medicare beneficiaries and overall mean market population. TEAM markets and their hospitals proportionately had more Medicare beneficiaries (17,220,660 beneficiaries across 727 hospitals, averaging 23,687 beneficiaries per hospital) than control markets (41,766,682 beneficiaries across 2155 hospitals, averaging 19,381 beneficiaries per hospital).
Hospital characteristics
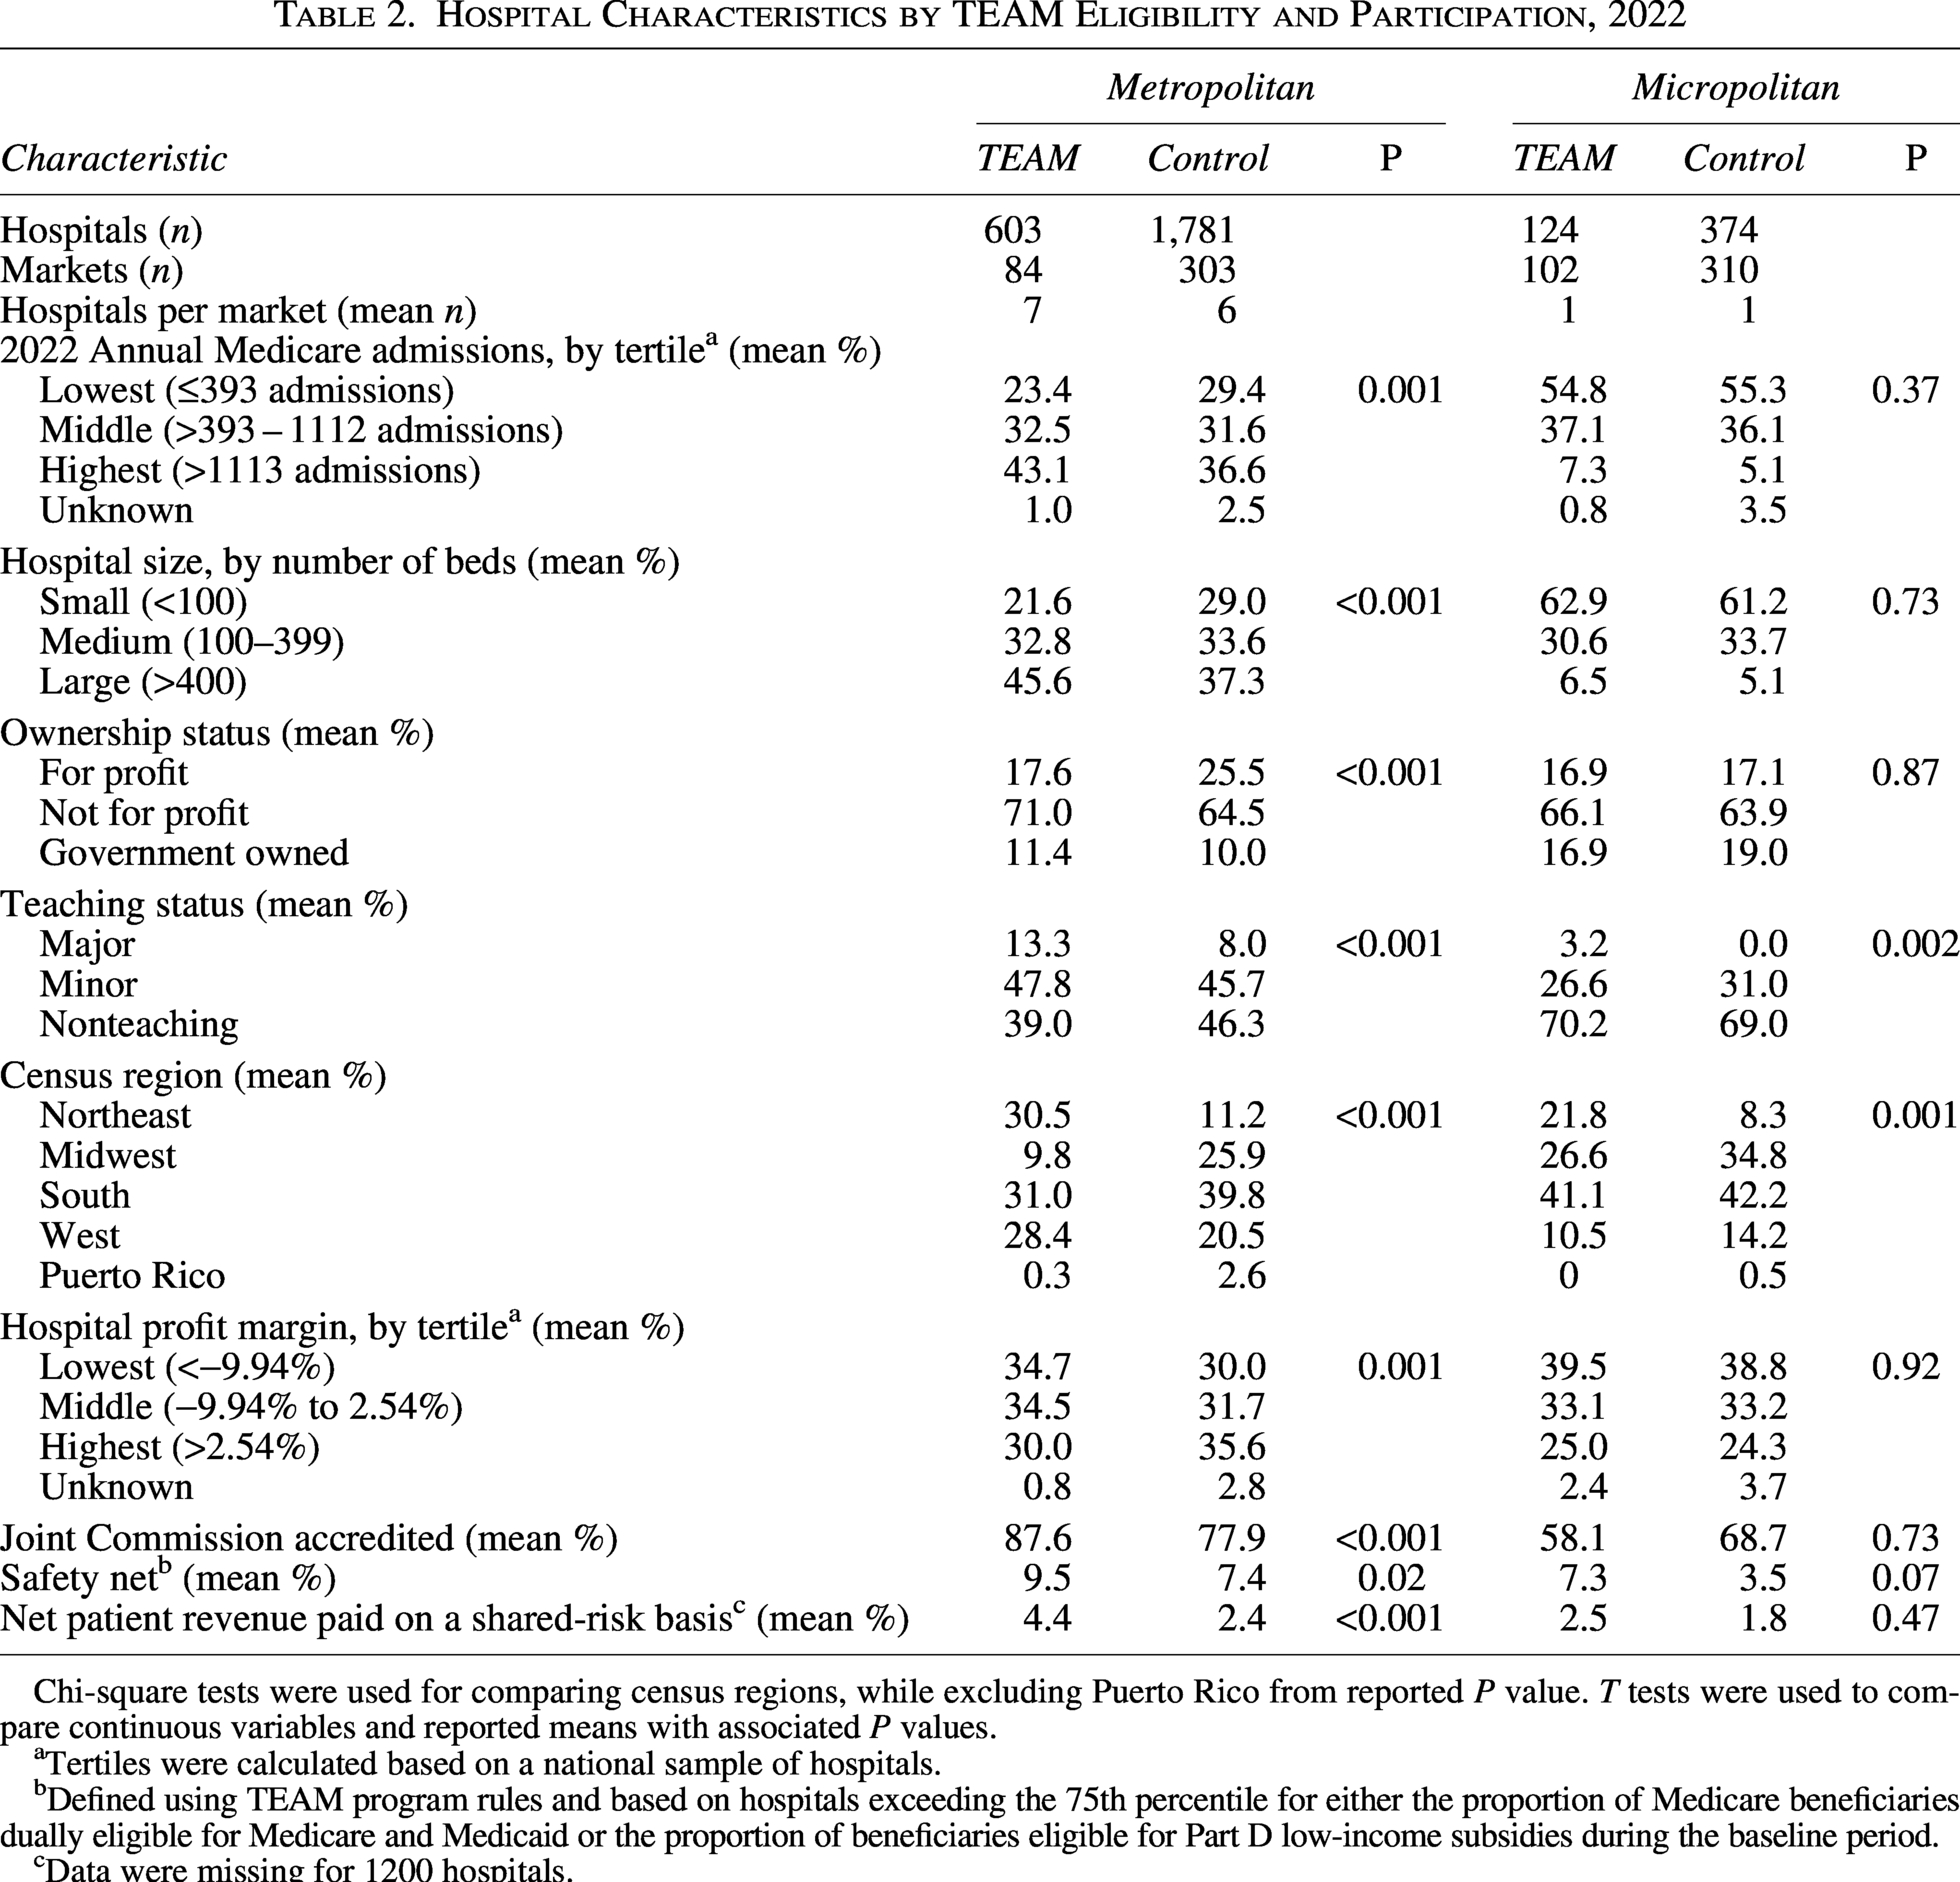
In total, there were 727 TEAM hospitals across TEAM markets and 2155 control hospitals across control markets (Table 2). TEAM MSAs had a higher density of hospitals than control MSAs (a mean of 7 hospitals per TEAM MSA vs. 6 hospitals per control MSA), whereas TEAM and control mSAs were similar with respect to density of hospitals (a mean of 1 hospital per mSA for both).
Hospital Characteristics by TEAM Eligibility and Participation, 2022
Chi-square tests were used for comparing census regions, while excluding Puerto Rico from reported P value. T tests were used to compare continuous variables and reported means with associated P values.
Tertiles were calculated based on a national sample of hospitals.
Defined using TEAM program rules and based on hospitals exceeding the 75th percentile for either the proportion of Medicare beneficiaries dually eligible for Medicare and Medicaid or the proportion of beneficiaries eligible for Part D low-income subsidies during the baseline period.
Data were missing for 1200 hospitals.
TEAM and control hospitals varied with regard to a number of characteristics (Table 2). Across MSAs, a higher proportion of control hospitals were for-profit institutions compared with TEAM hospitals (25.5% vs. 17.6%; P < 0.001)—differences not observed between the two hospital groups among mSAs (17.1% of control hospitals and 16.9% of TEAM hospitals; P = 0.87). Across both MSAs and mSAs, a higher proportion of TEAM hospitals were major teaching hospitals compared with control hospitals (13.3% vs. 8.0% among MSAs, respectively; P < 0.001, and 3.2% vs. 0.0% among mSAs; P = 0.002). In micropolitan areas, a higher proportion of TEAM hospitals were safety-net institutions (7.3%) compared with control hospitals (3.5%) (P = 0.07). A similar difference was observed in metropolitan areas (9.5% of TEAM hospitals vs. 7.4% of control hospitals; P = 0.02).
Among MSAs, a greater proportion of TEAM hospitals were in the lowest tertile of profit margin compared with control hospitals (34.7% vs. 30.0%; P = 0.001). There were additional differences observed between TEAM and control hospitals with regard to size (bed number) and Medicare volume (annual Medicare admissions). In particular, more TEAM hospitals were large (over 400 beds) compared with control hospitals (45.6% vs. 37.3%; P < 0.001) among MSAs. Among metropolitan areas, TEAM hospitals were also more likely to fall within the highest tertile of Medicare admissions (43.1%) compared with control hospitals (36.6%) (P = 0.001).
Discussion
This study compared the characteristics of both markets and hospitals selected to participate in the TEAM bundled payment model for surgical procedures. Overall, these findings suggest that markets selected for the program were similar to others across the country, although the group of hospitals included in TEAM differed from comparison hospitals with regard to several key characteristics. These findings are notable for several reasons.
First, the observed similarities between participating and nonparticipating markets underscore the utility of market-level randomization, suggesting that eventual findings from TEAM may be generalizable to all US markets to a greater extent than findings from prior voluntary bundled payment programs. In preceding voluntary bundled payment programs, participating markets and their corresponding hospitals were strikingly different than their nonparticipating counterparts. For example, hospitals participating in the Bundled Payments for Care Improvement initiative were more likely to be not for profit and teaching hospitals compared with nonparticipant hospitals; participant markets also had greater Medicare Advantage and Accountable Care Organization penetration compared with nonparticipant markets. 1 These differences may be attributed to selected hospitals in certain markets electing to participate given their confidence in organizational capacities for success. With respect to generalizability, it is somewhat reassuring that TEAM and control markets were generally similar with regard to most demographic and socioeconomic characteristics. However, hospital-level differences are also notable given that patients experience and receive episodes-based care through individual hospitals, and hospital characteristics, such as teaching status (e.g., the presence of resident physicians) may affect care delivery. Hospital-level differences are relevant for understanding the implications of market-level randomization and for future evaluations of the impact of TEAM. In particular, recognition of these hospital differences should contextualize future evaluations of model impact and spur analyses examining heterogeneity of treatment effects.
In particular, TEAM and control markets were similar with respect to several measures that may reflect socioeconomic disadvantage, such as household income, educational level, and the proportion of racial minority groups. These similarities are particularly notable given that TEAM is the first bundled payment model designed explicitly to address health disparities and encourage greater participation from safety-net hospitals. Future work should evaluate whether TEAM program impact varies according to these market features or analogous characteristics of individual patients receiving care through the program. Such analyses may be particularly salient given CMS’ beneficiary-level approach to risk adjustment methodology for TEAM, with adjusted payments based on patient factors such as Hierarchical Condition Category count, eligibility for Medicaid, or residence in a Census tract with a Community Deprivation Index ranked at the 80th percentile or higher.
Second, study findings suggest that TEAM is poised to meaningfully expand the scope of mandatory payment programs in the United States. In particular, by encompassing markets that represent 25% of all Medicare beneficiaries, TEAM will go beyond several mandatory programs focused on single procedures and conditions (e.g., lower extremity joint replacement and kidney care16–19) to encompass multiple episodes for common surgical procedures across a larger proportion of the Medicare population. Although not all beneficiaries are enrolled in traditional Medicare or require surgical care, the overall scope of TEAM nonetheless significantly expands the purview of mandatory models.
Additionally, there are reasons based on prior bundled payment programs to believe that fee-for-service payment models could create “spillovers” benefits for Medicare advantage and other individuals outside of traditional Medicare.20,21 To the extent that TEAM and control markets are similar, any future benefits observed in TEAM could be considered for expansion to control markets. Together, these dynamics position the model not only to add insight to the benefits of mandatory participation 22 but also yield results that can potentially be certified by the CMS Office of the Actuary for broader expansion within the Medicare program. This imperative to identify and scale-up programs provides a rationale for the mandatory design of TEAM, as well as prior episode-based payment models. Notably, Medicare has exercised this authority in other programs outside of the CMS Innovation Center, such as the Hospital Readmissions Reduction Program and the Hospital Value-Based Purchasing Program. However, unlike clinical trials, mandatory payment models are implemented under CMS policy authority and do not require informed consent, institutional review board oversight, or independent data monitoring in the same manner. While this statutory ability to mandate participation enables more representative evaluation and reduces selection bias, it also raises concerns about autonomy and the imposition of financial risk on hospitals and their patients. In turn, when designing future models, policymakers could consider drawing lessons from pragmatic clinical trials and incorporate elements such as scientific and community advisory boards, as well as committees charged with monitoring data, safety, disparities, or other signals.
Third, while TEAM and control markets were similar, observed differences between participating and nonparticipating hospitals prompt concerns over the generalizability of program results if they are derived from a hospital-level evaluation. For instance, compared with nonparticipant hospitals, more TEAM hospitals tended to be large institutions with greater Medicare admission volumes. In metropolitan areas, TEAM hospitals were more likely than nonparticipating hospitals to be nonprofit, teaching, and safety-net institutions with lower financial profits. These findings corroborate prior work 23 that did not examine market characteristics, underscoring concerns about evaluating TEAM based on hospital-level comparisons to determine model success or failure. Furthermore, these differences are consistent with the design of TEAM, in which CBSAs—the unit of cluster randomization—were first stratified based on characteristics such as episode spending, the mix of hospital types (e.g., teaching status, safety-net status, ownership), and prior experience with value-based payment models, and then a subset of CBSAs (approximately 25%) was randomly selected for participation. Because entire markets, rather than individual hospitals, were selected, hospitals within participating CBSAs may have structural and patient population characteristics that differ systematically from those in nonselected CBSAs. In addition, because stratification did not explicitly account for all hospital- or region-level characteristics, and because only a subset of CBSAs was selected, imbalances in observable characteristics—including hospital size, teaching status, and geographic distribution—would not necessarily be unexpected even under valid randomization. These differences may be further amplified by correlations in outcomes and practice patterns within CBSAs, such that selecting or excluding entire markets leads to measurable differences across groups. Finally, given the large number of hospitals included in the analysis, even modest differences in characteristics or spending may achieve statistical significance. Accordingly, observed differences between participant and nonparticipant hospitals should be interpreted as a consequence of stratified cluster randomization at the CBSA level rather than as evidence of selection bias at the hospital level.
Last, the TEAM model will have greater participation from safety-net hospitals than prior voluntary models. It is therefore essential that policymakers should monitor for unintended effects from TEAM on safety-net hospitals. This concern is particularly salient given the disproportionate penalties levied on safety-net institutions in prior payment programs,24,25 and the important role that nonprofit and teaching hospitals can play in caring for historically underserved populations. The model includes measures to mitigate unintended consequences, encompassing three distinct participation tracks that are designed to facilitate participation among safety-net hospitals while reducing the risk of disproportionate penalties. For instance, in the first participation track, safety-net hospitals have the ability to remain participants without assuming downside financial risk for a longer period than other hospitals. Additionally, when hospitals must assume downside financial risk, unlike some other hospitals, safety-net hospitals are eligible to join a lower risk Track 2 (downside risk is capped to protect hospitals).
Limitations
This study had several limitations. First, because of its descriptive design, this analysis could not evaluate the relationship between TEAM participation and changes in quality or cost outcomes over time. However, the goal of the current study was to describe types of hospitals selected for TEAM as the first mandatory program of its kind and to provide a basis for future work assessing the impact of the model. Second, results of this analysis were subject to the limitations inherent to claims data, such as lack of granularity about clinical condition or patient functional status. The study team also did not have access to data regarding procedural volume, which has been associated with outcomes in prior models and should be addressed in future work. Third, the study analysis only included inpatient episodes occurring after hospitalization. While the majority of surgical volume occurs in the inpatient setting, future work should assess episodes occurring in hospital outpatient settings, given that TEAM will also include hospital-based outpatient episodes for spinal fusion and lower extremity joint replacement.
Conclusion
Markets selected for TEAM were similar to others across the country, whereas hospitals selected for the program differed from other hospitals in a number of respects. These results underscore the ability for TEAM to expand the scope of mandatory payment models and generate findings that can generalize to other markets around the United States, as well as the benefit of evaluating the model by conducting market-level rather than hospital-level evaluations. Within strategies used in TEAM to facilitate safety-net hospital participation, policymakers should also monitor for unintentional consequences or disproportionate penalties affecting these participants.
Authors’ Contributions
J.M.L.: Conceptualization, funding acquisition, investigation, methodology, supervision, validation, and writing—original draft (lead) and review and editing. Y.T.: Investigation, methodology, and writing—original draft and review and editing. D.S.B.: Investigation, project administration, and writing—original draft and review and editing. I.J.C.: Investigation and writing—original draft. A.A.: Investigation and writing—original draft. J.R.C.: Investigation, writing—original draft and review and editing. A.P.C.: Investigation and writing—review and editing. V.L.: Investigation and writing—review and editing. A.S.K.: Conceptualization, investigation, and writing—original draft and review and editing. A.S.N.: Conceptualization, funding acquisition, investigation, methodology, supervision, validation, and writing—original draft and review and editing.
Footnotes
Author Disclosure Statement
J.M.L. reported receiving grants from the Donaghue Foundation and personal fees from the Medicare Payment Advisory Commission, outside the submitted work. A.S.N. reports grants from the Hawaii Medical Service Association, the Commonwealth Fund, the Robert Wood Johnson Foundation, the Donaghue Foundation, the Veterans Affairs Administration, Arnold Ventures, and Humana, personal fees from Navvis Healthcare, the Elsevier Press, the Medicare Payment Advisory Commission, the Analysis Group, and Catholic Health Services Long Island, equity from Clarify Health and Otter Health, and personal fees and board membership for The SCAN Group and for the Hawaii Medical Service Association, outside the submitted work in the past 3 years.
Funding Information
This work was funded by awards from the