
Abstract
Background:
We estimated European ancestry in U.S. Hispanics using HFE p.C282Y (c.845G > A; rs1800562), a highly informative autosomal marker of European ancestry.
Methods:
We tabulated published p.C282Y allele frequencies in U.S. Hispanic control/population region/city cohorts. We assumed that Hispanics inherited p.C282Y from European ancestors only. We defined European ancestry (M) of each cohort as the quotient of its published p.C282Y frequency by the published aggregate p.C282Y frequency in Iberian Spaniards. We compared the present average region/city values of M and the aggregate M with previous European ancestries of U.S. Hispanics estimated using multiple ancestry-informative markers (AIMs).
Results:
There were 14,472 Hispanics (nine region/city cohorts; aggregate p.C282Y frequency 0.0176 [509/28,944] [95% confidence interval: 0.0159, 0.0189]). There were 12,297 Spaniards (34 population/control cohorts; aggregate p.C282Y frequency 0.0291 (716/24,594) [0.0271, 0.0313]). Nine region/city estimates of M differed 2.6-fold: Alabama 1.0000, California/Irvine 0.5395, California/Oakland 0.6186; California/San Diego 0.9381; Connecticut 0.6873; District of Columbia 0.3883; Hawaii 0.6976; New York 0.4330; and Oregon 1.0000. The average of these nine region/city estimates of M was 0.7003. The aggregate estimate of M in the present 14,472 Hispanics was 0.6048 [0.5369, 0.6728]. The range of estimated European ancestries in 29,365 Hispanics in eight previous studies that used multiple AIMs was 0.502–0.683.
Conclusions:
European ancestry in U.S. Hispanics estimated using p.C282Y frequencies varies across regions/cities. The average nine region/city and aggregate European ancestry estimates in the present U.S. Hispanics are similar to those in eight previous studies that used multiple AIMs.
Introduction
HFE, the homeostatic iron regulator (chromosome 6p22.2) and a nonclassical class I major histocompatibility gene, encodes HFE, a modulator of iron absorption and export (Feder et al., 1996; Girelli et al., 2022). HFE p.C282Y (c.845G > A; rs1800562) probably originated in Central Europe ca. 4000 BCE linked to the human leukocyte antigen (HLA)-A*03 and -B*07 loci (Distante et al., 2004; Raha-Chowdhury and Gruen, 2000) and is common in modern people of European descent (Merryweather-Clarke et al., 1997). There is a decreasing north-to-south gradient of p.C282Y allele frequencies from Ireland (0.1000) to Italy (0.0169) (Merryweather-Clarke et al., 1997; Milman and Pedersen, 2003). p.C282Y homozygosity is the most common genotype detected in people of European descent diagnosed with hemochromatosis (Feder et al., 1996; Girelli et al., 2022).
HFE p.C282Y does not occur in Indigenous American (Agostinho et al., 1999; Merryweather-Clarke et al., 1997), Indigenous sub-Saharan African (Gangaidzo et al., 1999; Jeffery et al., 1999), Indigenous Asian (Lee et al., 2000; Sohda et al., 1999), or mixed (Bittencourt et al., 2002) populations in the absence of European ancestry or linkage of p.C282Y to the hemochromatosis ancestral haplotype marker HLA-A*03 or other European HLA-A and -B haplotypes (Bittencourt et al., 2002; Cullen et al., 1998). Thus, p.C282Y is a moderately common, highly informative autosomal marker of European ancestry.
U.S. Hispanics in a large study had an average of 65.1% European, 18.0% Indigenous American, and 6.2% African ancestry (Bryc et al., 2015). “Iberian ancestry composes as much as a third [of the European ancestry of U.S. Hispanics] probably reflecting either early Spanish influence and rule in these regions or recent immigration from Latin America” (Bryc et al., 2015). The strong association of HFE p.C282Y with European ancestry (Feder et al., 1996; Merryweather-Clarke et al., 1997; Steinberg et al., 2001), the availability of a p.C282Y allele frequency estimate in Iberian Spaniards (Barton et al., 2026a), and the higher proportion of inferred Iberian ancestry in U.S. Hispanics than the proportion of European-American and African-American ancestry (Bryc et al., 2015) suggested that p.C282Y would be an informative single marker for estimating European ancestry in U.S. Hispanic cohorts with published p.C282Y genotypes.
The aims of this study were (1) to compute the average and aggregate European ancestry estimates (M) (Reed, 1969) of 14,472 U.S. Hispanics (nine control/population cohorts) using the published aggregate p.C282Y allele frequency of 12,297 Spaniards (34 cohorts) and (2) to compare the present average and aggregate European ancestry percentages of U.S. Hispanics with the previous European ancestry percentages in U.S. Hispanic cohorts estimated using multiple ancestry-informative markers (AIMs). We discuss the present and previous European ancestry estimates in U.S. Hispanics, the historical accounts of the immigration of Spaniards to the Americas, the use of p.C282Y to estimate European ancestry, and the prevalence and penetrance of p.C282Y homozygosity in U.S. Hispanics and non-Hispanic whites.
Methods
Ethical considerations
This study was performed according to the principles of the Declaration of Helsinki (World Medical Association, 2013). This study did not require institutional review board approval because the reports we identified were published previously and are publicly available, the data contain no personally identifiable information, and tabulation of the data does not permit reidentification of individuals (National Archives and Records Administration, 2025).
Consent to participate
Informed consent was not obtained because this study was based entirely on the discovery, review, tabulation, and analyses of data that are publicly available and cannot be linked to individuals (National Archives and Records Administration, 2025).
Definition of U.S. Hispanics
We used the 2024 U.S. federal definition of Hispanics (or Latinos): “individuals of Mexican, Puerto Rican, Salvadoran, Cuban, Dominican, Guatemalan, and other Central or South American or Spanish culture or origin” (Office of Management and Budget, 2024). We interpreted “Mexican Americans” and “Chicanos” as equivalents of the present term “U.S. Hispanics.”
Definitions of Spaniards and Indigenous Americans, Africans, and Asians
We defined Spaniards as the inhabitants and natives of Spanish Iberia. We defined Indigenous Americans as the original inhabitants of North, Central, and South America. We defined Indigenous Africans as the natives of broad contiguous areas of sub-Saharan West Africa from which enslaved people were transported to the Americas, including the region of the United States. We defined Indigenous Asians as people with ancestry or origins in the Far East, Southeast Asia, or the Indian subcontinent.
Identifying U.S. Hispanic cohorts
We performed computerized and manual literature searches to identify reports of control/population cohorts identified as Hispanics according to the U.S. federal definition (Office of Management and Budget, 2024) that had undergone HFE p.C282Y genotyping. We also identified reports of European ancestry in Hispanic cohorts estimated using multiple AIMs.
Evaluable U.S. Hispanic cohorts
We defined evaluable Hispanic cohorts that had undergone HFE genotyping as those with (1) 50 or more participants (Hale et al., 2012), (2) geographic site of recruitment, and (3) participant characteristics. The Hispanic cohorts that had undergone European ancestry estimates previously met the same criteria. This study includes all evaluable cohorts we identified.
Aggregate HFE p.C282Y allele frequency in Spanish cohorts
We used the aggregate HFE p.C282Y allele frequency in 34 population/control cohorts (12,297 subjects) from 11 of the 15 autonomous communities of mainland Spain (Aragon, Asturias, Basque Country, Cantabria, Castile-La Mancha, Catalonia, Extremadura, Galicia, Madrid, Murcia, and Valencia) as described elsewhere (Barton et al., 2026a).
HFE p.C282Y in Indigenous Americans, Africans, and Asians
HFE p.C282Y is rare or absent in Indigenous Americans (Agostinho et al., 1999; Leone et al., 2005; Merryweather-Clarke et al., 1997; Wohllk et al., 2003), Indigenous sub-Saharan Africans (Gangaidzo et al., 1999; Jeffery et al., 1999), and Indigenous Asians (Lee et al., 2000; Lin et al., 2007; Sohda et al., 1999). Thus, we defined that the ancestry informativeness of p.C282Y (δ) for comparisons of European with these three non-European populations is ∼1.0 (Via et al., 2009) and that the occurrence of p.C282Y in U.S. Hispanics is a consequence of European ancestry (Bittencourt et al., 2002; Cullen et al., 1998; Merryweather-Clarke et al., 1997).
Statistics
All data are displayed in the text, the Supplementary Data (Barton et al., 2026b), or the corresponding references. Proportions were compared using the chi-square test (two-tailed) or Fisher’s exact test (two-tailed). We displayed proportions with 95% confidence intervals (CIs). We determined whether the numbers of subjects with HFE p.C282Y genotypes deviated from Hardy–Weinberg equilibrium (HWE) proportions. Because eight of the nine Hispanic region/city cohorts (88.9%) had fewer than five subjects with p.C282Y homozygosity, we used HWE exact tests with mid-p adjustments (Chang, 2025). We performed 36 pairwise chi-square comparisons of HFE p.C282Y allele frequencies of Hispanics in nine region/city cohorts to detect significant differences defined as p < 0.0014 (p < 0.05/36) to control the risk of false positives in this sequence of multiple comparisons (Armstrong, 2014). We used a Pearson’s correlation and a linear regression t-test to determine the relationships of European ancestry percentages and numbers of AIMs.
For the calculations of M and the standard error (SE) of M, we defined these quantities:
fH = p.C282Y allele frequency in U.S. Hispanics; fS = p.C282Y allele frequency in Spaniards; nH = total number of alleles in U.S. Hispanics; nS = total number of alleles in Spaniards; and M = fH/fS.
We calculated the SE(M) as
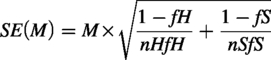
The 95% CI of M was computed as M ± (1.96 × SE). By definition, the upper one-sided 95% CI of M is 1.0000. Because the upper limits of two-sided 95% CIs exceeded unity for two of the present region/city estimates of M, we computed those lower one-sided 95% confidence limits as (1.0000 – [1.64 × SE]) (Barton et al., 2022).
We used Excel® 2021 (Microsoft Corp., Redmond, WA, USA) and GraphPad Prism 8® (2018; GraphPad Software, San Diego, CA, USA) and defined p < 0.05 as significant except as above.
Results
Nine region/city U.S. Hispanic cohorts
There were 14,472 Hispanics (100–8712 subjects per cohort). Eight cohorts were recruited in the contiguous 48 states, including three cohorts in different regions/cities of California. The ninth cohort was recruited in Hawaii (Supplementary Table S1; Barton et al., 2026b).
There was a 4.5-fold difference in HFE p.C282Y allele frequencies across the nine cohorts (range 0.0113–0.0508). The aggregate p.C282Y allele frequency in the nine cohorts was 0.0176 [0.0159, 0.0189] (Supplementary Table S2; Barton et al., 2026b). The aggregate p.C282Y allele frequency of the nine cohorts did not differ significantly from that of a previous U.S. cross-sectional population-based cohort (1555 Hispanics; p.C282Y frequency 0.0158 [0.0120, 0.0208]) (Steinberg et al., 2001) (509/29,484 vs. 49/3110, respectively; p = 0.5375).
The HFE p.C282Y allele frequency in Hispanics in each of the nine region/city cohorts (Supplementary Table S1) was significantly lower than that of the corresponding self-reported non-Hispanic whites/Caucasians recruited simultaneously in the same regions/cities (Supplementary Table S2; Barton et al., 2026b). The aggregate p.C282Y allele frequency of the present Hispanic cohorts was 26.6% of the aggregate p.C282Y allele frequency of the corresponding non-Hispanic white/Caucasian cohorts (0.0173 vs. 0.0651, respectively; p < 0.0001) (Supplementary Tables S1and S2; Barton et al., 2026b).
Comparisons of HFE p.C282Y allele frequencies across nine regions/cities
Pairwise chi-square comparisons of HFE p.C282Y allele frequencies between cohorts from nine regions/cities (Supplementary Table S1; Barton et al., 2026b) identified these significant differences: (1) Alabama > California/Irvine, California/Oakland, District of Columbia, and New York; (2) Oregon > California/Irvine, California/Oakland, District of Columbia, and New York; and (3) California/San Diego > California/Irvine and District of Columbia.
Hardy–Weinberg proportions
HFE p.C282Y genotypes of two cohorts recruited in Southern California (Irvine and San Diego) were not consistent with HWE proportions (Supplementary Table S3; Barton et al., 2026b).
HFE p.C282Y homozygotes
The aggregate prevalence of HFE p.C282Y homozygotes in 14,472 Hispanics was 0.0008 [0.0005, 0.0014] (Supplementary Table S3), whereas the aggregate prevalence of p.C282Y homozygotes in 41,604 non-Hispanic U.S. whites was 0.0081 (0.0073, 0.0090) (Acton et al., 2006; Beutler et al., 2000; Hoppe et al., 2006; Marshall et al., 1999; Phatak et al., 2002).
European ancestry estimates (M) in nine U.S. Hispanic region/city cohorts
The present control/population region/city estimates of M differed 2.6-fold. Estimates were lowest in the District of Columbia and New York and highest in Alabama and Oregon. The average of these nine European ancestry estimates was 0.7003. The aggregate M of the nine region/city cohorts was 0.6048 (Table 1).
European Ancestry Estimates (M) in U.S. Hispanic Control/Population Cohorts
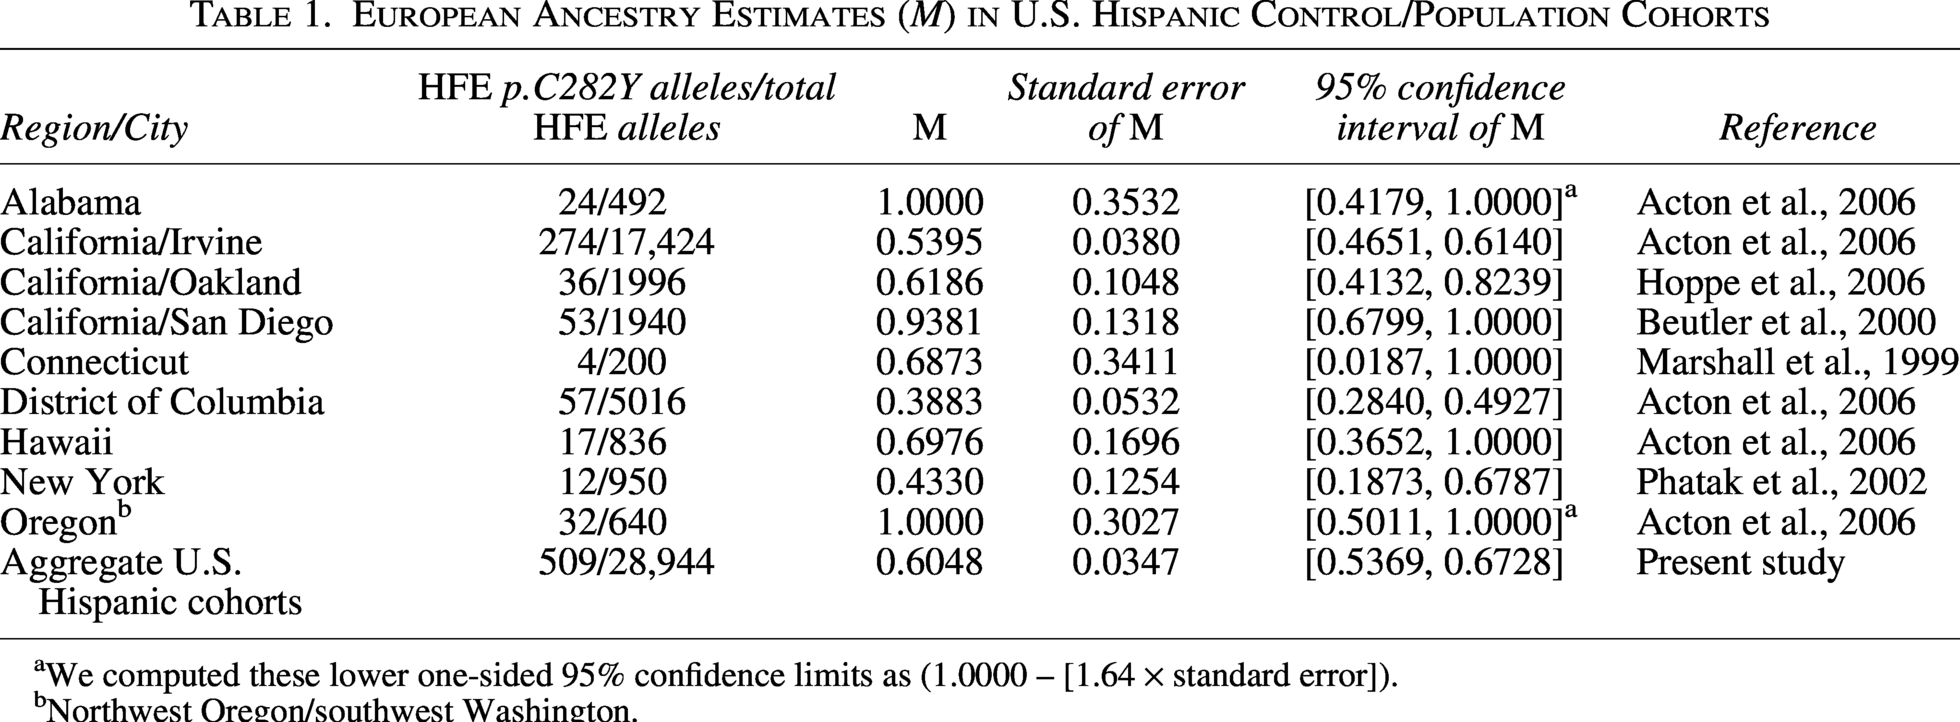
We computed these lower one-sided 95% confidence limits as (1.0000 – [1.64 × standard error]).
Northwest Oregon/southwest Washington.
Estimates of European ancestry in U.S. Hispanics
The aggregate estimate percentage from nine regions/cities was 60.5%, whereas the aggregate estimate percentages from two previous reports that comprised Hispanics from four or more regions/cities were 55.4% and 65.1% (average 60.3%) (Table 2). The range of estimate percentages from six previous Hispanic cohorts recruited in single regions/cities and evaluated with multiple AIMs was 44.9%–68.3% (average 57.0%), a 1.5-fold difference (Table 2).
Percentage Estimates of European Ancestry in U.S. Hispanics
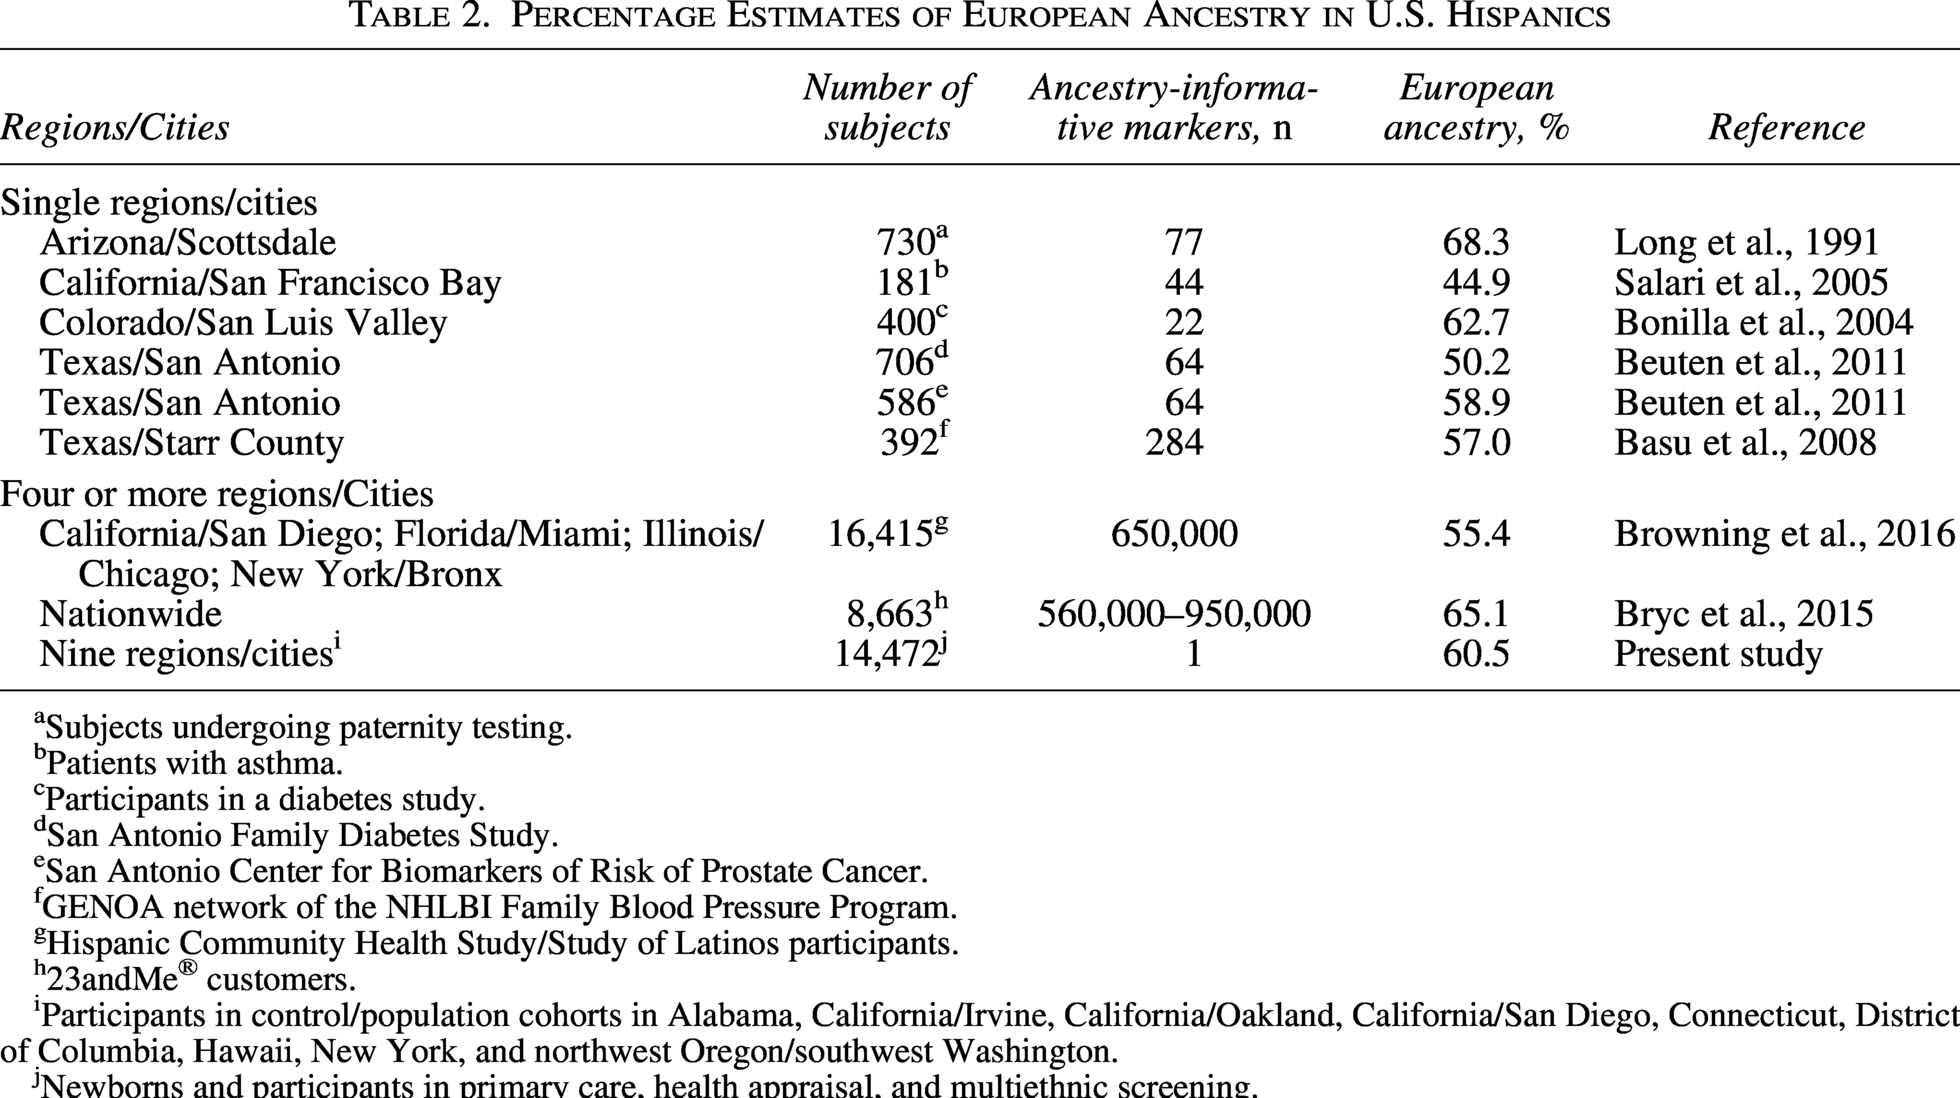
Subjects undergoing paternity testing.
Patients with asthma.
Participants in a diabetes study.
San Antonio Family Diabetes Study.
San Antonio Center for Biomarkers of Risk of Prostate Cancer.
GENOA network of the NHLBI Family Blood Pressure Program.
Hispanic Community Health Study/Study of Latinos participants.
23andMe® customers.
Participants in control/population cohorts in Alabama, California/Irvine, California/Oakland, California/San Diego, Connecticut, District of Columbia, Hawaii, New York, and northwest Oregon/southwest Washington.
Newborns and participants in primary care, health appraisal, and multiethnic screening.
The correlation of percentages of European ancestry in Hispanic cohorts (Table 2) by log10(numbers of AIMs) was not significant (r9 = 0.1084; p = 0.7813, two-tailed) (Barton et al., 2026b). The slope of the regression line of percentage of European ancestry in Hispanic cohorts (Table 2) by log10(numbers of AIMs) did not differ significantly from zero (Barton et al., 2026b). Together, the present region/city cohort and aggregate European ancestry estimates in Hispanics are consistent with those of previous studies that used multiple AIMs (Table 2).
Discussion
The present European ancestry estimates in U.S. Hispanics provide insights into their collective geographic origin and prevalence of HFE p.C282Y, a hemochromatosis-associated allele of European origin. A novel finding of this study is that the aggregate European ancestry percentage of U.S. Hispanics estimated using HFE p.C282Y allele frequencies alone (60.5%) is consistent with the aggregate European ancestry percentages of U.S. Hispanics (55.4%, 65.1%) in previous studies of four or more regions/cities that were estimated using 560,000 or more AIMs, including markers on autosomes, X and Y chromosomes, and mitochondrial DNA (Browning et al., 2016; Bryc et al., 2015). Other previous percentage estimates of European ancestry of U.S. Hispanic cohorts from a single or a few regions/cities that used 22–284 AIMs were 44.9%–68.3% (Basu et al., 2008; Beuten et al., 2011; Bonilla et al., 2004; Long et al., 1991; Salari et al., 2005). Thus, the present results confirm and extend the use of HFE p.C282Y as a highly informative autosomal marker of European ancestry (Acton et al., 2020).
An expected finding of this study is that European ancestry in U.S. Hispanic cohorts varies across regions/cities. This is consistent with the collective observations from European ancestry studies of single U.S. Hispanic cohorts (Basu et al., 2008; Beuten et al., 2011; Bonilla et al., 2004; Long et al., 1991; Salari et al., 2005), the conclusions of a nationwide ancestry study of self-reported Hispanic 23andMe® customers (Bryc et al., 2015), and the analyses of U.S. Census data (Guzmán, 2021; Jones et al., 2021). The present European ancestry estimates for Hispanics in California, Connecticut, New York, and Oregon are consistent with those previously reported for these states (Bryc et al., 2015). The present study reports the first European ancestry estimates for Hispanics in Alabama and Hawaii. The proportional European ancestry in U.S. Hispanics in different regions/cities varies inversely with their proportional Indigenous American and Indigenous African ancestries (Bryc et al., 2015).
Factors that may have contributed to the present high European ancestry estimates of Alabama and Oregon Hispanics include the relatively small Alabama and Oregon Hispanic cohorts, inadvertent sampling bias due to recruitment strategies, and differences in the HFE p.C282Y allele frequencies between the Spanish ancestors of the present Hispanics and the present aggregate Spanish cohort.
HFE p.C282Y genotypes did not meet HWE proportions in two Southern California cohorts. We postulate that gene flow/migration (Guzmán, 2021) and sampling bias (Namipashaki et al., 2015) contributed to these deviations. Natural selection, genetic drift, mutation, and nonrandom mating could have also contributed to these deviations (Andrews, 2010). Erroneous p.C282Y genotyping is an unlikely cause of HWE deviations (Press et al., 2016).
Spanish colonization of the Americas, ruled by the Crown (Konetzke, 2025), began on 6 December 1492 when Christopher Columbus and 90 men arrived at the Caribbean island now known as Hispaniola. On 16 January 1493, Columbus sailed for Spain, leaving 39 men on Hispaniola to establish a Spanish colony named La Navidad (Mörner, 1967). Hernando de Soto and his men explored the area of the present southeastern United States (Florida, GA, the Carolinas, TN, AL, MS, and Arkansas) from 1539 to 1543 (Blanton, 2020). In 1565, Spaniards were the first Europeans to establish a continuous settlement in a region that is now within the United States (St. Augustine, FL) (Lyon, 1983).
During the period 1493–1600, 54,881 Spaniards emigrated to the Americas, of whom 82.9% came from these regions of the Iberian Peninsula: Andalusia, Extremadura, New Castile, and Old Castile (Boyd-Bowman, 1976). In the 16th century, ∼250,000 Spaniards emigrated to the Americas (Masis, 1995). The ruling Spanish house of Borbón (1700–1808, 1813–1868) encouraged overseas settlement (Masis, 1995). During the period 1493–1832, ∼1.86 million Spaniards settled in the Americas (Masis, 1995). These historical observations are consistent with the postulate that the mixture of Indigenous American and European populations began about 12 generations ago (Bryc et al., 2015).
The present estimated prevalence of HFE p.C282Y homozygotes in 14,472 U.S. Hispanics was 0.0008, only 11.0% of the estimated p.C282Y homozygote prevalence in 41,604 U.S. non-Hispanic whites. The penetrance of iron overload-related disease in non-Hispanic white p.C282Y homozygotes is low (28.4% in men, 1.2% in women) (Allen et al., 2008). In p.C282Y heterozygotes in a large North American primary care-based screening program, serum ferritin was elevated in 23% of men and 10% of women (Adams et al., 2005). There are insufficient published observations in U.S. Hispanics with p.C282Y homozygosity or heterozygosity to know whether or not the risk of iron overload-related disease or elevated serum ferritin levels, respectively, differs significantly from that of U.S. non-Hispanic whites. Population screening for HFE-related hemochromatosis using either iron phenotyping or HFE mutation analysis has been studied thoroughly and is not recommended in the United States (Whitlock et al., 2006).
Limitations of estimating M (Reed, 1969) include the following: (1) The exact genetic attributes of the ancestors of the present U.S. Hispanics and Iberian Spaniards are unknown; (2) The changes in the frequencies of HFE p.C282Y in all U.S. Hispanic subpopulations since the arrival of Spaniards (and other Europeans) in the Americas are unknown; (3) The present samples of modern U.S. Hispanics and Iberian Spaniards may not fully represent the people in these broad populations; and (4) Estimating ancestry in individuals is not possible. Parental contributions to European ancestry cannot be inferred from the present estimates of M. Bryc et al. (2015) observed “13% less European ancestry [in U.S. Hispanics] on the X chromosome than genome-wide, showing proportionally greater European ancestry contributions from males.”
Some subjects in this study may have reported their ancestry according to social identity or preference, not genetic history or attributes. In the 2000 U.S. Census, nearly 48% of Hispanics identified themselves as “White” alone, and about 42% reported “Some other race” alone (United States Census Bureau, 2016). It is unknown whether the designations “Hispanic,” “Mexican American,” or “Latino” include people who also identify themselves as Spaniards, Spanish, or Spanish Americans.
We could not evaluate European ancestry over time in the same regions/cities because the present data represented cross-sectional samples, although the geographic distributions and numerical populations of Hispanics in the United States have changed greatly in 50 years (Pew Research Center, 2022; United States Census Bureau, 2024). It was beyond the scope of the present study to estimate Indigenous American or African ancestries, to explore the clinical significance of HFE p.C282Y homozygosity of the present U.S. Hispanic cohorts, or to evaluate HFE alleles other than p.C282Y.
Conclusions
We conclude that European ancestry in U.S. Hispanics estimated using HFE p.C282Y frequencies varies across regions/cities. The average nine region/city and aggregate European ancestry estimates in U.S. Hispanics are similar to those in eight previous studies that used multiple AIMs.
Authors’ Contributions
Conceptualization: Ja.C.B. (James C. Barton); methodology: Ja.C.B., J.Cl.B. (J. Clayborn Barton), and R.T.A.; validation: Ja.C.B, J.Cl.B., and R.T.A.; formal analysis: Ja.C.B., J.Cl.B., and R.T.A.; investigation: Ja.C.B, J.Cl.B., and R.T.A.; data curation: Ja.C.B, J.Cl.B., and R.T.A.; writing—original draft preparation: Ja.C.B, J.Cl.B., and R.T.A.; writing—review and editing: Ja.C.B, J.Cl.B., and R.T.A.; funding acquisition: Ja.C.B. All authors read and agreed to the published version of the article.
Supplemental Material
sj-docx-1-gtm-10.1177_19450265261464225 — Supplemental material for Estimates of European Ancestry in U.S. Hispanics Using HFE p.C282Y (c.845G>A; rs1800562), a Highly Informative Autosomal Marker
Supplemental material, sj-docx-1-gtm-10.1177_19450265261464225 for Estimates of European Ancestry in U.S. Hispanics Using HFE p.C282Y (c.845G>A; rs1800562), a Highly Informative Autosomal Marker by James C. Barton, J. Clayborn Barton, and Ronald T. Acton
Footnotes
Data Availability Statement
All data are displayed in the text, the Supplementary Data (Barton et al., ![]() ), or the corresponding references.
), or the corresponding references.
Author Disclosure Statement
The author(s) declared no potential conflicts of interest with respect to the research, authorship, and/or publication of this article.
Funding Information
This work was supported in part by
References
Supplementary Material
Please find the following supplemental material available below.
For Open Access articles published under a Creative Commons License, all supplemental material carries the same license as the article it is associated with.
For non-Open Access articles published, all supplemental material carries a non-exclusive license, and permission requests for re-use of supplemental material or any part of supplemental material shall be sent directly to the copyright owner as specified in the copyright notice associated with the article.