
Abstract
Introduction:
The effect of prolonged storage (12–19 years) on selected laboratory test results is examined in the National Health and Nutrition Examination Survey biospecimen collection to determine whether biospecimens stored long term in vapor-phase liquid nitrogen provide valid results once remeasured.
Methods:
Biospecimens were selected for remeasurement using systematic random sampling for five analytes: cotinine, methylmalonic acid (MMA), vitamin A, vitamin E, and hepatitis C virus RNA (HCV-RNA). Measurements from the original specimens in 1999–2000 or 2005–2006 are compared with 2018–2019 measurements from the same survey participants and specimens. For quantitative analytes, measurement accuracy is assessed using standard method comparison procedures, precision is evaluated by comparing to quality control standards, and reproducibility is estimated by treating data like an incurred sample reanalysis. Qualitative measures are analyzed using concordance measures and exact binomial tests.
Results:
Observed proportional differences are 3%–12% for cotinine in people who do not smoke, 11% for cotinine in people who smoke, −8% to 1% for vitamin A, 8%–9% for vitamin E, and −6% to 8% for MMA. Precision estimates are within the standards established by quality control data and generally applicable quality goals. Differences between measurements are within 20% of the average value for at least 85% of all samples. For qualitative HCV-RNA and MMA results, we observe 99% concordance between measurements.
Conclusions:
Multipronged analysis showed that most differences are within acceptable ranges based on standard laboratory criteria for assessing accuracy, precision, and reproducibility. Results suggest future measurements and subsequent statistical analyses of stored serum specimens should be valid.
Keywords
Introduction
The development of biospecimen collections, or the storage of biospecimens for future research, is a relatively new phenomenon. Increasing in popularity through the mid-1990s and 2000s, it received impetus with the sequencing of the human genome in 2001 and when a Time magazine article in 2009 identified biobanks among the top 10 ideas changing the world of health and well-being.1,2 It is also increasingly used in clinical settings, such as for cord blood allografts in children 3 or other cancer treatments. Detailed guidelines outline ethical and legal considerations, collection protocols, measurement protocols, and storage protocols.2,4 Many publications address best practices for biospecimen collection and storage, including establishing long-term biorepositories.5–9 Most emphasize the importance of proper collection and handling with storage at low temperatures (–20°C to –196°C). However, there is limited information on the effect of long-term storage (10+ years) at ultra-low temperatures of never-thawed biospecimens on laboratory assay results. Evaluating this effect is essential to understanding the viability of biospecimens stored under frozen conditions, the impact that frozen conditions have on analytes, and the utility of biospecimen programs and biorepositories for future studies.
The National Health and Nutrition Examination Survey (NHANES) has been storing biospecimens collected from consenting survey participants since 1988, and the NHANES Biospecimen Program manages these biospecimens and responds to researcher requests to use them to augment their research. 10 The objective of this article is to examine the effect of prolonged storage (12–19 years) on laboratory test results from the NHANES biospecimen collection to determine whether biospecimens stored long-term under vapor-phase liquid nitrogen storage conditions (<–80°C) provide valid remeasurements once thawed. For specific analytes, we compare original measurements (biospecimens collected in the 1999–2000 or 2005–2006 survey cycles) to post-thaw measurements (2018–2019) of the same analyte tested on the same participant’s stored biospecimens.
Since all specimens were frozen for shipment to laboratories, both measurements (original and post-thaw) were taken after biospecimens were thawed. Hereafter, the term “post-thaw measurement” refers to the 2018–2019 measurement taken after biospecimens were stored long-term under vapor-phase liquid nitrogen storage conditions.
Materials and Methods
National Health and Nutrition Examination Survey
NHANES is a cross-sectional, probability survey conducted by the National Center for Health Statistics (NCHS) to assess the health and nutritional status of the civilian noninstitutionalized U.S. population. NHANES combines personal interviews with standardized health examinations, which include biospecimen collection for laboratory testing. Between 1999 and 2018, approximately 5000 participants were examined each year, and data were released every 2 years.11–13
Biospecimens are processed and aliquoted in the field to send for laboratory testing and storage after venipuncture in NHANES. For consenting participants (including parental consent for ages 6–17 years and youth assent for ages 7–17 years), biospecimens are also aliquoted, frozen, and sent to the Centers for Disease Control and Prevention (CDC) Biorepository, where biospecimens remain cryogenically frozen until requested for use in an analytic study. The NCHS Ethics Review Board reviewed and approved the protocol for accessing NHANES biospecimens. 14
Laboratory analytes
Laboratory analytes were selected using four inclusion criteria: (1) analytes included in multiple NHANES survey cycles; (2) analytes measured in serum biospecimen aliquots stored frozen and never thawed in the CDC Biorepository; (3) no substantial changes to the analytes’ methodology or instrumentation since introduction into the survey or equivalent performance between the previous and current method; and (4) testing conducted by CDC laboratories. Five analytes meeting these criteria were selected: cotinine and methylmalonic acid (MMA) from the 1999–2000 NHANES survey cycle and vitamin A (retinol; VITA), vitamin E (alpha-tocopherol; VITE), and hepatitis C virus RNA (HCV-RNA) from the 2005–2006 NHANES survey cycle.
Pre-analytic parameters
In both the 1999–2000 and 2005–2006 NHANES survey cycles, serum biospecimens were collected using 5 mL, 7 mL, 10 mL, and/or 15 mL red top blood collection tubes depending on the participant’s age and blood collection profile. Blood was allowed to clot for 45 minutes and then centrifuged (Beckman GS-6R) at room temperature for 15 minutes at 2900 revolutions per minute. Serum was pooled together and aliquoted into multiple 2 mL Nunc cryovials using an Eppendorf repeater pipette with a 5 mL Combitip.15,16 For original measurements, the serum sample volume varied between 0.4 mL and 1.8 mL depending on the age group and analyte (cotinine, 3–11 years: 1.5 mL, ≥12 years: 2 mL; VITA and VITE [same vial], 6–11 years: 0.4 mL, ≥12 years: 0.5 mL; HCV-RNA: 0.5 mL). For post-thaw measurements (deep freeze), all serum sample volumes were 0.5 mL. Pooled serum was processed and stored within 2 hours of collection. If the serum could not be aliquoted immediately, it was refrigerated at 4°C for no more than 4 hours.
In the 1999–2000 NHANES survey cycle, plasma biospecimens for MMA were collected using 5 mL EDTA blood collection tubes. Blood was centrifuged (GS-6R, Beckman) at 4°C–8°C and 2900 revolutions per minute for 10 minutes. Using a plastic transfer pipette, 1 mL of plasma (275 µL required) was removed from the cells and aliquoted into a 2 mL Nunc cryovial. 15 Plasma was processed and stored within 30 minutes of blood draw.
All serum and plasma samples were aliquoted inside a laminar flow biological safety cabinet. Specimens were stored at the NHANES mobile examination center (field collection site) up to 7 days at −20°C or colder and then shipped on dry ice (∼−86°C) using priority overnight shipping (arriving by 10 AM the next day).15–17
At the biorepository, all serum biospecimens were kept in a −80°C freezer until accessioning. After accessioning, they were stored in vapor-phase liquid nitrogen storage tanks (MVE manufactured; models: 1830, 1841, and 1894). The storage range for NHANES pristine sera is −140°C to −196°C. Temperature and liquid nitrogen level were monitored on each controller, with audible alarms sounding if either of those values strayed outside of a prescribed range. Redundant software systems monitored unit function with email and text messages sent to on-call cryogenics staff 24 hours a day, 7 days a week. No temperature alarms or freezer failures were detected between 1999 and 2019. Any unit failures or overfill events (with a listing of affected samples) would have been communicated to the collection custodian and principal investigator. Temperatures rising above −140°C for more than a few hours would have resulted in the samples being moved to a backup unit.
There is no record of the number of times towers were removed from vapor-phase liquid nitrogen for sample distribution to other projects, potentially allowing sample temperature fluctuations to occur. However, procedures require that racks be placed into a mobile cryocart during work to keep the cold chain intact.
Analytic testing
Original serum cotinine measurements were obtained during the 1999–2000 survey cycle; frozen serum biospecimens were stored for 18–19 years, and post-thaw serum measurements were obtained in 2018. All specimens from both time periods were measured by isotope-dilution high-performance liquid chromatography (HPLC) coupled to atmospheric pressure chemical ionization tandem mass spectrometry (MS/MS) in positive ion mode using modifications of the method first published by Bernert et al.18,19 In 1999–2000, testing was performed using 1 mL serum on a Hewlett Packard model 1090L HPLC coupled to a PE-Sciex API III triple quadrupole mass spectrometer. 20 In 2018, testing was performed using 0.2 mL serum on a Shimadzu Nexera UHPLC coupled to an AB Sciex API 6500 triple quadrupole mass spectrometer. 21 The cotinine method has been maintained continuously in the same CDC laboratory since 1992. Since 1999, long-term method stability and precision have been monitored by periodically reassaying aliquots of the original 1992 quality control pools (homogenized, aliquoted into individual vials, and stored at −60°C) for three concentrations: 0.268 ng/mL, 1.88 ng/mL, and 207 ng/mL. Internal method validation studies were also conducted for instrumentation changes in 2002 and 2013. Statistically significant biases were not observed.22,23
Original plasma MMA measurements were obtained during the 1999–2000 survey cycle; frozen serum biospecimens were stored for 18–19 years, and post-thaw serum MMA measurements were obtained in 2018. In 1999–2000, MMA was measured from 0.275 mL plasma samples as dicyclohexyl ester by isotope-dilution gas chromatography with mass spectrometry (GC/MS) using a Hewlett Packard 6890 GC and 5973 MS system. 24 In 2018, MMA was measured from 0.075 mL serum samples as dibutyl ester by isotope-dilution HPLC coupled to tandem mass spectrometry (LC-MS/MS) using a Thermo Fisher Scientific Accela LC and TSQ Vantage MS system. 25 The original testing method (GC/MS) and post-thaw measurement method (LC-MS/MS) were compared (n = 326) and showed excellent correlation (Pearson r = 0.99) and no significant Bland–Altman bias (mean [95% confidence interval or CI] = 0.92 [−1.42 to 3.26] nmol/L). 26 Both methods also compared well to measurements performed by the National Institute of Standards and Technology (NIST)’s GC/MS MMA method in Standard Reference Material (SRM) 1950 (Table 1). Both methods have also been shown to produce interchangeable results (±3%) among matched serum and plasma samples.24,26
Method Performance for Vitamin A, Vitamin E, and Methylmalonic Acid Compared to the National Institute of Standards and Technology Standard Reference Material

The percent difference is from a mean measurement: VITE (n = 66, 968c and n = 51, 968e each level), VITA (n = 66, 968c and n = 51, 968e each level), MMA GC/MS (n = 11), and MMA LC-MS/MS (n = 14).
The target values were from the active NIST Certificate of Analysis relevant to the respective date of analysis range.
The target value was from NIST GC/MS method measurements (n = 15).
GC/MS method.
LC-MS/MS method.
GC/MS, gas chromatography with mass spectrometry; LC-MS/MS, high-performance liquid chromatography coupled to tandem mass spectrometry; NIST, National Institute of Standards and Technology; SRM, Standard Reference Material.
Serum VITA and VITE were originally measured during the 2005–2006 survey cycle; frozen serum biospecimens were stored for 12–14 years, and post-thaw serum measurements were obtained in 2018–2019. Both analytes at both time points were measured from 0.1 mL samples by HPLC with ultraviolet (UV) detection using a Waters Inc. 2695 Alliance LC and 2996 or 996 photodiode array detector. For these analytes, this method also compared well to measurements performed by NIST and collaborating institutions’ HPLC-UV method in SRM 968c and 968e (Table 1). 27
HCV-RNA was originally tested in 2005–2006; frozen serum biospecimens were stored for 14–15 years, and post-thaw measurements were made in 2019. Prior to HCV-RNA testing, all biospecimens had tested positive in a screening hepatitis C antibody test (2005–2006) and were measured using a direct solid-phase enzyme immunoassay with the anti-HCV screening enzyme-linked immunosorbent assay, and subsequently, screening-positive results were confirmed by recombinant immunoblot assay for antibody to hepatitis C virus. Thereafter, HCV-RNA (original and post-thaw) was tested by COBAS® TaqMan® HCV Test, v2.0—an in vitro nucleic acid amplification test for the quantitation of HCV-RNA genotypes 1 through 6 in serum. The test was performed by applying COBAS AmpliPrep Total Nucleic Acid Isolation Kit for the preparation of highly purified total nucleic acid from serum on the COBAS AmpliPrep Instrument with automated amplification and detection on the COBAS TaqMan 48 Analyzer. 28
Due to the considerable costs to repeat measures and other resource limitations (i.e., time constraints, limited staffing resources, and competing priorities), NHANES performed one measurement per person per analyte at the time of the original measurement. For consistency, we obtained one post-thaw measurement per biospecimen.
While the limits of detection for all quantitative analytes slightly decreased (cotinine 0.05 vs. 0.015 ng/mL, MMA 0.05 vs. 0.0221 µmol/L) or increased (VITA 0.70 vs. 1.0 µg/dL, VITE 28.76 vs. 40.0 µg/dL) between the time of the original and post-thaw measurements, this had no notable consequence on the detection frequency of MMA (>98%), VITA (100%), VITE (100%), or cotinine among people who smoke (100%).29,30 The detection frequency of cotinine among people who do not smoke was 53% for the original measurement at a limit of detection of 0.05 ng/mL, 84% for the post-thaw measurement at a limit of detection of 0.015, and 58% for the post-thaw measurement at a limit of 0.05.
Sampling methods
See Table 2 for final analytic sample sizes. For quantitative analytes, systematic random samples were drawn from NHANES-examined participants 6 years and older who had been tested for the analyte and provided consent to have their biospecimens stored for future research. Only biospecimens with sufficient volume for remeasurement were retained in the sample. There were special considerations for some analytes: (1) cotinine was stratified by concentration (≤10 ng/mL, >10 ng/mL) to differentiate between people who do not smoke and people who smoke and (2) one combined analytic sample was drawn for the remeasurement of VITA and VITE because the same assay was used to measure both analytes (original 2005–2006 sample sorted first by VITA quartile values: ≤39.9, 40–49.6, 49.7–62.2, ≥62.3 µg/dL, then by continuous VITE values).
Unweighted Frequencies and Percents of Each Analytic Sample by Sex, Age, and Race/Ethnicity
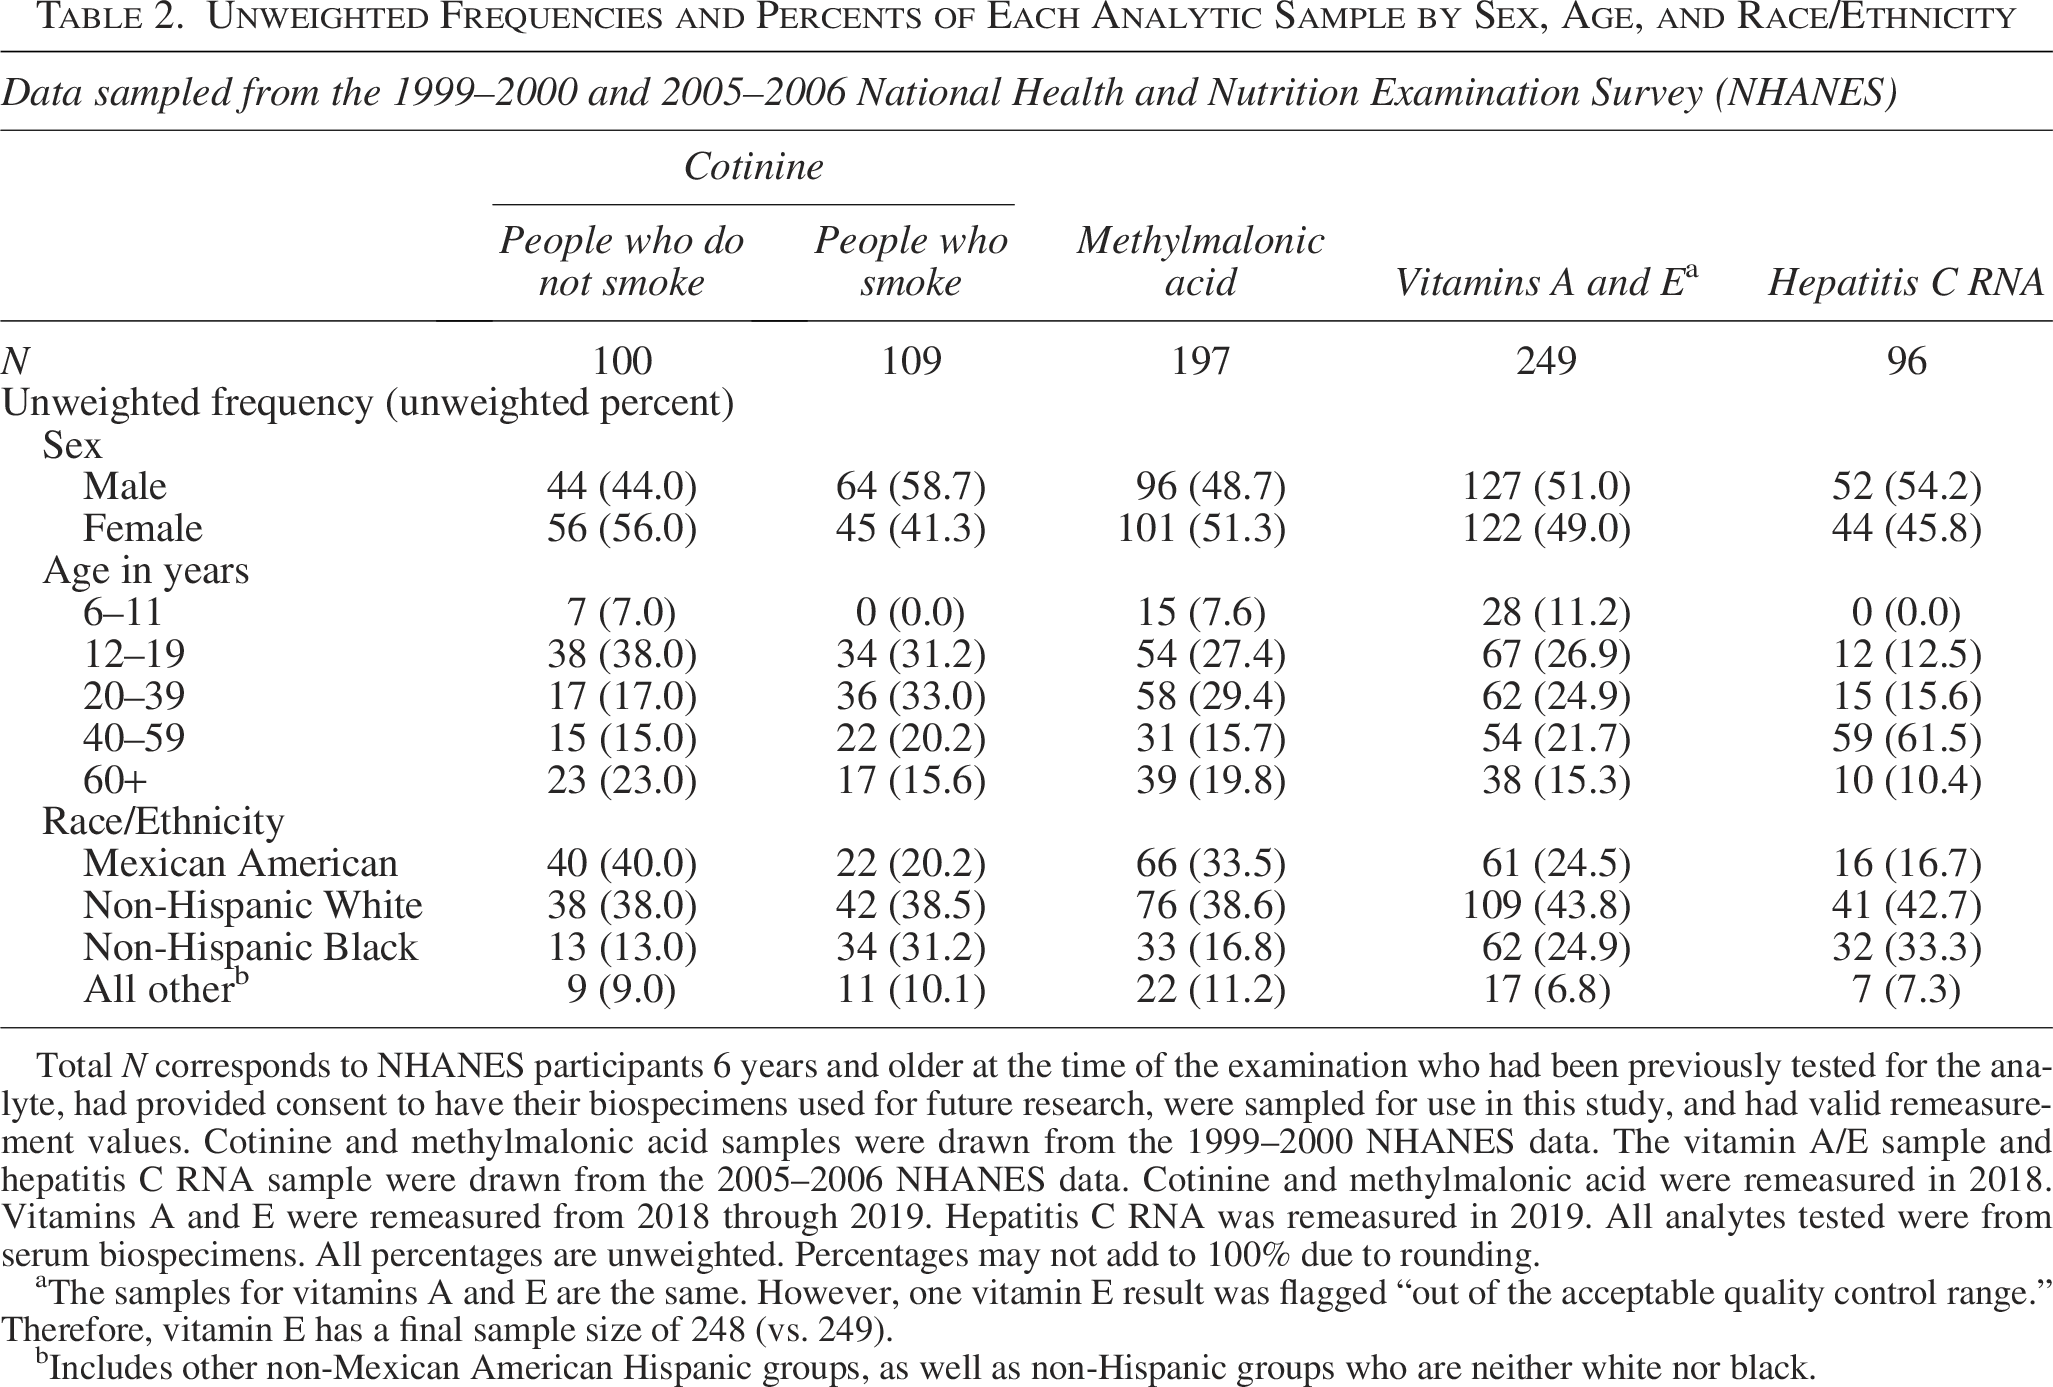
Total N corresponds to NHANES participants 6 years and older at the time of the examination who had been previously tested for the analyte, had provided consent to have their biospecimens used for future research, were sampled for use in this study, and had valid remeasurement values. Cotinine and methylmalonic acid samples were drawn from the 1999–2000 NHANES data. The vitamin A/E sample and hepatitis C RNA sample were drawn from the 2005–2006 NHANES data. Cotinine and methylmalonic acid were remeasured in 2018. Vitamins A and E were remeasured from 2018 through 2019. Hepatitis C RNA was remeasured in 2019. All analytes tested were from serum biospecimens. All percentages are unweighted. Percentages may not add to 100% due to rounding.
The samples for vitamins A and E are the same. However, one vitamin E result was flagged “out of the acceptable quality control range.” Therefore, vitamin E has a final sample size of 248 (vs. 249).
Includes other non-Mexican American Hispanic groups, as well as non-Hispanic groups who are neither white nor black.
For HCV-RNA, survey participants 12 years and older who had a positive or indeterminant assay for HCV antibodies in 2005–2006, had informed consent to store their biospecimens for future research, and had sufficient specimen volume for remeasurement were included in the analytic sample.
Data analysis
For quantitative measures, we examined (1) if prolonged storage in vapor-phase liquid nitrogen influenced the accuracy of subsequent measurements (closeness of agreement to true value), (2) whether estimated precision (closeness of agreement between replicate measurements) between original and post-thaw measurements was within acceptable limits, and (3) assay reproducibility (precision under reproducibility conditions). To assess accuracy, we evaluated differences between original and post-thaw measurements using scatterplots, percentile distributions, difference plots, t-tests, Deming regression models,31,32 and 95% limits of agreement. 33 Average percent differences and systematic proportional biases (based on regression models) ≥10% were considered substantial from a laboratory perspective.20–22,24,25,27,28 To assess precision, we compared observed precision estimates (within-subject coefficient of variation [CV] using the root-mean-squared method 34 and percentile precision 35 ) to precision standards (within-laboratory CV estimates from quality control pools and generally applicable quality goals specified for individual analytes through external quality assessments). 36 To assess assay reproducibility, we determined the proportion of individuals with a percent difference <0.20 and used 0.67 as the minimum proportion for the analyte to be considered reproducible according to the incurred sample reanalysis criterion. 37 Details and limitations for each approach are provided in the Supplementary.
Qualitative measures were assessed using concordance estimates (concordance, misclassification, precision, sensitivity, specificity) and exact binomial tests. Outcomes included HCV-RNA (positive/negative) and dichotomized MMA (≥0.4 µmol/L). MMA is often dichotomized for public health analyses to estimate the proportion of the sample with elevated values. Here, it provides a demonstration of whether observed differences in continuous values affect percent distributions when those same continuous measurements are categorized into two outcomes.
For consistency, all post-thaw measurements between the original limit of detection and the new limit of detection were set equal to the original limit of detection for analysis. Summary statistics, t-tests, 95% limits of agreement, precision estimates, and incurred sample reanalysis estimates were calculated using SAS 9.4. Difference plots and Deming regression models were built using the “mcr” package
38
in R version 3.6.1, and exact binomial tests were run using R. Point estimates and variance estimates were calculated without sample weights and without respect to the survey design since analytic subsamples are not nationally representative. Statistical tests used
Results
Unweighted frequencies and percentages for each analytic sample are presented by sex, age, and race/ethnicity in Table 2. Predictably, no participants ages 6–11 years were included in the people who smoke or HCV-RNA samples. Otherwise, all samples were distributed across demographic categories.
Unweighted percentiles, means, and geometric means (with 95% CIs) for quantitative analytes for original and post-thaw measurements are presented in Table 3. All percentile estimates based on post-thaw measurements were within 18% of estimates based on original measurements. All mean and geometric mean estimates based on post-thaw measurements were within 12% of estimates based on original measurements.
Percentile Distributions, Means (with 95% Confidence Intervals), and Geometric Means (with 95% Confidence Intervals)
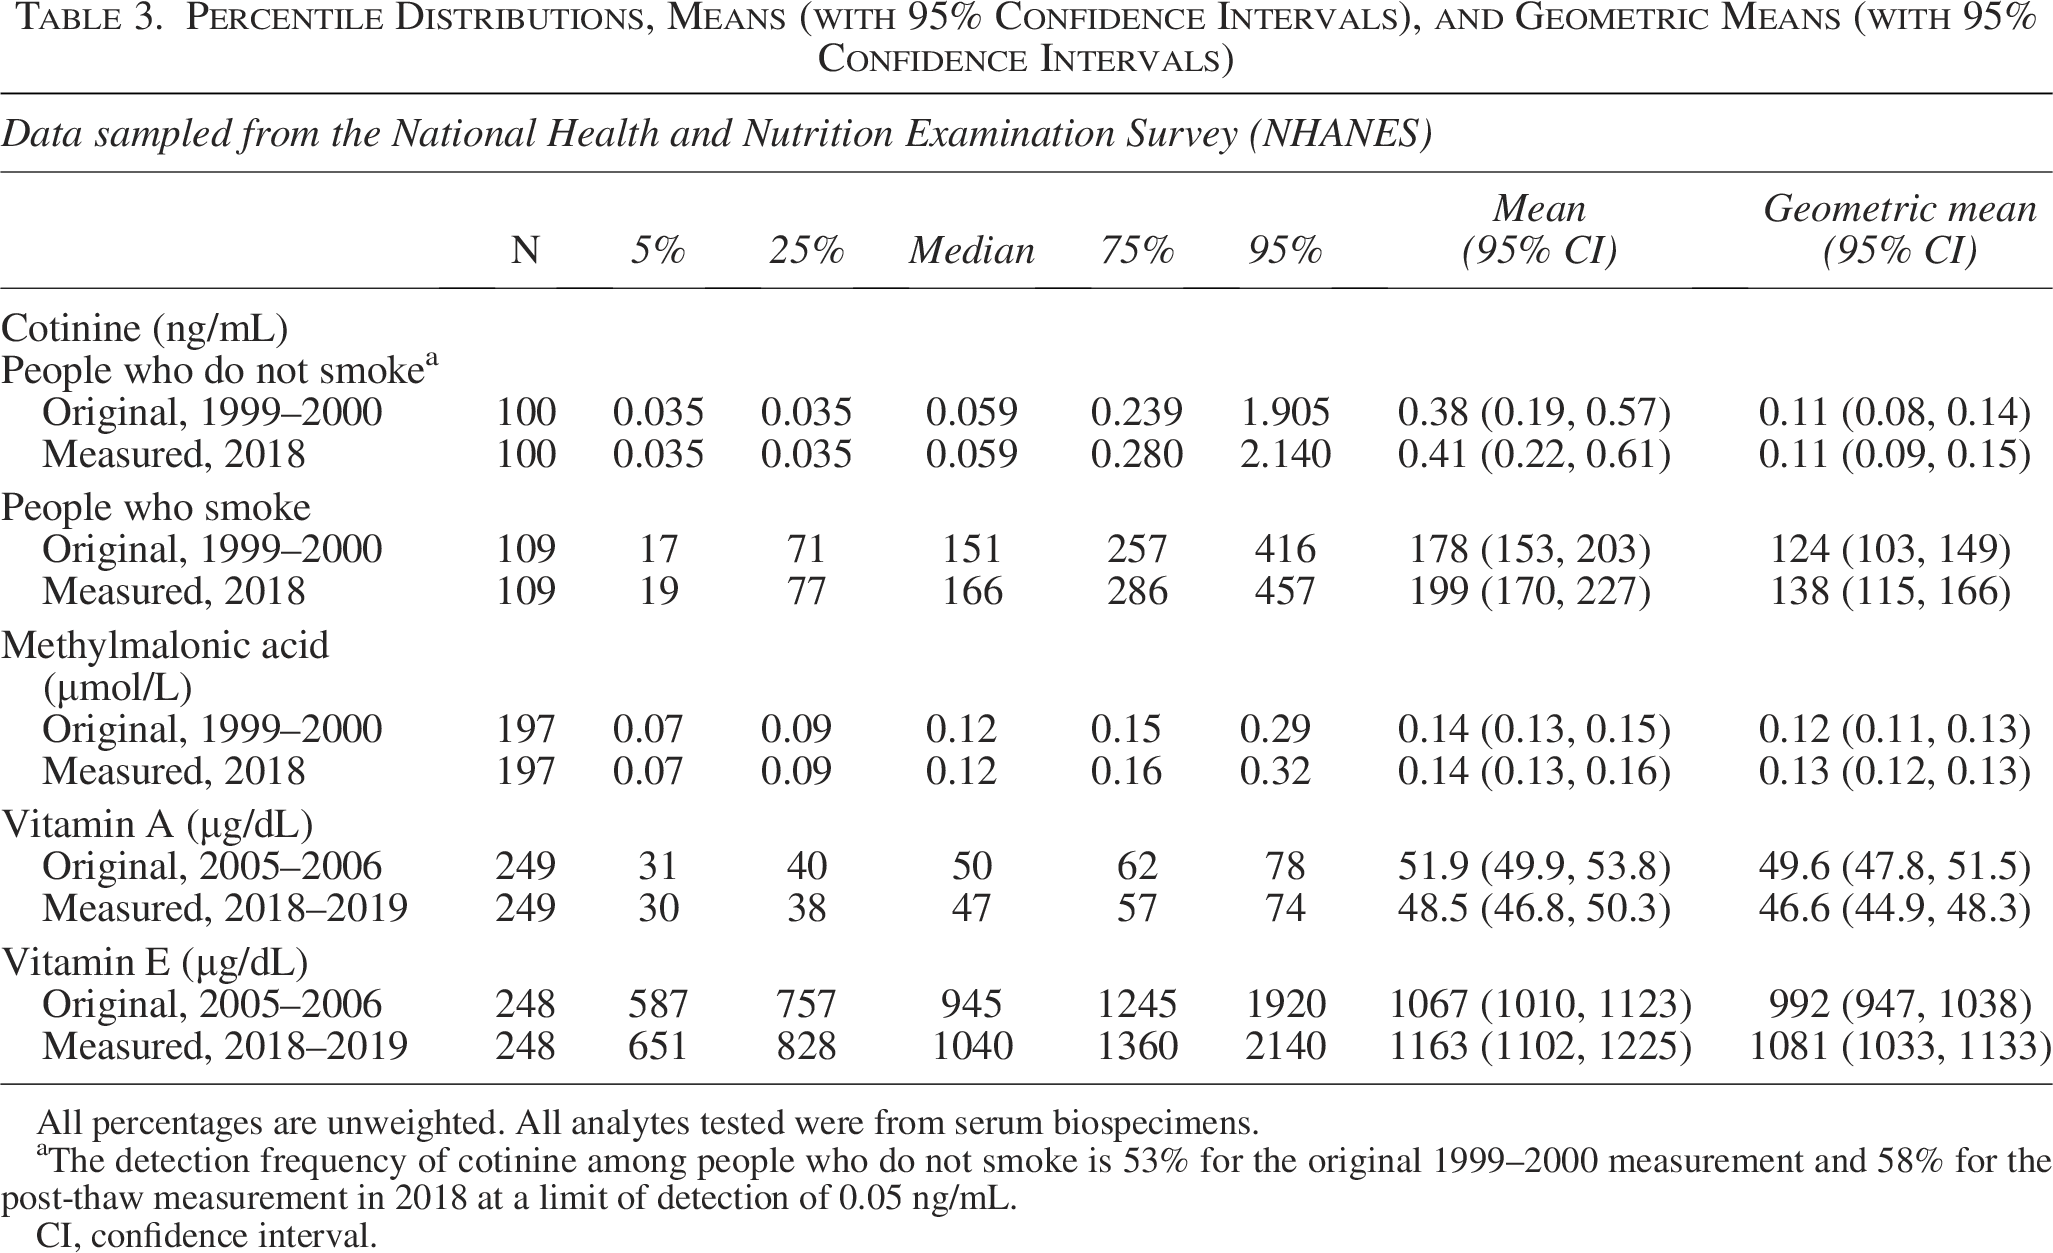
All percentages are unweighted. All analytes tested were from serum biospecimens.
The detection frequency of cotinine among people who do not smoke is 53% for the original 1999–2000 measurement and 58% for the post-thaw measurement in 2018 at a limit of detection of 0.05 ng/mL.
CI, confidence interval.
Assessing accuracy
Difference plots for quantitative analytes indicated proportional differences between original and post-thaw measurements (Fig. 1). Average percent differences between measurements and estimated 95% limits of agreement (Bland–Altman analysis) for cotinine, VITA, VITE, and MMA are presented in Table 4. One-sample t-tests testing percent differences were all statistically significant (p < 0.001). Based on the predetermined 10% accuracy threshold, average percent differences were acceptable for cotinine in people who do not smoke, VITA, VITE, and MMA. For cotinine in people who smoke, the average percent difference was over the threshold at 11%.
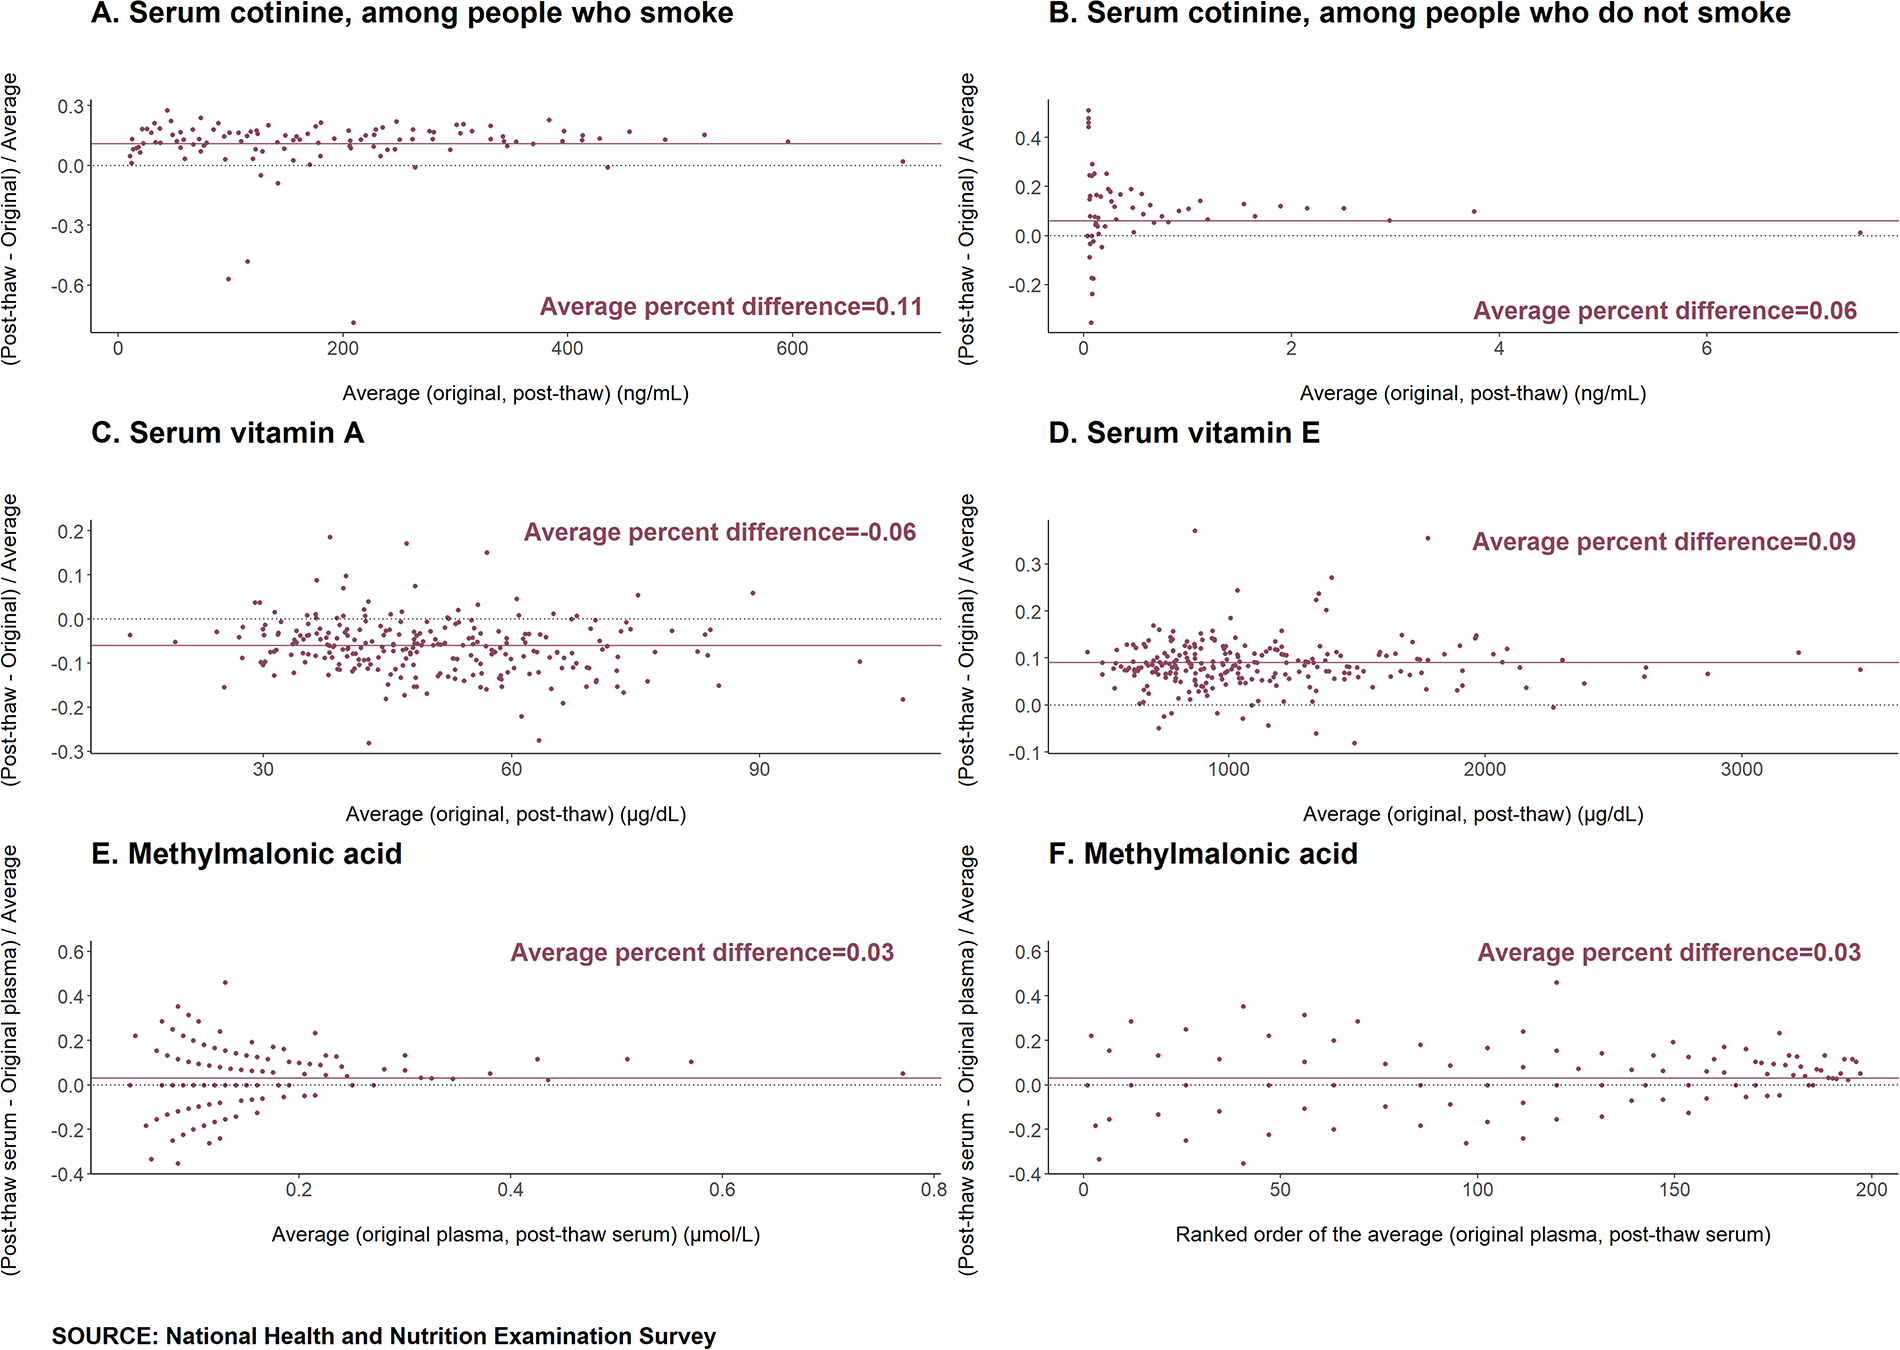
Proportional difference plots for quantitative analytes indicate proportional differences between original and post-thaw measurements. Random scatter around the average percent difference line indicates that as the average concentration between measurements increases, the percent difference stays constant, and the absolute difference increases. In (F), values on the horizontal axis are ranked from smallest to largest (1–197) to eliminate the effect of extreme observations.
Average Percent Differences (with 95% Confidence Intervals), 95% Limits of Agreement, and Incurred Sample Reanalysis Estimates for All Quantitative Analytes
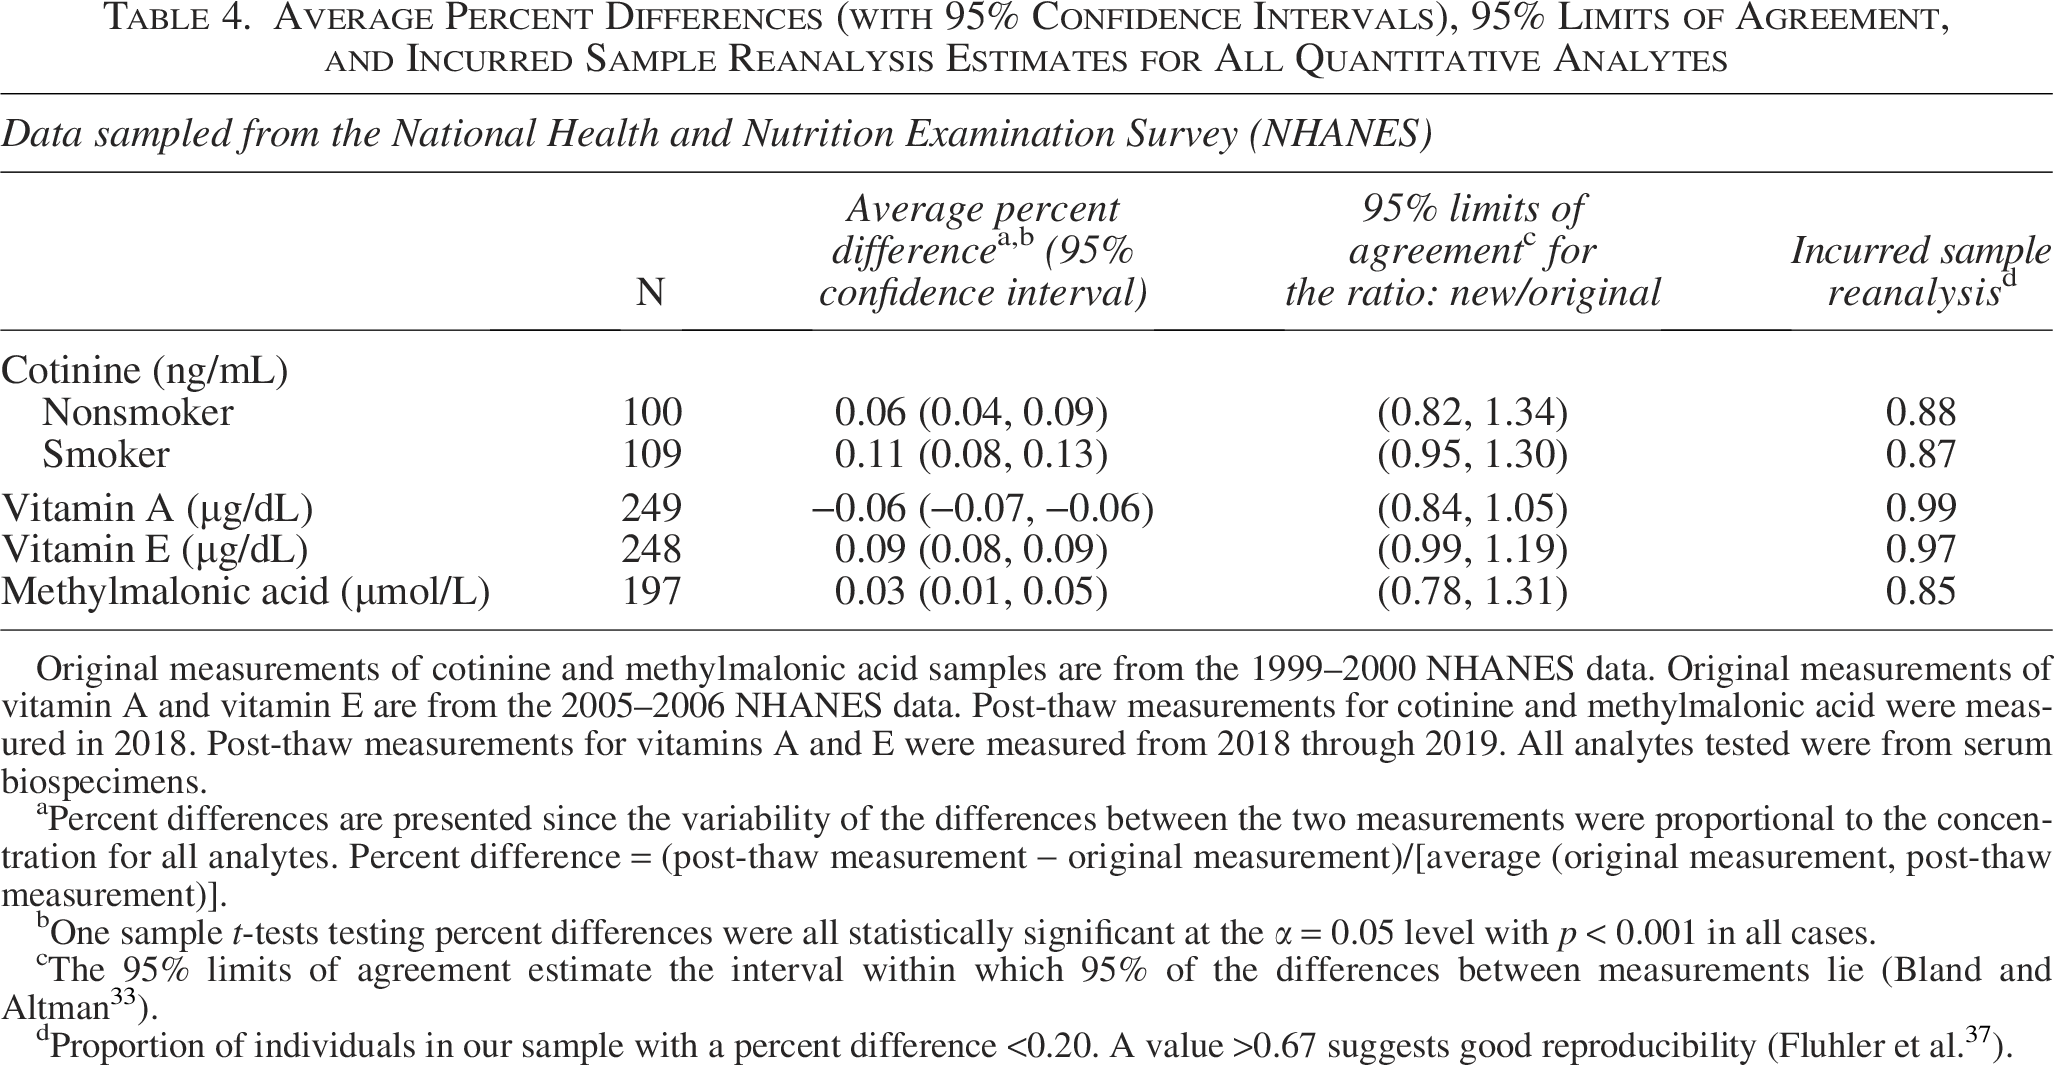
Original measurements of cotinine and methylmalonic acid samples are from the 1999–2000 NHANES data. Original measurements of vitamin A and vitamin E are from the 2005–2006 NHANES data. Post-thaw measurements for cotinine and methylmalonic acid were measured in 2018. Post-thaw measurements for vitamins A and E were measured from 2018 through 2019. All analytes tested were from serum biospecimens.
Percent differences are presented since the variability of the differences between the two measurements were proportional to the concentration for all analytes. Percent difference = (post-thaw measurement − original measurement)/[average (original measurement, post-thaw measurement)].
One sample t-tests testing percent differences were all statistically significant at the α = 0.05 level with p < 0.001 in all cases.
The 95% limits of agreement estimate the interval within which 95% of the differences between measurements lie (Bland and Altman 33 ).
Proportion of individuals in our sample with a percent difference <0.20. A value >0.67 suggests good reproducibility (Fluhler et al. 37 ).
Weighted Deming regression estimates (Table 5, Supplementary Figs. S1, S2, S3, S4, S5) also resulted in statistically significant differences between measurements. Across the range of observed original measurements, regression equations indicated systematic proportional biases of approximately 0.031–0.118 in cotinine in people who do not smoke, 0.108–0.114 in cotinine in people who smoke, −0.079 to 0.010 in VITA, 0.083–0.094 in VITE, and −0.058 to 0.076 in MMA measurements (Table 5). Proportional biases were within the 10% threshold for VITA, VITE, and MMA, while for cotinine in people who do not smoke and people who smoke, the highest proportional bias estimates were over the threshold at 11.8% and 11.4%, respectively.
Weighted Deming Regression Estimates (with 95% Confidence Intervals) and Estimates of Systematic Proportional Bias for All Quantitative Analytes

Original measurements of cotinine and methylmalonic acid samples are from the 1999–2000 NHANES data. Original measurements of vitamin A and vitamin E are from the 2005–2006 NHANES data. Post-thaw measurements for cotinine and methylmalonic acid were measured in 2018. Post-thaw measurements for vitamins A and E were measured from 2018 through 2019. All analytes tested were from serum biospecimens.
Weighted Deming regression gives each point a weight inversely proportional to the square of the concentration on the x-axis.
Based on bootstrap confidence intervals, the weighted Deming intercept and slope estimates were statistically significant for all analytes at the α = 0.05 level.

Accessing precision
Precision estimates and standards are presented in Table 6. Within-laboratory coefficient of variation (CVWL) standards presented as ranges are dependent on concentration levels. Sample pairs with a mean concentration less than or equal to three times the limit of detection were excluded from the cotinine in people who do not smoke sample (69 pairs) and the MMA sample (143 pairs).
Within-Subject Coefficient of Variation (with 95% confidence interval), Percentile Precision Estimates, Within-Laboratory Coefficient of Variation, and Analytical Precision Standards Based on Fraser’s Generally Applicable Quality Goals for Quantitative Analytes. Data sampled from the National Health and Nutrition Examination Survey (NHANES)
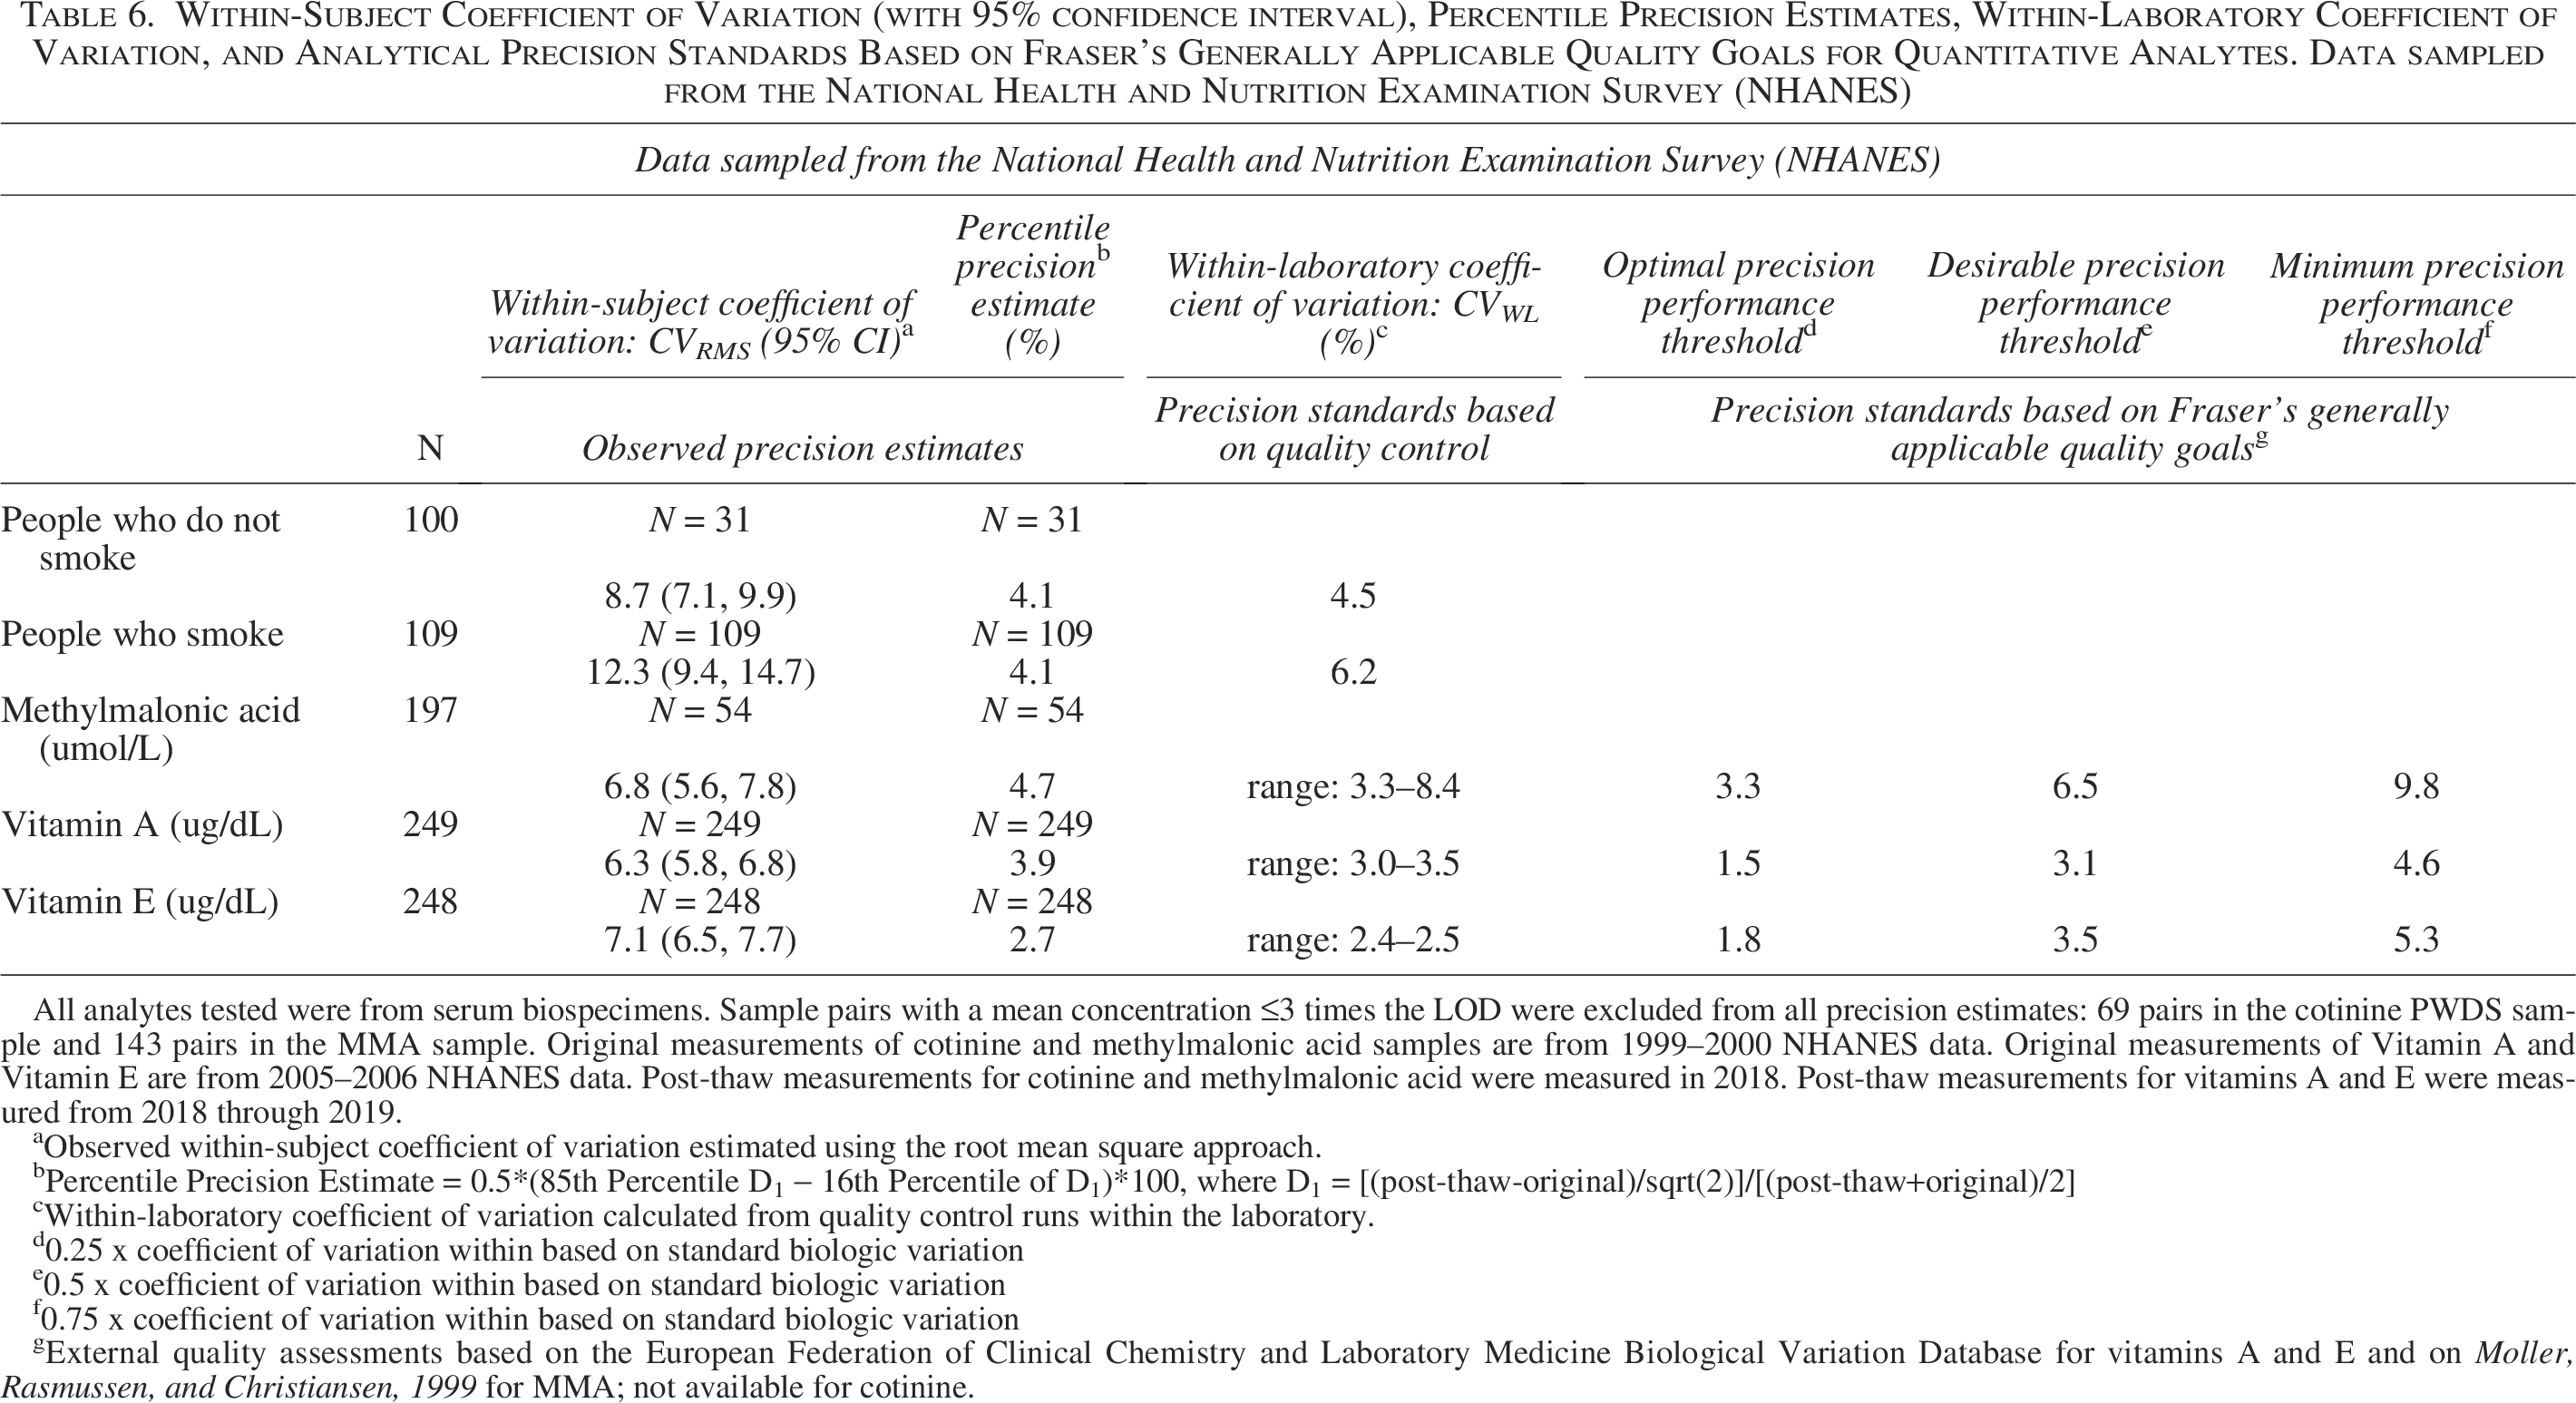
All analytes tested were from serum biospecimens. Sample pairs with a mean concentration ≤3 times the LOD were excluded from all precision estimates: 69 pairs in the cotinine PWDS sample and 143 pairs in the MMA sample. Original measurements of cotinine and methylmalonic acid samples are from 1999–2000 NHANES data. Original measurements of Vitamin A and Vitamin E are from 2005–2006 NHANES data. Post-thaw measurements for cotinine and methylmalonic acid were measured in 2018. Post-thaw measurements for vitamins A and E were measured from 2018 through 2019.
Observed within-subject coefficient of variation estimated using the root mean square approach.
Percentile Precision Estimate = 0.5*(85th Percentile D1 − 16th Percentile of D1)*100, where D1 = [(post-thaw-original)/sqrt(2)]/[(post-thaw+original)/2]
Within-laboratory coefficient of variation calculated from quality control runs within the laboratory.
0.25 x coefficient of variation within based on standard biologic variation
0.5 x coefficient of variation within based on standard biologic variation
0.75 x coefficient of variation within based on standard biologic variation
External quality assessments based on the European Federation of Clinical Chemistry and Laboratory Medicine Biological Variation Database for vitamins A and E and on Moller, Rasmussen, and Christiansen, 1999 for MMA; not available for cotinine.
Precision has an inverse scale (i.e., high precision estimates indicated by low values). Thus, precision estimates that are lower than precision standards indicate that the standard is met. In most cases, estimated within-person coefficient of variation (CVRMS) for twice measured NHANES samples did not meet the CVWL standards provided by the laboratories for quality control samples measured over at least 10 different runs. MMA was the exception. Similarly, CVRMS estimates did not meet the standards based on generally applicable quality goals with one exception: MMA CVRMS (6.8%) was lower than the minimum performance threshold (9.8%).
Percentile precision estimates performed differently. For cotinine (in people who do not smoke and people who smoke) and MMA, percentile precision estimates met the CVWL standard; VITA and VITE did not meet the CVWL standard. Compared with standards based on generally applicable quality goals, percentile precision estimates for MMA and VITE met the standard for desirable performance, and percentile precision estimates for VITA met the standard for minimum performance.
Assessing reproducibility
In the incurred sample reanalysis, the proportion of individuals with a percent difference less than 0.20 was 0.88, 0.87, 0.99, 0.97, and 0.85 for the people who do not smoke, people who smoke, VITA, VITE, and MMA samples, respectively (Table 4). All proportions were above the minimum incurred sample reanalysis criterion of 0.67.
Assessing qualitative measures
Concordance measures for positive versus negative HCV-RNA and the number of survey participants with elevated MMA values are presented in Table 7. Of 48 survey participants who tested positive for HCV-RNA in 2005–2006, only one tested negative in 2019. All 48 survey participants who tested negative in 2005–2006 also tested negative in 2019. This corresponds to 99% concordance, 1% misclassification, 100% precision, 98% sensitivity, and 100% specificity. An exact binomial test indicated no statistically significant differences between the distribution of positive and negative values observed in 1999–2000 versus 2019 (p value = 1).
Measures of Agreement Between Hepatitis C RNA and Elevated Methylmalonic Acid Measurements: Original Versus Post-Thaw Measurements
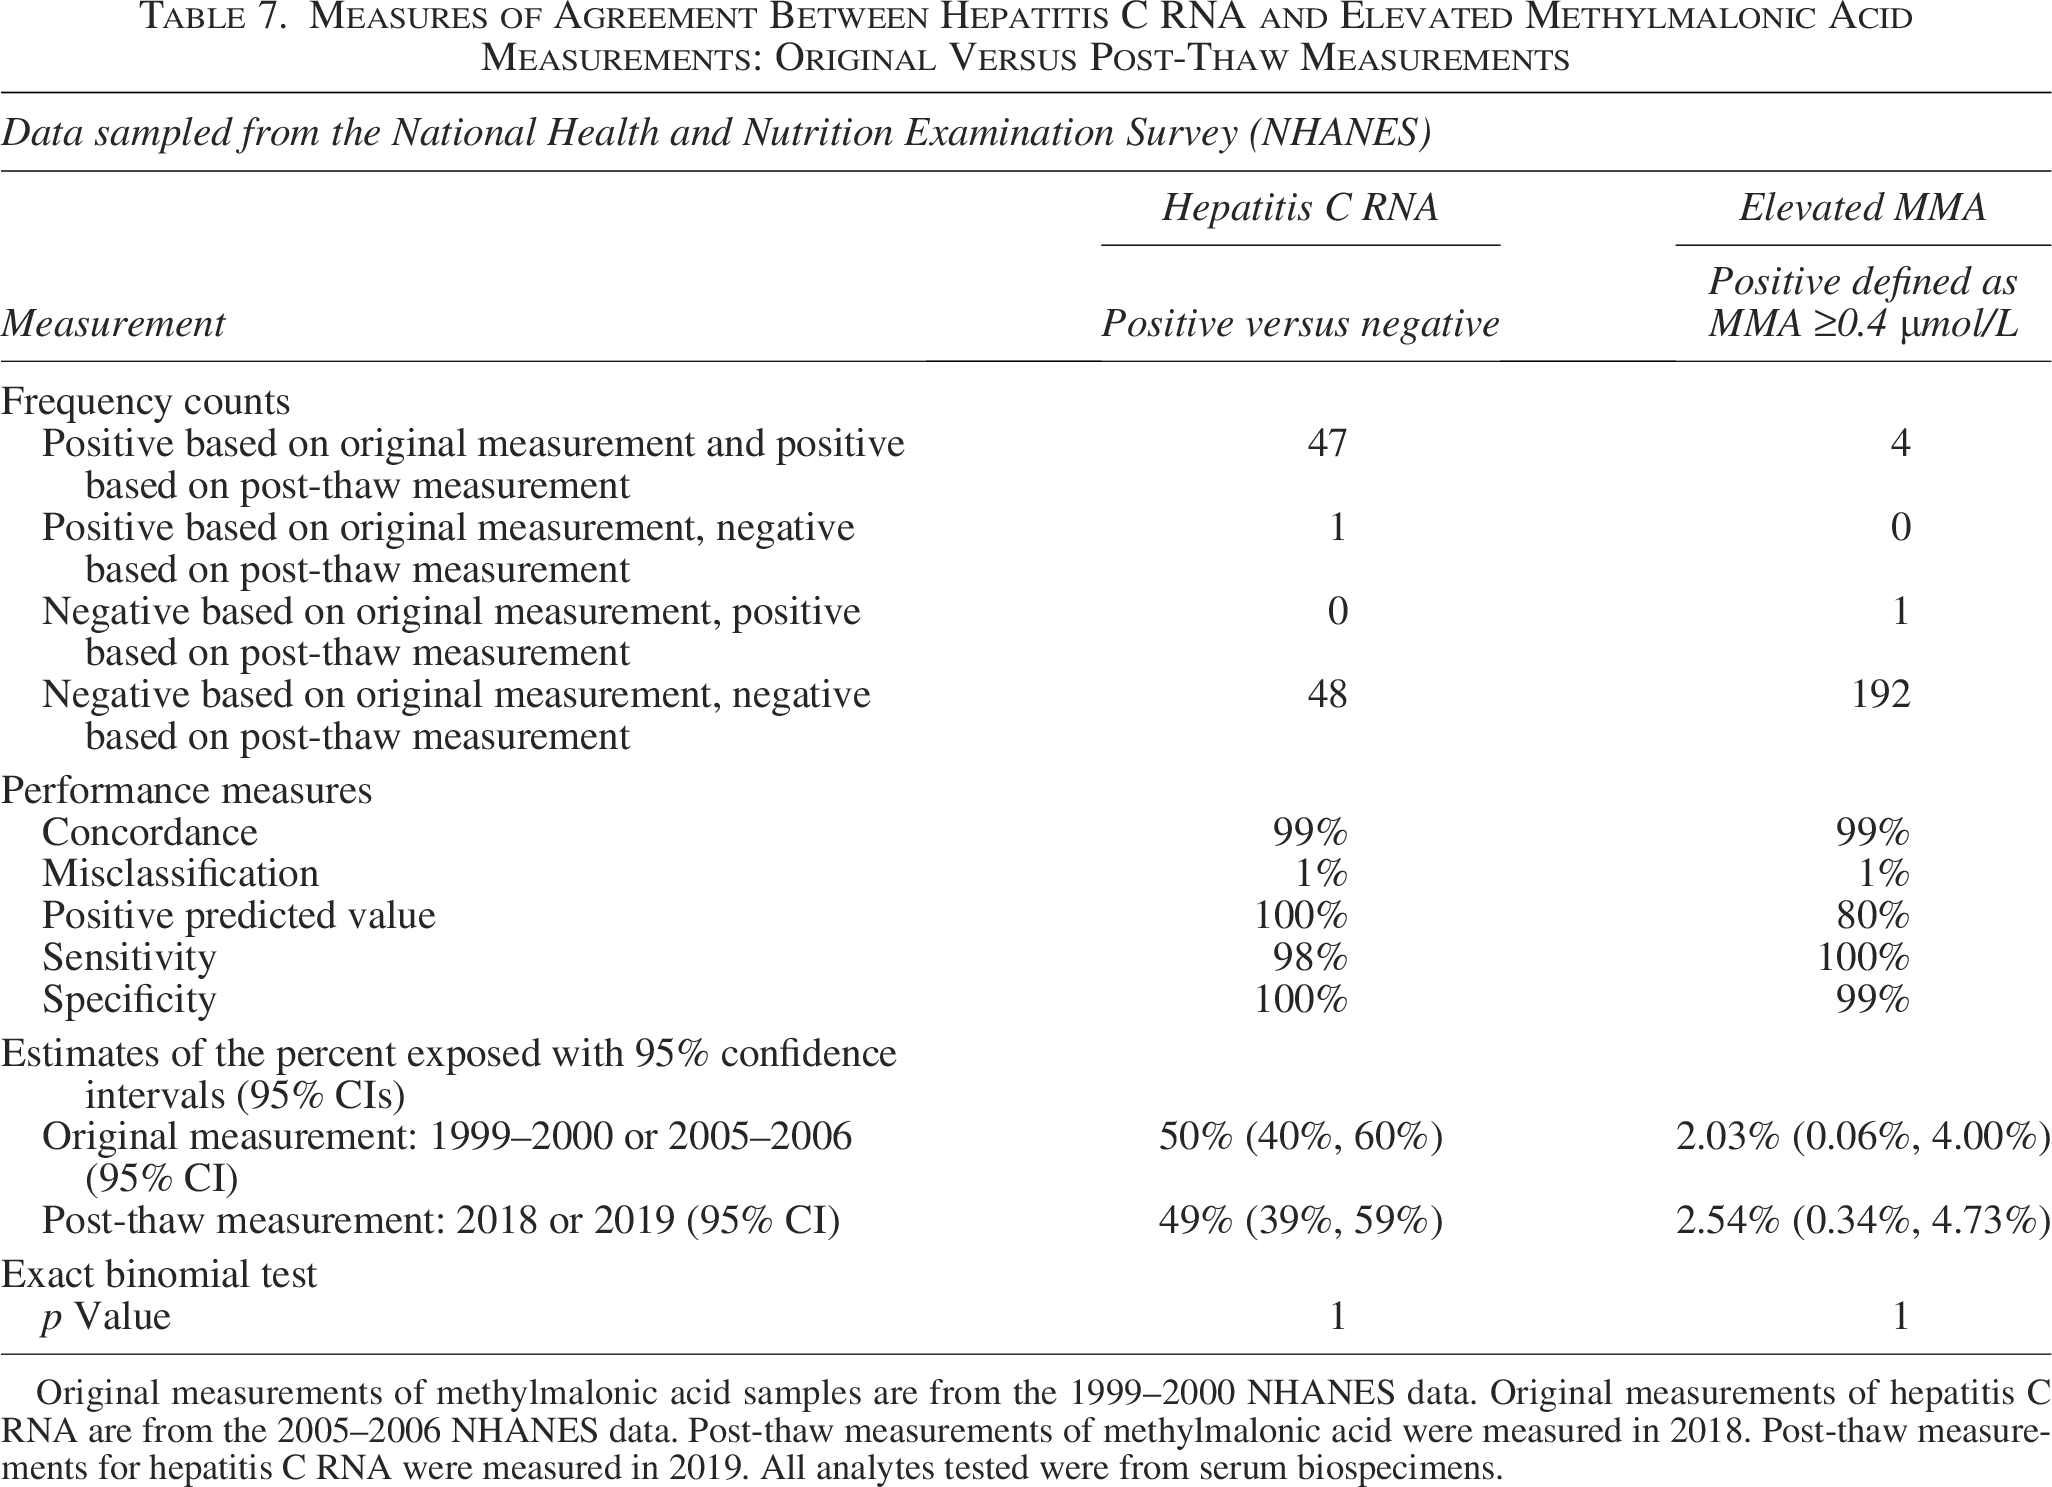
Original measurements of methylmalonic acid samples are from the 1999–2000 NHANES data. Original measurements of hepatitis C RNA are from the 2005–2006 NHANES data. Post-thaw measurements of methylmalonic acid were measured in 2018. Post-thaw measurements for hepatitis C RNA were measured in 2019. All analytes tested were from serum biospecimens.
All four survey participants who had elevated MMA values in 1999–2000 also had elevated values in 2018. Of 193 without elevated values in 1999–2000, only one had an elevated value in 2018. This corresponds to 99% concordance, 1% misclassification, 80% precision, 100% sensitivity, and 99% specificity. An exact binomial test indicated no statistically significant differences between the distribution of elevated values in 1999–2000 versus 2018 (p value = 1).
Discussion
Our study adds to the literature by examining the effect of long-term storage (<−80°C) under vapor-phase liquid nitrogen on five select analytes that, to the best of our knowledge, have not been previously reported or have been minimally reported. Each of the selected analytes is a key indicator of health: cotinine, a metabolite of nicotine used to assess tobacco use and exposure; VITA and VITE, nutritional biomarkers; MMA, a biomarker for vitamin B12 deficiency or inherited methylmalonic acidemias; and HCV-RNA used to establish viral load and to indicate current infection of hepatitis C. Moreover, this is the first time that the effect of prolonged freezer storage has been tested on laboratory test results in the NHANES biospecimen collection.
We observed proportional differences of 3%–12% for cotinine in people who do not smoke, 11% for cotinine in people who smoke, −8% to 1% for VITA, 8%–9% for VITE, and −6% to 8% for MMA (most within 10% threshold). Percentile precision estimates aligned with performance thresholds defined by quality control data and generally applicable quality goals. For all quantitative analytes, differences between measurements were within 20% of the average value for at least 85% of the sample, and for qualitative HCV-RNA and MMA results, we observed 99% concordance between measurements. The clinical relevance of such small differences is minimal.
Using methods similar to ours, Gislefoss et al. examined the stability of serum proteins, hormones, and lipids collected from Caucasian males 40–49 years old and stored in the Janus Serum Bank for 25–29 years.40,41 Relative percent differences were compared to recommended maximal bias 42 to determine that specimen stability varied by analyte. Namely, total cholesterol, albumin, sex hormone binding globulin, cystatin C, hormones (follicle stimulating hormone, luteinizing hormone, thyroid stimulating hormone, and free thyroxin), and immunoglobulins (IgE, IgG) were stable over time, while selected lipids, lipoproteins (sodium, apolipoprotein A1, apolipoprotein B, high-density lipoprotein cholesterol, low-density lipoprotein cholesterol, and prolactin), polypeptides (C-peptide), and enzymes (alanine amino transferase, creatinine kinase) displayed large differences. Using the same serum bank, Hannisdal et al. determined that folate degradation is substantial in serum samples that have been frozen for up to 29 years, but that folate measured as p-aminobenzoylglutamate equivalents is relatively stable. 43
Other studies, with fewer analytes, have been more definitive. Based on the biobank collection of the Parasitology-Mycology Clinical Laboratory in Grenoble Alpes University Hospital in France, the biological relevance of anti-Toxoplasma IgG and IgM on toxoplasmosis diagnosis was not correlated to storage time during the first 10 years. 44 Out of 275 randomly selected specimens from the Danish Pregnancy Screening registry, ion concentrations of Na+ and Cl− were unaffected by storage of 27–37 years. 45 RNA quality did not decrease over a time period of 7–10 years in a large population-based sample of pregnant women from the All Our Families cohort study. 46
In terms of the analytes examined in this study (cotinine, VITA, VITE, MMA, and HCV-RNA), Comstock et al. conducted a literature review of the effects of long-term freezer storage on concentrations of antioxidant micronutrients (VITA and VITE included) in serum or plasma and determined that most studies were deficient due to small sample sizes, inadequate descriptions of procedures, and short periods of storage. However, based on what was published, VITA was stable at temperatures as high as −20°C for up to 15 years of storage, and VITE experienced moderate losses at temperatures above −40°C during the same time frame. 47 Belariola et al. report on the stability of HCV-RNA plasma samples at −20°C and −70°C after 1 year (56 samples) and 9 years (22 samples) of storage, observing declines in the mean viral load but also noting that high intra-assay variation could help explain the declines. 3 However, viral load is a continuous outcome that differs from the binary outcome of infection status examined in this study.
The discussion in our Supplementary Data examines the properties of the statistical methods used and elaborates on why statistically significant differences do not necessarily indicate bias in the post-thaw measurements for quantitative analytes.48–50 It also points to the properties of biospecimen degradation and explains how small systematic differences could be due to differences in the controlled environments.
Limitations of the analyses include not having gold standard values to compare measurements, only having one measurement per biospecimen per time point, and the inability to isolate the effect of long-term storage from all influences affecting frozen biospecimens. Specifically, with only one measurement per time point, we are unable to eliminate the effect of variability on our estimates of systematic error. Overestimated precision underestimates the frequency of small differences and overestimates the frequency of large differences. This results in wide difference distributions, which in turn produce statistically significant t-tests and regression analyses. Moreover, while this study includes a diverse mix of biomarkers, including tobacco smoke exposure, oxidative stress, two vitamins, and virus RNA, we cannot determine whether these results are applicable to other analytes. This limitation restricts the applicability of our findings to other studies.
Conclusions
This study is the first to examine the effects of long-term storage on specimens from the NHANES biorepository. It is also one of the few studies to investigate the impact of long-term storage in vapor-phase liquid nitrogen (<−80°C) on serum cotinine, VITA, VITE, MMA, and HCV-RNA. Although remeasurement of these five analytes after long-term storage in vapor-phase liquid nitrogen revealed some differences, a comprehensive analysis showed that most differences are within acceptable ranges based on standard laboratory criteria for assessing accuracy, precision, and reproducibility. The observed differences do not appear large enough to affect the utility of frozen biospecimens for these analytes in future research projects. This study suggests that for the purposes of population health inference, subsequent statistical analyses of the stored serum specimens should remain valid for these analytes.
Authors’ Contributions
J.R.: Methodology, software, formal analysis, data curation, writing—original draft, writing—review and editing, visualization, and project administration. E.A.T.: Methodology, validation, resources, data curation, writing—original draft, writing—review and editing, and project administration. R.S.: Methodology, validation, resources, data curation, and writing—review and editing. C.S., L.W., J.D., C.M.P., R.L.S., C.D.P., and E.M.M.: Validation, investigation, resources, and writing—review and editing. G.M.M.: Conceptualization, methodology, validation, resources, writing—review and editing, and supervision.
Footnotes
Author Disclosure Statement
The authors have no conflicts of interest to declare.
Funding Information
This research received no specific grant from any funding agency.
Disclaimer
The findings and conclusions in this article are those of the authors and do not necessarily represent the official position of the CDC, the U.S. Department of Health and Human Services, or any of its affiliated institutions or agencies. At the time that the research and data analysis were conducted, Eric Tolliver was employed at the NCHS, CDC, in the Division of Health and Nutrition Examination Surveys.
Supplemental Material
Supplemental Material
Supplemental Material
Supplemental Material
Supplemental Material
Supplemental Material
References
Supplementary Material
Please find the following supplemental material available below.
For Open Access articles published under a Creative Commons License, all supplemental material carries the same license as the article it is associated with.
For non-Open Access articles published, all supplemental material carries a non-exclusive license, and permission requests for re-use of supplemental material or any part of supplemental material shall be sent directly to the copyright owner as specified in the copyright notice associated with the article.