
Abstract
Introduction:
Biobanking practices are continuously evolving to improve and accelerate sample preparation and analysis.
Objectives:
At the Biological Resource Center of the Institut Pasteur, our goal is to develop new and optimized methods for sample processing. In this study, we aimed to establish a culture-independent approach for identifying bacteria directly from their freeze-dried state.
Methods:
Freeze-dried bacteria from 25 species were reconstituted in saline solution, mechanically lysed, and their proteins extracted with acetonitrile and formic acid, followed by matrix-assisted laser desorption/ionization time-of-flight mass spectrometry analysis.
Results:
The method enabled the reliable identification of diverse bacterial species. Spectrophotometric measurements led to the definition of a reproducible O.D.600 threshold, above which all strains were consistently and accurately identified.
Conclusion:
This approach provides a fast and robust alternative for the characterization of bacterial samples across diverse taxonomic groups.
Introduction
Microbial culture collections play a critical role in preserving biodiversity by maintaining a broad range of strains used across research, diagnostics, epidemiology, quality control, industry, and education. 1 To ensure their usability, strains are routinely checked for viability, purity, and identity prior to storage and distribution. 1 Common preservation methods include freeze-drying, cryopreservation in liquid nitrogen, and at −80°C. 2 Among these, freeze-drying is considered as a practical method, as ampoules can be stored at room temperature and are easy to transport.
As the field progresses, the methods used to prepare and analyze microbial strains and their associated biomaterials are becoming more efficient, rapid, and suited to high-throughput microbial characterization. 3 At the Biological Resource Center of the Institut Pasteur, we are committed to improving and validating biobank laboratory workflows. In this study, we aimed to establish a fast, cultivation-free workflow for bacterial identification at the species level using freeze-dried material. This approach addresses the limitations of conventional culture, which can be time-consuming (ranging from days to weeks) or impossible when culture conditions are unknown, an issue often encountered with historical strains that lack associated metadata or accurate taxonomic classification.
The bacterial domain encompasses an extraordinary phylogenetic and structural diversity, with modern phylogenomics identifying more than 40 phyla. 4 Much of this diversity is reflected in the architecture of the bacterial cell envelope, a key determinant of physiology, environmental adaptation, and compatibility with analytical workflows such as matrix-assisted laser desorption/ionization time-of-flight mass spectrometry (MALDI-TOF MS). Classical Gram-positive bacteria possess a thick, multilayered peptidoglycan structure that confers high mechanical robustness, 5 whereas Gram-negative species exhibit an envelope composed of an inner membrane, a thin peptidoglycan layer, and an outer membrane enriched in lipopolysaccharide.6,7 Beyond these typical models, several bacterial groups display atypical and highly specialized envelope architectures. Acid-fast Actinomycetota, for example, harbor mycolic-acid–rich layers that profoundly modify permeability and lysis susceptibility. 8 Other taxa, such as members of the Pasteurellaceae or Neisseriaceae, possess lipooligosaccharide-based outer membranes lacking the extended O-antigen.9,10 Spiral-shaped organisms with very thin envelopes, such as Campylobacterota, further illustrate the structural diversity found in bacteria. 11 This diversity of envelope organizations, ranging from highly robust to extremely fragile, makes it necessary to consider phylogenetic diversity when evaluating methodological performance in microbial biobanks.
MALDI-TOF MS offers a powerful and rapid tool for the identification of a large panel of bacteria, capable of producing results within hours. The process involves desorption and ionization of cellular proteins from a matrix-coated sample via a laser pulse under vacuum. Ionized proteins are then accelerated through a flight tube and separated based on their mass-to-charge (m/z) ratios, with smaller proteins reaching the detector before larger ones. The resulting peptide mass fingerprint, typically covering the 2–20 kDa range, includes abundant ribosomal proteins that are conserved and species-specific. These spectra are compared to a reference database, enabling identification at the genus or species level.12,13
To validate this culture-independent approach, we analyzed 26 bacterial isolates representing 25 species, all conserved in a freeze-dried state for over 30 years and displaying diverse morphological and physiological traits. Our findings demonstrate that this workflow enables reliable and rapid identification of bacterial strains.
Materials and Methods
Bacterial strains
All used strains are listed in Table 1. We selected bacterial species belonging to the phyla Pseudomonadota, Campylobacterota, Bacillota, Chlorobiota, and Actinomycetota, which are well represented in the MALDI-TOF MS reference database used in this study. These taxa encompass a broad range of cell-envelope architectures. The panel included highly robust Gram-positive or lipid-rich species, such as Bacillus cereus,16–18 Staphylococcus aureus,5,19,20 Mycolicibacterium smegmatis,8,21,22 and Streptomyces species,5,23 which are characterized by thick peptidoglycan layers or mycolic-acid–rich envelopes. It also comprised Gram-positive bacteria with thinner yet resilient cell walls, including Clostridium perfringens,16–18 Christensenella minuta,24–26 and Streptococcus species.5,27,28 Typical Gram-negative organisms with intermediate envelope stability, such as Escherichia coli,6,8,29 Salmonella enterica,6,7,30 and Burkholderia cenocepacia,31–33 and more fragile Gram-negative taxa with weakly cross-linked outer membranes, exemplified by Neisseria meningitidis,10,34,35 Haemophilus influenzae,9,36 and Aggregatibacter actinomycetemcomitans9,37,38 were also included. Finally, spiral-shaped bacteria with extremely thin and solvent-sensitive envelopes, such as Campylobacter jejuni 11 and Arcobacter butzleri,39,40 representing some of the most delicate cell-envelope architectures, were tested.
Bacterial Species Used in This Study
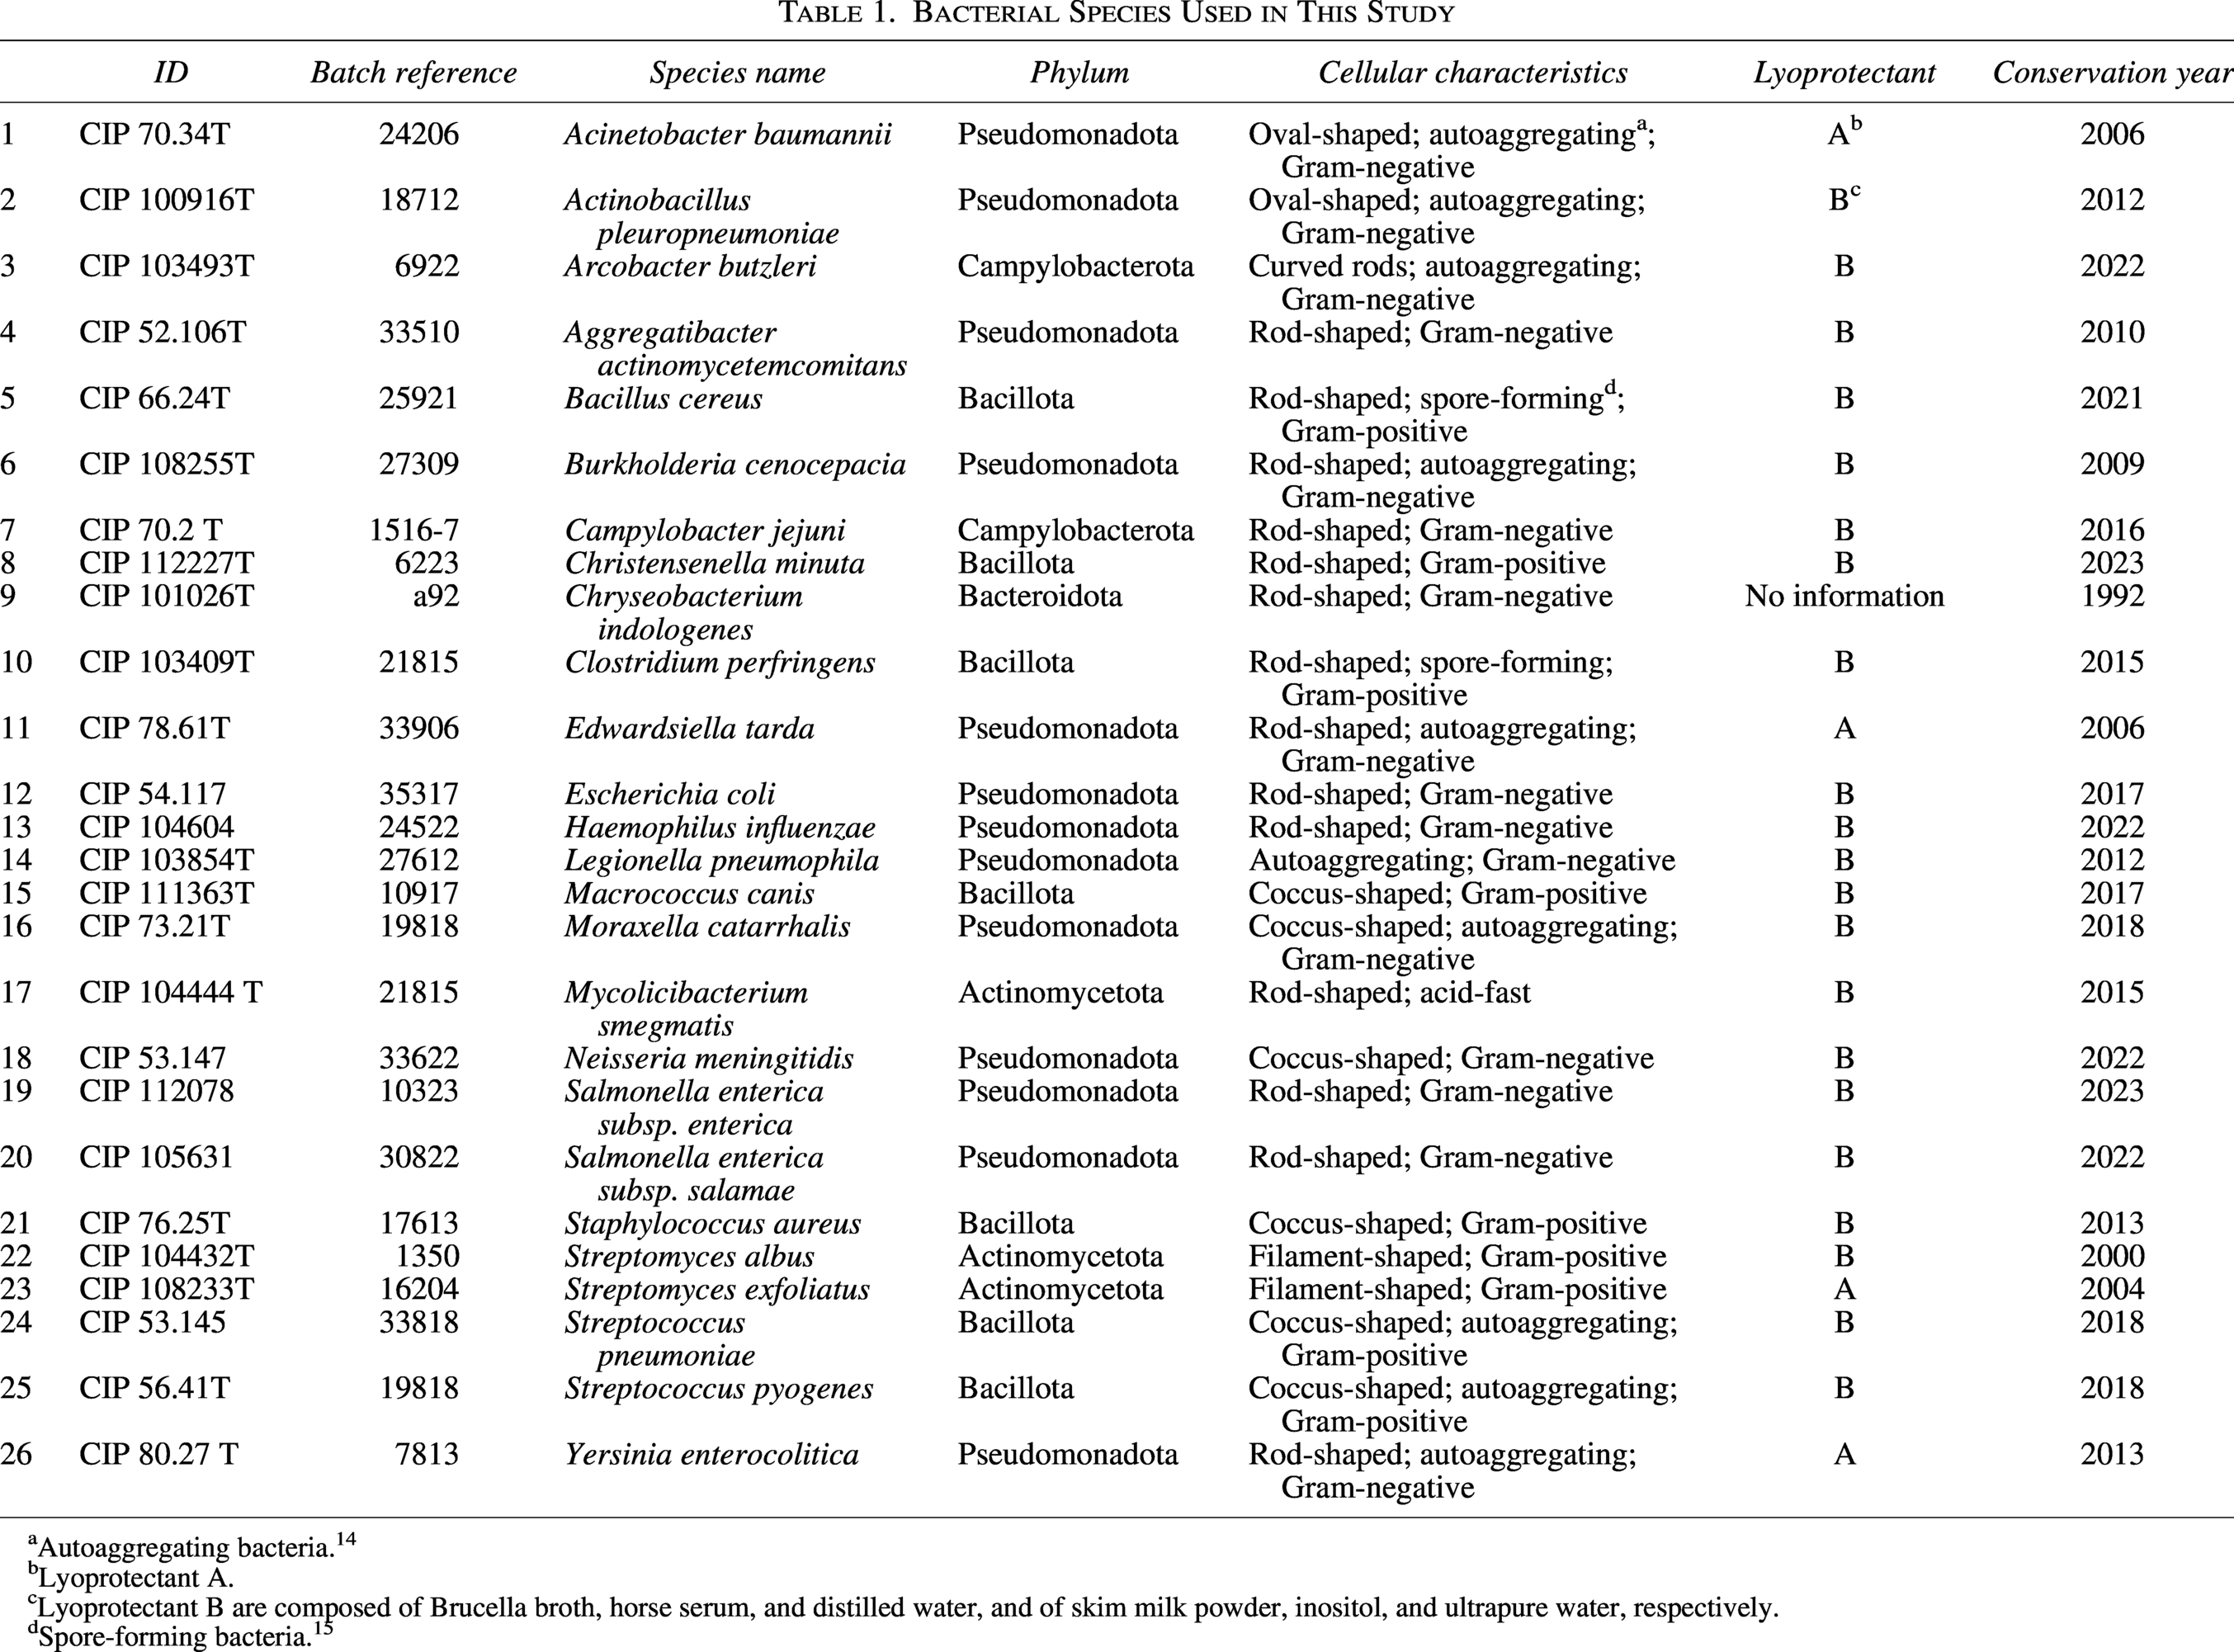
Autoaggregating bacteria. 14
Lyoprotectant A.
Lyoprotectant B are composed of Brucella broth, horse serum, and distilled water, and of skim milk powder, inositol, and ultrapure water, respectively.
Spore-forming bacteria. 15
Protein extraction from freeze-dried bacteria
The glass ampoule containing freeze-dried bacteria was opened under sterile conditions (Fig. 1). The lyophilizate was resuspended in 1 mL of normal saline (0.9% m/v sodium chloride water solution) and transferred into a 1.5 mL sterile Eppendorf tube. The suspension was centrifuged at 1500 × g for 5 minutes, and the supernatant was discarded. The latter step was repeated three times, and the pellet was resuspended in 1 mL of normal saline. The solution O.D.600 was measured with a cell density meter (Ultrospec 10; Biochrom, Cambridge, UK). The heterogeneity in O.D. values measured across the lyophilized preparations likely reflects differences in the biomass originally harvested for each sample at the pre-lyophilization step. A dilution was made when needed to stay in the O.D.600 recommended range of the Ultrospec 10, Biochrom detection (O.D.600 = 0.3–1.99 41 ). The protein extraction protocol described further is adapted from Bruker Daltonics GmbH for Mycobacteria (Bremen, Germany). Dilutions from 1:8, 1:16, 1:32, 1:130 to 1:650 were prepared from 1 mL normal saline-resuspend pellet into 1300 µL of 70% v/v ethanol. Tubes were vortexed with the IKA MS2 mini vortex shaker (IKA-Werke GmbH & Co. KG, Staufen, Germany) at full speed for 1 minutes and centrifuged at 16,000 × g for 2 minutes. When processing many samples at once, we favored vortexing with the digital Vortex-Genie 2 with horizontal microtube holder (Scientific Industries, Bohemia, NY, USA) at full speed for 1 minute. Then, the supernatant was discarded and the pellet dried for 10 minutes under a chemical hood. Twenty µL of 0.5 mm zirconia/silica beads (BioSpec products, 11079105Z) and 50 µL acetonitrile ≥99.9%, gradient grade (Sigma-Aldrich, 34851), were added to each sample, and the mixture was vortexed at full speed for 1 minutes. Then, 50 µL of 70% formic acid (Sigma-Aldrich, 33015) were added, and the samples were vortexed again at full speed for 1 minutes and centrifuged at 16,000 × g for 2 minutes. One µL of the supernatant (protein extract) was deposited on a MBT Biotarget 96 (Bruker) and dried for 5 minutes. One µL of the Bruker Bacterial Test Standard (BTS) was also spotted on the Biotarget for calibration. All protein extracts and the BTS were deposited in duplicate, unless mentioned otherwise in the “Results” section. For each analysis, the BTS was spotted again. One µL of matrix solution (α-cyano-4-hydroxycinnamic acid [Bruker] prepared in acetonitrile and trifluoroacetic acid [Solution OS; VWR Chemicals]) was deposited on the previously deposited protein extracts and BTS and dried for 5 minutes.
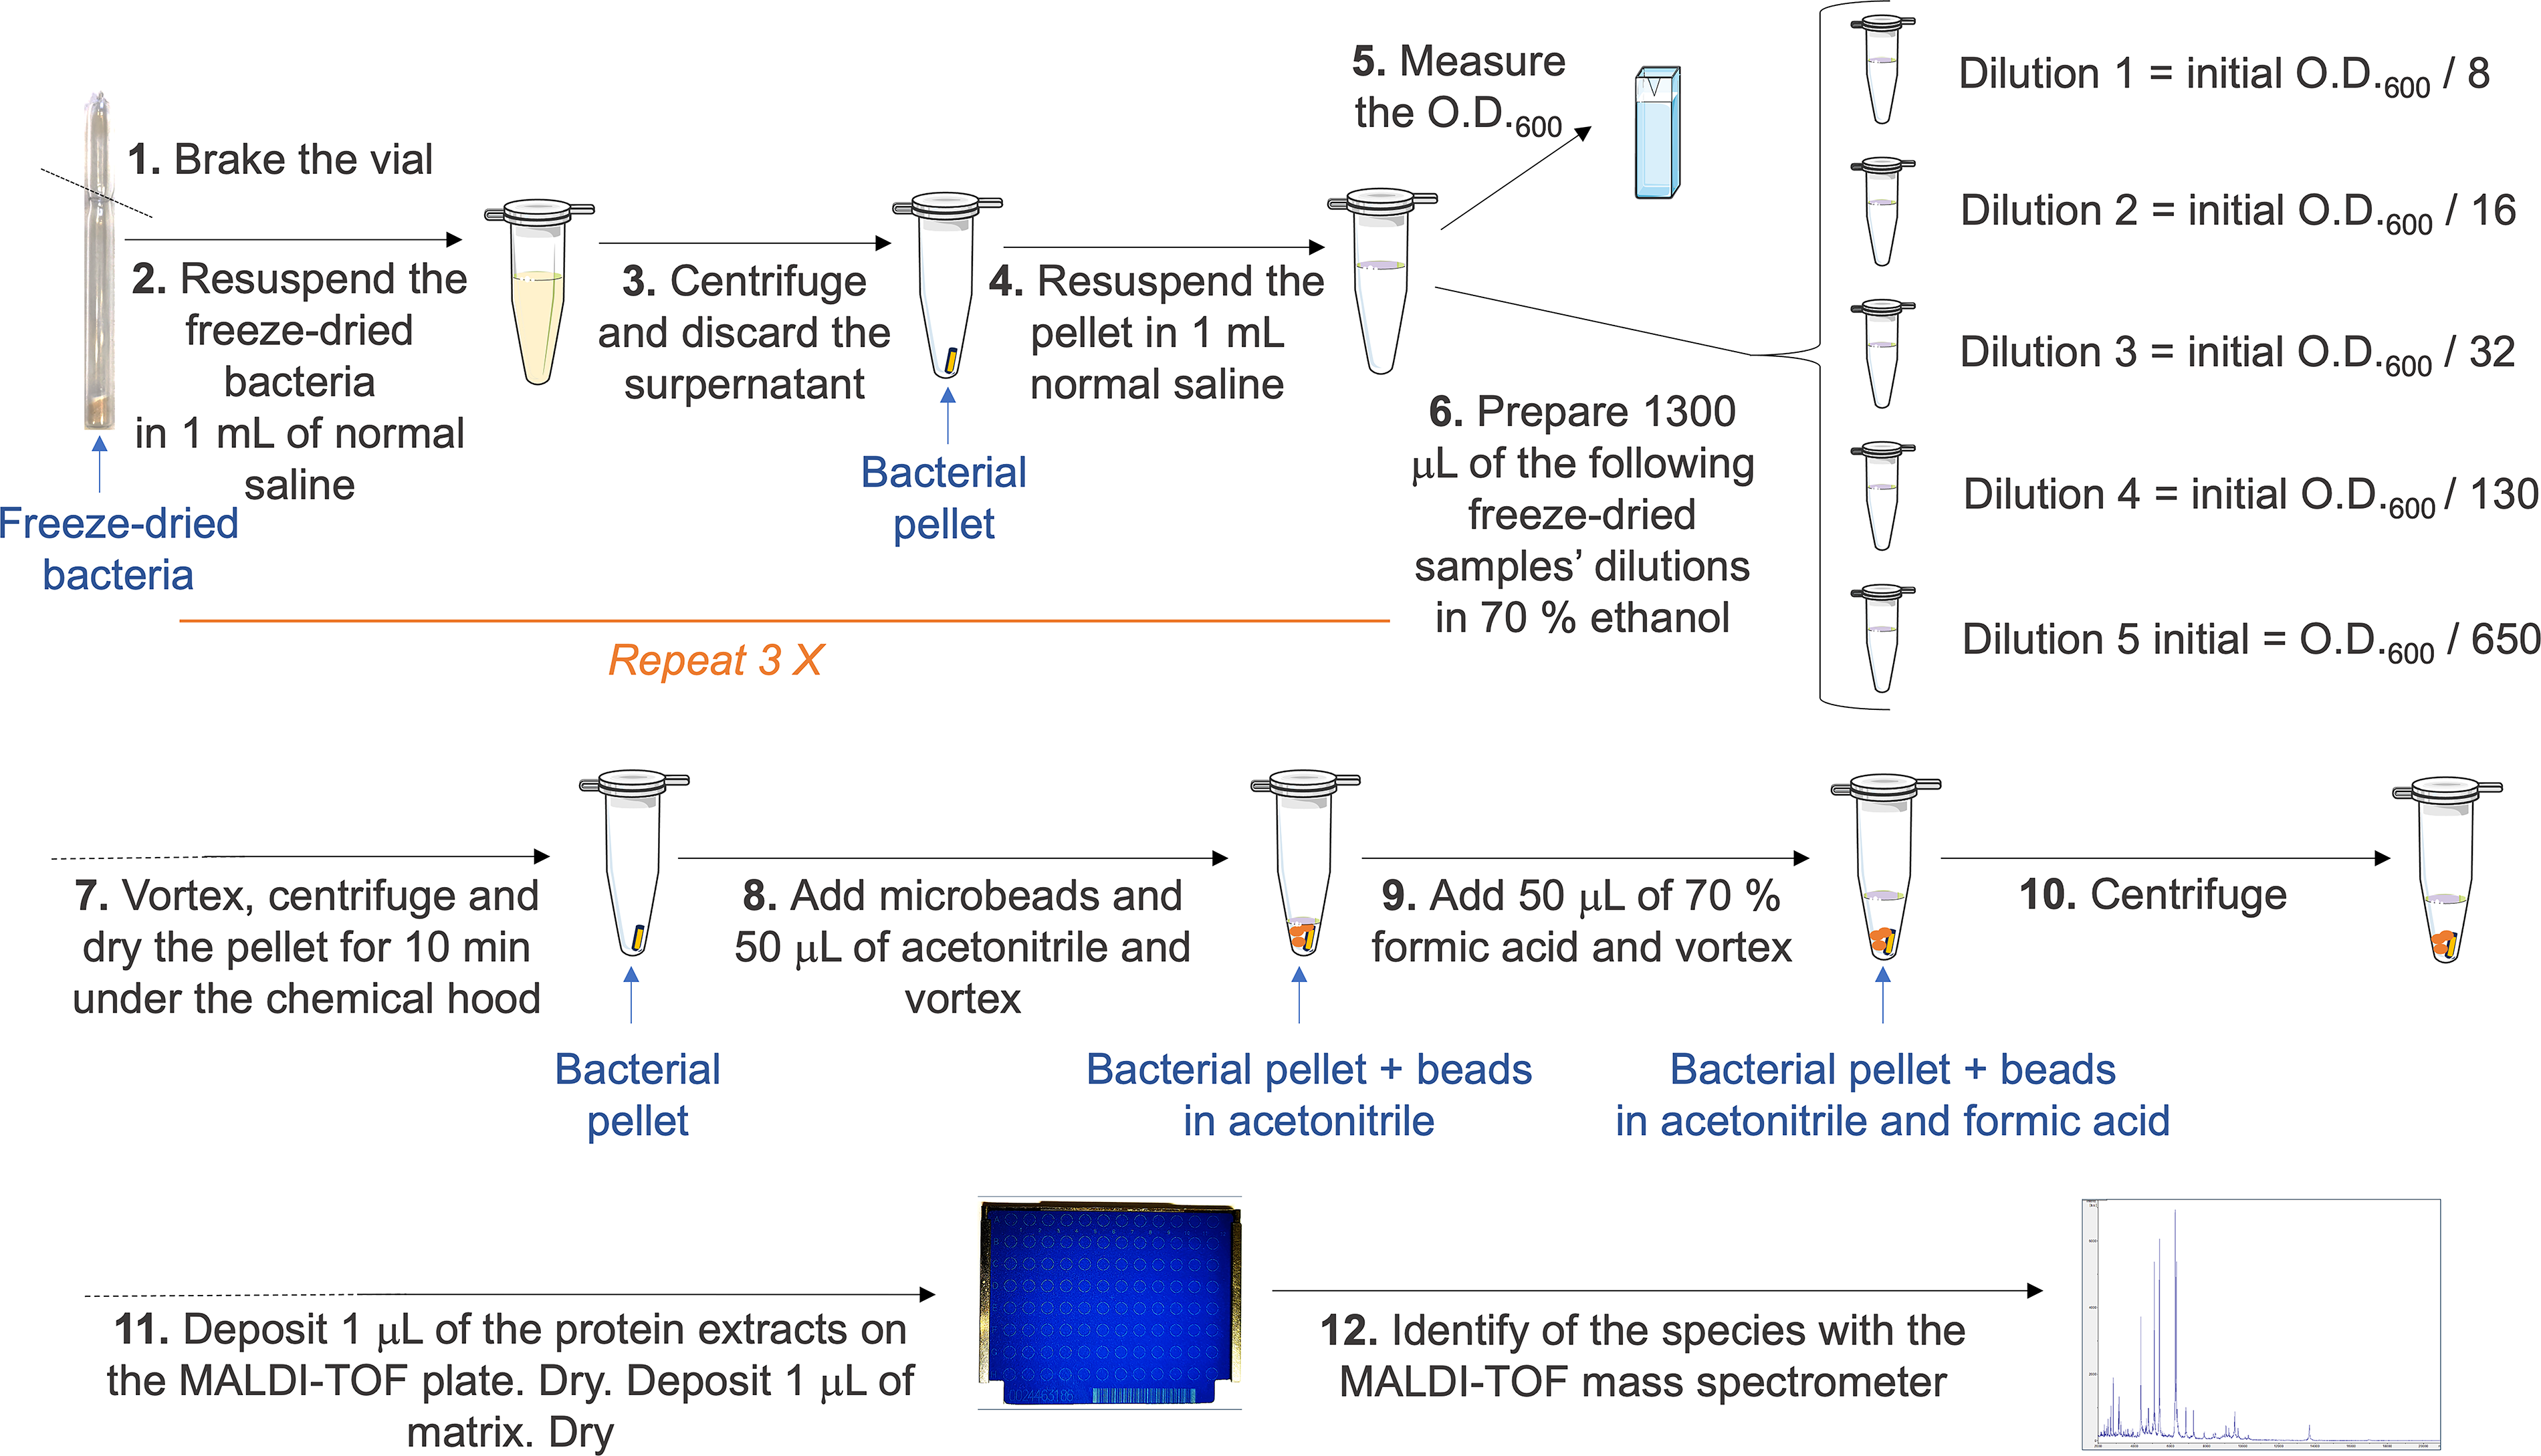
Workflow of protein extraction used to identify bacterial strains using MALDI-TOF MS. MALDI-TOF MS, matrix-assisted laser desorption/ionization time-of-flight mass spectrometry.
Identification of bacterial strains with the MALDI-TOF MS Sirius using the Bruker biotyper system
MALDI-TOF MS analyses were performed with the MALDI-TOF Sirius mass spectrometer (Bruker Daltonics GmbH) using the flexControl 3.4 and MBT Compass Ruo 4.1 software packages. The database used is the MBT Compass reference library (version 2022).
MALDI-TOF MS analysis and result interpretation
The species were identified based on the criteria of the MALDI-TOF MS analysis reports generated by the MBT Compass software. Briefly, the MALDI-TOF MS identification is not possible for scores between 0.00 and 1.69, with assigned categories “no peak detected” or “no identification possible.” The identification is possible for scores higher than 1.7, with assigned categories “low-confidence identification” (identification reliable at genus level) for scores between 1.7 and 1.99 and “high-confidence identification” (identification is possible at species level) for scores between 2 and 3.
Receiver operating characteristic analysis of O.D.600 measurements
The receiver operating characteristic (ROC) curve used to assess the discriminative performance of the O.D.600 values was generated using the EasyROC online tool (available at http://biosoft.erciyes.edu.tr/app/easyROC/).
Comparison of O.D.600 measurements obtained with different spectrophotometers
The intrinsic properties of different devices were assessed. For this purpose, O.D.600 measurements were made for Collection de l’Institut Pasteur (CIP) 54.117 (E. coli), CIP 111363 (Macrococcus canis), CIP 73.21 (Moraxella catarrhalis), and CIP 105631 (S. enterica) strains using the following spectrophotometers: the Biochrom Ultraspec 10 Classic, Eppendorf BioSpectrometer basic (Eppendorf SE, Hamburg, Germany), BioMate UV–Vis spectrophotometer (Thermo Fisher Scientific, Waltham, MA, USA), and Jenway 7615 scanning UV–Vis spectrophotometer (Cole-Parmer, St. Neots, UK), and the results were compared to identify potential differences among devices.
Dilutions 1:10, 1:5, and 1:2 were made from the normal saline-resuspended and washed freeze-dried samples. Biosigma, BSA002, cuvettes were used.
Results
Twenty-six bacterial isolates representing 25 species from Pseudomonadota (12 species), Bacillota (6 species), Actinomycetota (3 species), Campylobacterota (2 species), and Chlorobiota (1 species) phyla, with spectra available in the used reference database, were selected to validate the workflow (Table 1 and Fig. 1). No spectra could be obtained when the freeze-dried bacterial samples were not washed with normal saline prior to protein extraction. Therefore, a step of sample wash was included, consisting of resuspending the freeze-dried bacterial sample in normal saline solution then centrifuging at low speed (1500 × g) to recover the bacteria in the insoluble fraction.
MALDI-TOF MS identification scores were plotted against the corresponding O.D.600 values measured with the Ultrospec 10 Biochrom spectrophotometer for all tested strains and dilutions (Fig. 2A). The plot shows that identification scores tend to increase as O.D.600 values rise. Notably, some strains could still be identified at very low biomass levels, such as Chryseobacterium indologenes, which yielded a correct identification at an O.D.600 of 0.01 with a MALDI-TOF MS score of 2.12 (Supplementary Table S1). Species-level identification was accurate for all strains except S. enterica subsp. salamae, which was misidentified as Citrobacter koseri at an O.D.600 of 0.14 (Supplementary Table S1). Overall, the analysis established an operational O.D.600 threshold of 0.34, above which all strains were consistently and correctly identified.
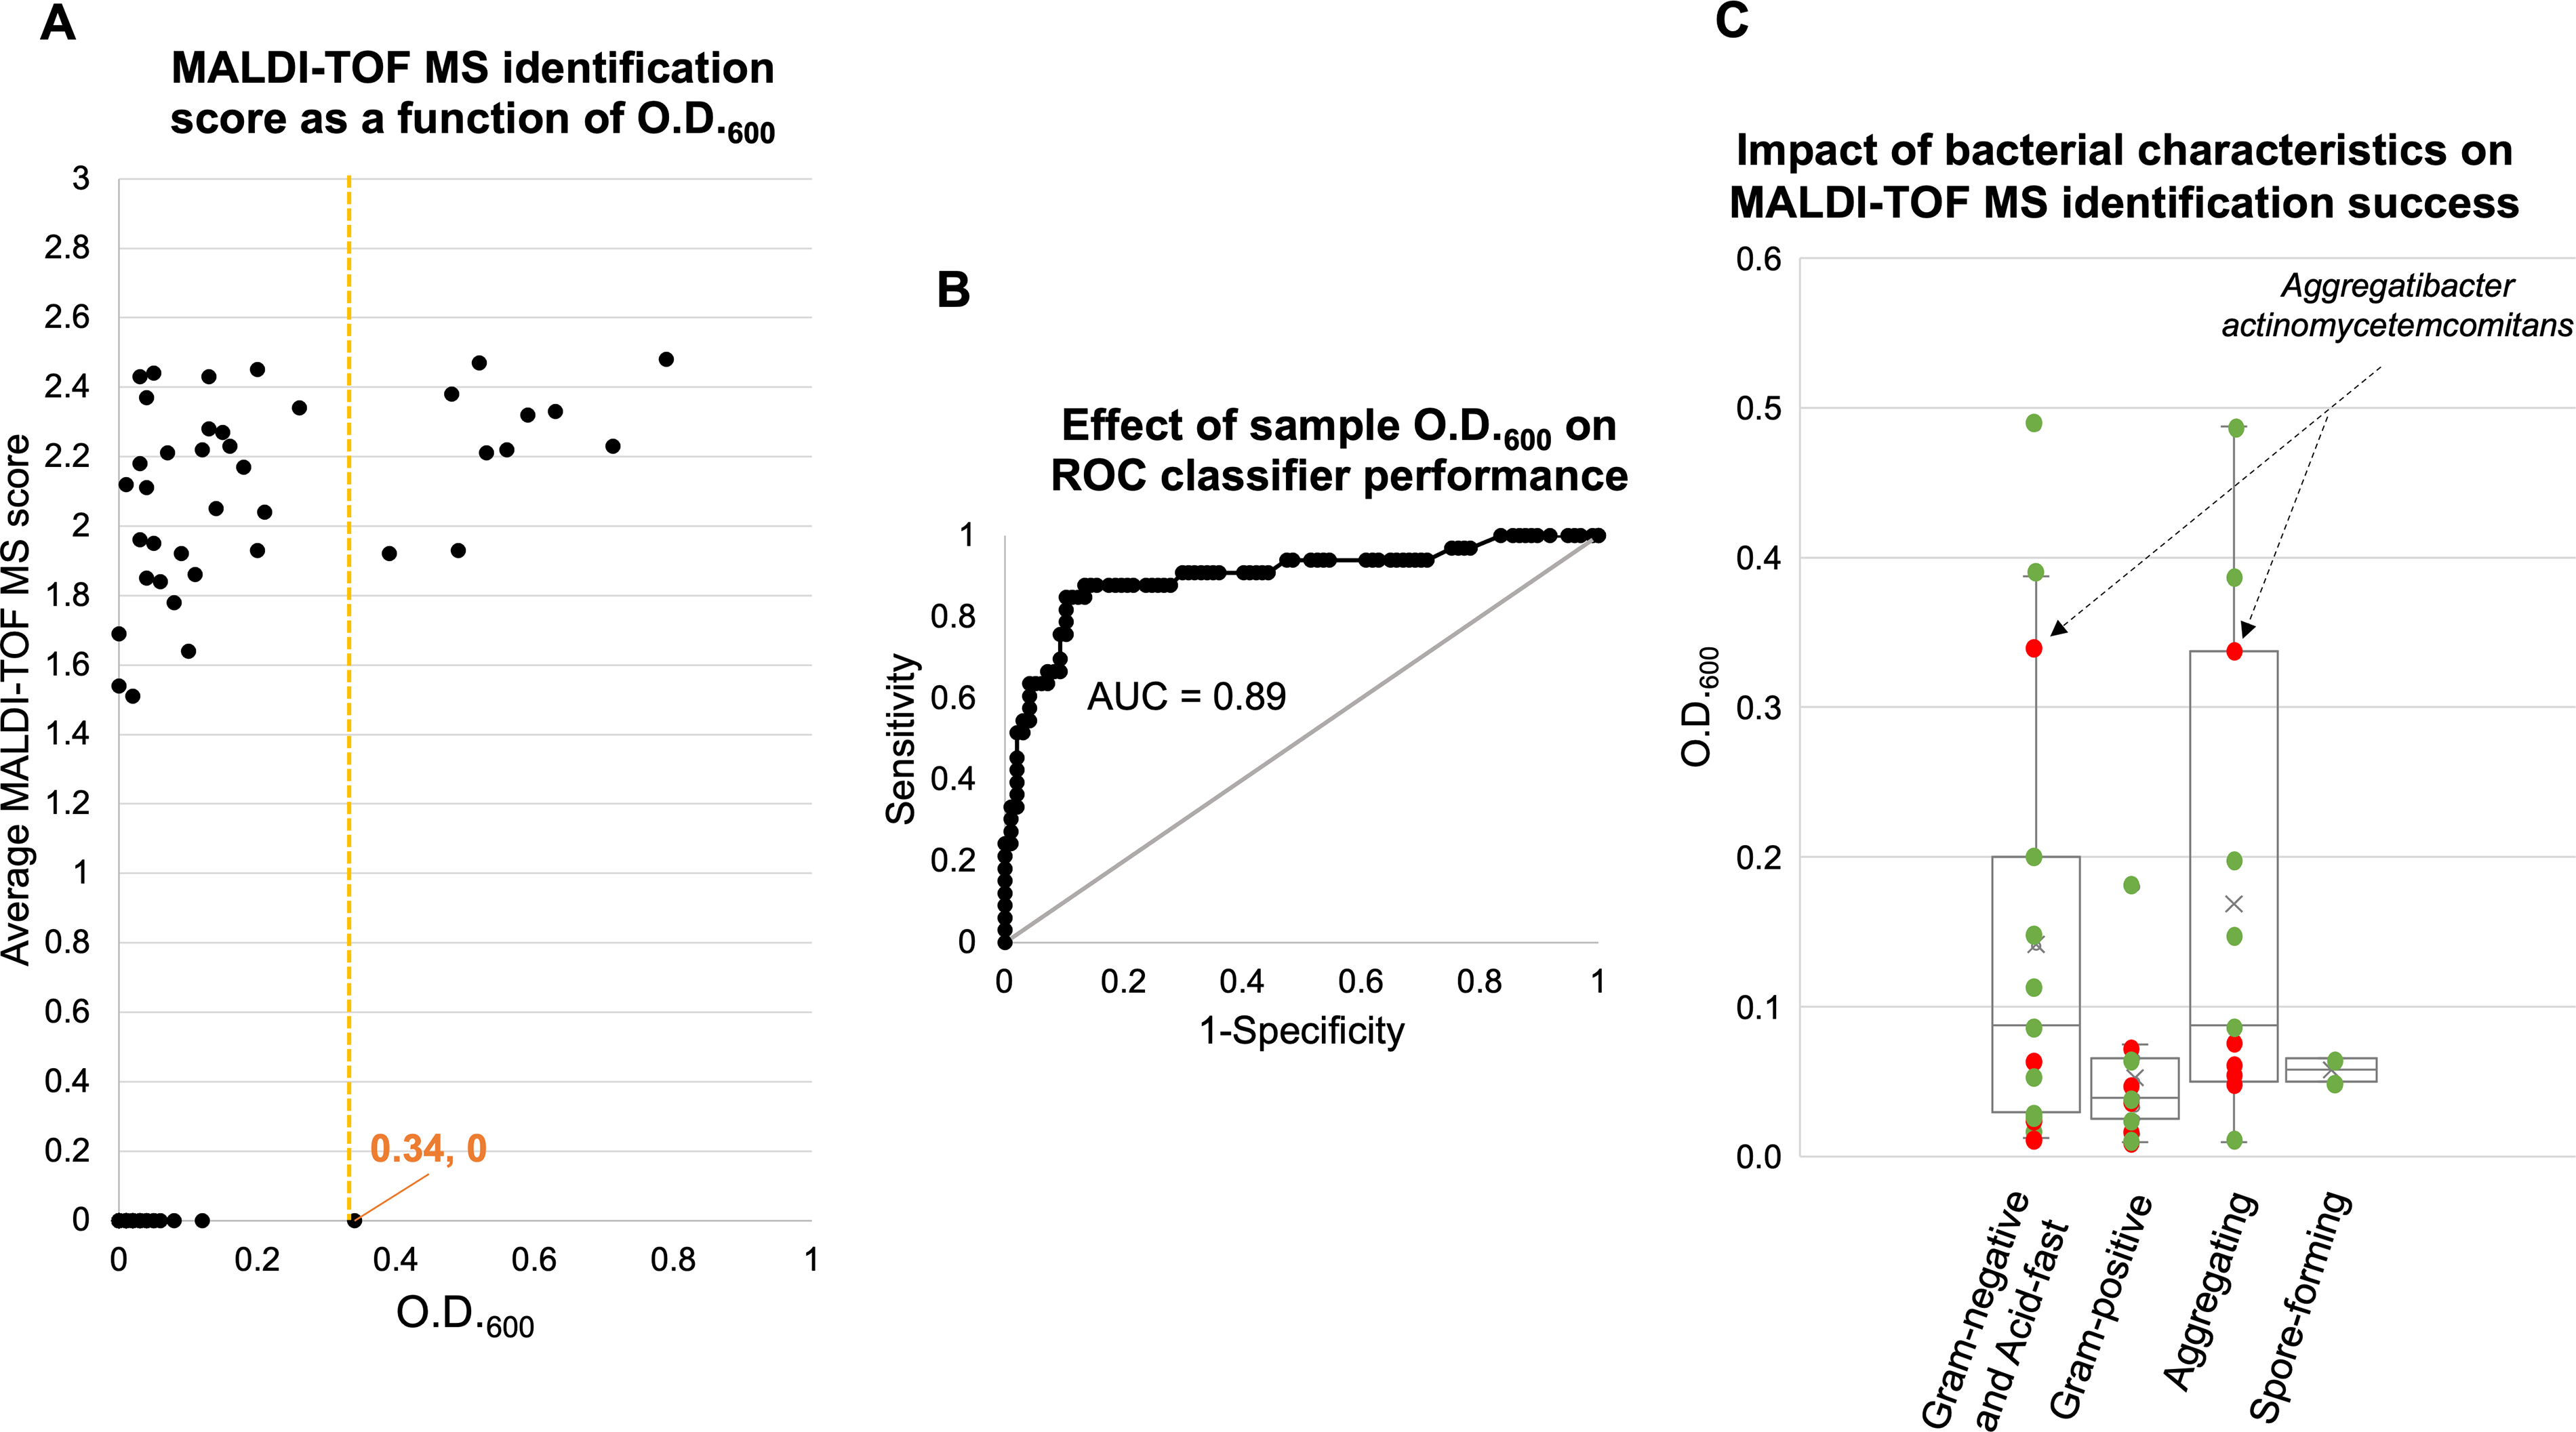
Relationship between O.D.600, identification performance, and bacterial characteristics in the MALDI-TOF MS workflow.
To evaluate whether O.D.600 values could reliably predict MALDI-TOF MS identification success, an ROC curve was generated using the average O.D.600 obtained for each species (Supplementary Tables S2 and S3, Fig. 2B). MALDI-TOF MS outcomes categorized as “no peak identification,” “no identification possible,” or misidentification were grouped as “not identified,” whereas correct species-level identifications were considered as “identified” (Supplementary Table S2). The ROC analysis showed very good discriminatory performance (area under the curve [AUC] = 0.89; 95% confidence interval: 0.84–0.94). The AUC was significantly greater than 0.5 (z = 15.27, p < 0.0001), confirming that higher O.D.600 values strongly predict identification success. At the operational cut point of 0.34, the sensitivity was 0.33, meaning that 33% of the samples that were correctly identified had an O.D.600 above this threshold, while 67% had lower O.D.600 values. The specificity at this threshold was 0.98, indicating that only 2% of the samples that were not correctly identified exceeded an O.D.600 of 0.34.
Furthermore, identification was successful across all bacterial categories examined, Gram-positive, Gram-negative, aggregating, and spore-forming strains (Fig. 2C). While successful identifications were generally obtained for all categories at O.D.600 values above 0.08, an exception was observed for the Gram-negative and autoaggregating bacteria A. actinomycetemcomitans, for which no species-level identification was achieved even at its maximum tested O.D.600 of 0.34.
The results obtained for the two S. enterica subspecies, salamae and enterica, were examined in more detail (Fig. 3). At the lowest O.D.600 values tested (0.006, 0.007, 0.03, and 0.035; Supplementary Table S1), neither strain could be identified. At higher O.D.600 values (0.24, 0.28, 0.48, and 0.56), both subspecies were correctly identified as Salmonella species. At intermediate O.D.600 values (0.12 and 0.14), S. enterica subsp. enterica was correctly identified with a mean MALDI-TOF MS score of 2.1, whereas S. enterica subsp. salamae was misidentified as C. koseri, with a mean score of 1.85. These results show that the two subspecies were not identified with the same accuracy at similar biomass levels.
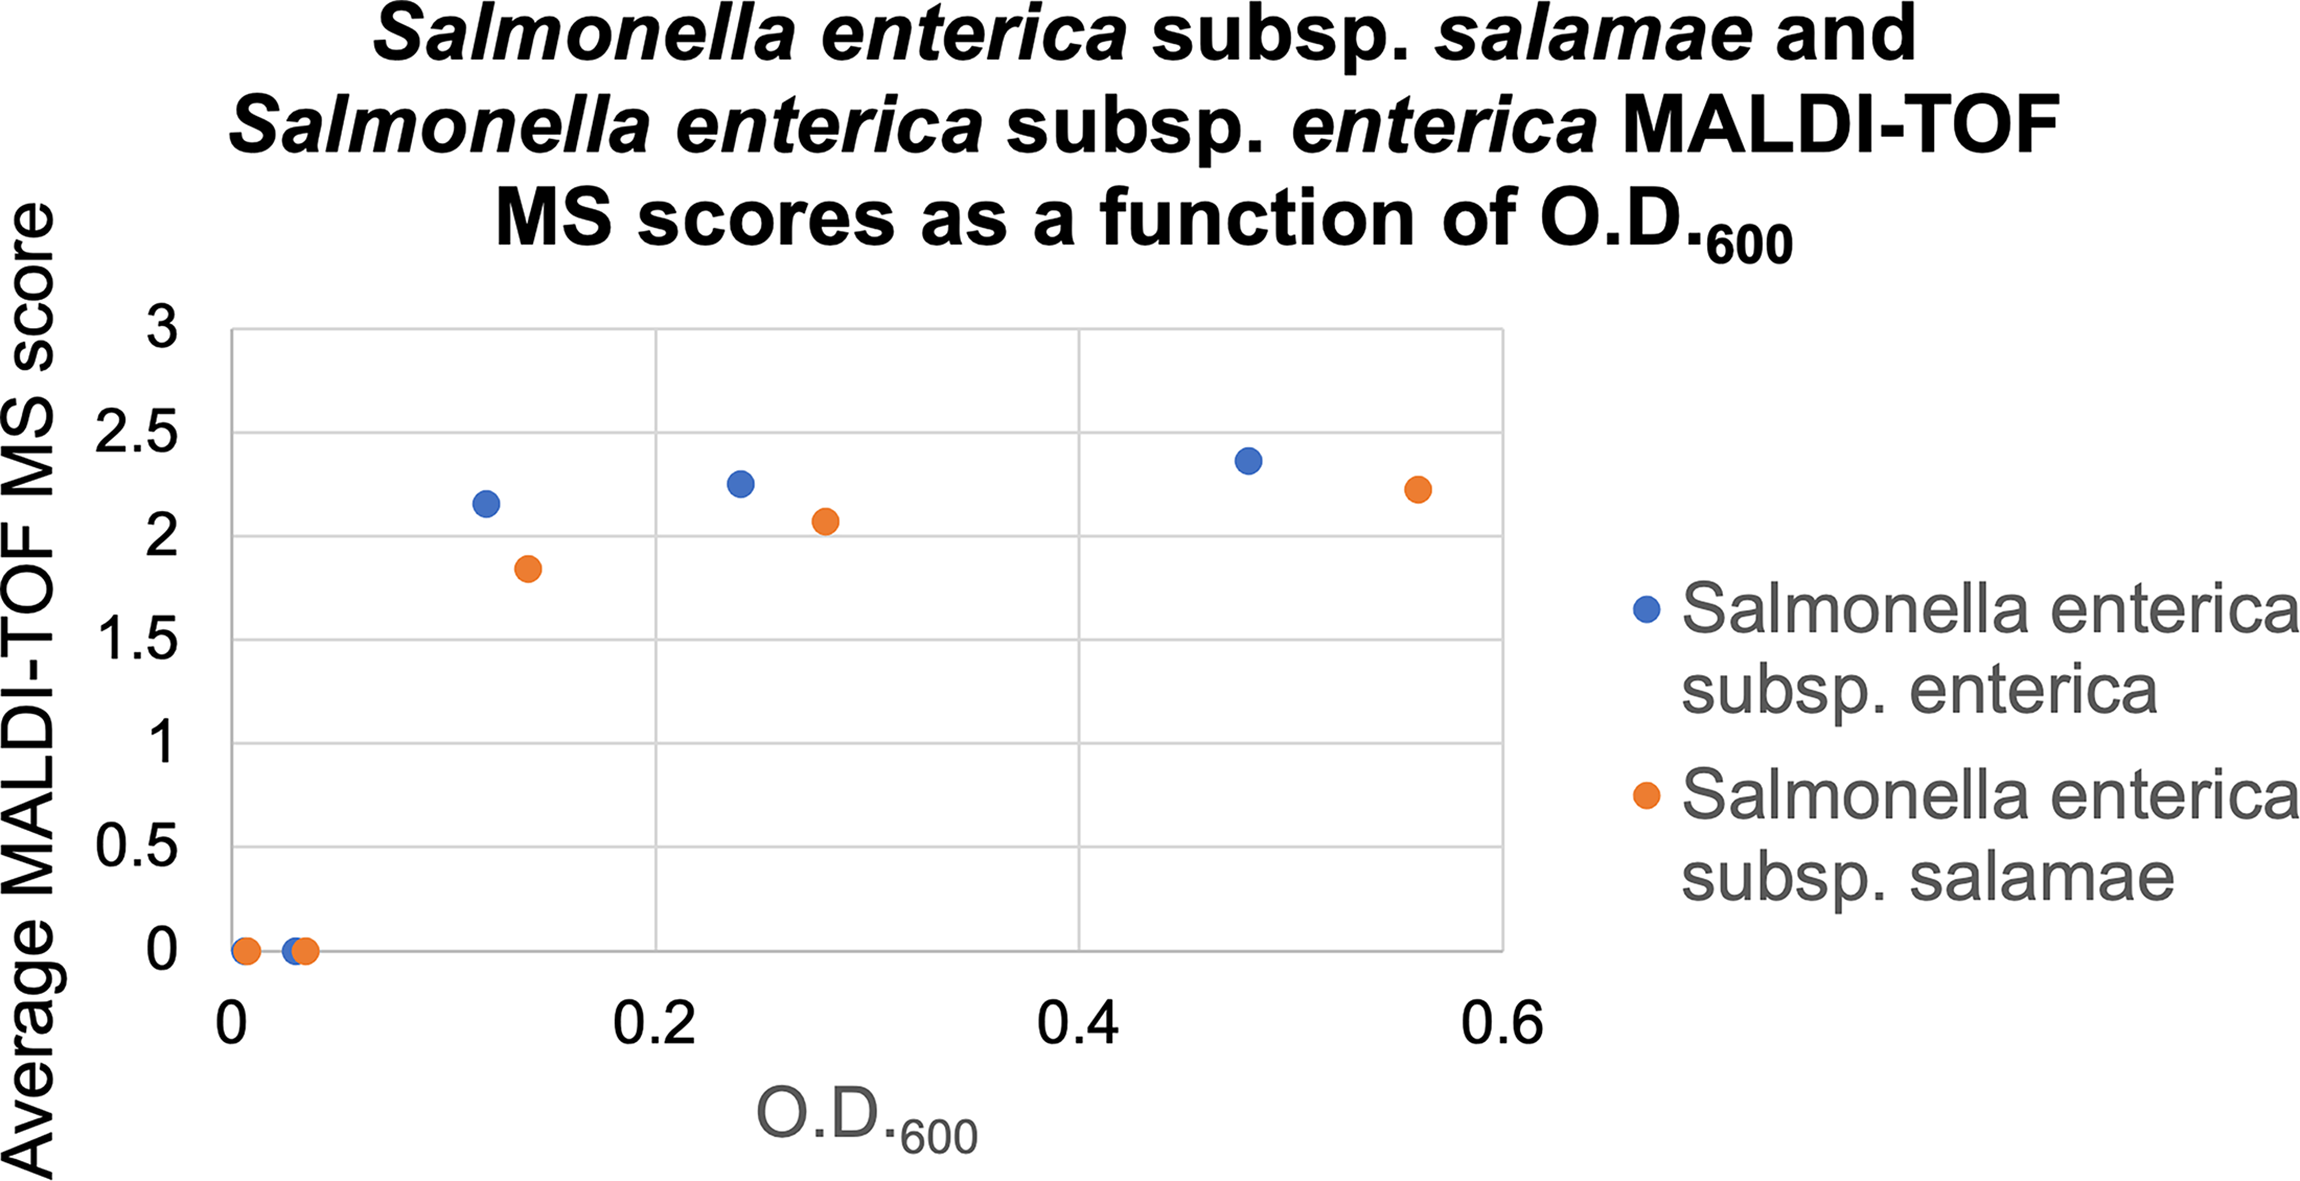
Salmonella enterica subsp. salamae (CIP 105631) and Salmonella enterica subsp. enterica (CIP 112078) MALDI-TOF MS scores as a function of O.D.600. Dots represent the average between the MALDI-TOF scores obtained for replicate 1 (R1) and replicate 2 (R2).
To assess whether concentrating samples that initially failed MALDI-TOF MS identification could improve detection, freeze-dried preparations of Streptomyces exfoliatus, Yersinia enterocolitica, and N. meningitidis were concentrated to O.D.600 values of 0.28, 0.39, and 0.50, respectively (Fig. 4). For S. exfoliatus, 0.28 represented the highest achievable O.D.600 due to its low initial biomass. As a control, all strains were also tested at O.D.600 = 0.03, a level that did not yield identification in previous experiments (Supplementary Table S1). As expected, none of the strains were identified at O.D.600 = 0.03, whereas all three were successfully identified after concentration, highlighting the importance of sufficient biomass for reliable MALDI-TOF MS analysis.

MALDI-TOF MS scores of Streptomyces exfoliatus, Yersinia enterocolitica, and Neisseria meningitidis at dilutions below or above (or near) the defined O.D.600 of 0.34. MALDI-TOF scores obtained for S. exfoliatus, Y. enterocolitica, and N. meningitidis bacterial suspensions with low (0.03) and high O.D.600 (>0.28) values. Four replicates were analyzed per strain.
Finally, the applicability of our workflow across different spectrophotometer models commonly used in laboratories was assessed. To this end, MALDI-TOF MS identification results for freeze-dried suspensions of E. coli (CIP 54.117), M. canis (CIP 111363), M. catarrhalis (CIP 73.21), and S. enterica (CIP 105631) diluted at 1:10, 1:5, and 1:2 were compared. O.D.600 measurements were performed using four spectrophotometers listed in the “Materials and Methods” section: the Biochrom (used for prior experiments), Eppendorf, Thermo Scientific, and Cole-Parmer Jenway. Except for the Thermo Scientific, which employs a multi-well format, all other devices are single-well spectrophotometers.
First, the linearity of the O.D. measurements across serial dilutions and within the range of O.D.600 0.2–1.99 was verified. As shown in Figure 5, a strong and consistent correlation was observed between the O.D.600 values and the dilution factors, with R2 values exceeding 0.98 for all spectrophotometers, indicating that those measurements are reliable for further interpretation.
O.D.600 measurements of suspensions of Escherichia coli (CIP 54.117), Macrococcus canis (CIP 111363), Moraxella catarrhalis (CIP 73.21), and Salmonella enterica subsp. enterica (CIP 105631) strains at 1:10, 1:5, and 1:2 dilutions, performed with Biochrom, Eppendorf, Thermo Scientific, and Cole-Parmer spectrophotometers.
The results revealed marked variability in O.D.600 readings across the different devices (Fig. 6). Notably, a consistent trend emerged: the Eppendorf generally yielded the highest O.D.600 values, while the Thermo Scientific produced the lowest. The Biochrom and the Cole-Parmer provided intermediate values. Interestingly, these discrepancies were particularly pronounced at the lowest dilutions. For instance, for the CIP 73.21 1:2 dilution, the O.D.600 value recorded by the Eppendorf was nearly twice that of the Thermo Scientific.
O.D.600 measurements among different models of spectrophotometers. O.D.600 values obtained with the Biochrom Ultraspec 10 Classic, Eppendorf BioSpectrometer basic, Thermo Scientific BioMate 3S Spectrophotometer, and Cole-Parmer Jenway 7615 Scanning UV–Visible Spectrophotometer for three dilutions (1:10, 1:5, and 1:2) of Escherichia coli (CIP 54.117), Macrococcus canis (CIP 111363), Moraxella catarrhalis (CIP 73.21), and Salmonella enterica subsp. enterica (CIP 105631) strains.
Discussion and Conclusion
In the present study, a standardized workflow for protein extraction directly from freeze-dried bacterial strains, enabling MALDI-TOF MS analysis without prior culturing, was developed and validated. Although the bacterial domain comprises more than 40 phyla, we focused on groups that are well represented in the MALDI-TOF MS reference database and that collectively span a broad continuum of cell-envelope architectures, ranging from highly robust Gram-positive bacteria to more labile Gram-negative and spiral-shaped species. 4 Other bacterial groups, such as Mycoplasmas (which lack a cell wall) and Spirochaetes (absent from the version of the MALDI-TOF MS database used here), were not included but could be evaluated in future studies.
Our results demonstrated that identification accuracy was strongly dependent on the turbidity of the bacterial suspension, measured at O.D.600. When O.D.600 exceeded 0.34, strains could be accurately identified, allowing us to define a practical quality control threshold prior to protein extraction. ROC curve analysis further confirmed the predictive value of biomass, showing very good discriminative performance (AUC = 0.89; 95% confidence interval [CI]: 0.84–0.94; z = 15.27; p < 0.0001). The ROC-associated sensitivity and specificity values for O.D.600 = 0.34 (sensitivity = 0.33; specificity = 0.98) provide a descriptive indication of the discriminatory capacity of the O.D.600 signal. This threshold, however, does not represent an optimal balance of sensitivity and specificity based on ROC analysis. In the context of this study, specificity was the most relevant performance characteristic: our objective was to identify an O.D.600 threshold high enough to ensure that any lyophilized sample exceeding it would always be successfully and accurately identified by MALDI-TOF MS. In practice, all strains with an O.D.600 above 0.34 were consistently and accurately identified. This value, however, may be lowered for easily lysed, non-aggregating organisms, as illustrated by the successful identification of C. indologenes at O.D.600 = 0.01. Below this value, failed identifications were likely due to insufficient biomass. It should be noted that the specificity obtained from the ROC analysis may differ slightly from manually calculated values, because the cut points generated by the EasyROC software do not always correspond exactly to the empirical thresholds observed in the dataset.
The O.D.600 classifier does not achieve perfect discriminatory performance (AUC < 1.0) for the fitness-for-purpose for MALDI-TOF MS; thus, some factors other than biomass may influence the fitness-for-purpose. Three parameters may be critical: (i) the structural robustness of the bacterial cell envelope, (ii) the quality and level of representation of each species in the MALDI-TOF reference database, and (iii) the culture and recovery conditions prior to lyophilization. Additional analyses would be required to confirm the impact of these parameters.
When an identification was possible, all strains were correctly identified at the species level, except for S. enterica subsp. salamae, which was misidentified as C. koseri at O.D.600 = 0.14 with a mean MALDI-TOF MS score of 1.84. This misidentification is plausible because (i) the obtained score falls within the range of low-confidence identifications and (ii) Citrobacter and Salmonella species are phylogenetically close and can therefore yield similar MALDI-TOF MS spectra. 42 The fact that the other S. enterica strain included in this study, belonging to subspecies enterica, was correctly identified at similar O.D.600 values with a higher mean score (2.1) may be explained by a better representation of S. enterica subsp. enterica in the database used.
The standardized protein extraction protocol used in this study, adapted from procedures originally developed for Mycobacterium species (Bruker MycoEx v3 43 ) was selected to maximize our chances of efficiently extracting proteins from a broad range of bacterial taxa, including those with particularly robust cell envelopes. While this protocol is relatively demanding, mechanically free extraction methods are generally sufficient for many Gram-negative and Gram-positive species, whose cell envelopes are less resilient than those of Mycobacterium species. 44 The protocol can also be adapted to specific bacterial groups using other published methods, for example, replacing formic acid with a stronger acid such as trifluoroacetic acid for members of the Streptomyces genus, which has been shown to improve protein recovery and enhance spectral reproducibility. 45
Importantly, this study highlights that O.D.600 was a reliable quality control metric for MALDI-TOF MS identification success, eliminating the need for direct cell quantification, which can be time-consuming and unreliable for autoaggregating bacteria. Because O.D.600 values can vary between spectrophotometers, we assessed our protocol using four different instruments: three single-well and one multi-well. Notable variations were observed across devices, particularly between the Eppendorf BioSpectrometer basic and the Thermo Scientific BioMate 3S. Hence, users should account for this variability when preparing bacterial suspensions for protein extraction. To ensure sufficient biomass across different equipment models, we recommend adjusting the suspension to an O.D.600 of approximately 0.7. This value accounts for the observed measurement variability, which reached up to a 2-fold difference in the case of M. catarrhalis (CIP 73.21) between the instruments tested.
In conclusion, we have shown that bacterial biobank laboratories can use MALDI-TOF MS to identify bacterial strains directly from freeze-dried material, without prior culturing. This workflow not only increases operational efficiency but also solves the occasional problem of unknown optimal cultivation conditions when culture is applied as a prerequisite to MALDI-TOF MS. We have also identified a simple and reliable quality control metric, based on the optical density of the bacterial suspension, for the successful application of this workflow.
Authors’ Contributions
M.E.G.: Conceptualization, project administration, investigation, methodology, formal analysis, validation, visualization, and writing—original draft. G.T.: Conceptualization and writing—review and editing. D.G.: Investigation and writing—review and editing. F.B.: Funding acquisition, resources, and writing—review and editing. D.C.: Formal analysis, validation, and writing—review and editing.
Footnotes
Acknowledgment
The authors thank Meriem Paris for her valuable insights and constructive comments on the preparation of this article.
Author Disclosure Statement
No competing interests are to be declared.
Funding Information
The work has been financed by the CIP.
Supplemental Material
References
Supplementary Material
Please find the following supplemental material available below.
For Open Access articles published under a Creative Commons License, all supplemental material carries the same license as the article it is associated with.
For non-Open Access articles published, all supplemental material carries a non-exclusive license, and permission requests for re-use of supplemental material or any part of supplemental material shall be sent directly to the copyright owner as specified in the copyright notice associated with the article.