
Abstract
Introduction:
Widespread implementation of Alzheimer’s disease (AD) biomarkers in research settings introduces new opportunities and challenges for managing and returning complex, multi-modal testing results to research participants.
Objectives:
To describe a structured, participant-centered biomarker data management and return of results workflow developed at a U.S. Alzheimer’s Disease Research Center (ADRC), and to provide preliminary data on participant and clinician experience with return of results.
Methods:
We developed an automated, interdisciplinary workflow to integrate multimodal biomarker data (neuroimaging, fluid, and genetics) into research consensus diagnostic conferences and individualized participant Return of Results reports. To evaluate feasibility and participant experience, we conducted a non-randomized study in which participants receiving biomarker results rated anxiety, depression, and decision regret within one week and at 3-month follow-up.
Results:
The workflow was implemented using non-proprietary tools, with semi-automated data aggregation and nightly updates. Survey data indicated statistically significant changes in anxiety and depression following biomarker return of results, though the clinical relevance of these changes remains unclear, highlighting opportunities to improve utility.
Conclusions:
Using and returning biomarker results is feasible, scalable, and well-tolerated within a research setting. This model may guide broader adoption of AD biomarker management and return of results to participants in future study designs.
Introduction
Alzheimer’s disease (AD) biomarkers are rapidly transforming diagnosis and care options.1,2 Magnetic resonance imaging (MRI), positron emission tomography (PET), and computed tomography (CT) have long been used to assist in differential diagnosis. But new blood-based biomarkers, PET-imaging radioligands, and cerebrospinal fluid (CSF) markers are on the verge of widespread research and clinical adoption.3,4
In parallel with rapid biomarker developments, many in research and clinical care are actively considering the best approaches to returning these results to patients and research participants. For example, the Advisory Group on Risk Evidence Education for Dementia (agreedementia.org) has published best practices and toolkits for engaging individuals. The need for these evidence-informed approaches is only increasing in AD research. For example, the return of biomarker results varies widely across the US network of Alzheimer’s Disease Research Centers (ADRC), 5 but is encouraged within a controlled setting, according to a set of best practices. 6 Timely incorporation of biomarker information into research operations and participant discussion is in line with current best practice guidance from the US Dept. of Health and Human Services. 7 However, challenges to these activities arise because of the asynchronous nature of resulting biomarkers, equipoise on clinical utility,8–10 and their relative novelty within the context of long-running research processes.
At the University of Kansas Alzheimer’s Disease Research Center (KU ADRC), we have been a consistent and early adopter of automated approaches to enhance the efficiency of operations related to participation in the NIA ADRC network, including the process of consensus cognitive adjudication, data management, and resource sharing.11–13 Building on this infrastructure, we have integrated biomarker data into both the diagnostic and participant-facing testing results discussion processes. In this article, we describe a structured workflow for returning multimodal AD biomarker results to participants in an ADRC-based longitudinal research cohort. We begin by detailing our active, operational system to incorporate biomarker information into our ADRC longitudinal participant cohort Consensus Diagnostic Conference (“Consensus”) 12 and participant-focused discussion (“Return of Results”). We then describe a pilot study conducted prior to the implementation of our system. Findings from this pilot directly informed the structure and timing of our approach. We also present clinician perceptions on using these biomarker testing results. We offer this approach as a potential model that may be adapted by other cohort studies and biobanks, considering the return of results across imaging, fluid, and genetic domains.
Methods
The KU ADRC is part of a national network of Congressionally designated NIH Centers of Excellence. As a member site, we contribute to a shared data resource by following standardized participant characterization and data processes defined by the National Alzheimer’s Coordinating Center (NACC). Within this framework, we have longitudinally followed a “Cohort” of about 500 active participants with and without cognitive impairment since 2011 (all-time enrolled 1292). All active ADRC Cohort participants undergo annual clinical and cognitive evaluations following NACC guidance. New participants complete four baseline visits: (1) a clinical evaluation including Clinical Dementia Rating (CDR) staging (∼2 hours), 14 (2) cognitive testing and fasting phlebotomy for biomarker testing and banking (∼2 hours), (3) brain MRI and neurovascular transcranial Doppler imaging (∼2.5 hours), and (4) an encouraged, but not required, lumbar puncture (∼1.5 hours). Annual follow-up visits consist of two components: a clinical assessment and combined cognitive testing with phlebotomy for plasma biomarkers and banking. Neuroimaging and lumbar puncture are repeated only if a cognitively normal (CN) participant transitions to impaired status (CDR > 0) to support a revised etiologic diagnosis. All interview data are entered directly into a REDCap 15 database that houses ADRC Cohort participant information. Cognitive data are captured on worksheets as appropriate for the test, then manually entered in REDCap for electronic data capture. The psychometry team cross-audits data entry for accuracy continuously.
The KU ADRC follows national imaging protocol guidance,
16
and contributes to national biorepositories such as the National Centralized Repository for Alzheimer’s Disease and Related Dementias (NCRAD: https://ncrad.iu.edu/) and the
Neuroimaging acquisition and processing
Participants enrolled in the KU ADRC Cohort undergo annual neuroimaging using a harmonized protocol consistent with the Standardized Centralized Alzheimer’s and Related Dementias Neuroimaging and ADRC Consortium for Clarity in AD Research Through Imaging (CLARiTI) 17 standards. This includes 3D T1-weighted imaging, Three-Dimensional Fluid-Attenuated Inversion Recovery (3D FLAIR), multi-shell diffusion MRI, arterial spin labeling, resting-state functional MRI, high-resolution T2 hippocampal scans (HR-Hippo), and Quantitative Susceptibility Mapping/Susceptibility—Weighted Imaging. Participants also complete vascular imaging (e.g., transcranial Doppler, pulse wave tonometry) during separate visits. PET imaging with 18F-florbetaben (amyloid), 18F-flortaucipir (tau), and 18F-fluordeoxyglucose (FDG) is acquired as part of the protocol on a convenience sample of individuals.
Neuroimaging data are processed through automated pipelines developed and maintained by the ADRC Neuroimaging Core using freely available tools customized for AD research, including CAT12, 18 SPM12, 19 and FSL. 20 Each pipeline converts data to the Brain Imaging Data Structure (BIDS) using a Heudiconv Docker image, 21 performs quality control heuristics using MRIQC, 22 and generates validated metrics within two weeks of the clinical visit, supporting both etiologic diagnosis and research analyses. Standard metrics include hippocampal occupancy score, 23 AD signature volumes, 24 regional cortical thickness and volumes, white matter lesion load (WML), amyloid and tau PET SUVRs, Centiloid scaling, and MRI vascular markers such as infarcts and microhemorrhages. Our neurovascular measures assess resting middle cerebral artery (MCA) velocity, MCA pulsatility index,25–28 and peripheral pulse wave velocity as a measure of arterial stiffness following published best practices.29,30 Key imaging values are aggregated in electronic files for automated integration into the Cohort dataset. Hippocampal occupancy, AD signature, white matter lesion load, and Centiloid value are provided at Consensus for review when available. Currently, as part of the Return of Results, participants receive only their Centiloid score, along with a representative axial and coronal T1-weighted MRI images provided solely for engagement and illustrative purposes.
Fluid biomarkers and genetics
Phosphorylated Tau 217 (pTau 217) is measured on the Simoa HD-X (Quanterix) in EDTA plasma. Amyloid β 42/40 ratio is measured on the Luimpulse G1200 (Fujirebio) in cerebrospinal fluid. Samples are analyzed by the KU ADRC Biomarker Core with appropriate calibrators and controls, adhering to Clinical Laboratory Improvement Amendment (CLIA) guidelines. Plasma and CSF results from individual participants are returned to the KU ADRC Data Management and Biostatistics Core within 12 weeks. Genotyping for apolipoprotein E (APOE) polymorphisms is performed in batches at the NCRAD laboratory. APOE genotype data is returned to the KU site securely. Mitochondrial genome sequencing is completed on all consenting participants at their baseline visit and is integrated into the Cohort database as haplotype data. Raw genome sequences are stored on a secure, cloud-based drive. After analysis, biomarker data from all platforms are processed and harmonized into a uniform format for automated import and integration with Cohort data by the KU ADRC Data Management and Biostatistics Core. APOE genotype, plasma pTau 217, and CSF amyloid β 42/40 ratio are provided at Consensus for review and to participants under consent as part of Return of Results. The mitochondrial haplotype is not yet considered clinically interpretable and not returned to participants.
Cell-based biomarkers
As a center, our thematic emphasis includes cell-based mitochondrial biomarkers. These cell-based biomarkers measure mitochondrial function using fluorescent probes and flow cytometry. 31 Measures include mitochondrial mass, mitochondrial superoxide, mitochondrial membrane potential, and apoptosis in peripheral blood mononuclear cells. These data are integrated into our Cohort database and are available for research purposes. We plan to integrate these measures into Consensus or Return of Results when they are fully validated and demonstrate clinical and diagnostic relevance.
Data capture, curation, and investigator access
Participant data are collected and managed using a secure REDCap instance hosted at the University of Kansas Medical Center, with separate application and database servers running SUSE Linux Enterprise.12,13 Access is secured through LDAP-based central authentication and role-based permissions, with all activity logged via audit trails. Multiple daily backups are performed, and institutional policies guide off-site storage and recovery procedures. Data entered in REDCap are validated through automated and manual quality control procedures and are integrated with the phenotypic, genetic, imaging, and autopsy data outlined above (see Figure 1).
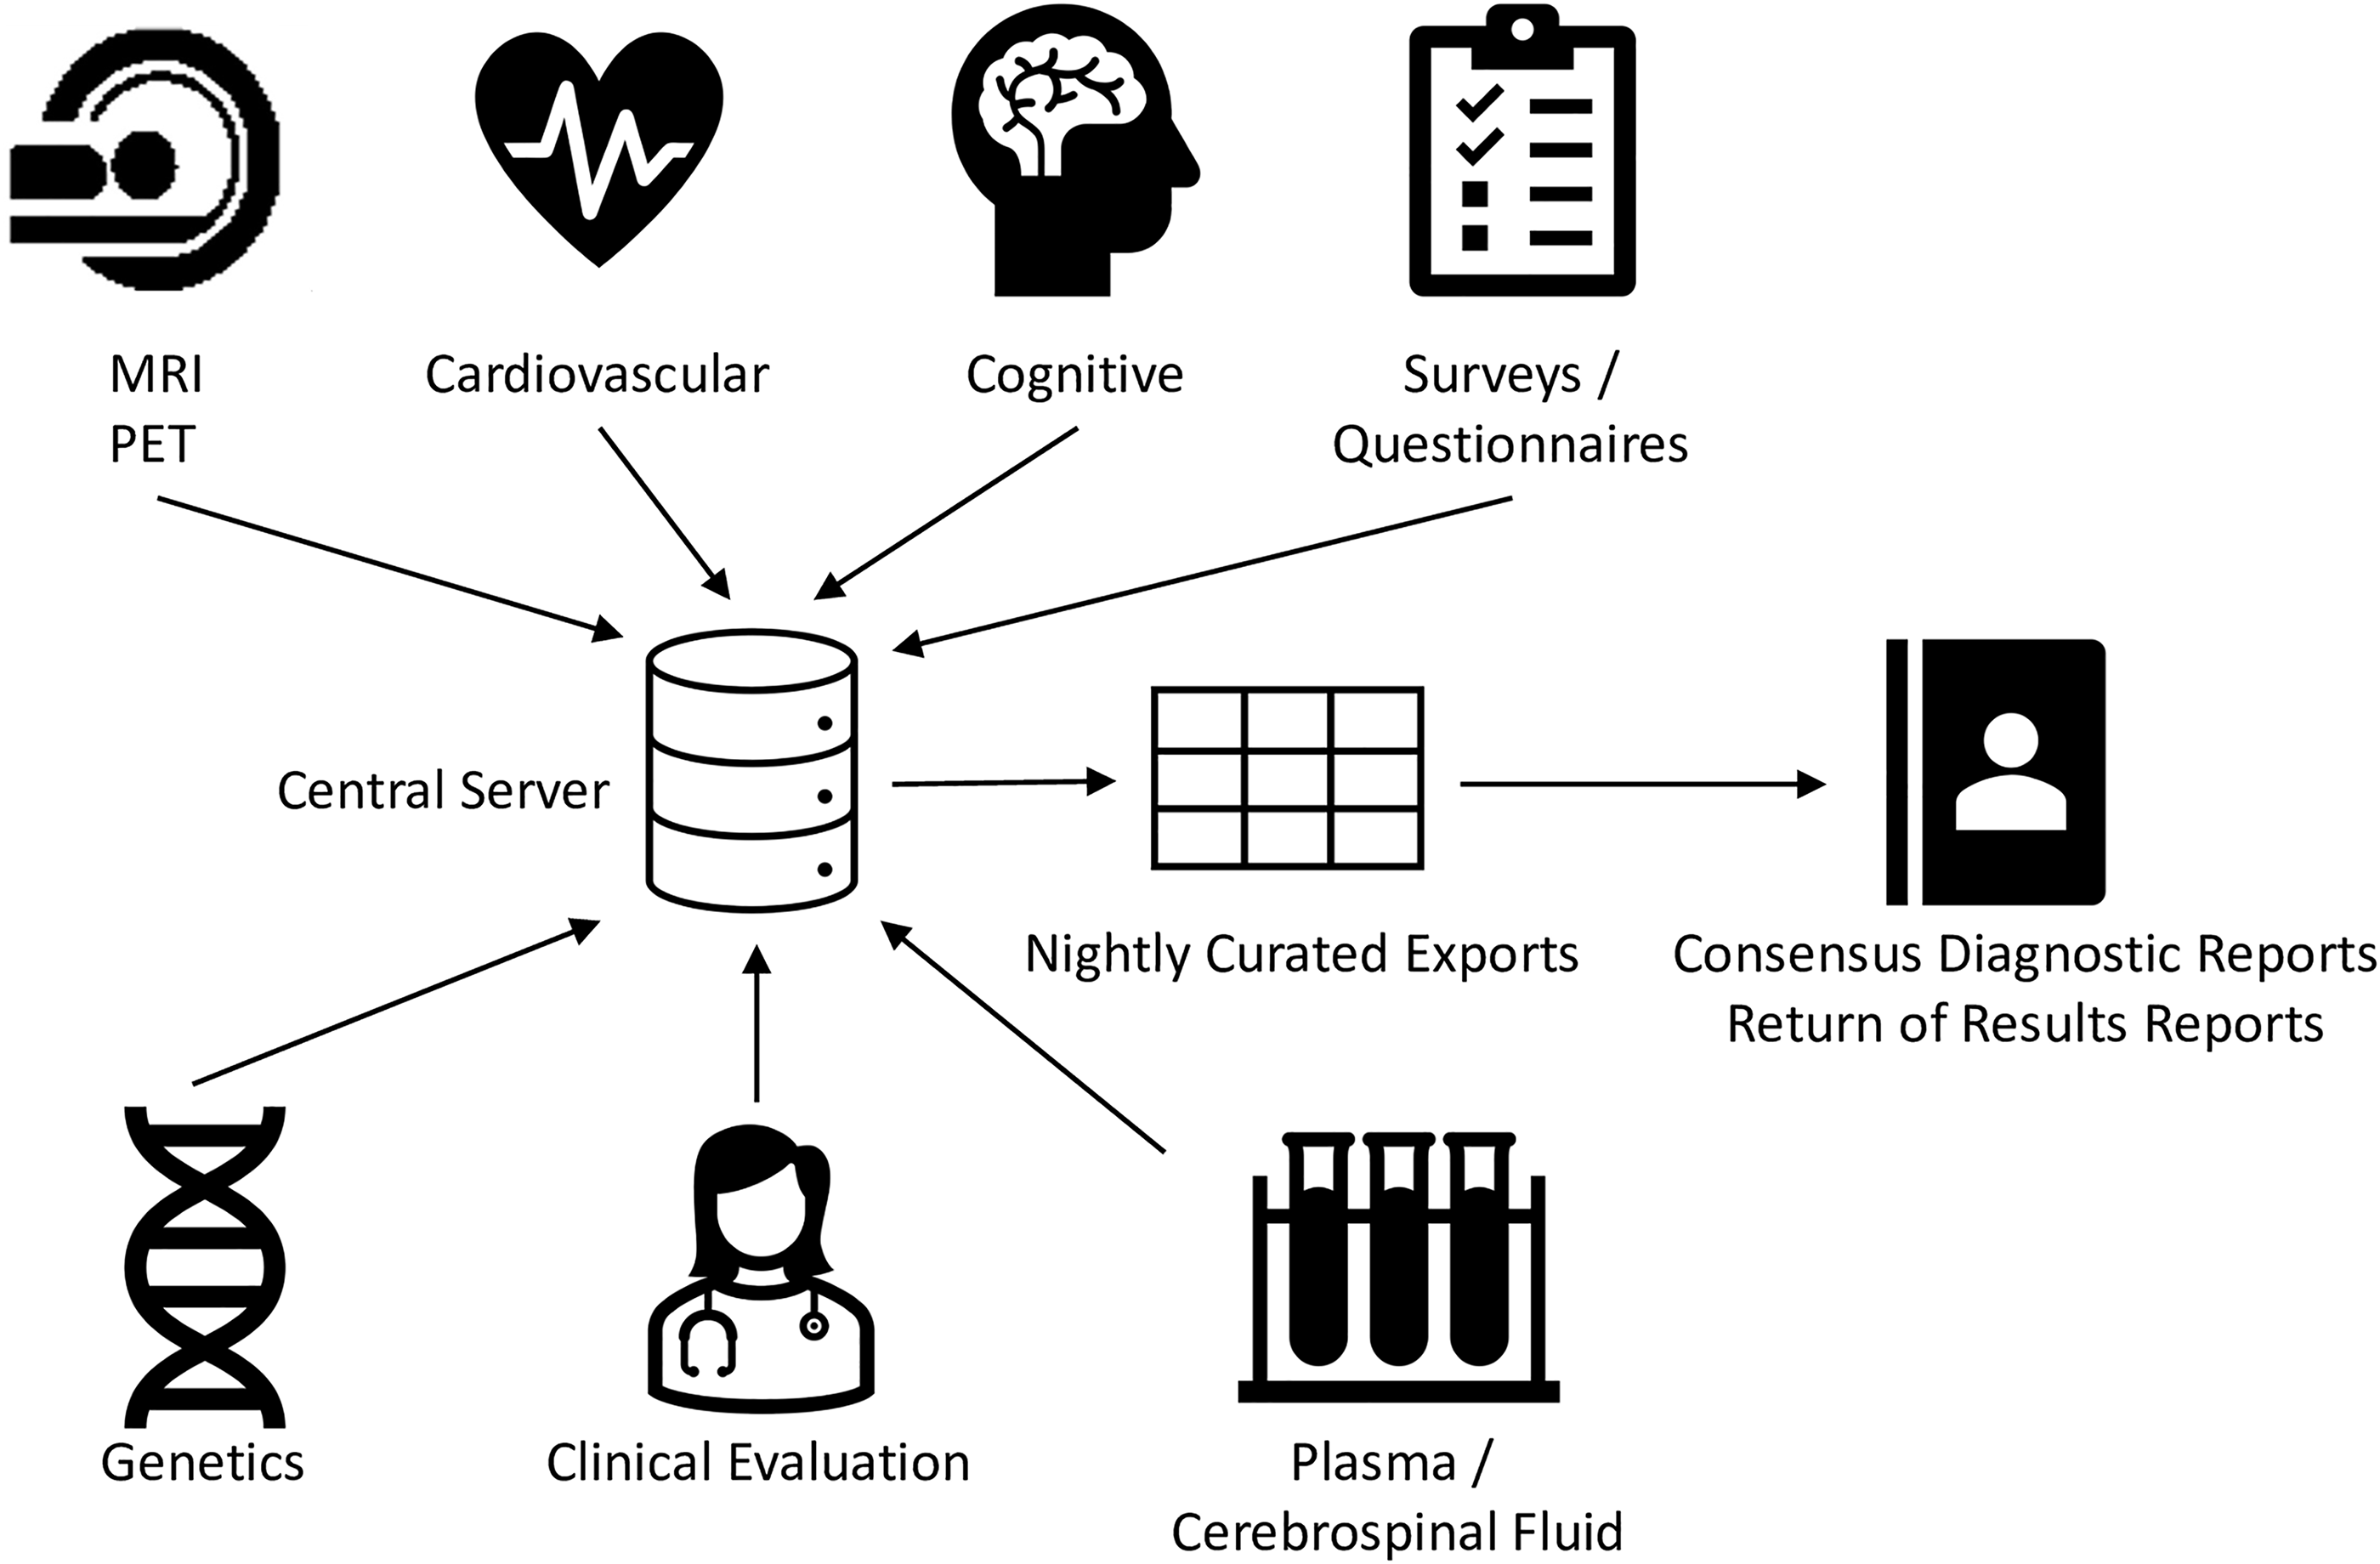
Schematic of data flow.
All neuroimaging and fluid biomarker electronic data files generated are deposited to a secure server and incorporated through an automated nightly curation pipeline that: (1) archives raw data; (2) uploads processed values into the Cohort REDCap project temporally linked to respective participants; and (3) notifies study coordinators when results are available. Data received from NCRAD undergo the same secure transfer, cleaning, and integration procedures, with a source field appended to identify the analyzing laboratory. The cleaning pipeline is periodically updated to accommodate new analytes, assays, or platforms introduced to the workflow. A primary goal of the workflow is to minimize manual interaction with data once it is collected, and to speed association of values with participant clinical data for maximally efficient integration into the Consensus diagnostic and participant Return of Results processes.
To ensure data reproducibility and manage the longitudinal nature of cohort follow-up, we maintain a curated dataset known as C3PO (Curated Clinical Cohort Phenotypes and Observations). Data curation includes initial quality checks, separation and upload of Uniform Data Set (UDS and non-UDS elements to NACC, reconciliation of post-NACC downloads, and final merging of complete records. These quarterly “data freezes” align with national standards and support backward traceability. Investigators access this curated data through structured requests, supported by an online variable catalog called R2D2 (Research Repository Data Dictionary), which documents ∼2,000 variables by name, format, and collection protocol.
Through this process, neuroimaging, genetics, plasma and CSF biomarkers, and clinical phenotype data are linked to support multimodal research. C3PO is provided nightly in a data export process that is accessible to approved users and for automated document assembly to support Consensus and Return of Results. Our data exports include flags and checks to only produce participant-facing reports when a participant has opted to receive them. Data may be used for Consensus adjudication prior to completion of NACC vetting after passing KU ADRC quality control. During Return of Results, we present NACC-affirmed values when available.
Consensus diagnosis conference process
The weekly Consensus Diagnostic Conference to adjudicate research participant cognition includes clinicians (i.e., physicians and advanced practice providers), neuropsychologists, nurses, psychometrists, and approved learners. We follow a standardized 3-step process aligned with the UDS4 framework: (1) CDR staging based on history alone; (2) syndromic classification using cognitive testing to determine status (CN, MCI, impaired not MCI, dementia) and clinical subtype (UDS Form D1a); and (3) etiologic diagnosis incorporating biomarker data, aligned with the 2024 NIA-AA Research Framework (UDS Form D1b). All diagnoses are based on unanimous agreement; in the rare case of disagreement, the evaluating clinician’s judgment prevails.
To facilitate the Consensus process, we have written custom code in R 32 to aggregate all relevant pieces for consideration into a single document per participant assembled from available C3PO data weekly via an automated script, or manually via a Shiny webapp.11–13 The document includes a synopsis of the most recent CDR, up to 10 years of past cognitive testing, including site-developed normative and percentile values for each cognitive test, and, since mid-2024, a date-organized table of hippocampal occupancy score, AD signature, total gray matter volume, APOE genotype, plasma pTau217, and CSF amyloid β 42/40. We have plans to integrate a dynamic image viewer to allow review of multi-modal brain imaging during the conference.
All constituent parts of the Consensus report are derived from C3PO and arranged in a manner that supports the case presentation for Consensus (see Supplementary Data S2). Currently, the Consensus Conference process happens 16 weeks after the CDR visit. This allows sufficient time for cognitive data to entered and vetted, and for biomarker analysis.
Return of results to participants
We return test results to participants annually through a personalized “Brain Health Report” that the clinician-written impression and percentile ranges for cognitive domain test scores for up to the last 5 years, key biomarker findings (blood and CSF), and neuroimaging (MRI, PET). When available, blood pressure, physical activity and sleep ratings are provided along with healthy lifestyle recommendations (see Supplementary Data S3 for a full example). Reports use consistent language regardless of impairment status, differing only in the inclusion of available result elements. This Return of Results process supports participant autonomy and study retention, and has served as the model for the CLARiTI 17 and Alzheimer’s Biomarker Consortium—Down Syndrome studies. 33
Biomarkers selected for Return of Results were chosen based on (1) analytic and clinical validity, (2) relevance to current diagnostic frameworks, and (3) interpretability within a clinical discussion. Measures that remain exploratory or lack established clinical thresholds (e.g., mitochondrial biomarkers) are intentionally excluded from participant return. Biomarkers are interpreted in the context of the clinical impression and other testing results.
Like the Consensus report process, Brain Health Reports for Return of Results are assembled from available C3PO data via an automated weekly script, or manually via a Shiny webapp. Future versions of our process will allow a clinician to interactively select an image to display on the report. Brain Health Reports are printed, and a neurologist or advanced practice provider reviews it in person with participants at the next annual CDR assessment. One exception is that if there is an actionable finding, such as clinically relevant cognitive symptoms with biomarker evidence of elevated brain amyloid, that warrants more immediate clinical exploration and possible treatment discussion. These discussions are scheduled at the participant and team’s earliest availability.
Participants may opt out of Return of Results, in which case, no discussion of testing results beyond a summary at the time of the CDR visit occurs with the clinician. Anecdotally, clinicians report that Return of Results discussions add approximately 20–30 minutes to the end of a CDR visit and therefore represent a substantial time and operational investment.
Evaluating biomarker return of results discussions—a pilot study
Our understanding of participant perceptions of AD biomarkers remains poorly characterized, despite their growing use in both clinical and research environments. 5 Before the full implementation of our described infrastructure for integration of emerging biomarkers into research operations, we performed a small study to assess participant perspectives on receiving biomarker results from the research they were participating in for the KU ADRC Cohort. We then used these results to inform the process outlined above.
The study was presented to all participants enrolled in the ADRC Cohort who completed neuropsychological testing and had at least one AD biomarker (e.g., MRI, lumbar puncture, blood-based markers, or amyloid PET; KU Medical Center Institutional Review Board study protocol #11132). Participants were screened using the Geriatric Depression Scale–Short Form (GDS), 34 and the State subscale on the State-Trait Anxiety Inventory (STAI). 35 Those who scored >6 on the GDS or >54 on the STAI engaged in additional study discussion with a study clinician prior to enrollment. For those interested in the return of biomarker results, institutionally approved, written, informed consent was obtained under study protocol #147324. Participants were then scheduled for a separate visit during which a neurologist or advanced practice provider reviewed their Brain Health Report, including the clinical impression and cognitive testing, and all available APOE genotype, imaging (MRI, PET), CSF, blood (e.g., plasma pTau217), vascular (e.g., blood pressure, BMI, arterial stiffness) risk factors described above. Participants completed the GDS and STAI, prior to Return of Results, within 7 days after Return of Results, and 3 months after Return of Results. The Decision Regret Scale (DRS) 36 was administered 7 days and 3 months after the Return of Results. Surveys were administered electronically at all timepoints. Baseline scores were compared with test minimums using t-tests. Repeated-measures analyses for 7-day and 3-month surveys were conducted in R (v4.4.1) using linear mixed-effects models (lmerTest package), with timepoint as a fixed effect and participant ID as a random effect. All available data was used. Table 1 summarizes responses.
Participant Experience with Return of Results
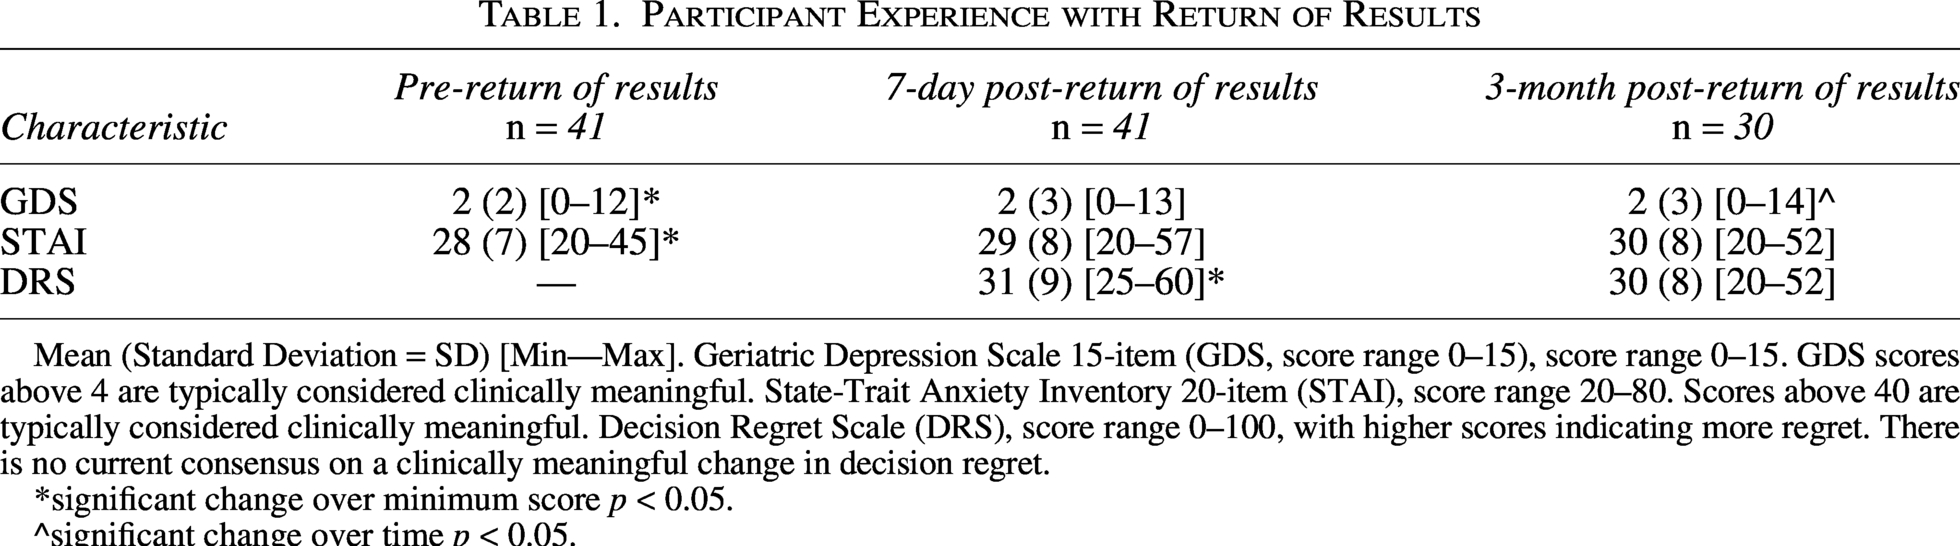
Mean (Standard Deviation = SD) [Min—Max]. Geriatric Depression Scale 15-item (GDS, score range 0–15), score range 0–15. GDS scores above 4 are typically considered clinically meaningful. State-Trait Anxiety Inventory 20-item (STAI), score range 20–80. Scores above 40 are typically considered clinically meaningful. Decision Regret Scale (DRS), score range 0–100, with higher scores indicating more regret. There is no current consensus on a clinically meaningful change in decision regret.
*significant change over minimum score p < 0.05.
^significant change over time p < 0.05.
Forty-one participants consented to participation and completed the battery within 7 days of Return of Results, and 38 completed the questionnaire battery at 3 months. Participants had an average age of 75 (SD 8), and 59% were men. Seven participants had no cognitive impairment, while the remaining 34 had a CDR of 0.5 or 1. The average DRS was greater than the minimal score (scale minimum 0) in the first 7 days following the results discussion (mean 32, SD 9, p < 0.001), with average ratings between “Strongly Disagree” and “Neither Agree nor Disagree” regarding regret of the decision to learn biomarker results. At the 3-month follow-up, decision regret remained essentially the same (p = 0.09).
Prior to Return of Results, the average depression score was greater than zero (p < 0.001) but below the threshold for clinically concerning depressive symptoms (GDS < 5) for 38 of the 41 enrollees. No significant change in depression was observed within the first 7 days following the results discussion (p = 0.21). By the 3-month follow-up, there was a small but significant increase in GDS scores (p = 0.04), indicating a slightly delayed rise in depression symptoms over time.
The average anxiety score (STAI) was above the minimum score of 20, but generally low prior to the discussion of biomarker results (p < 0.001). There was no significant change in the first 7 days following the return of results (p = 0.12), or at the 3-month follow-up (p = 0.16). Visit notes from staff and clinicians did not reveal a common theme for the cause of increased anxiety.
Clinician perspectives
Four licensed clinician researchers, who had participated in at least 5 research Consensus Diagnosis Conferences within the last year, were asked to rate the frequency with which they considered biomarkers in their final diagnostic impression during the case presentation and discussion using a 5-item Likert scale (0 = Never: 4 = Always). To evaluate additional perspectives on the use of biomarkers, clinicians rated their agreement with six statements using a 5-point Likert scale (1 = Strongly Disagree: 5 = Strongly Agree). Items were developed by the research team and assessed perceived diagnostic value, consistency of interpretation across team members, perceived training adequacy, and the ease and timeliness of incorporating biomarker data into diagnostic deliberations.
Across the four respondents, biomarkers were rated as being frequently integrated into diagnostic impressions when available, with amyloid PET (mean = 3.75, range: 3–4), CSF Aβ (mean = 3.50, range: 2–4), and plasma pTau-217 (mean = 3.75, range: 3–4) receiving consistently high ratings. Use of structural MRI was more variable (mean = 3.00, range: 1–4).
Clinicians strongly agreed that biomarkers enhance diagnostic confidence (mean = 5.00, range: 5–5). High levels of agreement were also observed for the following items: biomarkers are well-integrated into the diagnostic process (mean = 4.75, range: 4–5), interpretation is consistent across team members (mean = 4.75, range: 4–5), inclusion adds value even in straightforward cases (mean = 4.50, range: 4–5), clinicians feel adequately trained to interpret biomarkers (mean = 4.25, range: 3–5), and biomarker data were incorporated quickly into my diagnostic approach (mean = 4.00, range: 3–5).
For the Return of Results component, three clinician respondents indicated experience with discussing these reports. Among them, responses suggested general agreement that the biomarker content was appropriate (mean = 4.33, range: 4–5), clearly presented (mean = 4.00, range: 3–5), and helpful for participants to understand their cognitive health (mean = 4.33, range: 4–5). Respondents also reported being comfortable explaining the results to participants (mean = 4.33, range: 4–5).
Comments from the clinicians highlighted interest in including additional biomarkers as they become available (e.g., tau PET, FDG-PET, α-synuclein), improving data access during Consensus Diagnostic Conferences (e.g., direct MRI review), and further enhancing the clarity of the Brain Health Reports through participant-centered input. Based on their experiences, clinicians at the KU ADRC have compiled a list of “talking points” to support Return of Results discussions with participants (see Supplementary Data S4).
Discussion
Our primary objective with this article is to describe an operational framework for biomarker return of results. As we have done in the past, we also measured the experience and reaction of participants to learning their AD biomarker status in a research setting, to inform the safety and risks once these tools are deployed in a clinical setting. 37 The perspectives of clinician researchers interacting with this data were also considered. Overall, we found that Return of Results was associated with minor increases in depression and anxiety. Participants reported satisfaction with their decision to receive results and did not experience overt negative psychological consequences three months after the discussion. Clinicians were also welcoming of the biomarkers in their research diagnoses and for enriching their conversations with participants. Importantly, the Return of Results is designed to align with existing guidance on the disclosure of individual research findings. All disclosed biomarkers are derived from established analytic pipelines and quality control procedures prior to integration and are interpreted within a multidisciplinary consensus process before being communicated by experienced clinicians. For example, our biomarker core adheres to CLIA guidelines and participates in a number of quality control initiatives to ensure the validity of research results. This approach was intended to ensure that returned results met a threshold of analytic and clinical validity appropriate for return to participants.
Documenting comprehensive approaches to biomarker data collection, curation, and return is essential for advancing transparency, reproducibility, and scalability in AD research. There is a growing consensus that study participants should have the option of learning their research results, PMID, and that disclosing research results can be done ethically.38,39 As the field moves toward broader implementation of biomarker-informed diagnosis and care, sharing practical infrastructure, such as data management pipelines, return of results protocols, and clinical workflow integrations, can help other centers anticipate and overcome logistical, ethical, and analytical challenges. Our hope in publishing our method for collecting, handling, and using the results of biospecimens and digital participant data is to enable more effective collaboration, resource sharing, and cross-study comparisons, ultimately accelerating progress toward earlier detection and personalized treatment strategies. These tools are available at no cost and have been shared directly with multiple ADRC sites upon inquiry.
Although developed within an ADRC, leveraging an observational research cohort, we believe workflows such as this are applicable to biobanks, clinics, and other longitudinal cohort studies. In this context, the coordinating center or biobank functions as a central facilitator, responsible for aggregating multimodal data and ensuring quality control. In partnership with clinicians and patient representatives, these central facilitators should also lead in generating participant-facing summaries. Our semi-automated pipeline and standardized reporting structure demonstrate how imaging, fluid, and genetic biomarkers can be integrated and returned in a scalable and reproducible manner. In settings without clinical or informatics teams, new partnerships with external clinicians or experienced data managers may be required to support appropriate interpretation and operations.
This work aligns with the broader goals of open science and the FAIR principles—ensuring that data are Findable, Accessible, Interoperable, and Reusable. 40 By detailing our processes for biomarker collection, data curation, quality control, and return of results, we promote transparency and reproducibility in AD research. The development of curated datasets (e.g., C3PO) and metadata tools (e.g., R2D2) supports data discoverability and informed use, while harmonized acquisition protocols and structured workflows facilitate interoperability across studies and sites. Moreover, our procedures for data extraction, investigator support, and reproducible analysis enhance the reusability of both raw and derived data. In designing our system, we’ve been conscious of maintaining flexibility as new biomarkers emerge, such as our mitochondrial function markers.
Our preliminary work also supports and extends the findings of prior studies that individual results discussions are both safe and appreciated,37,41,42 though there are consistent mild negative responses to adverse results.41,43 We believe there are several reasons for the generally positive ratings given to the results discussion. First, consistent with NACC guidance, we relied on an experienced clinician to facilitate all discussions. This limited uncertainty in interpretation and maximized the immediacy of trusted information. Though this could be considered a potential limitation, as our site is dependent on an experienced and willing clinician to support discussion of biomarker results. Second, during the design of the Brain Health Report, we maintained continuous consultation with our Community Advisory Board (CAB), a group of non-expert community members organized to inform the content and design of the materials. The report was developed iteratively, returning to the CAB multiple times to refine the document. This resulted in a more professional and credible report that aligned with community values and needs. Patient empowerment and centering in the research experience is critical, and we believe this approach positively influenced the results discussions.44–46
Our small, research-based sample may limit generalizability and preclude analysis of how participant responses vary by the specific nature of disclosed results, which were heterogeneous and difficult to classify as uniformly “positive” or “negative.” Furthermore, we did not design our study to examine which biomarkers, advanced education, or participant characteristics would be predictive of a negative psychological response to the return of results. While the individualized nature of the Return of Results discussions, and the inconsistent biomarker availability, introduce analytic variability, these factors represent a more ecologically valid experience. However, participant ratings may also be influenced by social desirability or familiarity with ADRC staff. Another limitation is that we were unable to objectively measure the impact of biomarkers on the consensus diagnostic process. Ongoing studies of biomarker return of results will further address these questions. 14 Finally, participants in a cohort often have concurrent relationships with clinician researchers who have both clinical and research roles; however, the Consensus Diagnostic Conferences and Return of Results described here occurred entirely within a research framework, governed by study-specific consent and protocols, and distinct from routine clinical care. While some biomarker findings may overlap with clinically valuable information and indeed can be shared across that division with consent, participation in the cohort provided structured, longitudinal, and multimodal integration of results that is not yet widely available in many clinics. A long-term goal is to translate these processes into clinical workflows, including integration with the electronic medical record.
In summary, we investigated participants’ experiences and reactions to learning about their AD biomarker status in a research setting. The results discussions led to minimal changes in participants’ depression and anxiety, consistent with prior reports, and were generally well received. We thus built out our biomarker data collection, curation, and use infrastructure for our entire ADRC. While our small, research-embedded study may limit the generalizability of our findings, the individualized nature of the discussions and the variability in biomarker availability reflect a realistic approach to potential clinical applications of results return discussions. Further study at a larger scale, especially within the clinical setting, is warranted.
Authors’ Contributions
Conceptualization: E.D.V., J.D.M., J.K.M., H.M.W., A.A., R.A.H., S.A.B., A.B., A.P., J.P.-P., S.L.H., J.B., A.K.A., S.A.F., K.C., J.M.B. and R.A.T. Methodology: E.D.V. and J.D.M. Formal analysis: E.D.V., J.D.M., J.K.M., H.M.W., A.A., R.A.H., S.A.B., A.B., A.P., J.P.-P., S.L.H., J.B., A.K.A., S.A.F., K.C., J.M.B. and R.A.T. Investigation: E.D.V., J.D.M., J.K.M., H.M.W., A.A., R.A.H., S.A.B., A.B., A.P., J.P.-P., S.L.H., J.B., A.K.A., S.A.F., K.C., J.M.B. and R.A.T. Data curation: E.D.V., J.D.M., J.K.M., H.M.W., R.A.H., S.A.B., A.B., A.P., S.L.H., J.B., J.M.B. and R.A.T. Resources: J.M.B., J.D.M., J.K.M., H.M.W. and R.A.H. Writing—original draft: E.D.V., J.D.M., J.K.M., H.M.W., A.A., R.A.H., S.A.B., A.B., A.P., J.P.-P., S.L.H., J.B., A.K.A., S.A.F., K.C., J.M.B. and R.A.T. Writing—review and editing: E.D.V., J.D.M., J.K.M., H.M.W., A.A., R.A.H., S.A.B., A.B., A.P., J.P.-P., S.L.H., J.B., A.K.A., S.A.F., K.C., J.M.B. and R.A.T. Visualization: E.D.V. Project administration: E.D.V., R.A.T. and K.C. Funding acquisition: J.M.B., J.K.M., H.M.W., R.A.H. and J.D.M.
Ethical Considerations
The Institutional Review Board at the University of Kansas Medical Center approved our study (approval: STUDY#00147324) on November 11, 2023.
Consent to Participate
Respondents gave written consent with signature before starting the study.
Consent for Publication
Consent included a statement of intent to publish de-identified data. The article contains no identifiable information, images, or recordings.
Data Availability
The authors will make data available upon reasonable request.
Footnotes
Author Disclosure Statement
The authors declare no conflicts of interest related to the article.
Funding Information
This study was funded in part by the National Institutes of Health through
Supplemental Material
Supplemental Material
Supplemental Material
Supplemental Material
References
Supplementary Material
Please find the following supplemental material available below.
For Open Access articles published under a Creative Commons License, all supplemental material carries the same license as the article it is associated with.
For non-Open Access articles published, all supplemental material carries a non-exclusive license, and permission requests for re-use of supplemental material or any part of supplemental material shall be sent directly to the copyright owner as specified in the copyright notice associated with the article.