
Abstract
Objective
To evaluate perioperative changes in anatomical parameters related to patellofemoral biomechanics, as well as cartilage repair outcomes following additional arthroscopic marrow stimulation for full-thickness trochlear cartilage defects (TCDs) during medial open-wedge high tibial osteotomy (MOWHTO).
Design
A total of 38 patients (38 knees) who underwent arthroscopic marrow stimulation (microfracture or microdrilling) for TCDs combined with MOWHTO were retrospectively reviewed. The mean follow-up period was 27.0 months. Three-dimensional measurements of parameters associated with patellar biomechanics were performed. Magnetic resonance imaging and second-look arthroscopy were used to assess repaired cartilage, using Magnetic Resonance Observation of Cartilage Repaired Tissue (MOCART) knee score and International Cartilage Repair Society Cartilage repair assessment (ICRS CRA).
Results
In 3-dimensional measurements, the tibial tubercle-trochlear groove (TT-TG) distance was maintained (mean difference: –0.6 mm, P = 0.227), whereas the modified Q-angle significantly decreased (mean difference: –1.9°, P = 0.002). The distal femur-distal tibial rotation (DF-DTR) decreased, indicating internal rotation of the distal tibial segment (mean difference: –5.3°, P < 0.001). TT-TG distance was associated with DF-DTR (r = 0.583, P = 0.001). Arthroscopic marrow stimulation for TCDs showed favorable cartilage repaired tissue, especially for the microdrilling group (median MOCART score, 70; ICRS CRA grade 1-2, 82.8%).
Conclusion
The 3-dimensionally measured TT-TG distance was maintained after MOWHTO and was associated with internal rotation of the distal tibial segment below the osteotomy site. Arthroscopic marrow stimulation for TCDs in patients undergoing MOWHTO achieved favorable cartilage repaired tissue in short term.
Keywords
Introduction
Medial open-wedge high tibial osteotomy (MOWHTO) is widely recognized as an effective treatment that transfers load from the medial compartment to the lateral side in patients with medial compartment osteoarthritis, offering promising short to long-term outcomes.1-5 Despite the benefits, MOWHTO inevitably alters the patellofemoral (PF) biomechanics.6-9 This includes a predictable reduction in patellar height due to joint line elevation, 8 as well as an increase in the Q-angle and tibial tubercle-trochlear groove (TT-TG) distance resulting from valgus realignment.7,10 Such biomechanical changes may disrupt patellar tracking and elevate PF contact pressure.7-9 However, recent studies suggest that while PF cartilage defects or osteoarthritis may deteriorate following MOWHTO, these changes do not necessarily correlate with poorer clinical outcomes.11-14 Thus, performing MOWHTO in patients with pre-existing PF cartilage defects is currently considered acceptable. 15 Nevertheless, there is a lack of studies evaluating the outcomes after concurrently addressing PF cartilage defects during MOWHTO. Given the biomechanical changes induced by MOWHTO,6-9,16 the long-term efficacy and sustainability of concurrent cartilage repair procedures remain uncertain.
Three-dimensional (3D) analysis is currently employed for assessing alignment or rotational changes after various procedures in the orthopedic fields.17,18 It remains unclear whether PF parameters, which are thought to worsen after MOWHTO conventionally, actually change negatively when evaluated in 3D. This uncertainty persists because most prior studies relied on simple radiographs or two-dimensional (2D) images. In this study, the authors devised methods to measure these parameters in 3D and compared them before and after surgery in patients who underwent MOWHTO combined with trochlear marrow stimulation procedures. Arthroscopic marrow stimulation is an inexpensive, convenient option for additional cartilage procedures during MOWHTO. 19 Trochlear cartilage defects (TCDs) can undergo marrow stimulation using only one additional portal. Therefore, the authors performed marrow stimulation for TCDs during HTO, and the outcomes were analyzed in this study.
This study aimed to evaluate perioperative changes in anatomical parameters related to PF biomechanics, as well as clinical and cartilage repair outcomes following additional arthroscopic marrow stimulation for full-thickness TCDs during MOWHTO. The hypothesis was that 3D analyses would reveal no significant changes in anatomical parameters and that marrow stimulation would result in favorable cartilage defect fillings in short-term follow-up.
Methods
Patient Selection
This case-series study retrospectively reviewed data from patients who underwent MOWHTO between March 2015 and August 2022. Only patients who received arthroscopic marrow stimulation (microdrilling or microfracture) for TCDs were included. Patients who underwent double-level osteotomies were excluded. Surgical indications for MOWHTO included: (1) relatively young age (<65 years) and the presence of medial knee pain refractory to conservative treatment for at least 3 months; (2) medial compartment osteoarthritis with varus alignment (mechanical tibiofemoral angle > varus 5°); and (3) good range of motion (arc of motion >100° and flexion contracture <15°) without joint instability. Surgical indications for marrow stimulation for TCDs were: (1) a near-full-thickness defect ≥ International Cartilage Repair Society (ICRS) Grade 3B and (2) symptoms related to PF joint issues, such as anterior knee pain, worsened pain on stairs, or pain during specific activity (e.g., deep squats, kneeling, and prolonged sitting). Microfracture was initially performed during the earlier period of the study; in March 2019, microdrilling was adopted with modifications to the marrow stimulation techniques based on insights from previous literature.20,21 Ethical approval was obtained from the institutional review board. Due to the retrospective design and minimal associated risk, the requirement for patient consent was waived with the approval of the institutional review board.
Surgical Procedures and Rehabilitation Protocol
The biplanar MOWHTO and additional arthroscopic procedures were performed by a single orthopedic surgeon. The surgical procedures for MOWHTO and the postoperative rehabilitation protocols followed previously reported methods. 2 Arthroscopic procedures, including the marrow stimulation, were performed prior to MOWHTO. The tibial tubercle osteotomy for biplanar MOWHTO was performed in the conventional upward-oriented fashion.
The surgical procedures for arthroscopic marrow stimulation were as follows. An additional central transpatellar tendon portal was created for direct access to cartilage defects during the preparation and subsequent microdrilling or microfracture procedures. The cartilage defects were prepared using the anteromedial, anterolateral, and central portals interchangeably as working and viewing portals. Vertical walls were created at the defect edges with an arthroscopic gouge, and the calcified cartilage layer was removed using a curette and an arthroscopic shaver. Marrow stimulation was performed after meticulous preparation of the cartilage defect.
For the microfracture procedure, subchondral perforations were created with an arthroscopic awl (Arthrex, Naples, FL, USA) ( Fig. 1D ) at 2-3 mm intervals, with a width of 2-3 mm and a depth of 5-8 mm. During the microdrilling procedure, perpendicular subchondral bone perforations were performed at the closest intervals (1-2 mm) to avoid overlapping drill holes and prevent wall collapse ( Fig. 1B ). A 1.5-mm drill bit (ECT Internal Fracture Fixation Drill Bits; Zimmer Biomet, Warsaw, IN, USA) was used ( Fig. 1D ) with a guide (B-IP-1512; Bioretec Ltd., Tampere, Finland) for precise control. The depth of subchondral penetration was 13-15 mm ( Fig. 1E ).
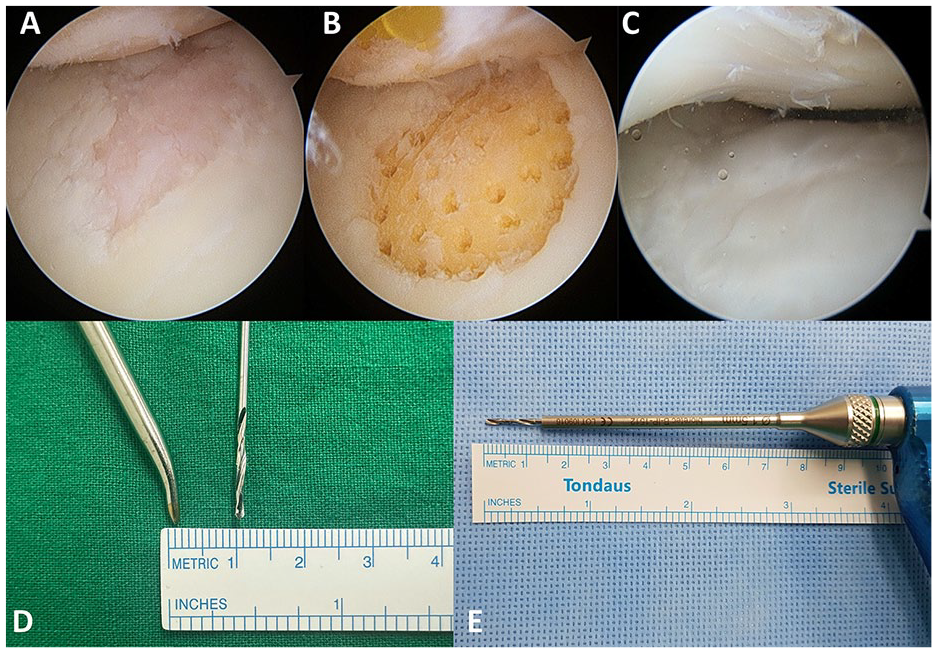
Arthroscopic microdrilling procedures. (
The rehabilitation process was consistent with general post-MOWHTO rehabilitation protocols. Patients were instructed to begin crutch-assisted, partial weight-bearing ambulation postoperatively. Knee range-of-motion exercises were initiated with a hinged knee brace, starting at 0-60° and increasing by 30° every 2 weeks. By 6 weeks postoperatively, all patients were encouraged to discontinue the use of crutches and the hinged knee brace.
Three-Dimensional Measurement of Factors Associated With Patellofemoral Biomechanics
Computed tomography (CT) scans (Siemens Healthcare, Erlangen, Germany) of patients’ knee joints, proximal femurs, and distal tibias were obtained. Digital imaging and Communications in Medicine (DICOM) CT scan data were extracted from the Picture Archiving and Communication System (GE Medical Systems Information Technologies, Milwaukee, WI, USA). DICOM data were imported into Mimics software (version 17.0; Materialize, Leuven, Belgium), a semi-automated tool capable of segmenting the 3D volumetric model of the lower extremity. All patients’ preoperative and postoperative CT images were 3D-reconstructed for assessments. All 3D measurements were performed using the 3-matic software (version 13.0; Materialize, Leuven, Belgium).
Notably, most 3D measurements were performed using planes generated from the femur as a reference. After forming the sphere that best fit the femoral head, the sphere’s center was indicated as the femoral head center (FHC) ( Fig. 2A ). The centers of the best-fitting spheres of the medial and lateral femoral condyles were created. The coronal femoral plane was created using the 3 points: the FHC and the centers of the fitting spheres of both femoral condyles ( Fig. 2B ). The distal femur center (DFC) was determined by selecting the midpoint of the intercondylar notch. The sagittal plane of the femur was defined as the plane passing through the FHC and DFC and perpendicular to the coronal plane of the femur. The axial plane of the femur was defined as the midplane of the FHC and DFC ( Fig. 2C ).
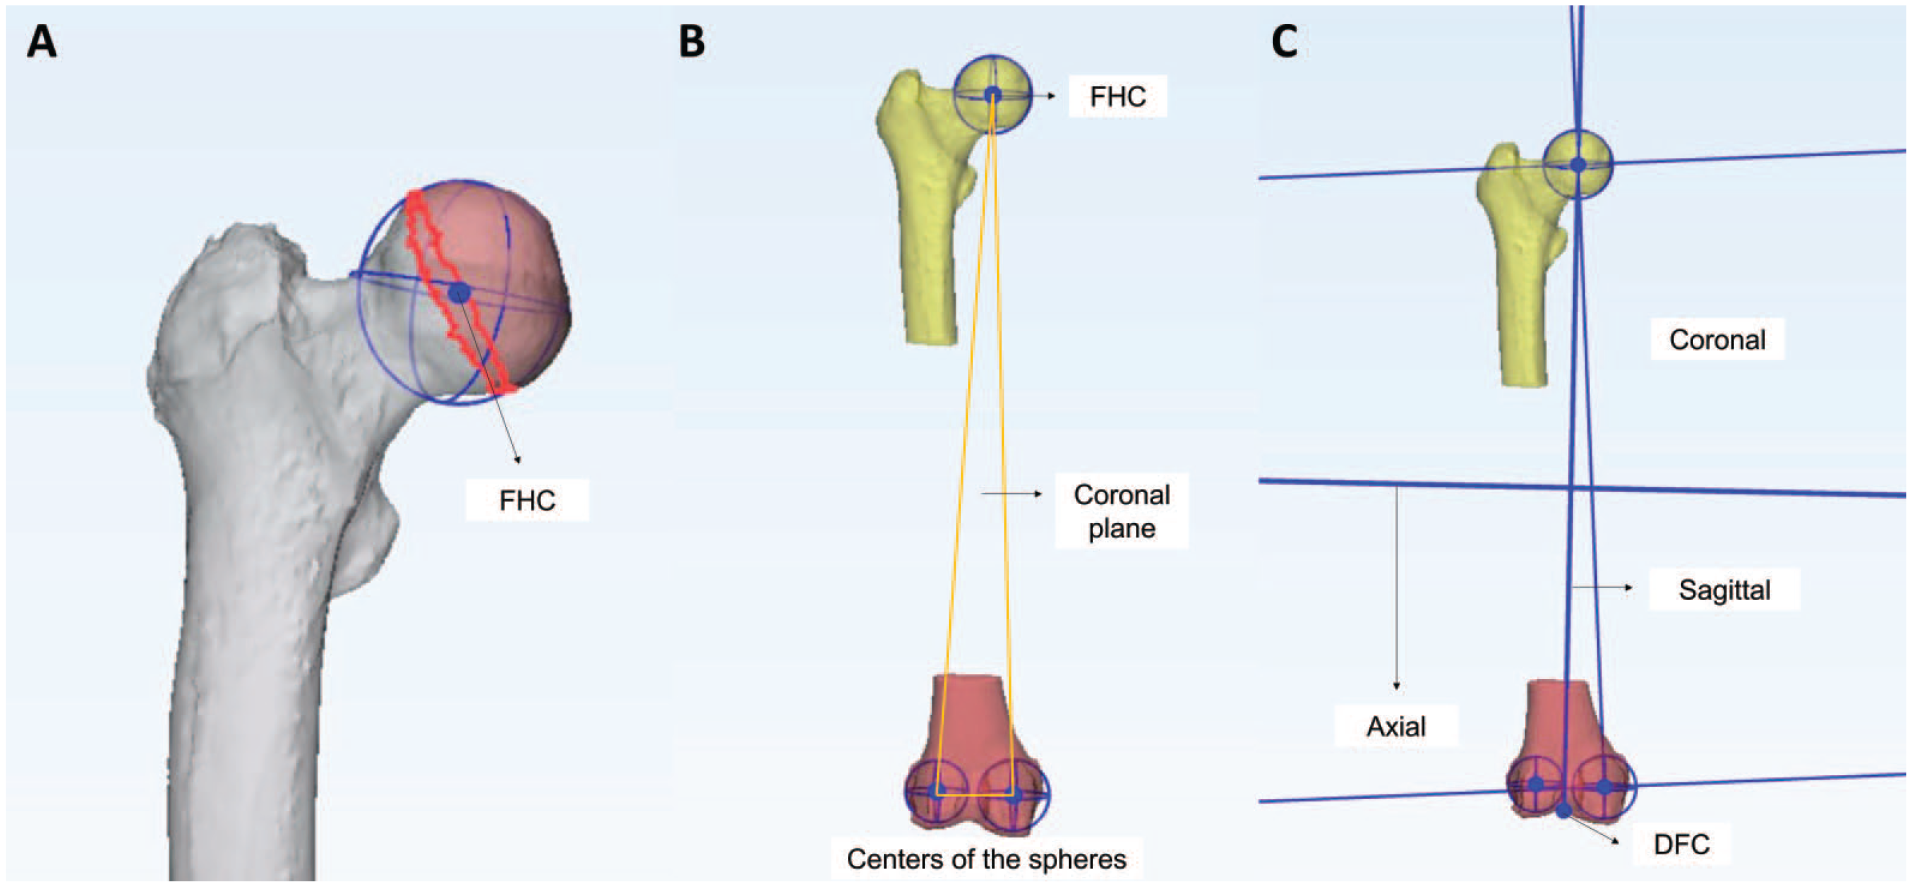
Determination of femoral head center (FHC) and the femoral planes (coronal, sagittal, axial) for 3-dimensional measurements. (
Patellar height was 3D-measured using a modified BPI (
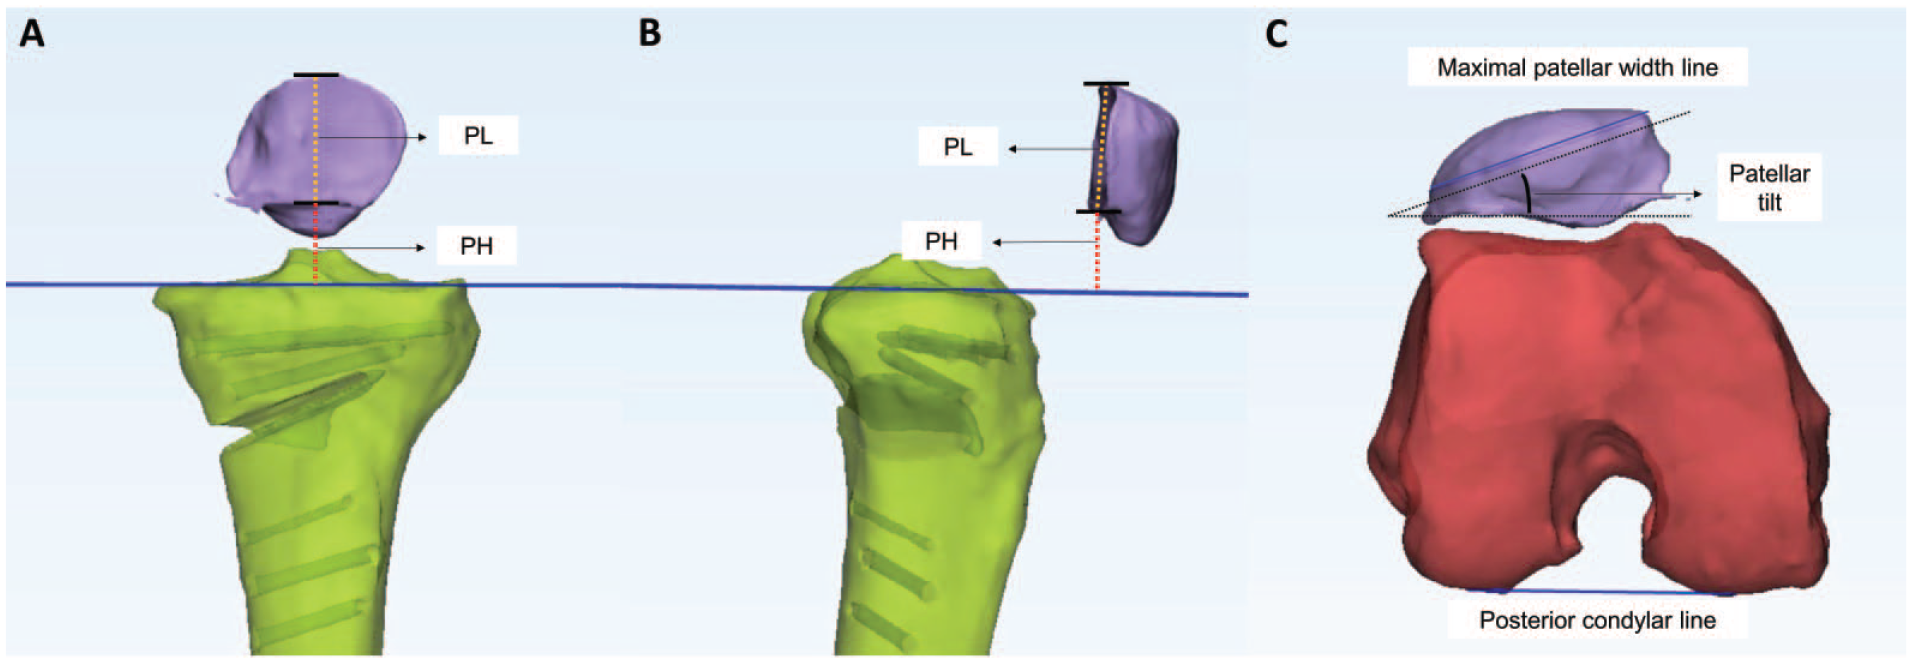
Three-dimensional measurement of patellar height and tilt. (
The TT-TG distance was measured with respect to the femoral planes ( Fig. 4A ). The TG’s deepest point and the TT’s most prominent point were selected. Two sagittal planes that passed through each point (TT and TG) and were perpendicular to the coronal and axial planes of the femur were created. The distance between the 2 sagittal planes was defined as the TT-TG distance. The modified Q-angle was defined as the angle between the femoral anatomical axis and the line connecting the TT and TG ( Fig. 4B ). The Q-angle is conventionally measured by a physical examination of the anterior superior iliac spine, patellar center, and TT. In the present study, the CT scans did not cover the pelvic bone. The femoral anatomical axis was determined by the line connecting the pyriformis fossa of the proximal femur to the DFC.
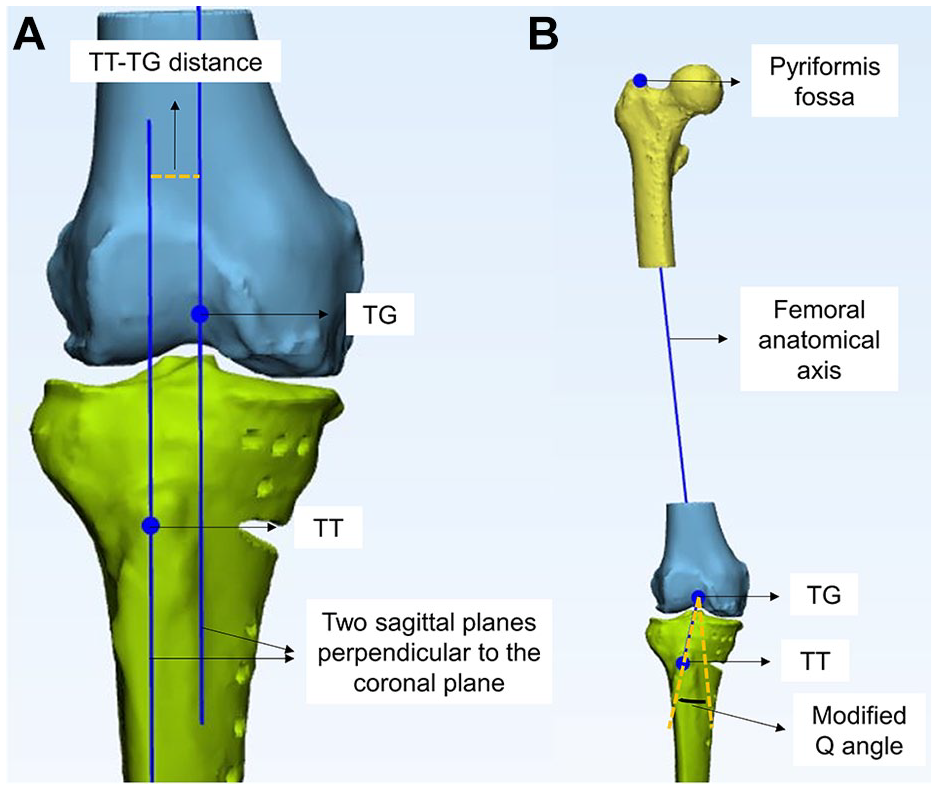
Three-dimensional measurement of tibial tubercle-trochlear groove (TT-TG) distance and modified Q-angle. (
We measured the tibial torsion angle (TTA) and distal femur-distal tibial rotation (DF-DTR) to evaluate rotational changes in the distal femur and tibia. The centers of the medial and lateral tibial plateaus were determined by creating the best-fitting circles around the cortical edge of each plateau. 17 The line connecting the centers was defined as the proximal transtibial axis line (PTL). The knee center was defined as the midpoint between the centers of the medial and lateral plateaus ( Fig. 5A ). The ankle center was defined as the geometric center of the articular surface of the tibial plafond. The distal transtibial axis line (DTL) was defined as a line bisecting the distal articular surface of the tibia plafond ( Fig. 5B ). The axial plane was defined as the midplane of the tibial mechanical axis connecting the knee and ankle centers. The angle formed by the PTL and DTL in the tibial axial plane was defined as the TTA ( Fig. 5C ). The femur’s transepicondylar axis (TEA) was created by connecting the medial and lateral epicondyles. The angle formed by the TEA and DTL in the femoral axial plane was defined as the DF-DTR ( Fig. 5D ). The knee flexion angle was measured as the angle formed by the mechanical axes of the tibia and femur. If this angle differed by >10° preoperatively and postoperatively in the 3D-reconstructed models, it was excluded from the analysis. The 3D measurements were performed by a single orthopedic surgeon skilled in 3D measurement software. All measurements were conducted blinded to prior data, with a minimum interval of 1 month between assessments.
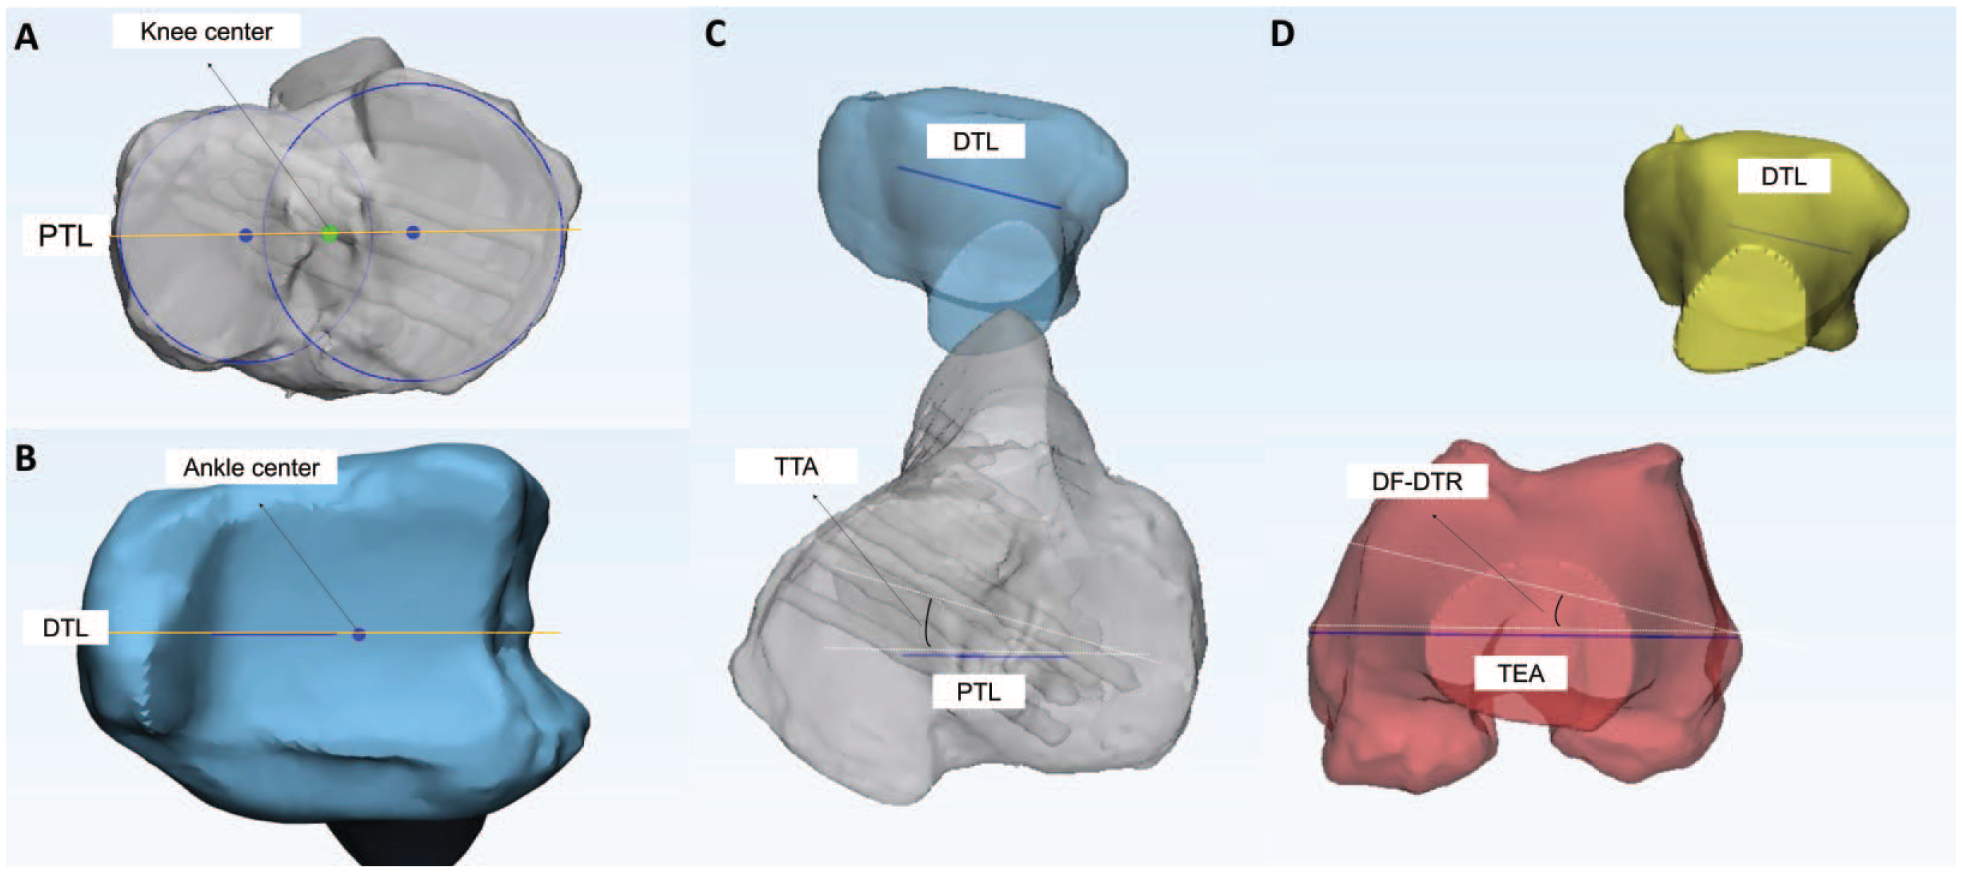
Three-dimensional measurement of tibial torsional angle (TTA) and distal femur-distal tibial rotation (DF-DTR). (
Clinical Outcome Assessment
Clinical outcomes were assessed using patient-reported outcomes (PROs), including the visual analog scale (VAS) score (0-100), Lysholm score, 22 Kujala anterior knee pain score (AKPS), 23 and Knee Injury and Osteoarthritis Outcome Score (KOOS). 24 The PROs were investigated preoperatively, 1 year postoperatively, and at the final follow-up. The minimal clinically important difference (MCID) was determined based on previous studies (VAS, 27; 25 Lysholm score, 10.1; 25 AKPS, 9.5; 26 KOOS pain, 15.4; KOOS symptoms, 15.1; KOOS activities of daily living, 17; KOOS sports/recreation, 11.2; KOOS quality of life, 16.5). 27 The achievement rates of MCID for each PRO were evaluated.
Radiographic and Magnetic Resonance Imaging Assessments
A radiographic assessment of the lower extremity alignment and PF joint-related factors was conducted. Preoperative and postoperative alignments were evaluated by measuring the weight-bearing line ratio (WBL ratio, medial edge 0%). 28 Patellar height was measured perioperatively using the Blackburn-Peel index (BPI) on a 30° flexion lateral radiograph. 29 Additionally, the sulcus and congruence angles were measured on a Merchant-view radiograph. 29 Magnetic resonance imaging (MRI) was performed approximately 1 year postoperatively using a 3.0-T Philips Ingenia MRI (Philips Healthcare, Best, The Netherlands) for patients who provided consent. Cartilage regeneration on MRI was assessed using the Magnetic Resonance Observation of Cartilage Repaired Tissue (MOCART) 2.0 Knee Score. 30 Radiographic assessments were independently performed twice by 2 orthopedic surgeons, with a minimum interval of 1 month between evaluations.
Arthroscopic Assessment
A preoperative evaluation of the ICRS grade and defect size of TCD was performed through an arthroscopic examination. Cartilage lesions categorized as ICRS grade IIIB or higher on both sides of the PF joint were identified as kissing lesions. Arthroscopic assessment of cartilage regeneration was conducted during plate removal 1 year postoperatively. The repaired cartilage was evaluated using the ICRS cartilage repair assessment (CRA).31,32 The overall repair assessment was classified into four grades: grade I (normal), grade II (nearly normal), grade III (abnormal), and grade IV (severely abnormal). Grades III and IV were considered failures in further subgroup analyses. The total coverage of the defect was presented as a percentage. Arthroscopic assessments, including the ICRS CRA, were documented by the senior surgeon immediately after the second-look arthroscopy based on intraoperative findings. These records were retrospectively analyzed.
Statistical Analysis
All statistical analyses were conducted using SPSS version 26.0 (IBM, Armonk, NY, USA), with statistical significance set at a P-value of <0.05. Values were presented as mean ± standard deviation unless otherwise indicated. The primary outcome variables were 3D-measured parameters related to PF biomechanics, while various other outcome variables were designated as secondary outcomes. Comparisons between preoperative and postoperative data, including PROs, radiographic parameters, and 3D measurement parameters, were performed using the paired t-test or Wilcoxon signed-rank test, depending on the results of the normality test (Shapiro-Wilk test). Pearson’s correlation analysis was performed to confirm the correlation between changes in rotation, such as TTA and DF-DTR, and changes in parameters related to patellar biomechanics.
For the subgroup analysis, patients were divided into 2 groups based on the ICRS CRA grade. Those with grades I-II were assigned to the success group, whereas those with grades III-IV were assigned to the failure group. Additionally, patients were divided into groups according to the marrow stimulation procedure (microfracture vs. microdrilling). Differences in ICRS CRA overall points, cartilage defect size, proportion of kissing lesions, combined lateral retinacular release procedure, and preoperative ICRS grade 4 lesions between the groups were analyzed using the Mann-Whitney U and Fisher’s exact tests. In the microdrilling group, the same subgroup analyses were performed. Logistic regression analysis was performed to investigate the factors related to failure. Receiver operating characteristic (ROC) curve analysis was used to establish the cutoff value for the defect size to predict failure. Intraclass correlation coefficient (ICC) was used to assess intra- and inter-rater reliability for radiologic and 3D measurements. Statistical power analysis for the significant results was conducted using G*Power (University Düsseldorf, Düsseldorf, Germany). The statistical power for the significant results of the primary outcomes (PF parameter changes) ranged from 0.89 to 0.99.
Results
Overall, 38 patients were included in this study (
Fig. 6
). Microfractures were performed in 8 patients, while microdrilling was performed in 29 patients. The patients’ demographic and preoperative characteristics are presented in
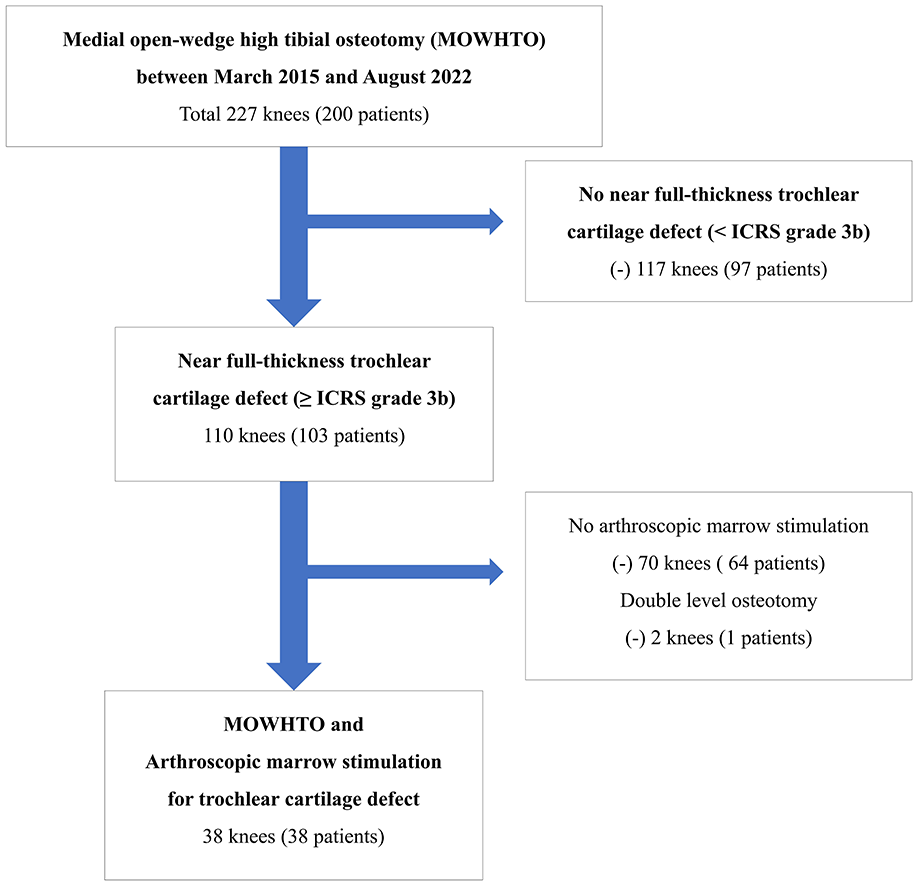
Patient flow diagram.
Baseline Demographic and Preoperative Characteristics.

ICRS = International Cartilage Repair Society; K-L grade = Kellgren-Lawrence grade.
Three-Dimensional Measurement of Parameters Associated With PF Biomechanics
Three of the 38 patients were excluded because the knee flexion angle between the preoperative and postoperative CTs differed by >10°, and 7 patients did not have preoperative CT scans. The mean knee flexion angle difference for the remaining 28 patients was 3.4° ± 3.0° (flexed). Patellar height measured using a modified BPI decreased significantly by 0.05 (P < 0.001). The TT-TG distance did not change significantly (P = 0.227). The patellar tilt angle and modified Q-angle significantly decreased (P < 0.001 and P = 0.002, respectively). The TTA decreased, indicating internal rotation of the distal fragment (P < 0.001). The DF-DTR also decreased, indicating internal rotation of the distal tibia in relation to the distal femur (P < 0.001) ( Table 2 ). Pearson correlation analysis showed a linear correlation between changes in DF-DTR and TT-TG distance (r = 0.583, P = 0.001). DF-DTR showed a weak correlation with the modified Q-angle (r = 0.374, P = 0.050). The intra-observer reliability of 3D measurements demonstrated ICC values ranging from 0.89 to 0.93, indicating good to excellent reliability. 33
3D Measurement of Parameters Associated With Patellar Biomechanics.

3D = 3-dimensional; BPI = Blackburn-Peel index; TT-TG = tibial tubercle to trochlear groove; DF-DTR = distal femur to distal tibial rotation. *Statistical significance.
Clinical Outcomes
All PROs significantly improved 1 year postoperatively and at final follow-up compared with preoperatively (P < 0.001) ( Table 3 ). The mean final follow-up period was 27.0 ± 13.0 months. Several PROs showed significant improvement between 1 year postoperatively and the final follow-up ( Table 3 ). The MCID achievement rates for each PRO were 63.2-78.9% ( Table 3 ).
Clinical Outcomes (Preoperative, 1-Year Follow-Up, and Final Follow-Up).

VAS = visual analog scale; KOOS = Knee injury and Osteoarthritis Outcome Score; ADL = activity of daily living; QOL = quality of life; AKPS = anterior knee pain score.
The results of repeated-measures analysis of variance of clinical outcomes at 3 time points (preoperative, 1-year, and final follow-up) were presented as P-values.
The results of the paired t-test were presented as P-values.
statistically significant difference between the 1-year and last follow-up clinical outcomes.
Radiographic and MRI Assessments
The WBL ratio was corrected from 16.4° ± 12.5° preoperatively to 69.5° ± 9.7° postoperatively. Preoperatively, no patient showed signs of trochlear dysplasia, such as crossing signs. The preoperative sulcus and the congruence angle remained in the normal range ( Table 1 ). The mean congruence angle did not change perioperatively (P=0.389). Patellar height measured using the BPI significantly decreased (P < 0.001; preoperative, 0.71 ± 0.13; postoperative, 0.60 ± 0.10). An MRI at the 1-year follow-up was performed on 29 patients. The median MOCART 2.0 score was 70, with a mean score of 64.3 ± 15.9. The sub-scores for the 7 variables of the MOCART 2.0 knee score are presented in Table 4 . The intra- and inter-observer reliability of radiographic and MRI demonstrated ICC values ranging from 0.93 to 0.97 for intra-observer and 0.89 to 0.93 for inter-observer reliability, indicating good to excellent reliability. 33
Results of MRI/Second-Look Arthroscopic Assessment.

MOCART = magnetic resonance observation of cartilage repair tissue; ICRS CRA = International Cartilage Repair Society cartilage repair assessment; PF = patellofemoral; ICRS = International Cartilage Repair Society.
Arthroscopic Assessment of Cartilage Repair Tissue and Subgroup Analysis
The results of second-look arthroscopy are presented in Table 4 . According to the ICRS CRA grade, 76.3% (29/38) of the patients were considered successful (grades 1-2). Marrow stimulation for TCDs showed a mean 85.4% of defect coverage. Factors were not significantly different depending on the subgroup ( Table 5 ). The success rate was higher in the microdrilling group than in the microfracture group (82.8% vs. 55.5%). Excluding patients who underwent the conventional microfracture method from the analysis revealed several statistically significant results. The failure group showed a significantly larger cartilage defect size than the success group (3.7 ± 1.1 cm2 vs. 2.5 ± 1.1 cm2; P = 0.016). Logistic regression analysis showed a borderline significant correlation between TCD size (cm2) and failure rate (P = 0.063; odds ratio = 2.4). TCDs 1 cm2 larger were 2.4 times more likely to fail after arthroscopic microdrilling. In the ROC curve analysis, a cartilage defect size of 2.85 cm2 was an appropriate cutoff value to predict the failure of trochlear cartilage regeneration (area under the curve, 0.838; P = 0.019).
Subgroup Analysis Results Based on the Success/Failure Group and the Microdrilling /Microfracture Group.

ICRS CRA, International Cartilage Repair Society Cartilage Repair Assessment. *Statistical significance.
Discussion
The principal findings of the present study are as follows: (1) In 3D measurements of parameters related to PF biomechanics, the TT-TG distance was preserved, and the modified Q-angle significantly decreased despite the valgus realignment procedure. Additionally, the TT-TG distance was correlated with DF-DTR. (2) Arthroscopic marrow stimulation for full-thickness TCDs during MOWHTO showed favorable cartilage repair, as assessed by MRI and second-look arthroscopy in short term, especially when the defect size was smaller and microdrilling was utilized.
In the 3D assessment of parameters in this study, the mean TT-TG distance remained unchanged. Kim et al. 10 previously reported an increase in the TT-TG distance after MOWHTO due to valgus realignment. However, this can be taken for granted when considering only coronal alignment changes. A key limitation of measuring parameters using 2D CT images is that the long axis may vary depending on the patient’s leg positioning during the CT scan or the settings determined by the radiographer. To accurately evaluate perioperative changes, it is essential to use a consistent axis before and after surgery. In this study, the TT-TG distance was measured using a consistent axis defined by the perioperatively unchanged femur bone, ensuring a reliable assessment of changes. Notably, most studies investigating axial rotational changes after MOWHTO have reported internal rotation of the distal fragment below the osteotomy site.34-36 Since the tibial tubercle is part of the distal fragment in proximal biplanar osteotomy, this internal rotation can contribute to a reduction in the TT-TG distance ( Fig. 7 ). In this study, the DF-DTR was defined as the angle between the TEA of the distal femur and the DTL. Changes in DF-DTR reflect the rotation of the distal fragment below the osteotomy site relative to the distal femur. In this study, a mean internal rotation of the distal tibia (decreased DF-DTR) of 4.8° was observed. This change in DF-DTR was significantly correlated with the change in TT-TG distance. This correlation likely explains the preservation of TT-TG distance and the decrease in modified Q-angle, despite the valgus realignment procedure. Several studies have analyzed changes in TT-TG distance following MOWHTO, with some reporting a reduction 37 or maintenance 38 of the TT-TG distance. Sim et al. 37 using 2D CT measurements, observed a postoperative decrease in TT-TG distance, while Otsuki et al . 38 using 3D measurements, reported that TT-TG distance remained unchanged. The findings of the present study may help explain the previously observed phenomenon in which TT-TG distance does not increase despite valgus realignment.
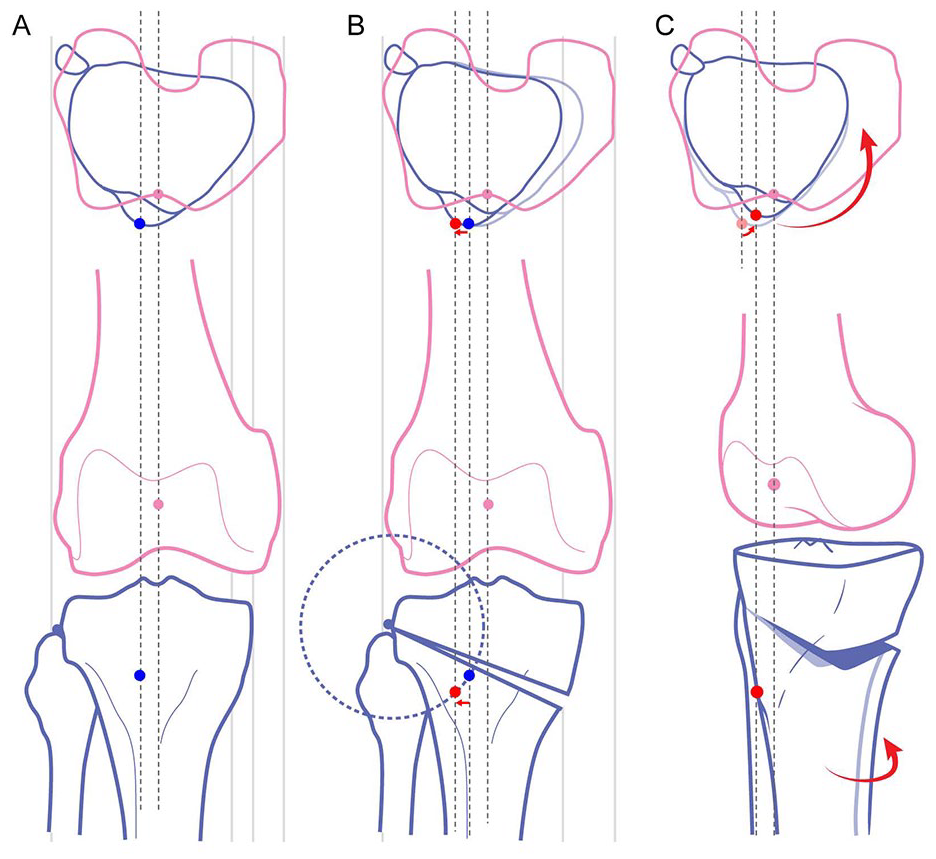
Association of DF-DTA with TT-TG distance. The top row schematics show the relationship between the distal femur and the distal fragment of tibia below the osteotomy site in an axial image. The bottom row depicts the rotation of the distal fragment observed from frontal and oblique views. (
The mean modified BPI by 3D measurement of this study decreased by 0.05, a smaller change compared with the mean decrease of 0.11 observed on the lateral radiograph. When the BPI is measured using lateral radiographs, the sclerotic line of the medial tibial plateau is typically used to represent the joint line. 39 However, in this measurement, the elevation of the medial joint line can exaggerate the decrease in patellar height following MOWHTO. In contrast, the 3D measurement method in this study involved forming a plane that best represented both the medial and lateral tibial plateaus, measuring the distance between this plane and the inferior end of the patellar articular surface at the midline. This approach may provide a more accurate evaluation of changes in patellar height after MOWHTO. Overall, the study findings indicate a decrease in patellar height, maintenance of the TT-TG distance, and a reduction in the modified Q-angle. These results suggest that concluding patellar biomechanics will invariably deteriorate after MOWHTO may be an oversimplification and not universally applicable.
Additionally, this study reported the outcomes of cartilage repair using arthroscopic marrow stimulation techniques for TCDs during MOWHTO. This procedure has been infrequently performed for several reasons. Patients undergoing MOWHTO typically present with symptoms primarily originating from the medial compartment, often with less involvement of the PF joint. Moreover, considering the potential adverse effects of MOWHTO on PF biomechanics,6-9,16 the success and long-term sustainability in cartilage repair procedures in this context remain uncertain. Systematic reviews on PF cartilage restoration report that autologous chondrocyte implantation (ACI) is the most commonly utilized procedure, whereas marrow stimulation techniques account for only 17.2% of cases.40,41 However, ACI is associated with high costs and the added burden of a two-stage surgery, 42 which limits its applicability alongside HTO only for TCDs. In contrast, marrow stimulation is a cost-effective, simple procedure that requires only a slight extension of surgical time. 43 Additionally, it does not necessitate additional protection or rehabilitation beyond routine post-HTO rehabilitation, thereby avoiding any significant increase in patient burden. Given this, marrow stimulation can be considered as an adjunctive procedure to augment cartilage volume rather than leaving a full-thickness defect untreated, provided it does not negatively impact the patient. Furthermore, the 3D measurement results in this study demonstrated that not all parameters related to PF biomechanics changed adversely in actual postoperative settings, supporting the feasibility of this approach.
MOWHTO, with additional arthroscopic marrow stimulation, significantly improved patients’ clinical outcomes. The MCID achievement rates at the final follow-up for all PROs were 63.2-78.9%. Apart from clinical outcomes, marrow stimulation for TCDs during MOWHTO demonstrated favorable cartilage repair outcomes in short term as evaluated with MRI and second-look arthroscopy. The median MOCART 2.0 score was 64.3 ± 15.9. Further analyses of MOCART 2.0 sub-variables showed that the regenerated trochlear cartilage exhibited good cartilage fill without subchondral edema but with a somewhat irregular and inhomogeneous pattern ( Table 4 ). These characteristics of the repaired tissue may be associated with the loading conditions of the joint. As a non-weight-bearing joint, the PF joint experiences unevenly distributed loads during knee flexion angles.44,45 Inconsistent mechanical loading may lead to irregular and inhomogeneous regenerated cartilage. The lower occurrence of subchondral bone changes observed in this study remains unclear but is consistent with Niethammer et al .’s 46 findings, which reported that subchondral edema is less common in the PF area compared with the femoral condyles.
In patients who underwent microdrilling, we employed so-called “next-generation” marrow stimulation techniques, which involve meticulous cartilage defect preparation and deeper, more numerous subchondral perforations using a small-diameter drill. 43 A systematic review of basic scientific evidence has demonstrated the superiority of these advanced techniques over conventional microfractures. 21 In arthroscopic evaluation, the microdrilling group demonstrated a higher success rate compared with the microfracture group, as assessed by the ICRS CRA grade (82.8% vs. 55.5%). Additionally, within the microdrilling group, patients with smaller defect sizes (<2.85 cm2) showed higher success rates. These results suggest that utilizing advanced techniques and targeting smaller lesions may lead to more effective cartilage repair. However, it is established that marrow stimulation does not result in the formation of hyaline cartilage, 47 and long-term studies have reported functional deterioration between 18 and 36 months. 48 In the study conducted by Kreuz et al . 48 16 patients with full-thickness TCD who underwent microfracture were followed for 36 months, with periodic MRI evaluations to assess cartilage status. The study used the ICRS grading system to evaluate cartilage, reporting an average improvement of approximately 1.5 points between preoperative and 6-18 months postoperative assessments, resulting in a mean ICRS grade of 2.38. Applying the same grading system, our study evaluated 38 patients via second-look arthroscopy at approximately one year postoperatively, revealing an average ICRS grade of 2.16, which was comparable or slightly superior to Kreuz et al .’s findings. However, when excluding microfracture patients and analyzing only those who underwent microdrilling, the mean ICRS grade improved to 1.89, indicating a potential superiority over the previous study. Nevertheless, these findings are short-term data, and long-term deterioration remains a concern that requires further follow-up. Kreuz et al. also noted that TCH lesions tend to have worse outcomes compared with femoral condyle lesions.
This study had a few limitations. The first is the small sample size., which introduces a risk of selection bias, particularly when combined with the study’s retrospective nature. Additionally, the small sample size may limit the generalizability of the findings. It can also lead to underpowered statistical analyses, potentially obscuring significant differences. However, in this study, a post hoc power analysis was performed for findings that showed statistically significant differences, confirming that these results had sufficient statistical power. Second, this study was a case series without a control group. Well-designed prospective comparative studies are needed to directly compare the additional microdrilling and no-treatment groups to determine whether additional trochlear cartilage procedures are beneficial. Therefore, the conclusions of this study should primarily focus on the 3D-measured anatomical parameters related to PF mechanics, which serve as the primary outcome measure. Clinically, a notable finding is that cartilage defect filling appeared generally favorable in short-term follow-up arthroscopic evaluations. However, whether additional microdrilling for TCDs provides any benefit over no intervention remains uncertain and should be further investigated through controlled comparative studies. However, conducting a well-designed prospective controlled study poses significant challenges. In surgeries like HTO for osteoarthritis patients, intraoperative factors such as precise correction significantly influence surgical outcomes. Additionally, numerous other factors, including baseline demographic characteristics such as age, sex, and body mass index, as well as the severity of osteoarthritis, the size of cartilage defects, and the extent of meniscal tears or insufficiency, also critically affect outcomes. Accounting for all these variables in a comparison is highly complex. To obtain reliable results, it is essential to establish strict inclusion and exclusion criteria for patient selection, followed by randomization or the application of effective statistical matching methods to balance baseline factors between groups. Only through such a well-designed approach can a comparison between patients who underwent marrow stimulation for TCDs and those who did not yield credible conclusions. Third, this study included only a short-term follow-up period of approximately 26 months. Long-term clinical outcomes and the deterioration of repaired cartilage should be further evaluated. In this case series, cartilage formation appeared favorable, but its long-term durability has not been confirmed. Finally, the 3D measurements for anatomical parameters related to PF biomechanics used in this study were developed by the authors. The reliability of these 3D measurements has not been established, and the range of normal values for these measurements has not been determined. However, considering the measurement errors in 2D radiographs, 3D measurements are not inferior to conventional methods.
Conclusion
The 3-dimensionally measured TT-TG distance was maintained after MOWHTO and was associated with internal rotation of distal tibial segment below the osteotomy site. Arthroscopic marrow stimulation for TCDs in patients undergoing MOWHTO achieved favorable cartilage repaired tissue in short term.
Footnotes
Acknowledgments and Funding
We appreciate the Medical Illustration & Design (MID) team, a member of Medical Research Support Services of Yonsei University College of Medicine, for their excellent support with medical illustration.
Declaration of Conflicting Interests
The author(s) declared no potential conflicts of interest with respect to the research, authorship, and/or publication of this article.
Ethical Approval
Ethical approval was obtained from the institutional review board of our institution (3-2023-0289). Given the study’s retrospective nature and the minimal risk involved, the requirement of patient consent was waived with the approval of the institutional review board.