
Abstract
Subjective well-being (SWB) reflects an overall evaluation of the quality of a person’s life from his or her perspective. Although SWB is typically studied at the individual level, social scientists have become increasingly interested in the well-being of broader regions like cities, states, or nations. The current study examines the association between aggregate well-being and an important behavioral indicator of regional success: migration and population growth. Using life satisfaction data from over 2 million respondents, along with population data from 2000 to 2010, I show that U.S. counties with higher levels of life satisfaction grew at substantially faster rates than did counties with low life satisfaction. Supplemental analyses showed that this association was not due to regional differences in birth or death rates. Instead, counties with high life satisfaction experienced high levels of domestic migration. These results show the validity and utility of life satisfaction measures at the regional level.
Subjective well-being (SWB) reflects an overall evaluation of the quality of a person’s life from his or her own perspective (Diener, Suh, Lucas, & Smith, 1999). Although SWB has typically been studied at the individual level, social scientists have become increasingly interested in the well-being of broader regions like cities, states, or nations (Lawless & Lucas, 2011; Oswald & Wu, 2010; Rentfrow, Mellander, & Florida, 2009). This focus reflects a broader interest in societal levels of psychological characteristics across social and personality psychology (see, e.g. Rentfrow, 2010). In addition, it reflects an increased interest in practical applications of SWB research. By examining the regional characteristics that correlate with aggregate levels of well-being, it might be possible to identify the societal factors that lead to thriving communities. Such research could not only inform theory, it could also be used to guide policy decisions (Diener, Lucas, Schimmack, & Helliwell, 2009).
Although a considerable amount of research has examined regional differences at the national level (for reviews, see Diener, Helliwell, & Kahneman, 2010), international comparisons are difficult because differences that are found might reflect translation issues or cultural differences in response to styles, language use, or even differences in the meaning of the underlying constructs. Thus, it is particularly interesting to look within cultures to see whether meaningful regional differences in well-being exist and whether these can be predicted from objective characteristics. 1 The small number of initial investigations into regional differences within the United States has produced promising results. For instance, Lawless and Lucas (2011), Oswald and Wu (2010), and Rentfrow, Mellander, and Florida (2009) have all shown that objective characteristics of regions such as education levels, health status, and marriage rates correlate with aggregate ratings of subjective well-being. These initial results suggest (a) that meaningful regional differences in SWB do exist and (b) that these regional differences are moderately associated with objective characteristics that should theoretically be linked with SWB.
This initial evidence is promising because it suggests that basic research on SWB might indeed be useful for policy purposes. For instance, local governments may attend to research on the predictors of regional well-being and devote resources to the factors that are most strongly associated with SWB. However, it is likely that many of the strongest predictors (e.g., poverty, unemployment, educational achievement) are already targets for policy intervention, and it is unclear whether knowing that such characteristics are linked with well-being adds to their desirability as policy targets. Thus, it would be helpful—both for theoretical and applied reasons—to know whether SWB can predict other indicators of regional success.
One criterion that is particularly meaningful is the population growth of a region over time. Areas that are able to attract a large number of new residents presumably have characteristics that are highly valued and broadly desirable, and it is possible that these desirable characteristics also promote higher well-being. There is a growing literature in personality and social psychology regarding the individual- and societal-level predictors of migration (Canache, Hayes, Mondak, & Wals, in press; Jokela, 2009; Oishi, 2010). However, the focus here is on the extent to which regional growth is linked to the average levels of life satisfaction of that region. If the average life satisfaction of a county is able to predict this important behavioral criterion of regional success, then this is further evidence that well-being measures provide valid and useful information that may be of interest to policy makers.
Of course, there are also reasons why one might expect population growth to be unrelated to life satisfaction. Most notably, a considerable amount of research suggests that people can adapt to a wide variety of objective life circumstances (Diener, Lucas, & Scollon, 2009), and thus, the characteristics that attract new residents may not lead to large or lasting changes in SWB. Indeed, Schkade and Kahneman (1998) explicitly addressed this possibility by comparing people’s predictions of how they would feel if they lived in a different region to the actual differences in these regions. Specifically, they asked large group of college students in the Midwest and California how happy they actually were and how happy they would be if they moved to the other region (California for the Midwesterners and the Midwest for Californians). Students in both regions thought that people living in California would be happier than people living in the Midwest. However, consistent with the adaptation perspective, there were no significant differences in actual happiness across the two groups. Furthermore, respondents appeared to focus on differences between the two regions (e.g., climate and cultural opportunities) and to base their predictions on these salient differences. As a result, they downplayed the extent to which one adapts to these characteristics. However, it is important to note that because this study focused only on convenience samples of college students, it is not clear whether these results generalize to broader populations.
If the focusing illusions that Schkade and Kahneman (1998) identified affect people more generally, then people may make bad decisions about where to move. In short, they may move to locations based on their perceptions of how satisfied they will be; yet, they might be unable to predict the true effect of regional characteristics on SWB. If so, those regions that are able to attract large numbers of new residents may have SWB levels that are no higher than those regions with relatively low (or even negative) rates of growth. Alternatively, the regional characteristics that attract people to move may actually be linked with high levels of SWB, which would result in a positive correlation between population growth and average life satisfaction. 2 In the current study, I use data from over 2 million respondents assessed over a 5-year period to examine the association between county levels of life satisfaction and an important behavioral indicator of regional success: population growth from the years 2000 to 2010. In addition, by using yearly estimates of the components of population growth (births, deaths, domestic migration, and international migration), it will be possible to determine whether regions with higher life satisfaction actually attract more new residents (as opposed to having fewer residents die).
Method
The Behavioral Risk Factor Surveillance System (BRFSS) is a set of state-level surveys organized by the U.S. Centers for Disease Control and Prevention (Centers for Disease Control and Prevention [CDC], 2005–2009). The goal of these surveys is to track health conditions in the United States. Life satisfaction has been assessed since 2005, and thus, the waves from 2005 to 2010 are included in this analysis. Over 2 million respondents participated in the survey during these 5 years, 2,093,737 of whom have information about county of residence and valid responses to the life satisfaction question.
Life satisfaction was assessed using a single item that read “In general, how satisfied are you with your life.” Participants responded using a 4-point scale with the options Very Satisfied, Satisfied, Dissatisfied, or Very Dissatisfied (responses were scored such that higher scores reflect higher satisfaction). Although single-item measures are not ideal, the existing research shows that such measures often perform quite well. For instance, Lucas and Donnellan (2012) used longitudinal data from four large-scale, nationally representative panel studies to estimate the reliability of widely used single-item life satisfaction measures. They showed that reliability estimates tended to exceed .70 for these measures. Other research shows that these measures correlate with other indicators (including nonself-report measures) and with relevant life circumstance variables (see Diener, Lucas, Schimmack, & Helliwell, 2009).
County-level life satisfaction was estimated using a random-intercept multilevel modeling approach, with county as the grouping variable. These models have the advantage of being able to weight estimates by the sample size within each county and to use information from the broader sample when sample sizes are small (Gelman & Hill, 2007). County-level estimates from this model were saved and used to predict population growth that was calculated based on population counts from the 2000 and 2010 census and expressed as percentage growth relative to the population in 2000. In addition, yearly county-level estimates of the components of population growth (births, deaths, domestic migration, and international migration) derived by the U.S. Census Bureau were downloaded and used to provide more fine-grained analyses of the links between population growth and life satisfaction (see http://www.census.gov/popest/research/eval-estimates/eval-est2010.html#march).
Results
The mean level of life satisfaction across the 2,348 counties with sufficient data was 3.39 (standard error [SE] = .001). The between-person standard deviation was .63, and the between-county standard deviation was .04. For a descriptive overview of differences in life satisfaction across counties (including a map of these differences), see Lucas, Cheung, and Lawless (in press). The mean rate of growth across counties was 8%, with a standard deviation of 13 percentage points.
To test whether aggregate life satisfaction levels predict population growth, I used weighted least squares regression to predict percentage growth from 2000 to 2010 from centered life satisfaction and life satisfaction squared, weighting by population in 2000. Results are presented in Figure 1. As can be seen in this figure, there is a curvilinear association between life satisfaction and population growth that is medium to large in size. Both the linear (B = 1.37, SE = 0.05, t = 25.33, p < .001) and quadratic (B = 5.08, SE = 0.62, t = 8.13, p < .001) terms were significant, and the multiple R for the model was .47 (R 2 = .22). As a point of comparison, median income and the percentage of people who had college degrees within a county also predicted population growth but to a somewhat lower extent: r = .44 and .32, respectively. Another intuitively appealing predictor of population growth—unemployment within a county—correlated even less strongly: r = −.13. It is noteworthy that counties that are especially low in life satisfaction (those at least one standard deviation below the mean) show consistently low rates of growth (average rate of growth = 1.5%). In contrast, counties with high levels of life satisfaction (those at least one standard deviation above the mean) have more varied but typically higher rates of growth (averaging 21.4%). Thus, when looking at these somewhat more extreme groups, the difference in growth rates is quite large.
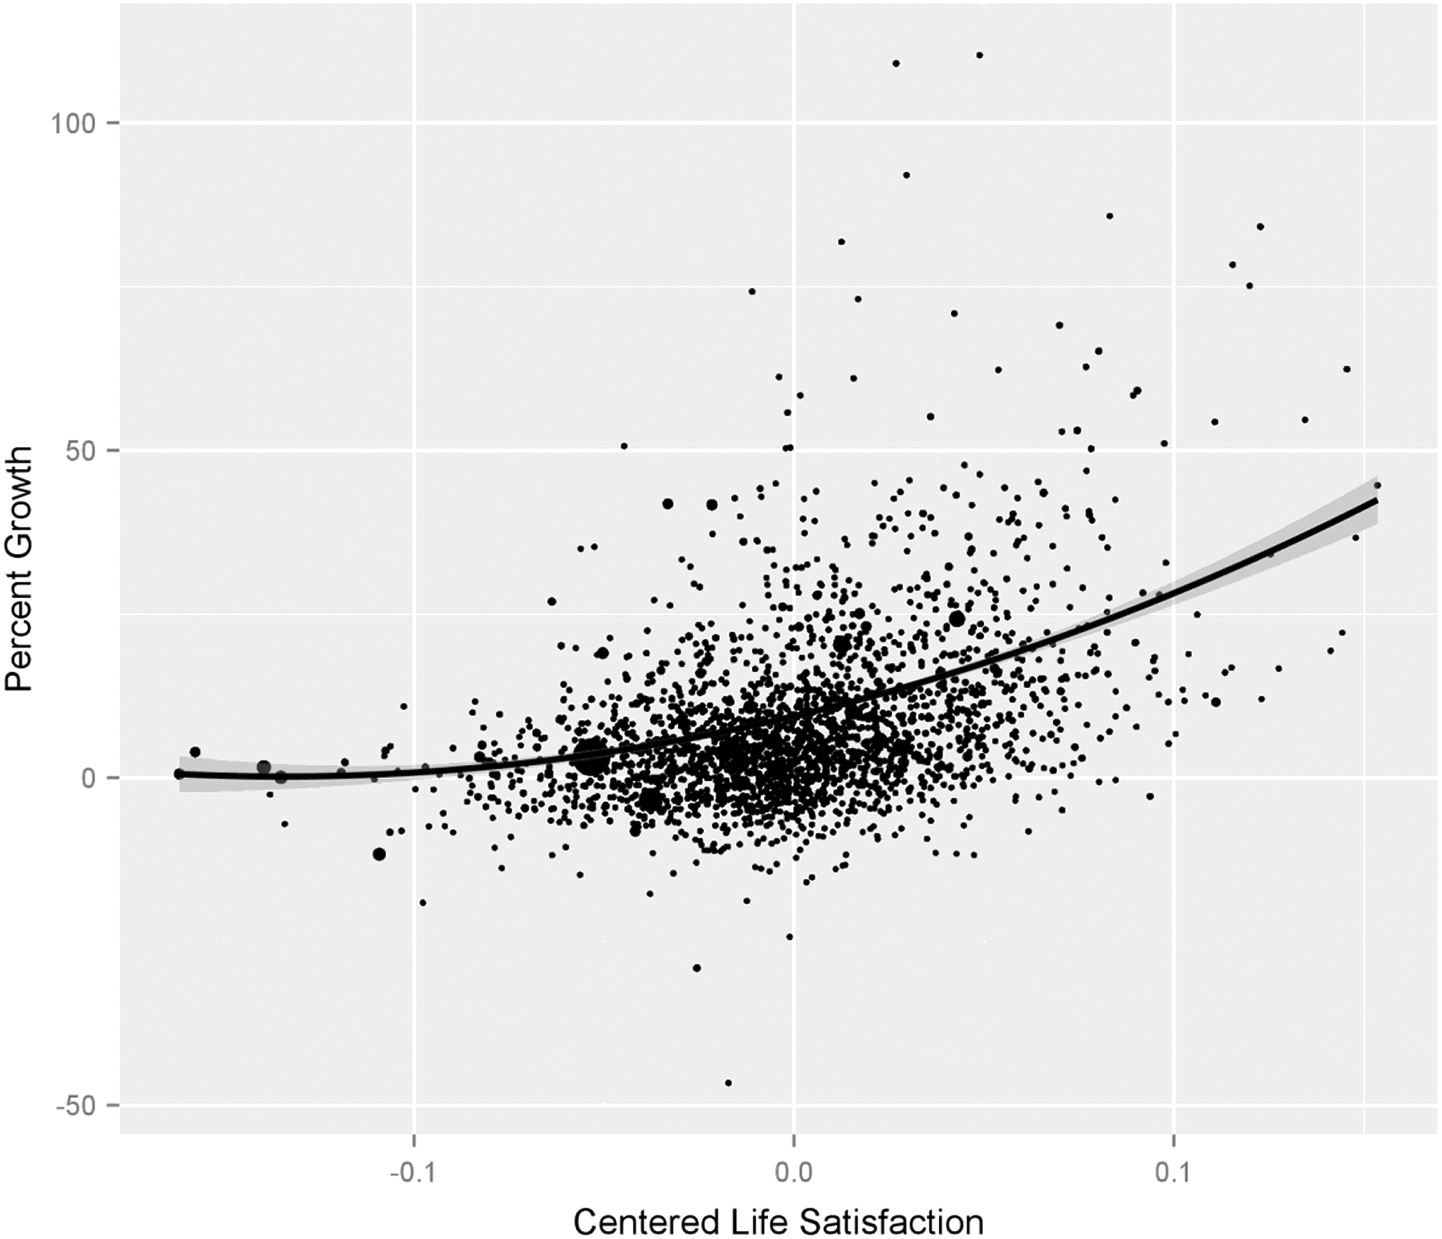
Scatterplot and weighted quadratic regression line predicting population growth from 2000 to 2010 from life satisfaction. Each data point is a U.S. county, and the size of the points reflects the population of the county.
Although these initial analyses show that population growth is related to life satisfaction, this association may not be due to migration into more satisfied counties. Population growth results not only from people moving but also from births and deaths. For instance, using a subset of the data analyzed here, Lawless and Lucas (2011) showed that the life satisfaction of counties was associated with lower rates of death, especially for rates of death due to heart disease, homicide, cancer, and liver disease. Thus, it is important to isolate actual in-migration from other causes of population growth.
Correlational analyses show that average life satisfaction scores are only weakly related to the average yearly birth rate from 2000 to 2010: r = .03. However, consistent with Lawless and Lucas (2011), death rates were significantly associated with aggregate life satisfaction: r = −.37, p < .001. Thus, it is important to isolate in-migration from other components of population growth. The U.S. Census Bureau further distinguishes between international migration and domestic migration. Although international in-migration was very weakly correlated with life satisfaction (r = .05, p < .005), the association between domestic in-migration and life satisfaction was much stronger: r = .35, p < .001. Figure 2 shows the results of a weighted least squares regression analysis predicting domestic in-migration from life satisfaction. In this case, the effect was linear, with a nonsignificant quadratic trend (B = 72.33, SE = 50.40, t = 1.44, not significant). Thus, the zero-order correlation reported previously accurately describes the association. As with population growth more broadly, the association is moderate in size. Thus, even when a more precise estimate of domestic in-migration is examined, a moderate association with life satisfaction emerges.
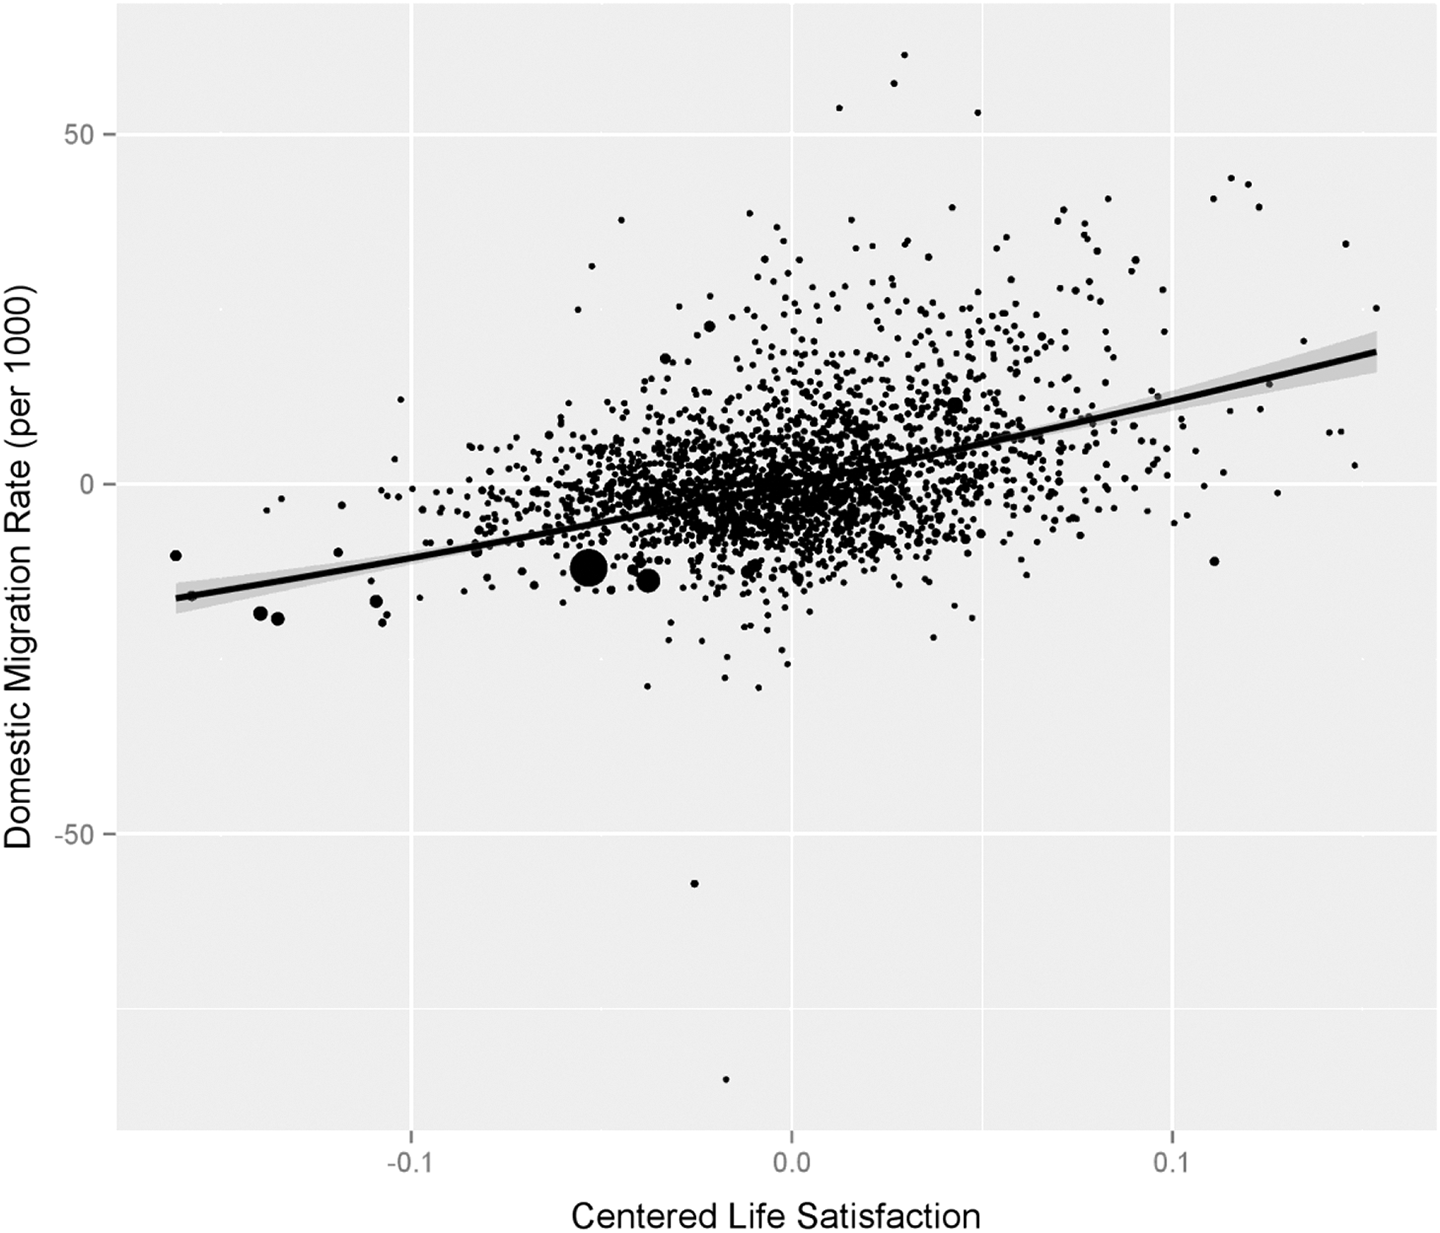
Scatterplot and weighted linear regression line predicting average yearly domestic migration from 2001 to 2010 from life satisfaction. Each data point is a U.S. county, and the size of the points reflects the population of the county.
As a final analysis, I tested whether regions that grew more quickly also increased in life satisfaction over time. Previous research shows that personality characteristics such as openness to experience, extroversion, and agreeableness predict who is likely to move (e.g., Jokela, 2009; though see Canache et al., in press). It is possible that the association at the regional level reflects the fact that happier people are more likely to move. If so, states that are growing should also increase in satisfaction over time, as more and more high SWB people move there. To test this possibility, I calculated the slope predicting life satisfaction over time (from 2005 to 2010) from the original BRFSS data for each county in the data set. Contrary to the idea that the association between life satisfaction and population growth is due to happier people being more likely to move, the association between population growth and the over time slope was small and negative (r = −.11, p < .001).
General Discussion
Migration and population growth reflect complex processes that social scientists do not yet completely understand. However, it is possible to think of population growth as an imperfect but useful behavioral measure of the success of a region. Presumably, those regions that have more to offer are better able to attract and retain residents. Thus, this behavioral index provides a useful criterion with which to judge the quality and validity of regional measures of SWB, such as the one used in this study. The results show that regions with more satisfied residents grow more quickly than regions with low levels of life satisfaction.
People presumably do not go looking for places that are especially high in life satisfaction when deciding where to live (though this is certainly a possible factor in their decisions, especially as more data about regional differences become available to the public). Rather, they likely choose locations based on many different factors including the availability of jobs, the cost and quality of the housing, the amenities that exist, the climate of the region, and a variety of idiosyncratic factors that vary across individuals (including the proximity to family or to individually valued activities). When considering these options and making a choice, people may end up choosing locations that tend to be higher in life satisfaction.
The current results provide evidence that they do. Life satisfaction was moderately to strongly correlated with population growth over a 10-year period, and the most satisfied regions (those that were at least 1 standard deviation [SD] above the mean) exhibited growth that was more than 14 times as large as the least satisfied regions (those that were 1 SD below the mean). Furthermore, supplemental analyses showed that this association was not due to differences in birth or death rates across regions with high and low SWB. Although these analyses confirm that regions with higher rates of SWB also have lower rates of death, there was still a moderate association when domestic migration was isolated from broader population growth.
These results do not necessarily contradict those of Schkade and Kahneman (1998) who found that people predict regional differences in SWB between California and the Midwest when those differences do not really exist. For one thing, participants in the current study were not asked to predict SWB levels in different regions. Instead, actual satisfaction levels were assessed and then linked with changes in the population. Thus, it is possible that people do mispredict satisfaction levels but still end up moving to regions where SWB is higher. In addition, Schkade and Kahneman (1998) only assessed students (both for predictions and actual levels), and they only examined two broad regions of the United States. Thus, these processes could differ across different populations.
It is also possible that the small differences in life satisfaction that exist between high-growth and low-growth regions reflect a relatively short-term effect of a recent move on global levels of life satisfaction. In other words, the same factors that lead people to predict high levels of SWB for a region (e.g., climate, job opportunities, or cultural amenities) may lead to short-term boosts in SWB that affect overall averages within a region. If so, we should expect to see elevated levels of life satisfaction among recent movers but fewer cross-county differences among long-term residents. Unfortunately, the data that are currently available do not include items about length of residency that could be used to answer this question.
Finally, it is important to note that the causal process underlying this association is not clear. It is possible, as I have suggested above, that the objective characteristics of regions attract new residents and also contribute to SWB. It may even be that movers have an intuitive understanding of the ways that objective characteristics affect well-being, and they may choose specific locations based on this knowledge. However, an alternative possibility is that growth directly affects the well-being of residents by creating a sense of energy or optimism within a region. This causal effect of growth on well-being could occur independent of the objective characteristics that the region has. Long-term data on trends in well-being and growth would be needed to tease apart these possibilities.
This study shows that although in an absolute sense, regional variability in well-being is small, it is closely linked with an important behavioral indicator of regional success. Thus, these results provide further evidence that subjective reports of well-being can provide useful information about the quality of life across regions.
Footnotes
Authors’ Note
The content is solely the responsibility of the authors and does not necessarily represent the official views of the National Institutes of Health.
Declaration of Conflicting Interests
The author(s) declared no potential conflicts of interests with respect to the authorship and/or publication of this article.
Funding
The author(s) disclosed receipt of the following financial support for the research and/or authorship of this article: This research was supported by funding from the National Institute on Aging [Grant Number: R01-AG040715].