



Abstract
Money and time are both scarce resources that people believe would bring them greater happiness. But would people prefer having more money or more time? And how does one’s preference between resources relate to happiness? Across studies, we asked thousands of Americans whether they would prefer more money or more time. Although the majority of people chose more money, choosing more time was associated with greater happiness—even controlling for existing levels of available time and money. Additional studies and experiments provide insight into choosers’ underlying rationale and the causal direction of the effect.
Money and time are both scarce resources that people believe would bring them greater happiness. Americans report lack of money as their primary source of worry (Rheault, 2011), and increasingly feel they are suffering from a time famine with too much to do and not enough time to do it (DeVoe & Pfeffer, 2011; Perlow, 1999). Having more would not only help in meeting one’s myriad financial obligations (e.g., bills) and temporal obligations (e.g., errands and childcare), but these additional resources could be spent to further enjoy life’s pleasures—like traveling, pursuing hobbies, and cultivating personal relationships.
People want more money and time, but unfortunately there is rarely an opportunity to simultaneously gain in both. Instead, these resources are traded off in many of life’s decisions: Should you pay more for the direct flight that gets you to your destination sooner? Should you accept the higher paying job that requires more hours in the office? Should you take on the huge financial burden of receiving the best medical care available for the possibility of extending your life several years? We examine people’s preferences between having more money or more time by asking thousands of Americans the direct question: “Which do you want more of—time or money?” Furthermore, we test how one’s preference relates to happiness.
Research suggests that more money is associated with greater daily happiness up to an approximate annual income of USD$75,000 and with life satisfaction beyond that (Kahneman & Deaton, 2010). Research also suggests that even after controlling for material affluence, having more time is associated with greater feelings of happiness and life satisfaction (Kasser & Sheldon, 2009). We look beyond the amount of time and money people have and examine which resource they want, and how this preference relates to subjective well-being.
Drawing on prior work, we predict that choosing time over money is linked to greater happiness. Namely, (1) individuals led to focus on time were more motivated to engage in behaviors associated with happiness than those led to focus on money (Mogilner, 2010); (2) individuals led to focus on time also became more self-reflective than those led to focus on money (Gino & Mogilner, 2014); (3) temporal investments are viewed as more connected to one’s self than are monetary investments (Mogilner & Aaker, 2009); (4) experiences (which require spending time) produce greater happiness than material goods (which require spending money; Gilovich & Kumar, 2015; Van Boven & Gilovich, 2003); and (5) how people spend their time literally sums up to the life they live, whereas the same cannot be said for financial expenditures. Based on these findings, we hypothesized that individuals with a natural and stated proclivity toward time over money are happier.
Across five studies (1–3b; N = 4,415), we ask people to choose between more money versus more time and to report their happiness and life satisfaction along with the amount of money and time they have. Although research has noted that happiness and life satisfaction reflect separate aspects of subjective well-being (Diener, 1984), they are highly correlated and show the same pattern of results across our studies. For brevity, we report the collapsed measure in the manuscript calling it happiness and report the results for each measure separately in the Supplemental Online Materials (SOMs). Across participant samples, measures of happiness, and measures of resource availability, we find a consistent relationship between choosing time over money and happiness—controlling for the amount of each resource one already has. Using a single direct question, this finding replicates concurrent research that sought to establish an individual difference measure for valuing time versus money (Whillans, Weidman, & Dunn, 2016). Having demonstrated this initial relationship, we build on it in subsequent studies by asking participants to explain their choice of money or time, providing insight into the cognitive and motivational features underlying the role of these resources in happiness (Studies 3a and 3b). We also assess the consistency in people’s resource preference by asking participants 1 year later to again choose between more money and more time (Study 3b). We then conduct experiments manipulating resource preference (Study 4a) and happiness (Study 4b) to test for the causal direction of the relationship between wanting time over money and happiness. Pooling our survey data (Studies 1–3b), in the General Discussion section, we examine how the subjective and objective amounts of time and money people have relate to their resource preference and happiness, thus providing additional insight into how individuals experience these resources to influence happiness.
Study 1
To establish the relationship between resource preference and happiness, Study 1 asked participants to report their preference between more time versus more money and their happiness. For this and the subsequent studies, sample size was determined prior to each study with an effort to collect as many participants as possible in the allotted time frame, all measures are listed in the SOM, and all participant exclusions are reported (Simmons, Nelson, & Simonsohn, 2011).
Method
Participants (N = 1,301) were recruited through Amazon’s Mechanical Turk (MTurk) to complete the survey in exchange for 60¢. Seventy-four people failed an instructional manipulation check (IMC) that told participants to click a box marked “other” among a list of marital status options (Oppenheimer, Meyvis, & Davidenko, 2009). Those who failed the IMC and one person who entered their age as “3 years” were excluded from the analyses, leaving a final sample of 1,226 (see Table 1 for participants’ demographic information across studies).
Participants’ Demographics Across Studies.
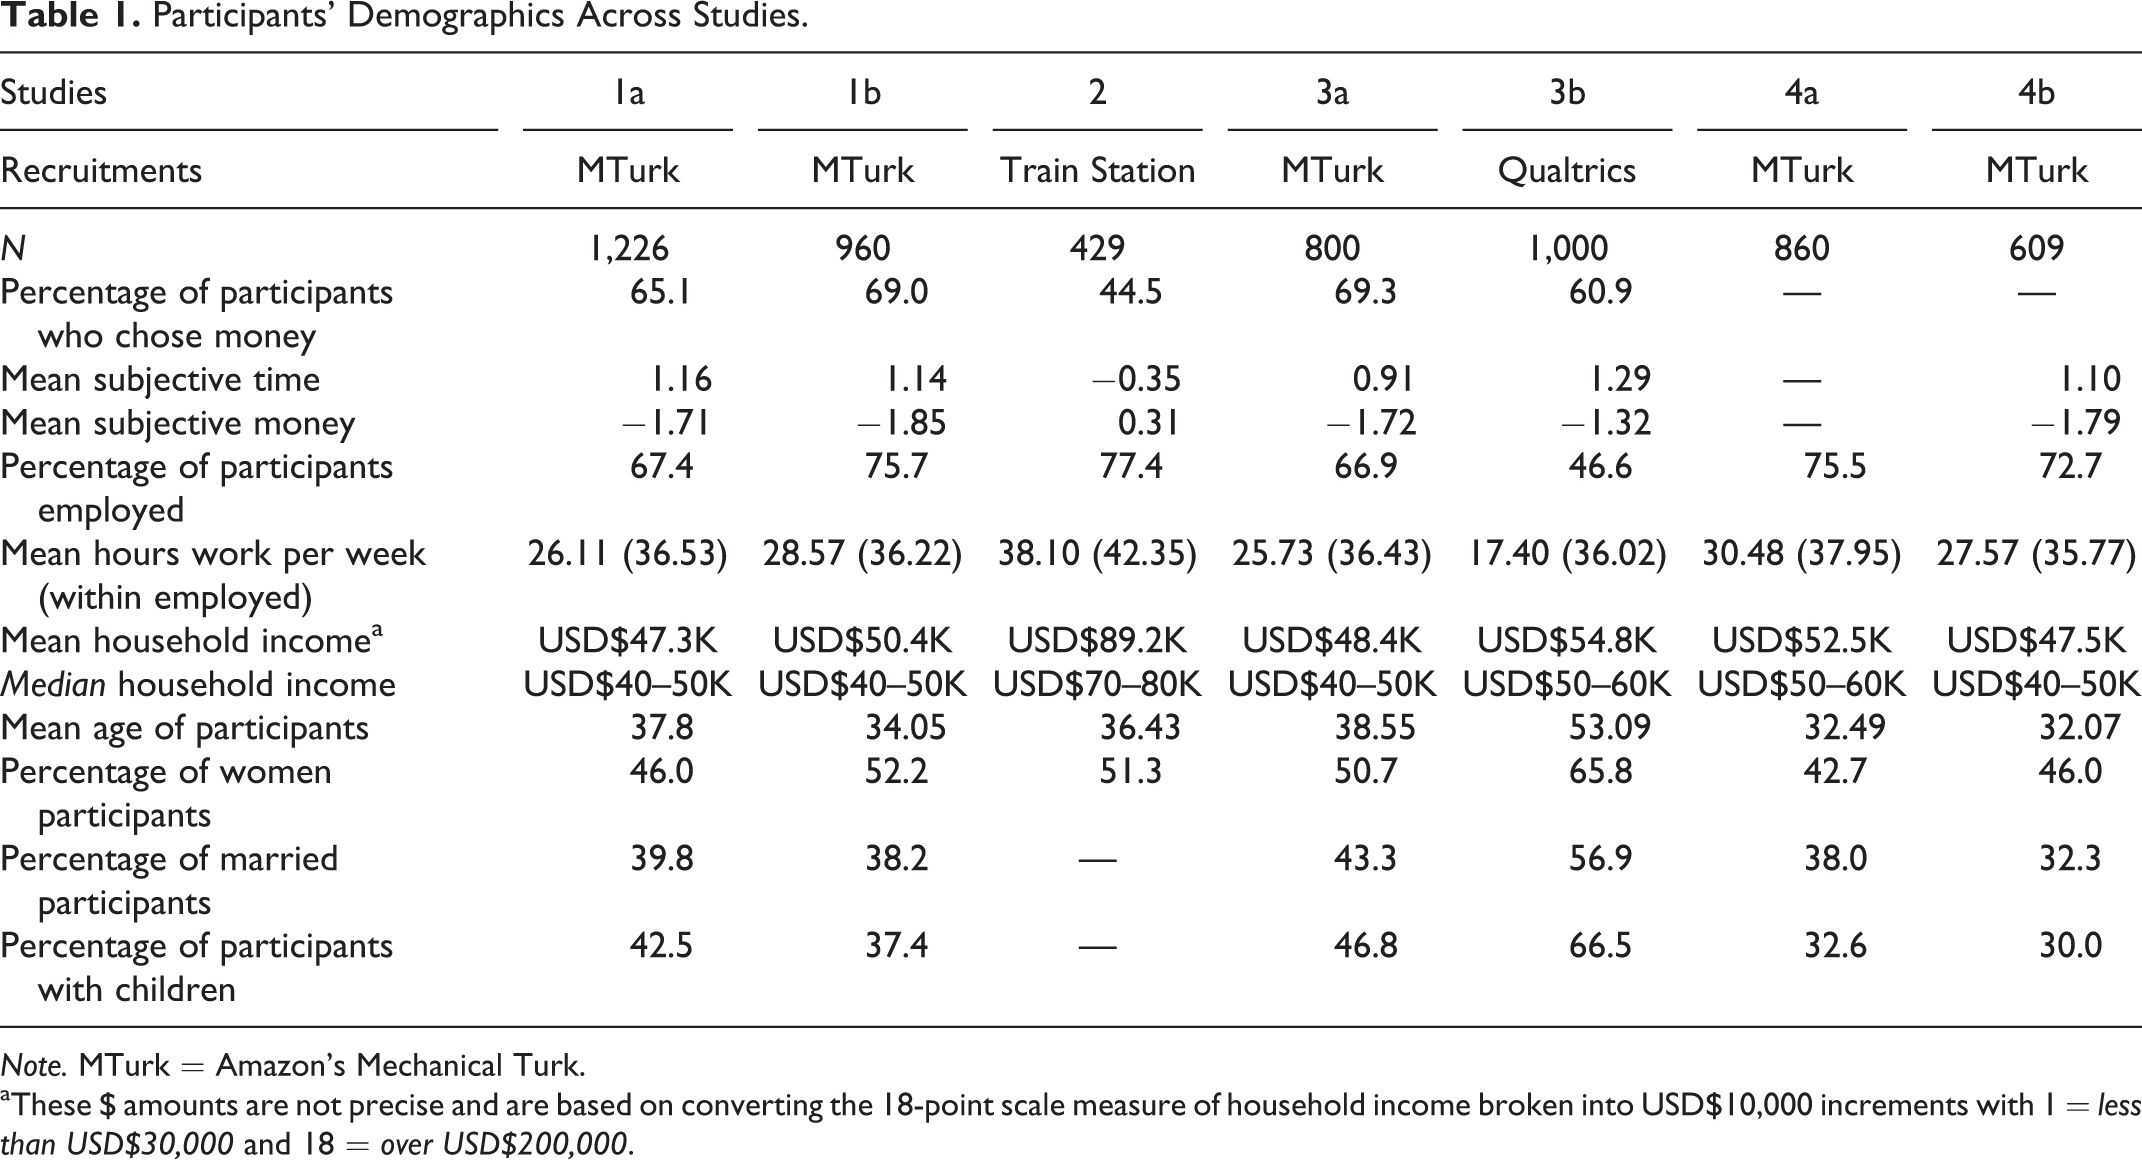
Note. MTurk = Amazon’s Mechanical Turk.
aThese $ amounts are not precise and are based on converting the 18-point scale measure of household income broken into USD$10,000 increments with 1 = less than USD$30,000 and 18 = over USD$200,000.
Participants were asked to report which they wanted more of—money or time (the order of the two options was counterbalanced across participants). Participants then reported the extent to which they wanted their chosen resource on a 7-point scale, which we converted into a continuous measure of “resource preference” ranging from −7 = highest preference for money to 7 = highest preference for time.
To assess happiness, we measured subjective happiness (Lyubomirsky & Lepper, 1999) and life satisfaction (Diener, Emmons, Larsen, & Griffin, 1985), α = .94. The order of the resource preference and happiness measures was counterbalanced across participants.
To control for the amount of each resource individuals already had, we asked participants to report the amount of time and money they have using both subjective and objective measures. The subjective measures asked participants to report how much time and money they feel they have (−5 = very little available time [money] and 5 = lots of available time [money]; Zauberman & Lynch, 2005). The objective measure of available time asked participants to report how many hours they work during a typical week. The objective measure of available money asked participants to report their household’s annual income on an 18-point scale broken into USD$10,000 increments: 1 = less than USD$30,000, 2 = USD$30,000–USD$40,000 … 17 = USD$190,000–USD$200,000, and 18 = over USD$200,000. Participants completed additional demographic questions—including age, gender, employment status, and marital and parental status.
Results
More people chose money (65.1%) than time (34.9%), χ2(1, n = 1,226) = 111.66, p < .001, but people who chose time were happier (M = 4.65, SD = 1.32) than those who chose money (M = 4.18, SD = 1.38), t(1,224) = 5.75, p < .001, 95% CI [.31, .63], d = .33. The continuous measure of resource preference showed the same relationship: The more people preferred time over money, the happier they were, β = .19, t = 6.61, p < .001, 95% CI [.03, .06]. This relationship held controlling for subjective perceptions and objective amounts of available time and money, β = .18, t = 3.28, p < .001, 95% CI [.01, .04], and controlling for age, gender, marital status, and parental status, β = .10, t = 3.48, p < .001, 95% CI [.01, .04] (see Table 2; note that the sample is slightly smaller due to some incomplete responses on demographic questions). The inclusion of these controls rules out the explanation that having more of one’s scarcer resource would make a person happier, and instead suggests that people who place greater personal value on time than money are happier.
Summary of Hierarchical Regression Analysis Predicting Happiness (Study 1).
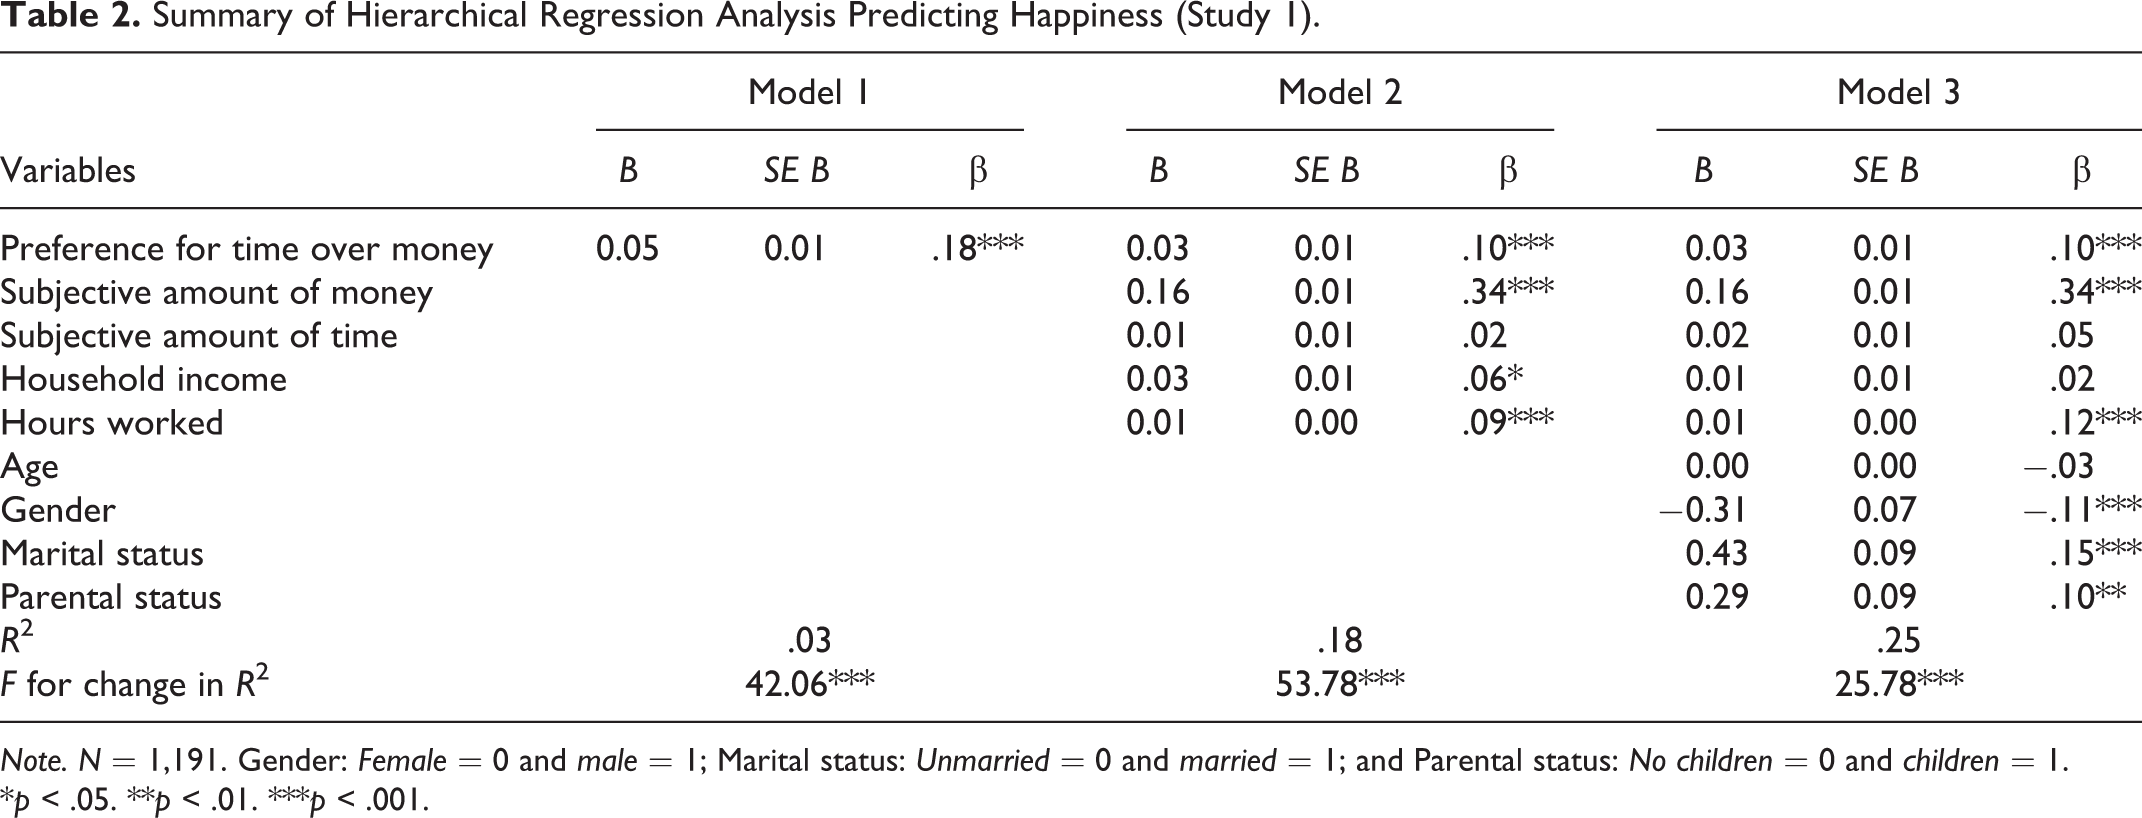
Note. N = 1,191. Gender: Female = 0 and male = 1; Marital status: Unmarried = 0 and married = 1; and Parental status: No children = 0 and children = 1.
*p < .05. **p < .01. ***p < .001.
Among a separate sample of 1,021 MTurk participants, these results replicated controlling for materialism (see Study 1b in SOM). Materialism is an individual difference reflecting the importance one ascribes to the acquisition and ownership of material goods (Richins, 2004; Richins & Dawson, 1992), which negatively correlates with well-being (Burroughs & Rindfleisch, 2002). Although the value one puts on possessions should relate to the value one puts on money (since money is the means by which one acquires possessions), our results suggest that one’s value for owning high-status, luxury products is nonetheless distinct from people’s preferences between time and money.
Study 2
Although research has affirmed the representativeness of MTurk’s subject pool (Goodman, Cryder, & Cheema, 2013), it is possible that online samples are not representative in terms of their available time and money. Study 2 sought to replicate the relationship between choosing time over money and happiness among an in-person sample, who would likely have more money and less time than an online sample. We recruited people while they were waiting for a train, thus ensuring they would have sufficient spare time to participate in the survey regardless of their available time and money more generally.
Method
Participants (N = 535) were recruited in the train station of a major East Coast city to complete a brief survey in exchange for a granola bar. One hundred and six people who did not complete the survey were excluded from the analyses, leaving a final sample of 429.
On a one-page sheet, participants first answered which resource (time or money) they want more of (options counterbalanced across participants) and then reported their happiness and life satisfaction (α = .87). Participants also reported their subjective and objective availability of time and money and their demographics (age, gender, and employment status).
Results
Unlike the MTurk participants in Study 1, this sample was more likely to choose time (55%) than money (45%), χ2(1, n = 429) = 5.12, p = .02. Consistent with the previous results, however, people who chose time were happier (M = 5.28, SD = 0.93) than those who chose money (M = 4.91, SD = 1.10), t(427) = 3.80, p < .001, 95% CI [.18, .56], d = .37. This relationship held controlling for subjective perceptions and objective amounts of available time and money, β = .15, t = 2.79, p = .006, 95% CI [.05, .26], and controlling for age and gender, β = .14, t = 2.57, p = .011, 95% CI [.03, .25] (see Table 3).
Summary of Hierarchical Regression Analysis Predicting Happiness (Study 2).
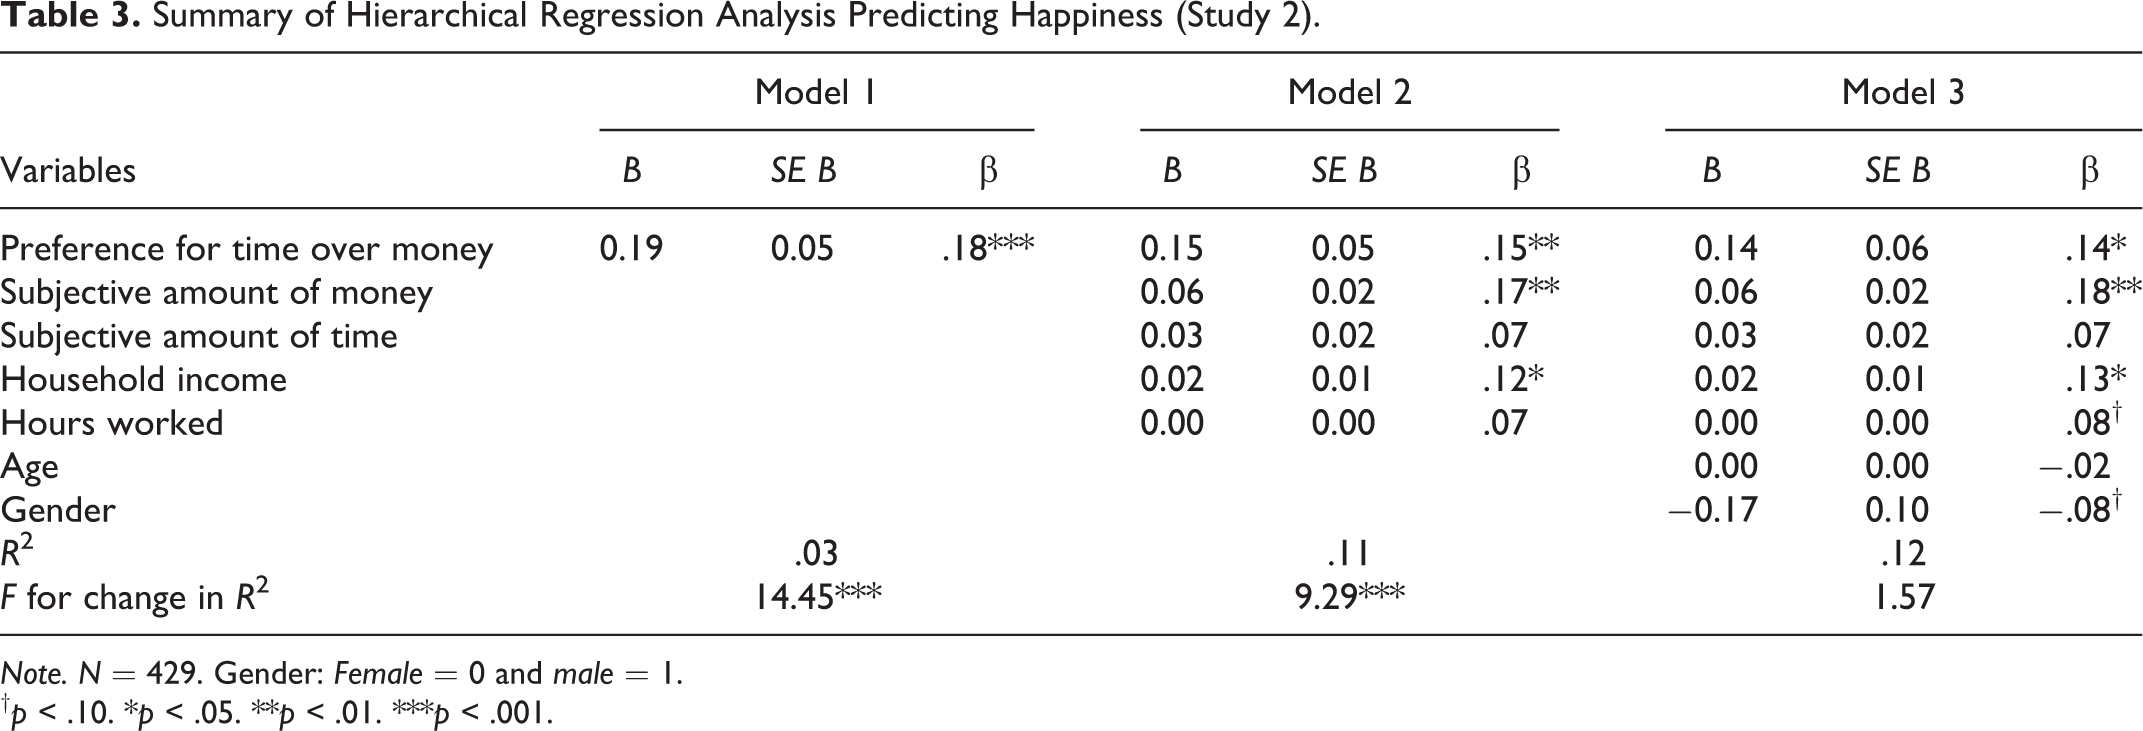
Note. N = 429. Gender: Female = 0 and male = 1.
† p < .10. *p < .05. **p < .01. ***p < .001.
Being wealthier and more time constrained than the online samples (see Table 1), this sample expressed a greater preference for having more time over more money (see General Discussion section). Despite the inconsistency between the samples’ resource preferences, the relationship between resource preference and happiness was consistent: People who chose time over money were happier.
Study 3a
Studies 3a and 3b were conducted to gain insight into the reasons behind people’s choice between more money and more time. Study 3a therefore additionally asked respondents to write why they chose their preferred resource. Participants who chose more time were further asked what form of time they wanted—more time in their day or more time in their life.
Method
Participants (N = 848) were recruited through MTurk to complete the survey in exchange for 60¢. The 48 participants who failed the IMC were excluded from the analyses, leaving a final sample of 800.
Participants first reported which resource they wanted more of—time or money, and then wrote why they chose that resource. To better understand the nature of people’s desire for more time, we also asked those who chose time the extent they wanted more time in their day and the extent they wanted more time in their life.
All participants then reported their happiness and life satisfaction (α = .94), and their subjective and objective availability of time and money and demographics.
Results
As in Study 1, more participants chose money (69.3%) than time (30.8%), χ2(1, n = 800) = 118.58, p < .001. But again, those who chose time were happier (M = 4.89, SD = 1.17) than those who chose money (M = 4.22, SD = 1.33), t(798) = 6.89, p < .001, 95% CI [.48, .77], d = .49. This relationship held controlling for subjective and objective amounts of available time and money, β = .15, t = 4.06, 95% CI [.11, .32], p < .001, and controlling for age, gender, marital status, and parental status as well, β = .13, t = 3.64, 95% CI [.09, .29], p < .001 (see Table 4).
Summary of Hierarchical Regression Analysis Predicting Happiness (Study 3a).
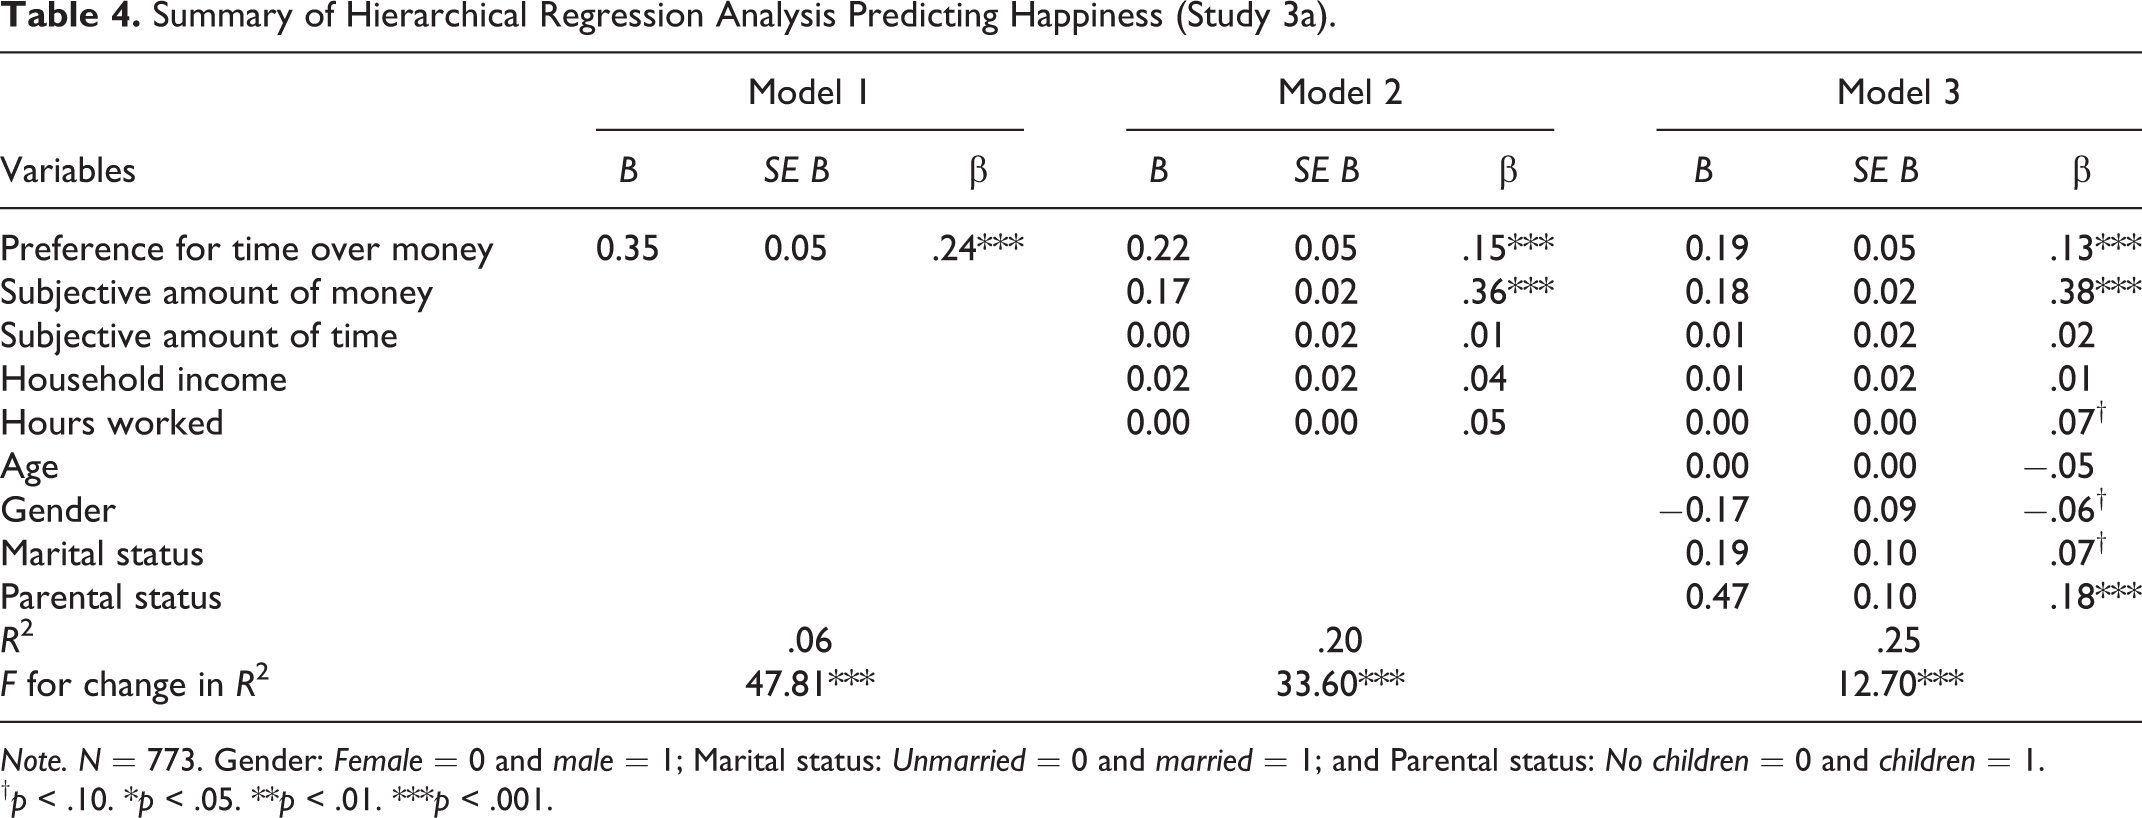
Note. N = 773. Gender: Female = 0 and male = 1; Marital status: Unmarried = 0 and married = 1; and Parental status: No children = 0 and children = 1.
† p < .10. *p < .05. **p < .01. ***p < .001.
Participants who chose time reported wanting more time in their days (M = 5.82, SD = 1.38) as well as more time in their lives (M = 6.41, SD = 1.10) on 7-point scales. These two sources of additional time were correlated, r(244) = .15, p = .02, and wanting more time in one’s day was not related to happiness, r(244) = −.07, p = .26, nor was wanting more time in one’s life, r(244) = −.03, p = .60. This suggests that the relationship between wanting more time over money and happiness is not restricted to a local (i.e., daily life) or global (i.e., life overall) conception of time.
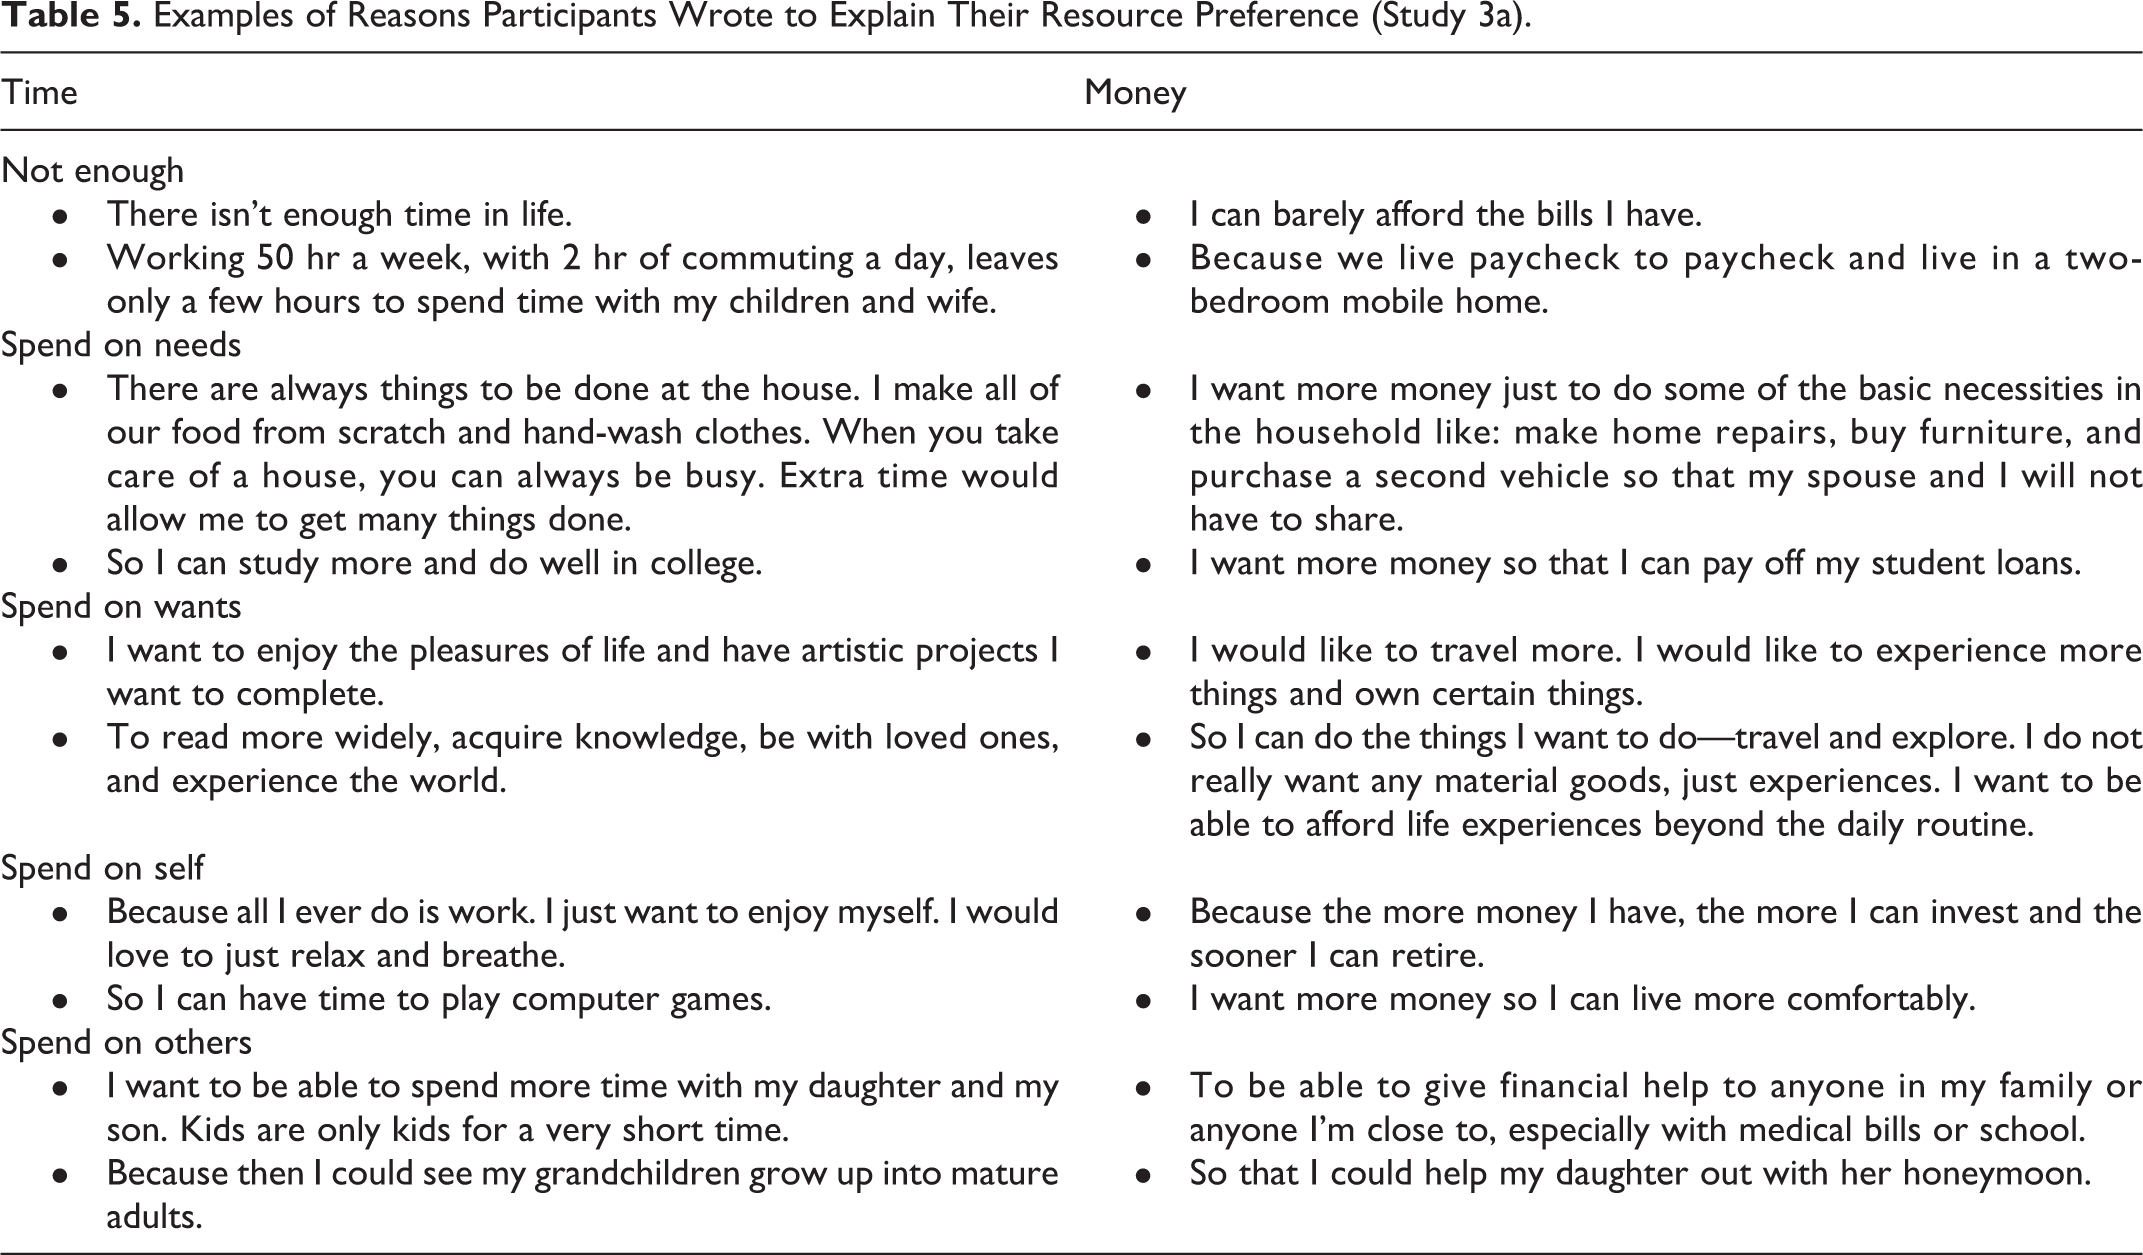
The reasons participants generated for choosing their desired resource showed a split between reasons that focused on not having enough of the resource and reasons that focused on what people would spend that resource on if they had more (see Table 5). Among those who mentioned how they would spend the additional time/money, we observed two dimensions of spending targets. The first reflected a split between using the resource to cover needs (e.g., paying bills) and using the resource to cover wants (e.g., traveling). The second reflected a split between intentions to spend on oneself and intentions to spend on others. Two independent coders blind to our hypothesis categorized each response on these three dimensions, demonstrating substantial to almost perfect consistency (κ coefficients .64 to .87; Landis & Koch, 1977).
Examples of Reasons Participants Wrote to Explain Their Resource Preference (Study 3a).
Study 3b
Study 3b recruited a sample to represent national distributions of wealth and employment status to more methodically examine the reasons underlying people’s resource preference. In addition, we surveyed these participants again 1 year later to assess the consistency of their resource preference.
Method
Participants (N = 1,000) were recruited through Qualtrics Panels for being representative of the U.S. population in terms of wealth and employment status. Participants who did not pass the IMC were not included in the sample of 1,000 delivered to us.
Participants first reported which resource they wanted more of—time or money—and then rated whether they chose that resource primarily because they were thinking about not having enough of it versus what they would spend it on if they had more. Next, participants were asked if they were to receive more of their chosen resource, to what extent they would spend it on things they need (to do) versus things they want (to do). Participants were then asked whether they would spend their chosen resource on themselves versus other people. If participants chose time, they were additionally asked the extent to which they wanted more hours in their daily life versus more years in their life overall. If participants chose money, they were additionally asked the extent to which they would spend it on material possessions versus experiences.
Participants then reported their subjective happiness and life satisfaction (α = .93), followed by the measures of subjective and objective available time and money and demographics.
Results
Consistent with the other online panels, more participants chose money (60.9%) than time (39.1%), χ2(1, n = 1,000) = 47.52, p < .001. We again found that participants who chose time were happier (M = 5.04, SD = 1.09) than those who chose money (M = 4.38, SD = 1.31), t(998) = 8.27, p < .001, 95% CI [.50, .81], d = .52. This relationship held controlling for subjective and objective amounts of available time and money, β = .15, t = 4.25, 95% CI [.11, .29], p < .001, and controlling for age, gender, marital status, and parental status as well, β = .14, t = 4.11, 95% CI [.10, .28], p < .001 (see Table 6).
Summary of Hierarchical Regression Analysis Predicting Happiness (Study 3b).

Note. N = 943. Gender: Female = 0 and male = 1; Marital status: Unmarried = 0 and married = 1; and Parental status: No children = 0 and children = 1.
† p < .10. *p < .05. **p < .01. ***p < .001.
Examining what reasoning was associated with happiness, we found that focusing on how they would spend the resource (vs. focusing on not having enough of it) was associated with greater happiness, r(998) = .30, p < .001. Additionally, intending to spend the additional resource more on wants (vs. on needs), r(998) = .24, p < .001, and on others (vs. on oneself), r(998) = .22, p < .001, were each associated with greater happiness. This latter result builds on prior work (Dunn, Aknin, & Norton, 2008) by showing that the hedonic benefits of prosocial spending extend from spending money to spending time. We also found that among those who chose money, intending to spend the money on experiences (vs. on material possessions) was associated with greater happiness, r(607) = .17, p < .001, which is consistent with prior work (Van Boven & Gilovich, 2003). Lastly, like in the previous study, among those who chose time, wanting more hours in their day (vs. more years in their life) was unrelated to happiness, r(389) = .04, p = .49. This supports the idea that the link between a preference for time and happiness is not specific to a type of additional time, but time in general.
Furthermore, participants who chose time over money were greater endorsers of these reasons associated with happiness. Compared to those who chose money, people who chose time focused more on how they would spend it rather than on not having enough (M tchooser = 5.65, SD = 2.36 vs. M mchooser = 4.18, SD = 2.59), t(998) = 9.10, p < .001, 95% CI [1.16, 1.80], d = .58; they intended to spend it more on wants than on needs (M tchooser = 5.97, SD = 1.76 vs. M mchooser = 4.16, SD = 1.99), t(998) = 14.65, p < .001, 95% CI [1.56, 2.05], d = .93; and they intended to spend it more on others than on themselves (M tchooser = 5.48, SD = 1.62 vs. M mchooser = 5.06, SD = 1.59), t(998) = 4.09, p < .001, 95% CI [.22, .63], d = .26.
Together these results suggest that whereas focusing on not having enough time or money may not be conducive to happiness, focusing on how one would spend additional amounts of these resources is associated with greater happiness. In particular, spending on others rather than oneself and spending on wants rather than needs are associated with greater happiness. This rationale helps explain the link between choosing time over money and happiness, because choosers of time have greater intentions to spend their gained resource in these prosocial and desirable ways.
One year later, we approached the 1,000 participants and again asked which they want more of—money or time. Eight hundred sixty-three participants responded, 74.8% of whom chose the same resource as in the original study. Cohen’s κ was .478, suggesting moderate consistency (Landis & Koch, 1977).
Study 4a
The previous studies consistently show a positive relationship between wanting time over money and happiness. However, all of the results are correlational. In the final two studies, we examine the causal direction of the relationship using similar experimental paradigms to manipulate people’s resource preference and then measure happiness (Study 4a) and to manipulate people’s happiness and then measure their resource preference (Study 4b).
Method
Participants (N = 923) were recruited through MTurk for a payment of 40¢. The 63 participants who failed the IMC were excluded from the analyses, leaving a final sample of 860.
Participants were randomly assigned to one of the three conditions: a wanting time condition in which they were instructed to spend 2 min writing about why they would want to have more time instead of more money, a wanting money condition in which they were instructed to spend 2 min writing about why they would want more money instead of more time, and a control condition in which they spent 2 min writing 10 facts (Tully, Hershfield, & Meyvis, 2015). Participants were then asked to report their subjective happiness and life satisfaction (α = .94). As a manipulation check, participants then rated their preference between having more money versus more time. Lastly, participants reported their demographics—including objective measures of their available time (hours worked per week) and money (annual household income). We did not measure subjective perceptions of available time and money, because being instructed to write about wanting more time or more money would surely influence how much time and money participants feel they have. We included the objective measures of resource availability to confirm random assignment and ensure that any effects were caused by the manipulation and not how much time or money participants in each condition actually had.
Results
The manipulation check confirmed differences in resource preference across conditions, F(2, 857) = 35.28, p < .001,
Although there was only a marginal difference across conditions for happiness, F(2, 857) = 2.40, p = .09,
These results show that people’s resource preferences are subject to situational influence, and they are suggestive of a causal relationship whereby preferring more time over money has a positive influence on happiness.
Study 4b
Study 4b tested the opposite causal relationship to the one found in Study 4a. Using a similar writing task paradigm, we first manipulated participants’ happiness levels and then measured their preference between more time and more money.
Method
Participants (N = 636) were recruited through MTurk for a payment of 40¢. The 27 participants who failed the IMC were excluded from the analyses, leaving a final sample of 609.
Participants were randomly assigned to one of the three conditions: a happiness condition in which they were instructed to spend 2 min writing about the ways they were happy and satisfied with their life right now, an unhappy condition in which they spent the 2 min writing about the ways they were unhappy and not satisfied with their life right now, and a control condition without this initial writing task.
All participants were then asked which they wanted more of—time or money. As a manipulation check, participants then rated how happy they were and how unhappy they were. The unhappy measure was reverse coded, and these items were combined (α = .88). Lastly, participants completed the subjective measures of available time and money and demographic questions—including the objective measures of available time (hours worked per week) and money (annual household income).
Results
The manipulation check confirmed differences in happiness across conditions, F(2, 606) = 38.16, p < .001, d = .50. Contrast tests indicated that participants in the happy condition felt happier (M = 5.37, SD = 1.23) than those in the unhappy condition (M = 4.06, SD = 1.66), t = 8.70, p < .001. Those in the control condition were in-between (M = 4.79, SD = 1.50) and were statistically different from the happy condition, t = 3.94, p < .001, and the unhappy condition, t = 5.11, p < .001.
Participants’ assigned condition had a significant effect on their propensity to choose time versus money, χ2(2, n = 609) = 9.28, p = .01. This effect held controlling for subjective perceptions and objective amounts of available time and money, b = .38, Wald statistic = 8.28, p = .004, 95% CI [1.13, 1.90], and controlling for age, gender, marital status, and parental status as well, b = .40, Wald statistic = 8.79, p = .003, 95% CI [1.15, 1.94] (happy condition = 1, control = 0, and unhappy = −1). Importantly, participants led to feel happy were more likely to choose time over money (35.5%) compared to participants in both the control condition (26.7%), χ2(1, n = 411) = 3.72, p = .05, d = .19, and participants led to feel unhappy (21.7%), χ2(1, n = 384) = 8.94, p < .01, d = .31. There were no differences in choice for participants in the unhappy and control conditions, χ2(2, n = 423) = 1.40, p = .24. These results are suggestive of a causal relationship whereby being happier makes one more likely to prefer time over money than being unhappy. The combination of results for Studies 4a and 4b suggests that the relationship between resource preference and happiness is bidirectional.
General Discussion
Pooling our survey data (Studies1–3b), we found that across thousands of adults representing a range of ages, income levels, and occupations who were recruited online and in person, though more people chose more money over time (64%), those who chose more time over money were happier (M tchooser = 4.91, SD = 1.19 vs. M mchooser = 4.26, SD = 1.35), t(4,413) = 16.04, p < .001, 95% CI [.57, .73], d = .48. This relationship held controlling for both objective and subjective amounts of available time and money, β = .13, t = 8.07, p < .001, 95% CI [.14, .22], indicating that what matters is the value people place on each resource and not necessarily the amount of time or money they have (or feel they have). Notably, the effect of resource preference was small when we accounted for other factors related to happiness (i.e., age, gender, marital status, parental status, and materialism; βs = .09–.16), but perhaps more important, the effect of this singular choice on happiness remained statistically significant across studies and samples.
This link between valuing time over money and happiness is consistent with a concurrent investigation (Whillans et al., 2016). In addition to showing the replicability of this new and interesting finding using a more direct measure among a broader sample (Vazire, 2016), our results built on those of Whillans, Weidman, and Dunn (2016) in several ways. First, using third-person judgments of others’ choices between time and money, they sought to establish “resource orientation” as a stable individual difference measure. Our retest results (Study 3b) and experiments (Studies 4a and 4b), however, suggest that people’s preferences between time and money are only moderately consistent over time and are subject to situational influence. Second, by delving into the different thought processes between those who value one resource over the other (Studies 3a and 3b), we further learned that the relationship between preferring time over money and happiness stems from distinct tendencies in attention (on ways to spend vs. constraints) and intention (to spend on wants vs. needs and on others vs. oneself) that are more conducive to emotional well-being. Lastly, by using a direct first-person binary choice to measure resource preference, we were able to gain greater insight into the role of these two resources in personal happiness. For instance, we could examine the characteristics of individuals who chose time versus money. Pooling our survey data, we observed a relationship between age and the likelihood to choose time over money that is interesting in its own right and warrants future investigation: time choosers were older than money choosers (M tchooser = 41.64, SD = 16.46 vs. M mchooser = 39.77, SD = 15.19), t(4,413) = 3.80, p < .001, 95% CI [.90, 2.83], d = .11. Also, compared to money choosers, time choosers were more likely to have children (54.9%tchooser vs. 44.6%mchooser), χ2(1, n = 3,986) = 37.64, p < .001, and to be married (51.2%tchooser vs. 41.0%mchooser), χ2(1, n = 3,986) = 36.38, p < .001; there was no gender difference (p = .54). Perhaps not surprisingly, resource availability influenced resource preference: time choosers felt like they had less time (M tchooser = −0.47, SD = 2.70 vs. M mchooser = 1.83, SD = 2.55), t(4,413) = 28.16, p < .001, 95%CI [2.14, 2.46], d = .85, and more money (M tchooser = −0.37, SD = 2.93 vs. M mchooser = −2.07, SD = 2.79), t(4,413) = 19.15, p < .001, 95%CI [1.53, 1.88], d = .58. They also had a higher average household income (M tchooser = 4.86, SD = 3.81 vs. M mchooser = 3.81, SD = 3.26), t(4,203) = 9.37, p < .001, 95% CI [.83, 1.27], d = .29, and less discretionary time from working more hours per week (M tchooser = 27.25, SD = 20.76 vs. M mchooser = 24.51, SD = 19.48), t(4,139) = 4.26, p < 001, 95% CI [1.48, 4.01], d = .13.
Our data also help inform how the amount of each resource people have relates to happiness. For instance, the pooled data suggest that happiness is associated with feelings of having more money, r(4,413) = .31, p < .001, and less time, r(4,413) = −.13, p < .001), and with higher income, r(4,203) = .24, p < .001, and working more hours per week, r(4,139) = .11, p < .001. These results highlight that though it may be better to want more time, it may be better to actually have more money. This positive relationship between wealth and happiness is consistent with prior work (Kahneman & Deaton, 2010), but our finding that the time constrained are happier is inconsistent with prior work that found a positive relationship between time affluence and happiness (Kasser & Sheldon, 2009). The relationship between the amount of time one has and happiness is intriguing and deserves further investigation. Perhaps more than the total amount of discretionary time, happiness depends on whether that time is indeed viewed as discretionary, whether it is experienced as positive (e.g., a break) or negative (e.g., waiting) or how it is ultimately spent. Regardless, we found that beyond the amount of these resources people have, happiness is linked to the resource people want.
Life frequently presents time versus money trade-offs. We distilled these decisions into a singular choice and showed that the way people answer this question predicts their happiness. Although time and money are both valuable resources that give hope for greater happiness, choosing time over money promises a happier life.
Footnotes
Acknowledgments
While conducting this research, the arrival of Hayes (Hal’s first baby) and Olivia (Cassie’s second baby) led the authors to wish for more time in their days and in their lives. The authors are deeply grateful for the associated happiness.
Authors’ Note
Hal E. Hershfield and Cassie Mogilner contributed equally to this work and are ordered alphabetically.
Declaration of Conflicting Interests
The author(s) declared no potential conflicts of interest with respect to the research, authorship, and/or publication of this article.
Funding
The author(s) disclosed receipt of the following financial support for the research, authorship, and/or publication of this article: The authors thank the Anderson School of Management and Wharton’s Dean’s Research Fund for financial support.

References
Supplementary Material
Please find the following supplemental material available below.
For Open Access articles published under a Creative Commons License, all supplemental material carries the same license as the article it is associated with.
For non-Open Access articles published, all supplemental material carries a non-exclusive license, and permission requests for re-use of supplemental material or any part of supplemental material shall be sent directly to the copyright owner as specified in the copyright notice associated with the article.
