




Abstract
While a large body of research has investigated cultural differences in behavior, this typical study assesses a single behavioral outcome, in a single context, compared across two countries. The current study compared a broad array of behaviors across 21 countries (N = 5,522). Participants described their behavior at 7:00 p.m. the previous evening using the 68 items of the Riverside Behavioral Q-sort (RBQ). Correlations between average patterns of behavior in each country ranged from r = .69 to r = .97 and, in general, described a positive and relaxed activity. The most similar patterns were United States/Canada and least similar were Japan/United Arab Emirates (UAE). Similarities in behavior within countries were largest in Spain and smallest in the UAE. Further analyses correlated average RBQ item placements in each country with, among others, country-level value dimensions, personality traits, self-esteem levels, economic output, and population. Extroversion, openness, neuroticism, conscientiousness, self-esteem, happiness, and tolerant attitudes yielded more significant correlations than expected by chance.
When we wonder how people around the world are similar and different, we are typically interested in what they value, how they think, and what they do. While the former two are relevant to differences in internal psychological processes, the latter speaks to the observable cultural environment in which daily life is lived. Investigation of daily life around the world by anthropologists and cross-cultural psychologists is not a new enterprise; however, researchers in these two disciplines approach this task differently. Anthropologists generally emphasize qualitative descriptions and avoid or completely eschew cross-cultural comparisons (Frake, 1980; Shweder, 1991), whereas cross-cultural psychologists typically assess a few dimensions of cultural variation (or even one) and rarely gather detailed information about any single culture. The present investigation seeks to bridge the gap between these approaches by providing a snapshot of a wide array of individuals’ behaviors in each of nearly two dozen countries on four continents.
Background
Over the last 40 years, the field of cross-cultural psychology has made impressive strides in understanding cross-national variation in a host of phenomena, including values (Bond & Smith, 1996; Earley, 1994; Hofstede, 1980; Hofstede & McCrae, 2004; Morling & Lamoreaux, 2008; Myers & Diener, 1995; Oyserman, 1993), personality (Allik & McCrae, 2004; McCrae, 2001; McCrae et al., 2004; McCrae & Costa, 1997; Schmitt, Allik, McCrae, & Benet-Martínez, 2007), self-construal (Cross, 1995; Heine, 2001; Markus & Kitayama, 1991; Singelis & Sharkey, 1995), situational experience (Funder, Guillaume, Kumagai, Kawamoto, & Sato, 2012; Guillaume et al., 2016), self-esteem (Bleidorn et al., 2015), well-being (Diener, 2000), motivation (Duda & Allison, 1989; McInerney & Ali, 2006), and intelligence (Furnham & Fong, 2000). Cross-national investigations of behavior have not been quite so comprehensive. Indeed, when cross-cultural researchers turn their attention to behavior, those interested in applied differences between countries often limit their investigation to assessing a single behavior, such as timeliness or aggression (Catalá-Miñana, Walker, Bowen, & Lila, 2014; Heine, Buchtel, & Norenzayan, 2008), in a single context, such as the workplace or the classroom (Lievens, Harris, Van Keer, & Bisqueret, 2003; Park & Huebner, 2005). 1 Moreover, whether they focus on values, cognition, or behavior, studies in cross-cultural psychology usually compare a relatively small number of countries—often as few as two—along a limited set of constructs. In particular, many pioneering studies have focused on comparisons between the United States and Japan (Funder et al., 2012; Markus & Kitayama, 1991; Tsujioka & Cattell, 1965; Yamaguchi, Kuhlman, & Sugimori, 1995) and have been organized around the value dichotomy of individualism–collectivism (Benet-Martínez & Karakitapoglu- Aygün, 2003; Hofstede, 1980, 2001; Hofstede, Hofstede, & Minkov, 1991; Oyserman & Lee, 2008; Schwartz, 1990).
While such studies are valuable, they are limited in the information they provide about broad behavioral similarities and differences around the world. The present study aims to complement prior research by assessing and comparing an unusually wide array of behaviors across an unusually large number of countries. Specifically, we asked participants from 21 countries to rate the degree to which they performed each of the 68 diverse behaviors encapsulated in the Riverside Behavioral Q-sort (RBQ; Funder, Furr, & Colvin, 2000) at 7:00 p.m. the previous night. We then evaluated the degree to which the enactment of different behaviors was, on average, associated with various cultural properties of the countries involved in the study, including average personality trait levels, economic output, population, and individual differences including self-esteem, happiness, and tolerant attitudes, to name a few.
Our investigation has three concrete goals: It seeks to examine (a) similarities and differences in average behavior across countries, (b) the degree to which the behavior of different individuals is similar within compared to across countries, and (c) how the average expression of particular behaviors is associated with other aspects of cultural variation.
These goals stem from the overriding motivation to capture and compare how individuals across the world live their lives. Because life is lived through one’s actions moment by moment, assessing a wide array of behaviors in a single moment in time provides a glimpse into individuals’ lives and the cultural environment they create through what they do. Thus, the current investigation increases our understanding of daily life around the world both at the level of the individual and the country.
The Present Study
The Riverside–Behavioral Q-Sort
The present research seeks to assess behavior comprehensively across countries through the first cross-cultural use of the RBQ (Funder et al., 2000). The RBQ is an assessment tool in which participants can indicate the extent to which they enacted certain behaviors (e.g., smiles frequently) on a given occasion by sorting each of the 68 descriptive items into a quasi-normal, forced distribution of nine categories ranging from highly characteristic (Category 9) to highly uncharacteristic (Category 1). The RBQ may be particularly appropriate for cross-cultural research because it alleviates or even eliminates some of the measurement biases that have long been of concern when comparing psychological phenomena across countries (Heine, Lehman, Peng, & Greenholtz, 2002; Ross & Mirowsky, 1984). Specifically, because participants are forced to sort a limited number of behaviors into each rating category, the possible influences of extreme response sets and acquiescence are eliminated. The forced choice aspect of Q-sorts may also lessen the reference group effect 2 because each participant rates each behavior in terms of how characteristic it is of his or her behavior compared to the other 67 items in the set—not whether it is more characteristic of his or her behavior compared to the behavior of other people in the local culture. The data are thus ipsatized within persons and yield an entire behavioral profile (made up of 68 behaviors) for each individual as the unit of analysis (Ozer, 1993).
Despite the potential advantages of Q-sort methodology for cross-cultural psychology, the technique can be difficult to implement, especially across many languages and cultural contexts. This difficulty may explain why it has not been employed in an international context before. Recently, however, an online version of the RBQ and other Q-sort assessments was developed, enabling their worldwide dissemination (see Guillaume et al., 2016).
Research Goals
The current project utilizes the RBQ to explore the similarities and differences in behavior across countries as well as the distinctive qualities of each country’s daily behaviors. More specifically, the present research has four goals: Estimate similarities and differences in behaviors across 21 countries. Here, we aim to understand which countries are, on average and overall, most and least behaviorally similar to one another as well as what people around the world are doing, in general, at the same time of day. Examine variation in individuals’ behavior both between and within countries. We seek to discover which countries are the most and least behaviorally homogeneous and how this within-country variation compares to the variation in behavior between countries. Associate country-level average behavior with other country-level variables (i.e., cultural values, personality, self-esteem, and population size). Interpret the behavioral manifestation of various cultural and personality dimensions by considering the customs and social norms of particularly distinct countries.
The research project described here aimed to gather an unprecedented body of descriptive data. It was exploratory; thus, we did not have preexisting hypotheses that we set out to confirm. While there is a general theoretical basis for expecting geographic variation in behavior (e.g., biological and social differences across individuals and physical differences across environments; see Rentfrow et al., 2008), we did not have any a priori hypotheses on what these would be. Likewise, we did not include or omit particular countries on the basis of hypothesized geographic variation. Venturing into a research territory not widely explored by previous studies, we simply aimed to explore similarities and differences in a variety of behaviors across many countries as a foundation for further, empirically based theory building (see Haig, 2005).
Method
Participants
We sought to collect as many participants as possible in as many countries as possible. This effort led to data collected in 21 countries with a total N = 5,522 (female = 3,523, male = 1,999; mean age = 22 years, SD = 4.25, range: 16–30 years). All participants were members of college communities recruited by research collaborators in each country. Table 1 provides demographic information and recruitment procedures for each of the data collection sites.
Samples From 21 Countries.
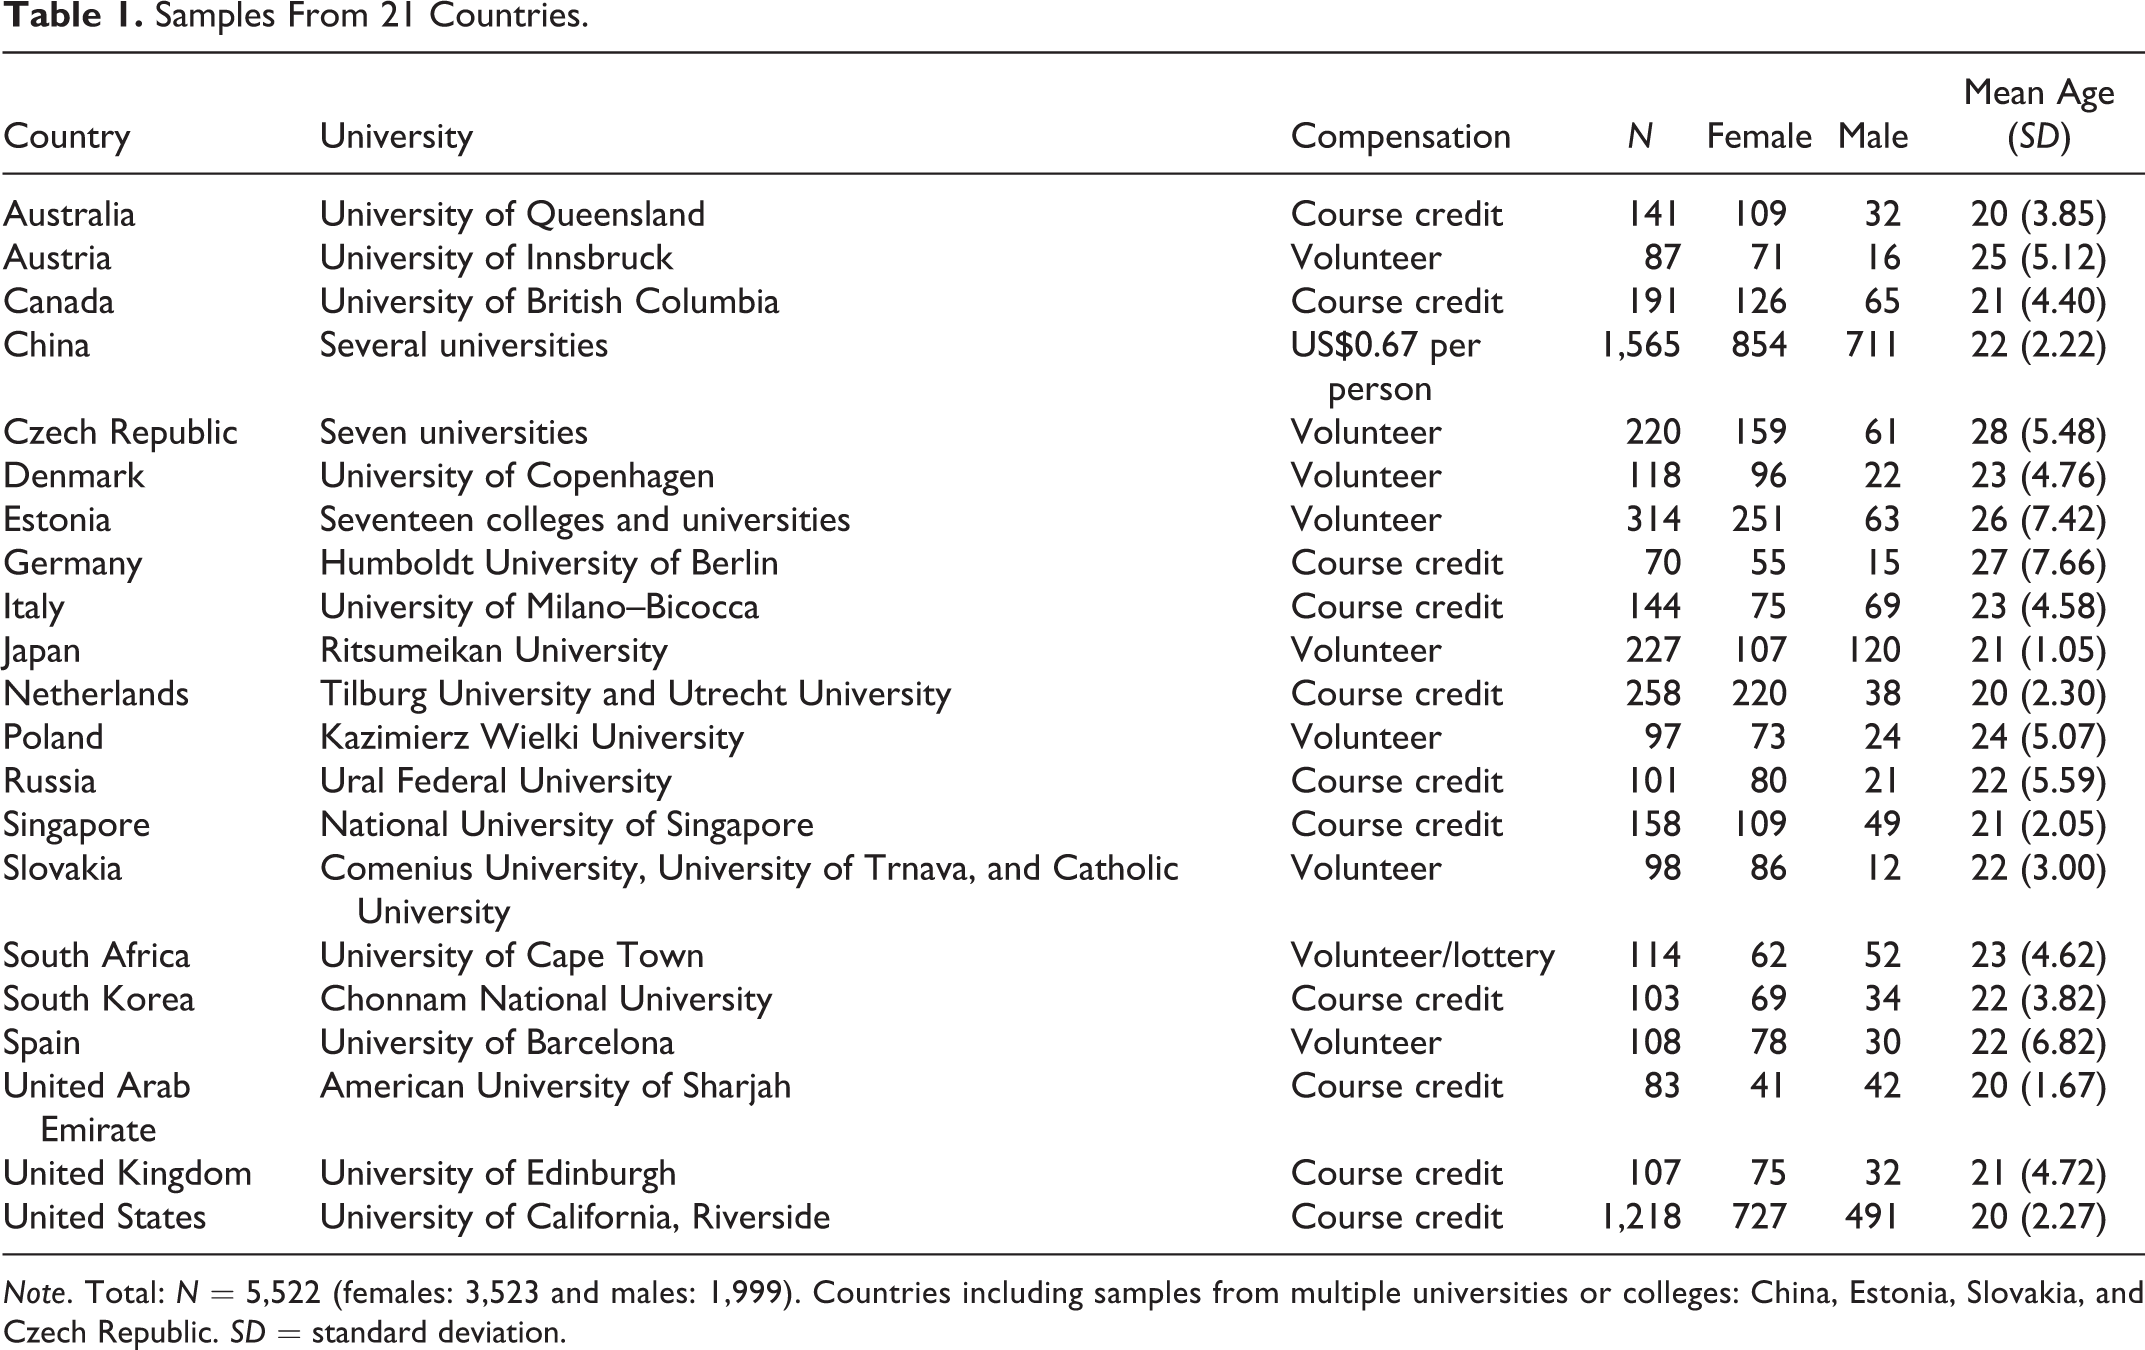
Note. Total: N = 5,522 (females: 3,523 and males: 1,999). Countries including samples from multiple universities or colleges: China, Estonia, Slovakia, and Czech Republic. SD = standard deviation.
Procedure
Collaborators in each country directed their participants to our custom-made website (www.internationalsituationsproject.com), where participants were prompted to select their language of assessment by clicking on their respective country’s flag and then to enter their assigned study and participant ID numbers. Participants then provided demographic information and described what they were doing at 7:00 p.m. the evening before. Specifically, they were asked to write a brief description of (1) who they were with, (2) where they were, and (3) what they were doing. We chose 7:00 p.m. as the time of assessment under the assumption that people are typically not at work or in school and are therefore more unconstrained to do what they wish relative to other hours of the day. We expected this tendency to enhance situational and behavioral variation. After providing their open-ended descriptions, participants quantified their situational experience using the Riverside Situational Q-sort (RSQ) and, subsequently, their behaviors in this situation using the RBQ. Analyses of the RSQ data, from 20 of the 21 countries in the present study, were previously reported by Guillaume et al. (2016). 3 All the analyses in the present study are new.
Measure
The RBQ was translated and independently back-translated in collaboration with our international collaborators, who are all psychologists with university faculty appointments. We worked with these collaborators to resolve any discrepancies between the original and back-translated English versions. After our collaborators translated the RBQ items into their respective languages, independent native speakers back-translated the items into English. We then reviewed any discrepancies and edited the items to match their original meaning. For a review of this translation procedure, see Brislin (1970). In the Q-sort method, participants can only place a certain number of items into each category. This yields a quasi-normal bell curve, in which the most extreme categories have the fewest items and the neutral category has the most. Specifically, participants placed the 68 items into nine categories as follows: 3, 5, 7, 11, 16, 11, 7, 5, and 3. Table 2 displays the mean placement for each RBQ item for each of the 21 countries as well as overall across the entire sample.
Riverside Behavioral Q-Sort Item Means Across 21 Countries.
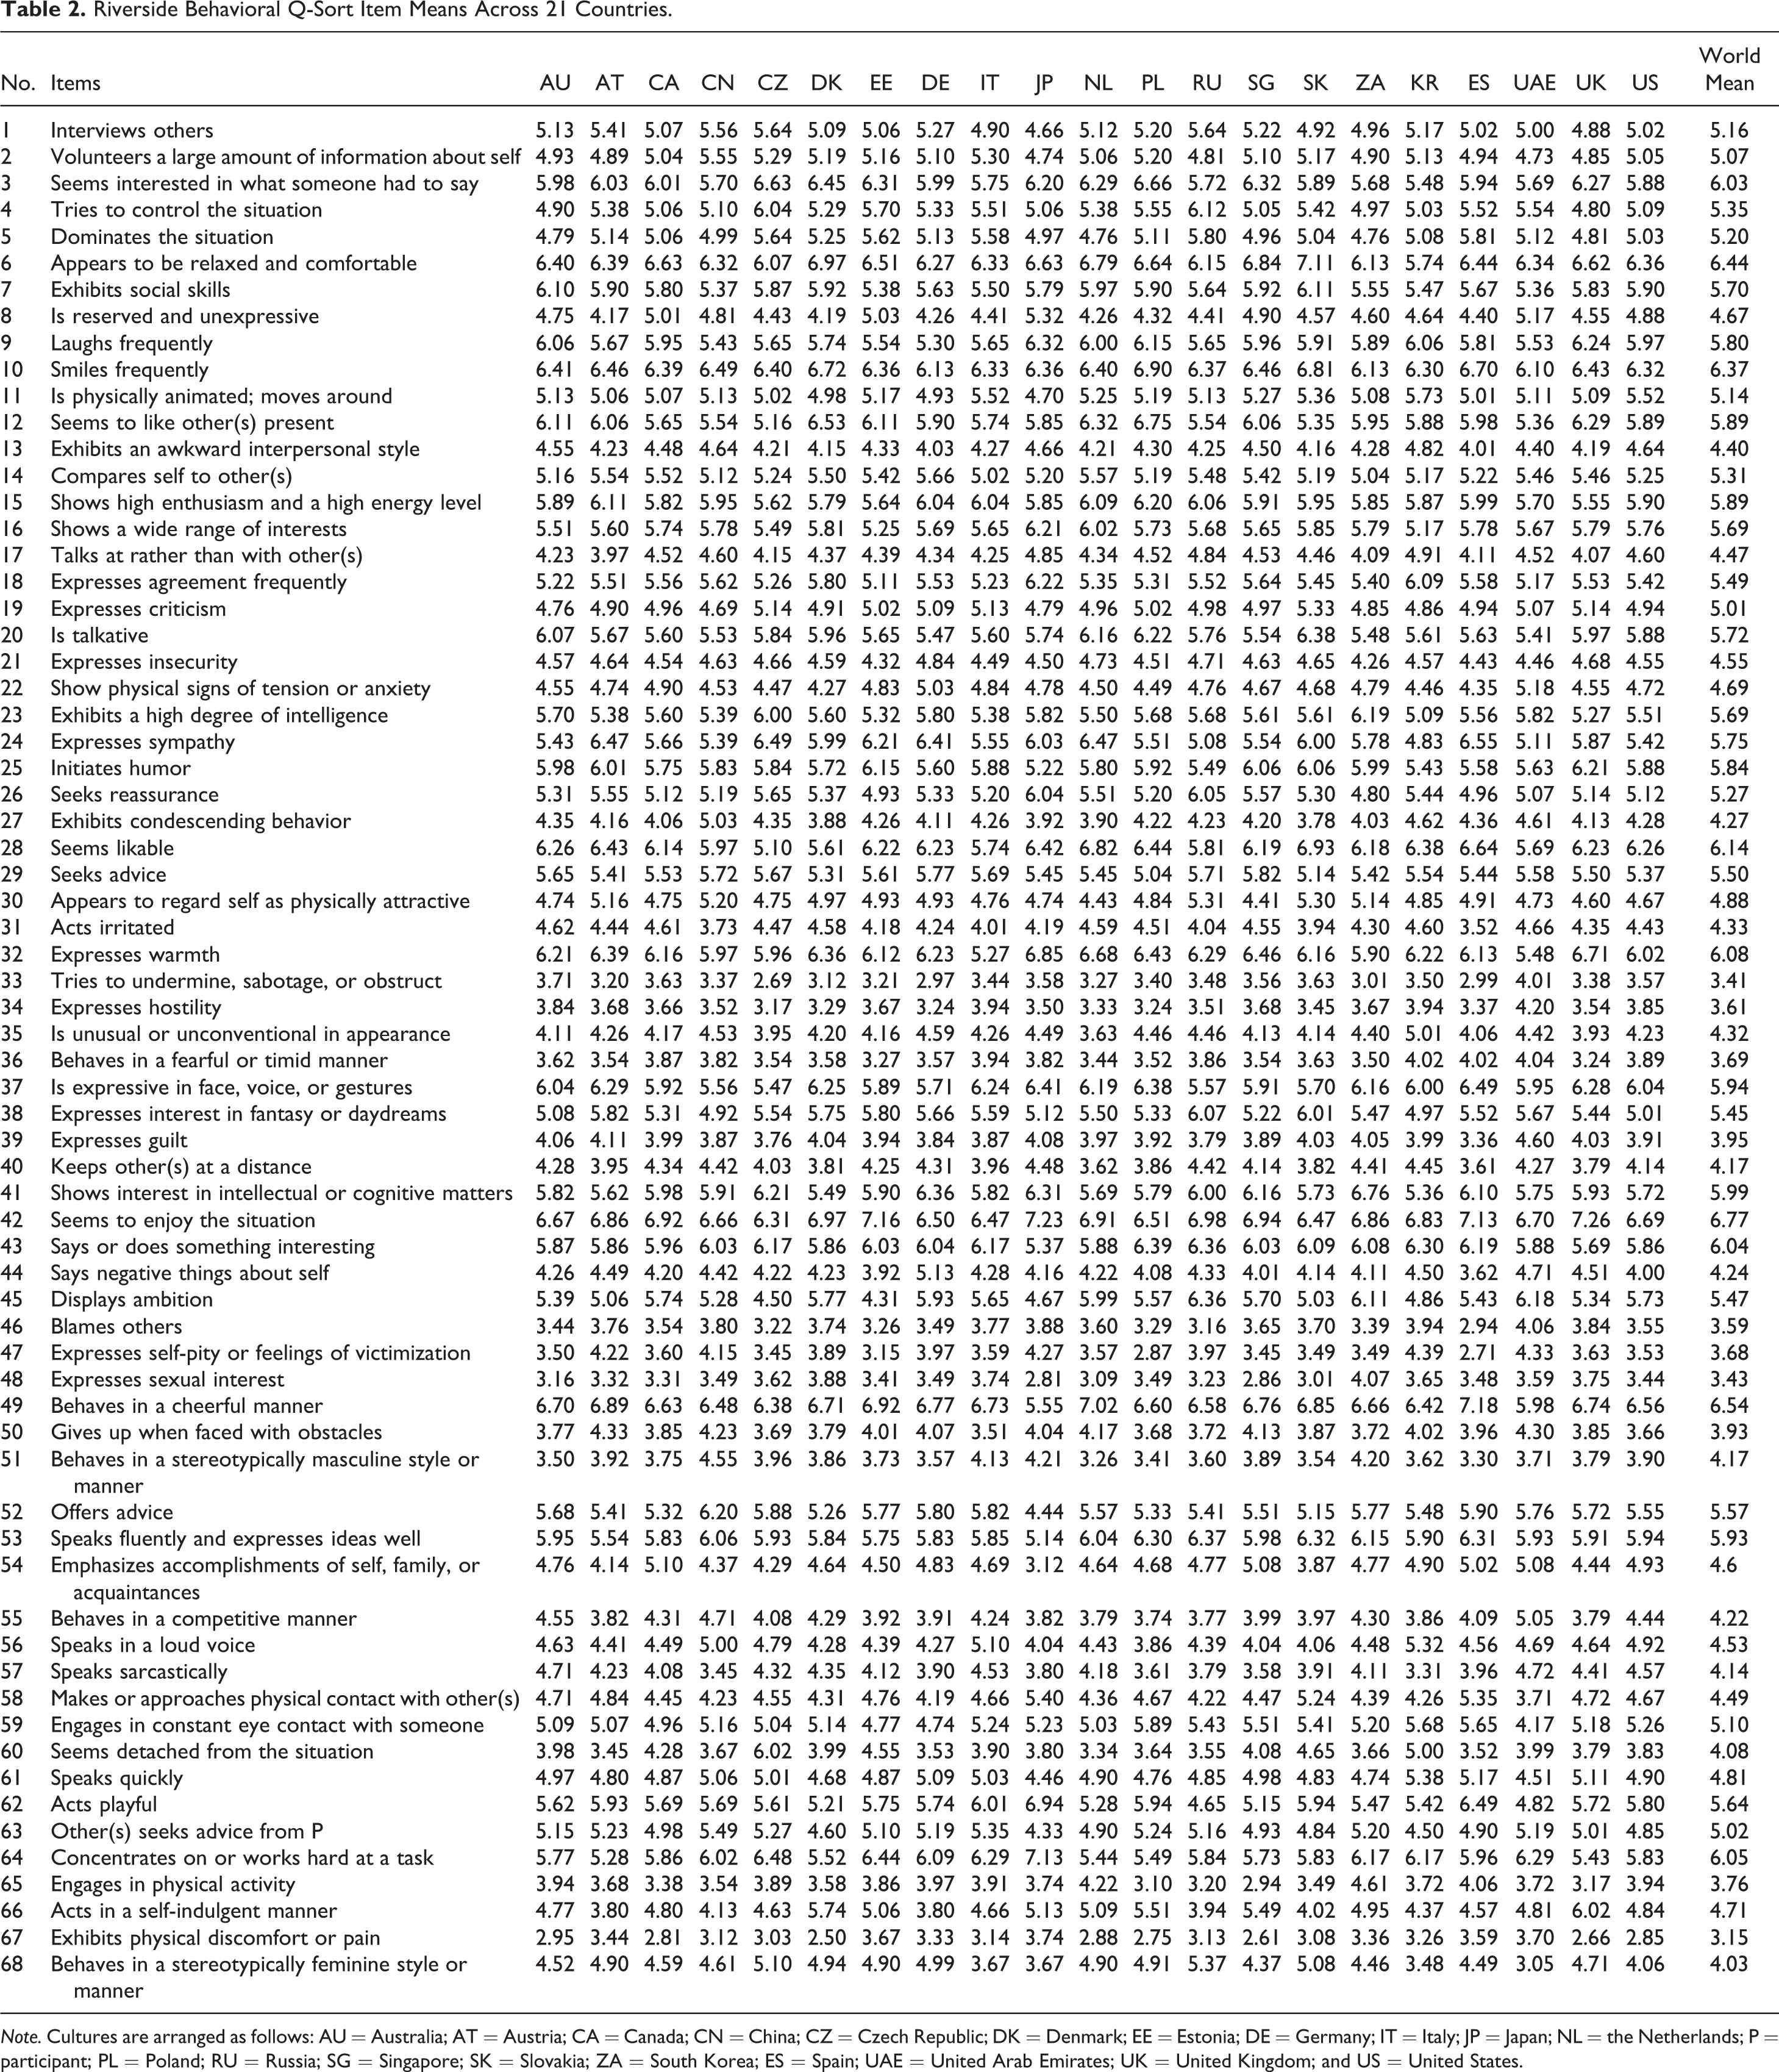
Note. Cultures are arranged as follows: AU = Australia; AT = Austria; CA = Canada; CN = China; CZ = Czech Republic; DK = Denmark; EE = Estonia; DE = Germany; IT = Italy; JP = Japan; NL = the Netherlands; P = participant; PL = Poland; RU = Russia; SG = Singapore; SK = Slovakia; ZA = South Korea; ES = Spain; UAE = United Arab Emirates; UK = United Kingdom; and US = United States.
Results
Between-Country Similarity and Within-Country Homogeneity of Daily Behavior
Cross-cultural similarity
First, we examined the extent to which average behavior Q-sort profiles were similar across 21 countries. Due to sample size discrepancies between the genders across countries, we separated male and female RBQ ratings, averaged the participants’ scores for each, and then averaged the resulting female RBQ profile with the male RBQ profile (see the Online Supplemental Materials at https://osf.io/72btx for separate intercorrelation tables for males and females). The resulting data set consisted of an equally gender-weighted behavioral profile for each country. We then correlated each of these country-level behavioral profiles with each other. This yielded a 21 × 21 matrix of correlation coefficients representing the similarity of each country’s average behavioral profile with those of each of the other countries (see Table 3). Results from these analyses show strikingly high similarities among all 21 countries, with an average r = .85 (SD = .05, range = .69–.97). The most similar average behavior profiles came from Canada and the United States, r(66) = .97, 95% CI [.95, .99], and the least similar came from Japan and the United Arab Emirates (UAE), r(66) = .69, 95% CI [.54, .80].
Intercorrelations of Averaged Riverside Behavioral Q-sort Profiles of Females and Males (Combined) Across 21 Cultures.
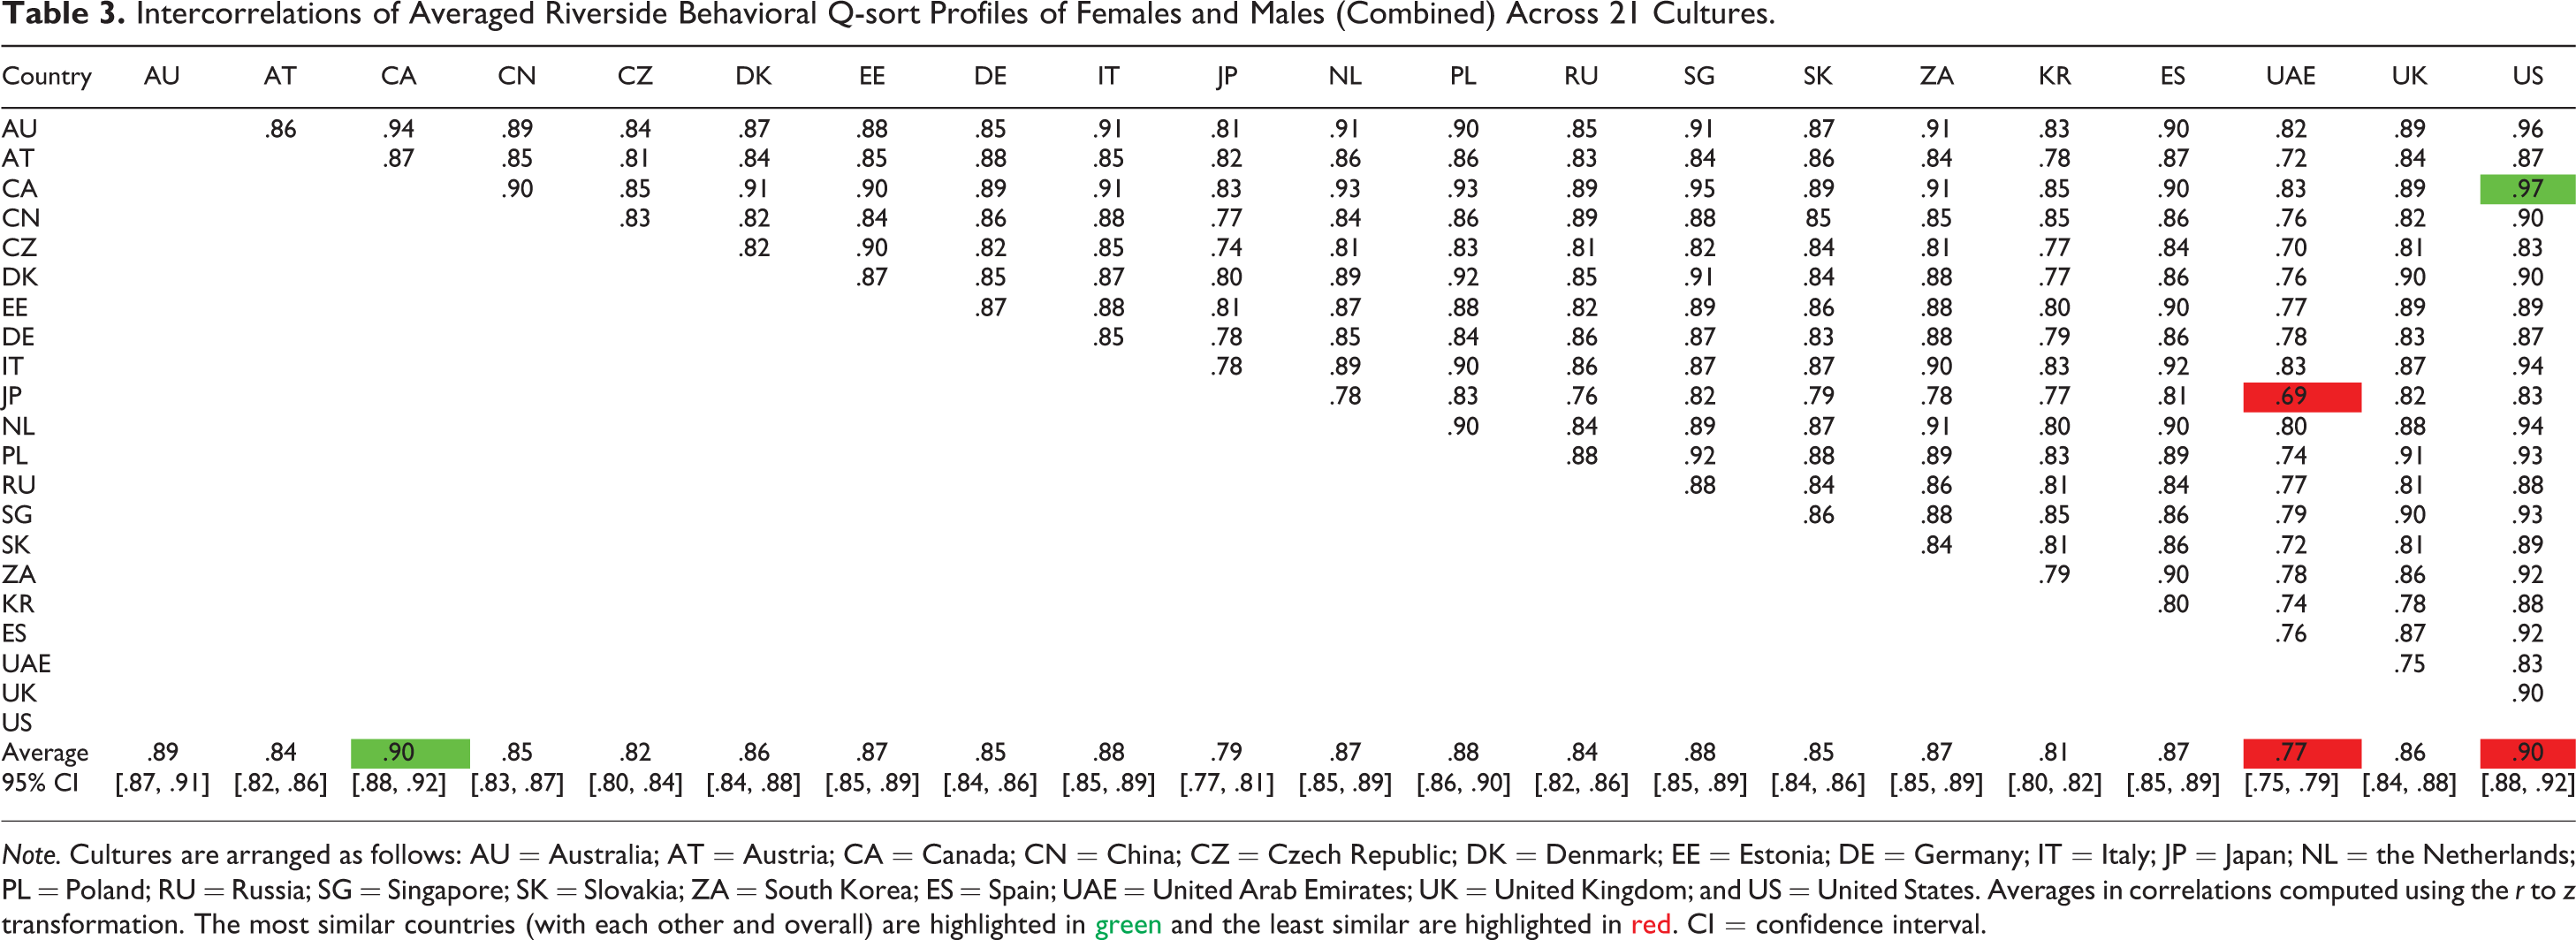
Note. Cultures are arranged as follows: AU = Australia; AT = Austria; CA = Canada; CN = China; CZ = Czech Republic; DK = Denmark; EE = Estonia; DE = Germany; IT = Italy; JP = Japan; NL = the Netherlands; PL = Poland; RU = Russia; SG = Singapore; SK = Slovakia; ZA = South Korea; ES = Spain; UAE = United Arab Emirates; UK = United Kingdom; and US = United States. Averages in correlations computed using the r to z transformation. The most similar countries (with each other and overall) are highlighted in green and the least similar are highlighted in red. CI = confidence interval.
As can be seen in Table 2, the highest placed RBQ items worldwide were “seems to enjoy the situation,” “behaves in a cheerful manner,” and “smiles frequently.” The lowest placed items were “exhibits physical discomfort or pain;” “tries to undermine, sabotage, or obstruct;” and “expresses sexual interest.” From these results, we can conclude that, on average, people around the world at 7:00 p.m. reported that they were behaving in a generally positive, relaxed, and cheerful way. These results correspond with those from a previous International Situations Project (ISP) investigation of situational experience in which the average situation experienced by individuals across 20 countries was enjoyable and relaxing in nature (Guillaume et al., 2016).
Within-country homogeneity
The analyses described so far compared RBQ placements on average across all sampled countries. To assess within-country variation as well as cross-country comparison of behavioral profiles at the individual level, we calculated a series of interindividual correlations, comparing every individual profile with all of the other profiles from within the same country as well as across all of the other 20 countries. As with the average country profile analysis, this was done for both males and females separately and then subsequently averaged together (see the Online Supplemental Material at https://osf.io/72btx for separate interindividual correlation tables for males and females). Table 4 shows the resulting correlation matrix with the diagonal displaying within-country individual variation (i.e., each country’s behavioral homogeneity) and the off-diagonal correlation coefficients (i.e., homogeneity across countries). Our findings suggest that the UAE was the least behaviorally homogeneous country, r(82) = .15, 95% CI [−.07, .35], and Spain was the most homogeneous, r(107) = .33, 95% CI [.29, .38].
Average Interindividual Riverside Behavioral Q-sort Correlations Within and Across 21 Cultures.
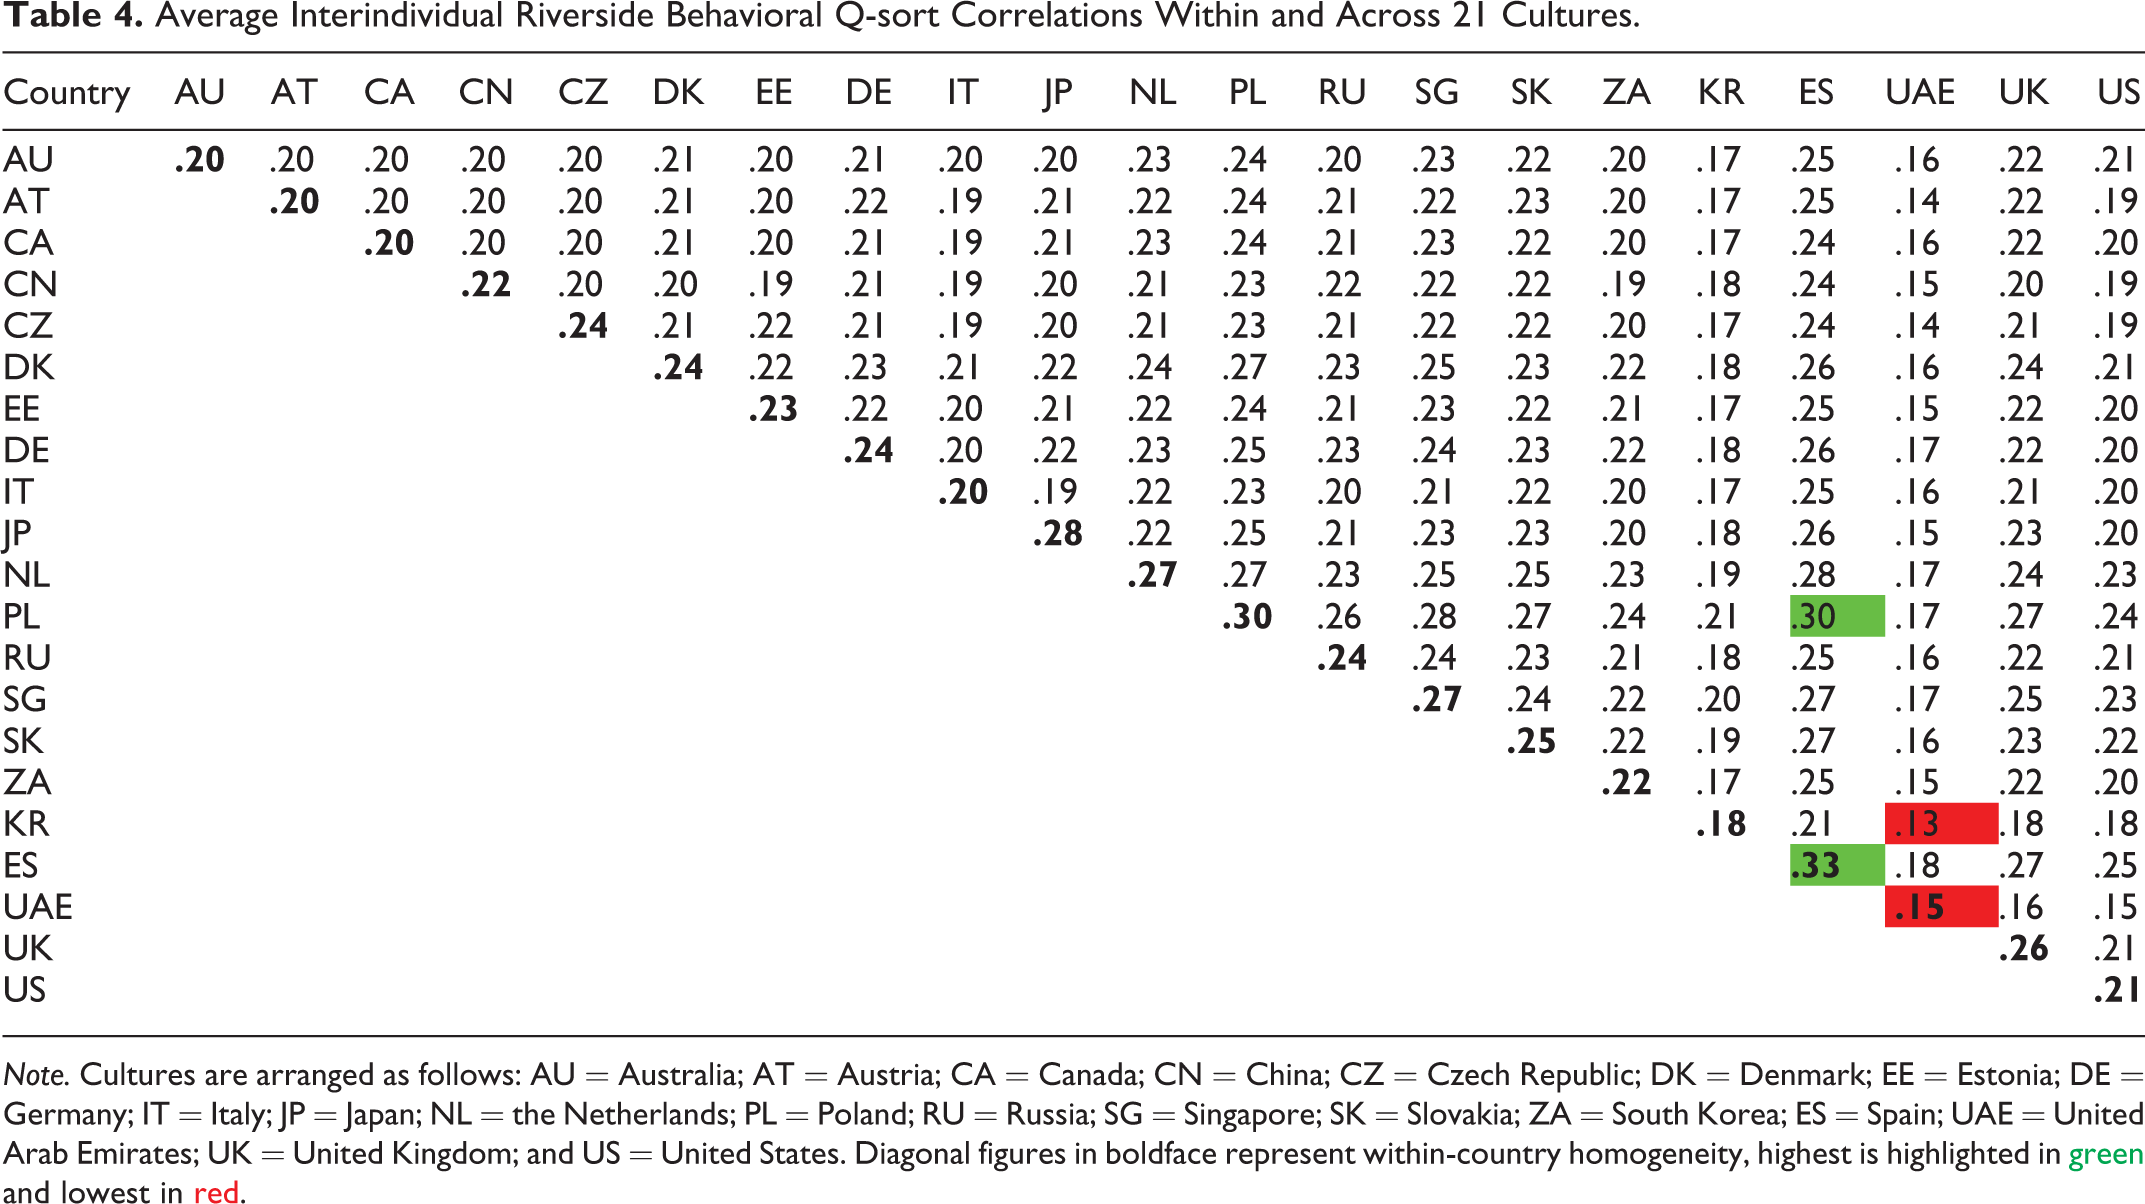
Note. Cultures are arranged as follows: AU = Australia; AT = Austria; CA = Canada; CN = China; CZ = Czech Republic; DK = Denmark; EE = Estonia; DE = Germany; IT = Italy; JP = Japan; NL = the Netherlands; PL = Poland; RU = Russia; SG = Singapore; SK = Slovakia; ZA = South Korea; ES = Spain; UAE = United Arab Emirates; UK = United Kingdom; and US = United States. Diagonal figures in boldface represent within-country homogeneity, highest is highlighted in green and lowest in red.
The average between-country individual similarity of behavior (off-diagonal values) was r(189) = .212, 95% CI [.208, .216], with the unit of analysis as the number of off-diagonal correlations; the average within-country behavioral homogeneity (diagonal values) was r(19) = .235, 95% CI [.216, .254], with the unit of analysis as the number of diagonal correlations. The difference between these two average correlations was significant (t = 2.45, p = .02, r = .16, 95% CI [.03, .28]), indicating that individuals behaved at 7:00 p.m. significantly more similar to people within their same countries than with individuals in other countries—though the absolute size of this difference is very—and perhaps surprisingly—small.
Country-Level Variables and Daily Behavior
In the final step of exploratory analyses, we examined relations between a number of common country-level, cultural attributes (e.g., average personality trait, economic output, population, and other individual difference variables 4 ) and RBQ behaviors. Previous research has accumulated evidence for country-level cultural value scores along six dimensions: Power distance, individualism, uncertainty avoidance, masculinity, long-term orientation, and indulgence (Hofstede, 2001). Also available are mean-level scores of each of the Big Five traits for 16 of our 21 countries (Schmitt et al., 2007) as well as, gross domestic product (United Nations Statistics Division, 2015) and population size (Central Intelligence Agency, 2014), for all 21 countries (see the Online Supplemental Material at https://osf.io/72btx for a complete list). Finally, we gathered country-level individual difference variables with meaningful behavioral implications: self-esteem (Bleidorn et al., 2015), satisfaction with life, work ethic, feelings of happiness, subjective state of health, meaning and purpose of life, importance of God, and tolerant attitudes (World Values Survey, 2016). 5 See the Online Supplemental Material at https://osf.io/72btx for country-level scores of these individual difference variables.
To examine the number of significant correlations between each of the RBQ’s 68 behaviors and the country-level variables, we employed Sherman and Funder’s (2009) randomization test (see also Sherman & Serfass, 2015), in which the chance distribution of significant correlates can be estimated across 10,000 trials. The accumulation of the resulting significant correlations across each of 10,000 trials provides a reliable way to determine whether the number of significant correlations in the obtained data is greater than could be attributed to chance. It also provides an estimation of the p level of the resulting list of correlates taken as a whole. This approach alleviates the issue of spurious correlations common when correlating a cultural attribute with a large number of nonindependent (intercorrelated) variables (in this case each of the 68 RBQ items).
Overall, of the country-level variables examined, the Big Five traits, extroversion, neuroticism, openness to experience, and conscientiousness as well as self-esteem, tolerant attitudes, and feelings of happiness were the only dimensions to generate more behavioral correlates than would be expected by chance. Country-level extroversion yielded 13 RBQ item correlates (p = .020), neuroticism yielded 11 (p = .016), openness to experience yielded 14 (p = .001), conscientiousness yielded 9 (p = .032), self-esteem yielded 15 (p = .001), tolerant attitudes yielded 8 (p = .07), and feelings of happiness yielded 9 (p = .04).
Briefly, among other correlates, behavior in countries high in extroversion and openness and low on neuroticism were more likely to include someone offering advice (r = .82, 95% CI [.55, .94]; r = .72, 95% CI [.35, .90]; and r = −.78, 95% CI [−.92, −.46], respectively). Also, behavior in countries low in extroversion and high in neuroticism were more likely to involve someone frequently expressing agreement (r = −.78, 95% CI [−.92, −.46] and r = .82, 95% CI [.55, .94], respectively; for all correlations, N = 16). Individuals in countries higher in self-esteem were more likely to report expressions of self-pity or feelings of victimization (r = .72, 95% CI [.35, .90]) and unusual or unconventional appearance (r = .71, 95% CI [.33, .89]). Finally, individuals in countries with generally tolerant attitudes tend to be likable (r = .66, 95% CI [.25, .87]), social (r = .56, 95% CI [.09, .83]), and express sympathy (r = .63, 95% CI [.20, .86]). Lastly, individuals in countries who have strong feelings of happiness tend to laugh (r = .53, 95% CI [.05, .81]) and behave in a social, self-indulgent, and irritated way (r = .67, 95% CI [.26, .88]; r = .60, 95% CI [.15, .84]; and r = .58, 95% CI [.12, .84], respectively). Tables 5 –11 provide a complete list of these correlates.
Behavioral Correlates of Extroversion Across 16 Countries.

Note. The chance of finding 13 significant correlations at the .05 level (3.37 expected by chance) is p = .020. Countries included in this analysis: Australia, Austria, Canada, China, Czech Republic, Denmark, Estonia, Germany, Italy, Japan, Netherlands, Poland, Russia, Singapore, Slovakia, South Africa, South Korea, Spain, United Kingdom, and United States. RBQ = Riverside Behavioral Q-sort; CI = confidence interval; P = participant.
*p < .01. **p < .001.
Behavioral Correlates of Neuroticism Across 16 Countries.
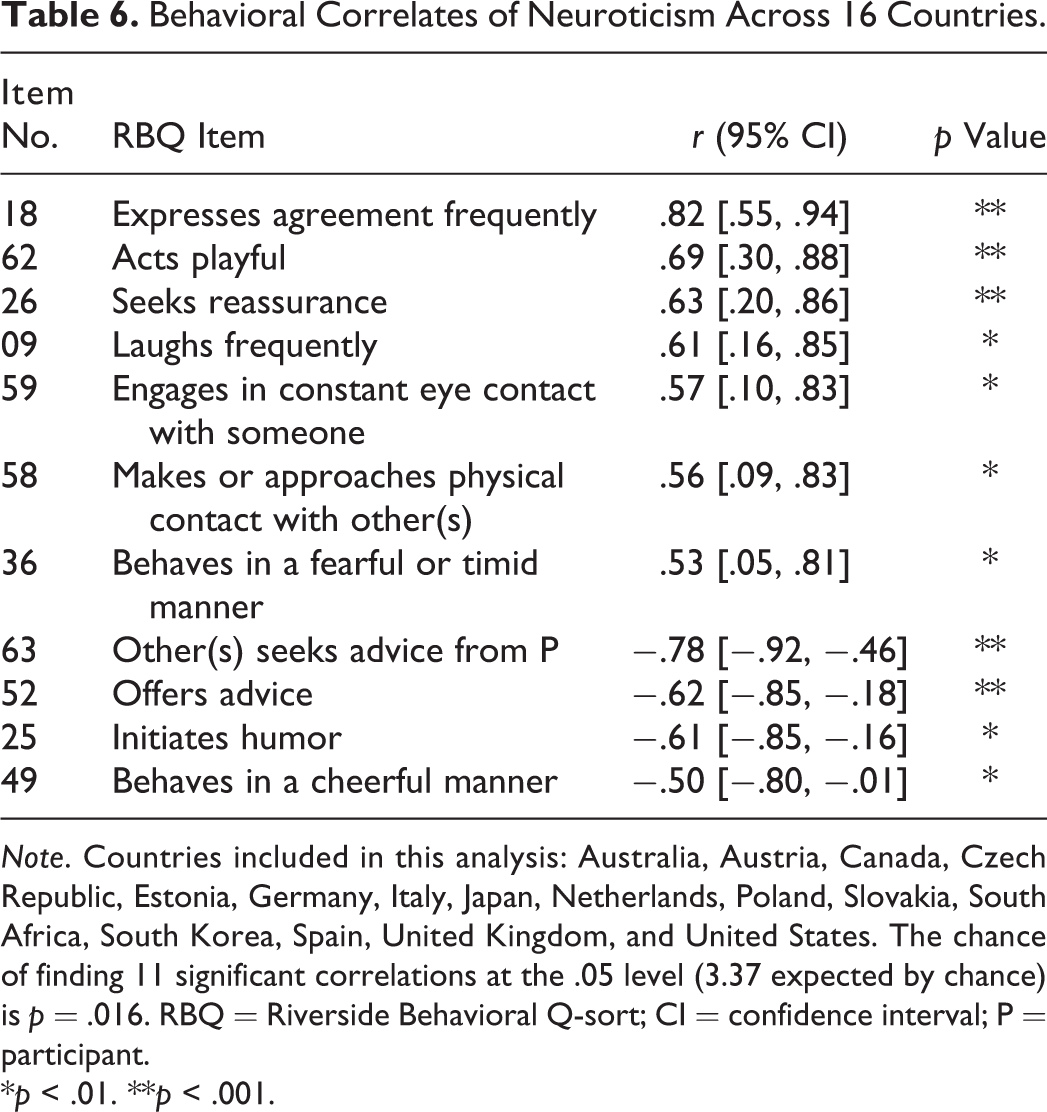
Note. Countries included in this analysis: Australia, Austria, Canada, Czech Republic, Estonia, Germany, Italy, Japan, Netherlands, Poland, Slovakia, South Africa, South Korea, Spain, United Kingdom, and United States. The chance of finding 11 significant correlations at the .05 level (3.37 expected by chance) is p = .016. RBQ = Riverside Behavioral Q-sort; CI = confidence interval; P = participant.
*p < .01. **p < .001.
Behavioral Correlates of Openness Across 16 Countries.

Note. Countries included in this analysis: Australia, Austria, Canada, Czech Republic, Estonia, Germany, Italy, Japan, Netherlands, Poland, Slovakia, South Africa, South Korea, Spain, United Kingdom, and United States. The chance of finding 14 significant correlations at the .05 level (3.37 expected by chance) is p = .001. RBQ = Riverside Behavioral Q-sort; CI = confidence interval; P = participant.
*p < .01. **p < .001.
Behavioral Correlates of Conscientiousness Across 16 Countries.
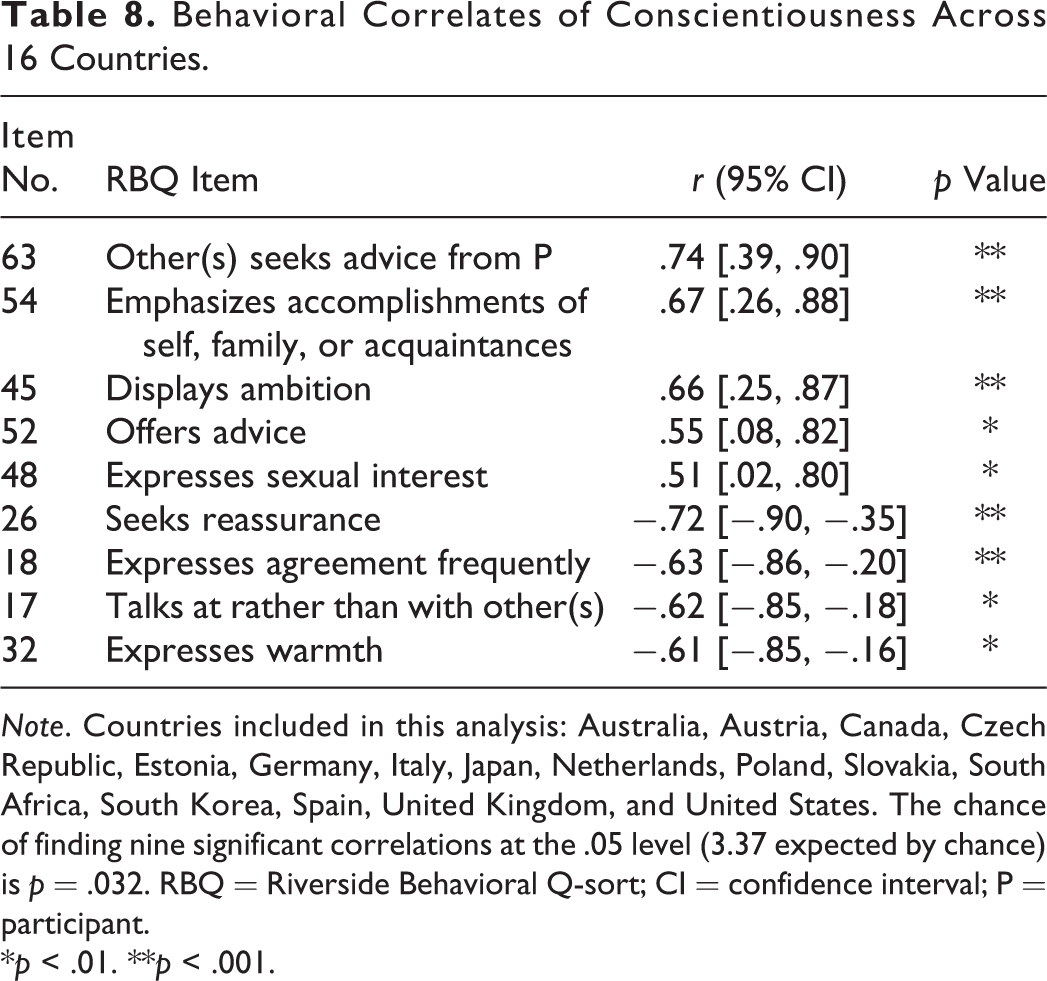
Note. Countries included in this analysis: Australia, Austria, Canada, Czech Republic, Estonia, Germany, Italy, Japan, Netherlands, Poland, Slovakia, South Africa, South Korea, Spain, United Kingdom, and United States. The chance of finding nine significant correlations at the .05 level (3.37 expected by chance) is p = .032. RBQ = Riverside Behavioral Q-sort; CI = confidence interval; P = participant.
*p < .01. **p < .001.
Behavioral Correlates of Self-Esteem Across 16 Countries.

Note. Countries included in this analysis: Australia, Austria, Canada, China, Denmark, Germany, Italy, Japan, Netherlands, Singapore, South Africa, South Korea, Spain, United Arab Emirates, United Kingdom, and United States. The chance of finding 15 significant correlations at the .05 level (3.37 expected by chance) is p = .001. RBQ = Riverside Behavioral Q-sort; CI = confidence interval; P = participant.
*p < .01. **p < .001.
Behavioral Correlates of Tolerant Attitudes Across 16 Countries.
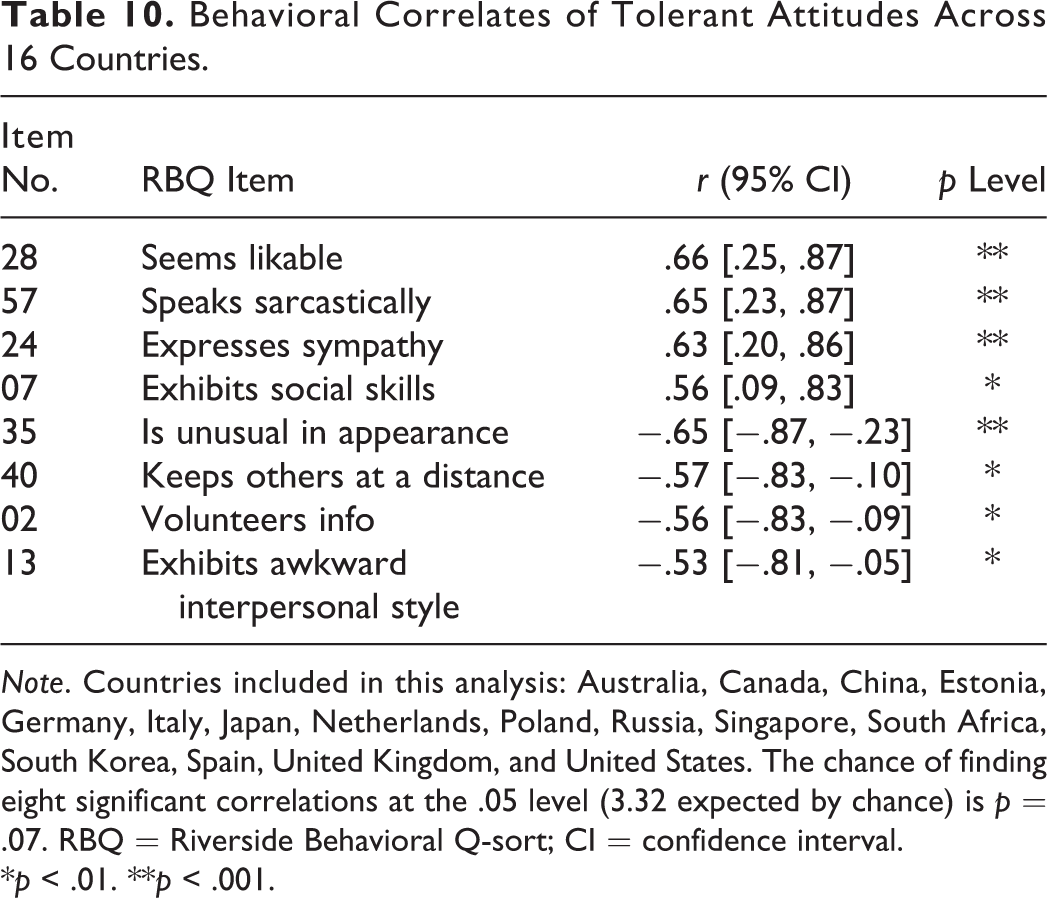
Note. Countries included in this analysis: Australia, Canada, China, Estonia, Germany, Italy, Japan, Netherlands, Poland, Russia, Singapore, South Africa, South Korea, Spain, United Kingdom, and United States. The chance of finding eight significant correlations at the .05 level (3.32 expected by chance) is p = .07. RBQ = Riverside Behavioral Q-sort; CI = confidence interval.
*p < .01. **p < .001.
Behavioral Correlates of Happiness Across 16 Countries.

Note. Countries included in this analysis: Australia, Canada, China, Estonia, Germany, Italy, Japan, Netherlands, Poland, Russia, Singapore, South Africa, South Korea, Spain, United Kingdom, and United States. The chance of finding nine significant correlations at the .05 level (3.40 expected by chance) is p = .042. RBQ = Riverside Behavioral Q-sort; CI = confidence interval.
*p < .01. **p < .001.
It should be noted that the relationship between self-esteem and RBQ behaviors shown in Table 9 are likely driven by the countries that have the highest and lowest levels of self-esteem according to Bleidorn et al.’s (2015) estimates (UAE and Spain, respectively). Figure 1 demonstrates this point by displaying a scatter plot of the relationships between country-level self-esteem scores and country-level ratings of the RBQ item “expresses self-pity or feelings of victimization.” More detailed explanations for the above relations are found in the Discussion section.
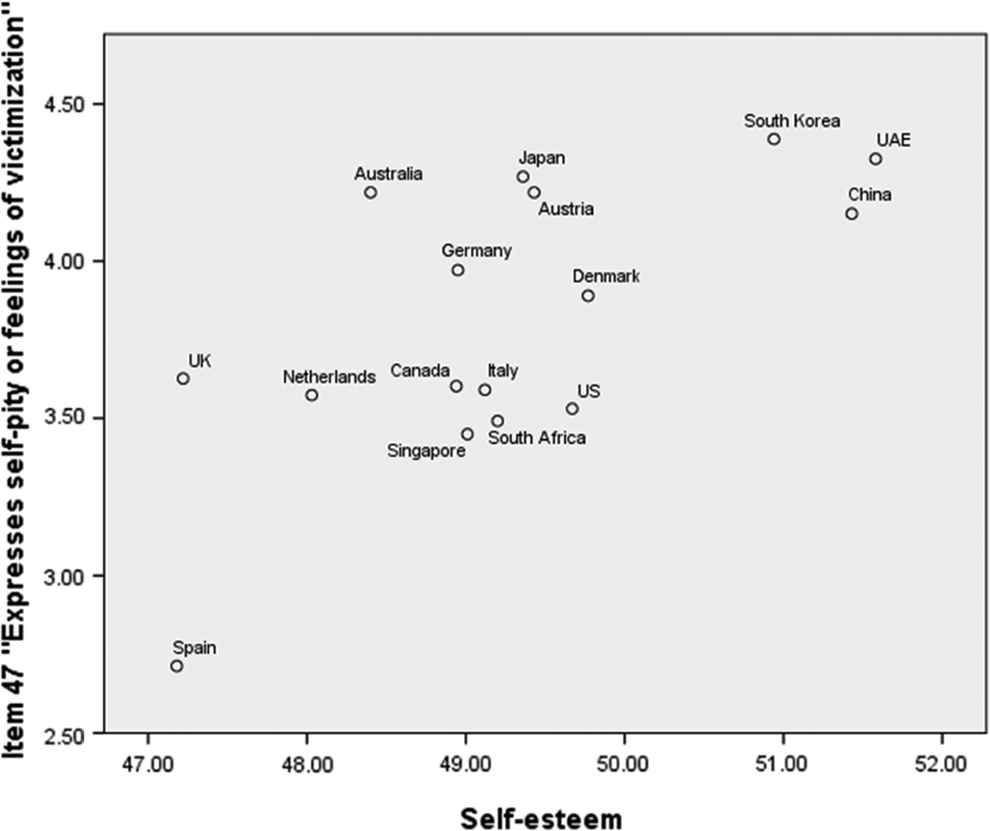
Country-level ratings of Riverside Behavioral Q-sort item 47 (“expresses self-pity or feelings of victimization”) and self-esteem.
Discussion
Our results lead to three notable conclusions. First, the cross-country comparison of behavioral profiles revealed that, at 7:00 p.m., individuals across all 21 countries behaved fairly—and perhaps surprisingly—similarly to one another and that the behaviors most widely enacted could be characterized as generally positive and relaxed. Furthermore, the United States and Canada had the most similar average behavioral profiles while the UAE and Japan were the least similar. While the geographical proximity and cultural similarity of the United States and Canada make the basis for their similarity almost self-evident, the reasons behind the significant dissimilarity between the UAE and Japan are less obvious and while it would be tempting to present explanations post hoc, this finding, along with many others reported here, is the outcome of frankly exploratory research. Future investigations can now build on these findings to develop focused hypotheses and further assess theoretically relevant characteristics of cultures to help explain the observed similarities and dissimilarities in daily behavior seen here.
Second, individuals’ behavioral profiles varied across countries (slightly) more than individuals within a single culture. These results may be surprising in that they imply that behavioral variation across countries is not much larger than behavioral variation within countries. However, Guillaume et al. (2016) reported, similarly, that situational experiences were only slightly more similar across individuals within countries compared to those of individuals across 20 countries (see also Allik et al., 2009; Hanel, Maio, & Manstead, 2016; Tsai & Chentsova-Dutton, 2003).
Third, the exploratory analyses of behavioral correlates of cultural value dimensions, average personality traits, economic output, population, and various individual difference ratings provided an opportunity to investigate behavior from cross-cultural and anthropological perspectives. For example, people in countries ranking higher, on average, on the Big Five trait extroversion were more likely to display behaviors such as seeking advice (Item 63), expressing interest in fantasy or daydreams (Item 38), and speaking sarcastically (Item 57). The relationship between extroversion and seeking advice may reflect a general, universal relationship between extroversion and trust (Evans & Revelle, 2008). The strong correlation between extroversion and speaking sarcastically may be driven by Austria, the highest ranked country on extroversion. Indeed, contemporary Austrian literature is characterized by its dry, sarcastic tone (Meyer-Sickendiek, 2014).
Japan is ranked among the lowest in extroversion and highest in neuroticism. A look at the most positive and negative correlates for these traits provides especially interesting insights into Japanese culture and daily life. In particular, the item “expresses agreement frequently” had the strongest negative correlation with extroversion and the strongest positive correlation with neuroticism. Indeed, Japan is commonly characterized by its inhabitants’ frequent expression of agreement. This could possibly be driven by the common occurrence of amae interactions—the practice of unconditional acceptance even for potentially socially unacceptable behavior (Niiya, Ellsworth, & Yamaguchi, 2006).
An examination of the relationship between countries high on conscientiousness and country-level RBQ behavioral profiles provides an opportunity to understand more about life in a highly conscientious country. The United States ranks among the highest on conscientiousness worldwide. Accordingly, U.S. students at 7:00 p.m. reported offering advice, displaying ambition, and emphasizing the accomplishments of themselves, their family, or their acquaintances more so than students from other countries. Likewise, as any highly conscientious U.S. American can attest, in a competitive social and professional environment, conscientiousness may be driven by the need to succeed. Indeed, there is a strong relationship between conscientiousness and academic and professional success (Wagerman & Funder, 2007). We therefore see a trend in the United States in which individuals have and display ambition, feel as if they have advice to offer (i.e., lessons learned from their success), and have the motivation and credentials to emphasize their own accomplishments.
A look at particular individual differences (on a country level) enables us to parse apart country-level differences in daily behavior. For example, the Netherlands is the most tolerant country in our sample, and our Dutch participants reported behaviors including being likable and social, having a sarcastic sense of humor, and, not surprisingly, expressing sympathy. Conversely, China ranks among the lowest in holding tolerant attitudes, and our Chinese participants reported behaviors including the tendency to keep others at a distance and exhibiting an awkward interpersonal style.
Also, while some reported behaviors from individuals in countries that have generally strong feelings of happiness on average (i.e., the United Kingdom and Canada) are paradoxical (e.g., acting irritated, undermining, and obstructing), most are common expressions of happiness. For instance, individuals in these happy countries generally reported being social, laughing frequently, and acting in a self-indulgent and comfortable manner.
Finally, individuals in countries with higher self-esteem were relatively likely to report behaviors such as feeling victimized, appearing unconventional, and expressing blame; they were also less likely to report expressing sympathy, behaving cheerfully, or exhibiting social skills. We do not have a ready explanation for this pattern of findings, but it appears to be empirically rather strong. These patterns could be driven to a large extent by the fact that two countries, Spain and the UAE, were at the extremes of self-esteem (with Spain being lowest and UAE the highest), while also being near the extremes of some of the behaviors listed above (see, e.g., Figure 1).
Limitations
Although the current project was ambitious and the first effort of its kind, it is not without limitations. First, while we did make efforts to translate and back-translate the RBQ, it is a measure that originated in the United States and therefore could still be considered an “imposed etic” (Berry, 1980). Future developments of behavioral assessments within each country would be desirable to more widely capture between-country variation in daily behavior.
Second, our sample is comprised primarily of members of college communities. It seems reasonable to expect that with a more representative sample of people occupying various roles in society, daily behavior will be similarly more diverse. However, this speculation awaits an empirical test. Relatedly, while we were able to collect data from 21 countries across five continents, individuals from South America, Central America, South Asia, and the Middle East are not represented in the current study. Moreover, regional, cultural, and ethnic variation in behavioral expression within countries was not assessed. Future research from our lab will seek not only to gather data from many more countries across underrepresented areas of the world but also to include assessments from different regions within a single country.
Third, as is common in psychological research, there was a disproportionate number of female participants in many of our samples. Although we did attempt to statistically adjust for this discrepancy in representation by each gender, future research should seek to recruit a percentage of male participants that is more representative of each country’ population.
For the current study, we unfortunately did not collect individual-level personality trait scores. We therefore related previously acquired, country-level personality trait scores with country-level behavior profiles. This approach limits our power and constrains our interpretations to be about countries and not individuals. A necessary next step will be to measure personality trait levels and behavior for each individual, thus enabling us to compare relations between theoretically derived personality-behavior pairs in more powerful multilevel models.
Finally, while the findings we report do illuminate the ways in which countries around the world are similar and different in how they live their lives, it is important to note that such a large and rich data set can be analyzed in many ways (for an example of a potential alternative approach, see Webster and Duffy, 2016, for a recent discussion on spatial analysis). We thus encourage interested readers to explore our open data set at https://osf.io/ytn9u/.
Implications and Conclusion
The current project provides the beginnings of a foundation for future theoretical construction and methodological sophistication (Haig, 2005) in the sense that it is “…important to explore something real, important, and general across cultures…” (Rozin, 2009, p. 439).
Real life is lived moment to moment, so when one is interested in how people around the world are similar and different in the way they live their lives, a natural starting place is assessing a wide array of behaviors at a single point in their day. With the use of 68 nuanced behaviors, our method aimed to provide relatively objective assessments while also constructing holistic descriptions of behavioral patterns toward the ultimate goal of gaining a fuller psychological understanding of daily life and behavior across the globe.
Footnotes
Acknowledgments
The authors thank Kyle Sauerberger, Patrick Morse, Brian Sanchez, and Elysia Todd for their valuable input and thoughtful discussions.
Declaration of Conflicting Interests
The author(s) declared no potential conflicts of interest with respect to the research, authorship, and/or publication of this article.
Funding
The author(s) disclosed receipt of the following financial support for the research, authorship, and/or publication of this article: Martina Hřebíčková and Sylvie Graf were supported by grants from the Czech Science Foundation (13-25656S) and the Institute of Psychology, Academy of Sciences of the Czech Republic (RVO:68081740). Anu Realo was funded by the Estonian Ministry of Education and Science (IUT2-13). The overall organization of the data collection, at UC Riverside, was supported in part by National Science Foundation Grant BCS-1052638, David C. Funder, Principal Investigator. Any opinions, findings, and conclusions or recommendations expressed in this material are those of the individual researchers and do not necessarily reflect the views of the National Science Foundation or any other entity.
