
Abstract
Recent research has begun to investigate the relationship between religion and science. However, it remains unclear whether religious and nonreligious people differ on the standards of evidence used when evaluating claims in religious versus scientific contexts. Across three studies (N = 702), we presented participants with effects that were attributed to scientific methodology or to God and asked them to rate how many more times an effect needs to be repeated in order to have certainty in the outcome. Results showed that religious people requested fewer repetitions compared to nonreligious people when an effect was attributed to prayer, and fewer repetitions when an effect was attributed to prayer compared to scientific methodology. Nonreligious people were relatively consistent across conditions. These results suggest that religious people have less stringent standards of evidence when evaluating nonscientific claims. Directions for future research are also discussed.
Research has shown that, compared to the nonreligious, religious people are less scientifically literate (Sherkat, 2011) and less likely to believe in scientific findings such as climate change (Morrison, Duncan, & Parton, 2015). There is also evidence that religious people reason differently about information compared to nonreligious people. Most notable are findings that religious people are more likely to think intuitively compared to nonreligious people (Gervais & Norenzayan, 2012; Pennycook, Ross, Koehler, & Fugelsang, 2016; Shenhav, Rand, & Greene, 2012); indeed, this difference may mediate the negative relation between religiosity and intelligence (Zuckerman, Silberman, & Hall, 2013). Consistent with the relationship between religiosity and intuitive thinking, religious people have been found to be more susceptible to “belief bias,” which is the tendency to reason on the basis of believability, as opposed to the logical validity, of a proposition (Pennycook, Cheyne, Koehler, & Fugelsang, 2013).
Additionally, researchers have noted that nonreligious people appear to be more rational and skeptical than religious people (Caldwell-Harris, Wilson, LoTempio, & Beit-Hallahmi, 2011; Hunsberger & Altemeyer, 2006; Penneycook, Cheyne, Seli, Koehler, & Fugelsang, 2012; Zuckerman et al., 2013), which may be one factor contributing to their religious disbelief. Other research has demonstrated that religiosity is negatively correlated with need for cognition and positively correlated with the tendency to find profound meaning in randomly generated, meaningless statements (Pennycook, Cheyne, Barr, Koehler, & Fugelsang, 2015). Further, some research has demonstrated that religious and scientific explanations for the world compete cognitively and may be inversely related (Preston & Epley, 2009; Preston, Ritter, & Hepler, 2013).
All of these findings suggest that religious people may be less likely to critically evaluate information based on logical merits and more likely to accept intuitively compelling information and arguments. However, this tendency might depend on whether the information is related to religious or nonreligious matters. Unlike scientific claims, which are empirically testable, most religious tenets cannot be tested and are thus unfalsifiable (Friesen, Campbell, & Kay, 2015). However, there has been no research investigating the relationship between religiosity and reasoning in different domains. Perhaps religious and nonreligious people differ primarily in how they treat religious as opposed to scientific claims. This notion was tested in the present studies.
Specifically, we predicted that religious people will evaluate a claim against lower standards of evidence when it is presented in a religious, compared to a scientific, context. Across three studies, we presented participants with effects that were attributed to scientific methodology or to God and asked them to rate how many more times an effect needs to be repeated in order to have certainty in the outcome.
Study 1
In Study 1, we presented religious and nonreligious participants with a scenario describing attempts to cure an illness with prayer to God, medication, or positive wishes. Our primary interest was in the comparison between the religious (prayer) and scientific (medication) contexts. The “positive wishes” scenario was included as a secular comparison condition, intended to resemble a nonscientific but still nonreligious approach. We asked participants to estimate the number of times the effect has to repeat itself for them to be confident that the effect (prayer, positive wishes, or medication) works.
We calculated the required sample size by estimating 80% power for a small (η2 p = .05) effect size using G*Power (Faul, Erdfelder, Buchner, & Lang, 2009), resulting in a sample size of 187. Because this study was exploratory, we aimed to exceed this sample size and recruit 300 participants, so as to obtain 50 participants per cell in a 2 (religious: yes vs. no) × 3 (condition: medication vs. positive wishes vs. prayer) design.
Method
Participants
We recruited 303 participants (174 females) from Amazon’s Mechanical Turk in exchange for monetary compensation. Participants ranged in age from 18 to 69 (M = 33.81, SD = 11.79) and were 77% White, 10% Black, 6% Asian, 6% mixed/other, and 1% Native American. Fourteen percent of participants reported having earned a high school diploma, 34% reported some college, 32% a bachelor’s degree, and the remaining 20% indicated postgraduate education or an advanced degree. Participants identified themselves as Christian (52%), atheists (15%), agnostics (15%), other (6%), spiritual (5%), or (7%) affiliated with Judaism, Islam, Hinduism, or Buddhism.
Materials and Procedure
Participants were randomly assigned to one of three conditions, where they read a scenario (see Online Supplemental Appendix) about a group of people trying to cure an illness. In the medication condition (n = 98), participants read about a group of researchers trying to see if a medication would cure the illness. In the prayer condition (n = 101), participants read about a group of people trying to see if praying to God would cure the illness. In the positive wishes condition (n = 105), participants read about a group of people sending out positive wishes to cure the illness. All participants were then asked “How many more people would need to be cured before they can be sure it was (the medication/prayer/positive wishes) that cured the illness?” In the present studies, we refer to this dependent variable as “repetitions” required. Participants responded by choosing from the following options: 1 (1 more), 2 (5 more), 3 (10 more), 4 (20 more), 5 (30 more), 6 (40 more), 7 (50 more), 8 (60 more), 9 (70 more), 10 (80 more), 11 (90 more), and 12 (100+). After responding to the scenario, participants were asked if they considered themselves to be religious (yes or no) and to identify their religious affiliation. Participants also completed a 6-item religiosity scale (e.g., I believe in God, My faith or religion is an important part of my identity; Cohen, Shariff, & Hill, 2008) on a scale ranging from 1 (strongly disagree) to 7 (strongly agree). The scale was highly consistent (α = .97). Finally, participants provided demographics information.
Results and Discussion
In all three studies reported in this article, data were analyzed with analysis of variance (ANOVA; using the binary question asking participants to identify as religious or not) and again with regression analysis (using the continuous religiosity scale). Because the results were nearly identical in terms of significance levels and effect sizes, we report here only the results of the ANOVA using the binary question.
To test our main hypothesis, we conducted a 2 (religious: yes vs. no) × 3 (condition: medication vs. prayer vs. positive wishes) ANOVA. Although variance was heterogeneous by Levene’s, we obtained the same results using a nonparametric Kruskall–Wallis test and, therefore, will report here the ANOVA’s results. However, we report the nonparametric and regression analyses in the Online Supplemental materials. Means, SDs, and Ns in each condition are displayed in Table 1.
Descriptive Statistics by Condition and Religiosity for Studies 1–3.
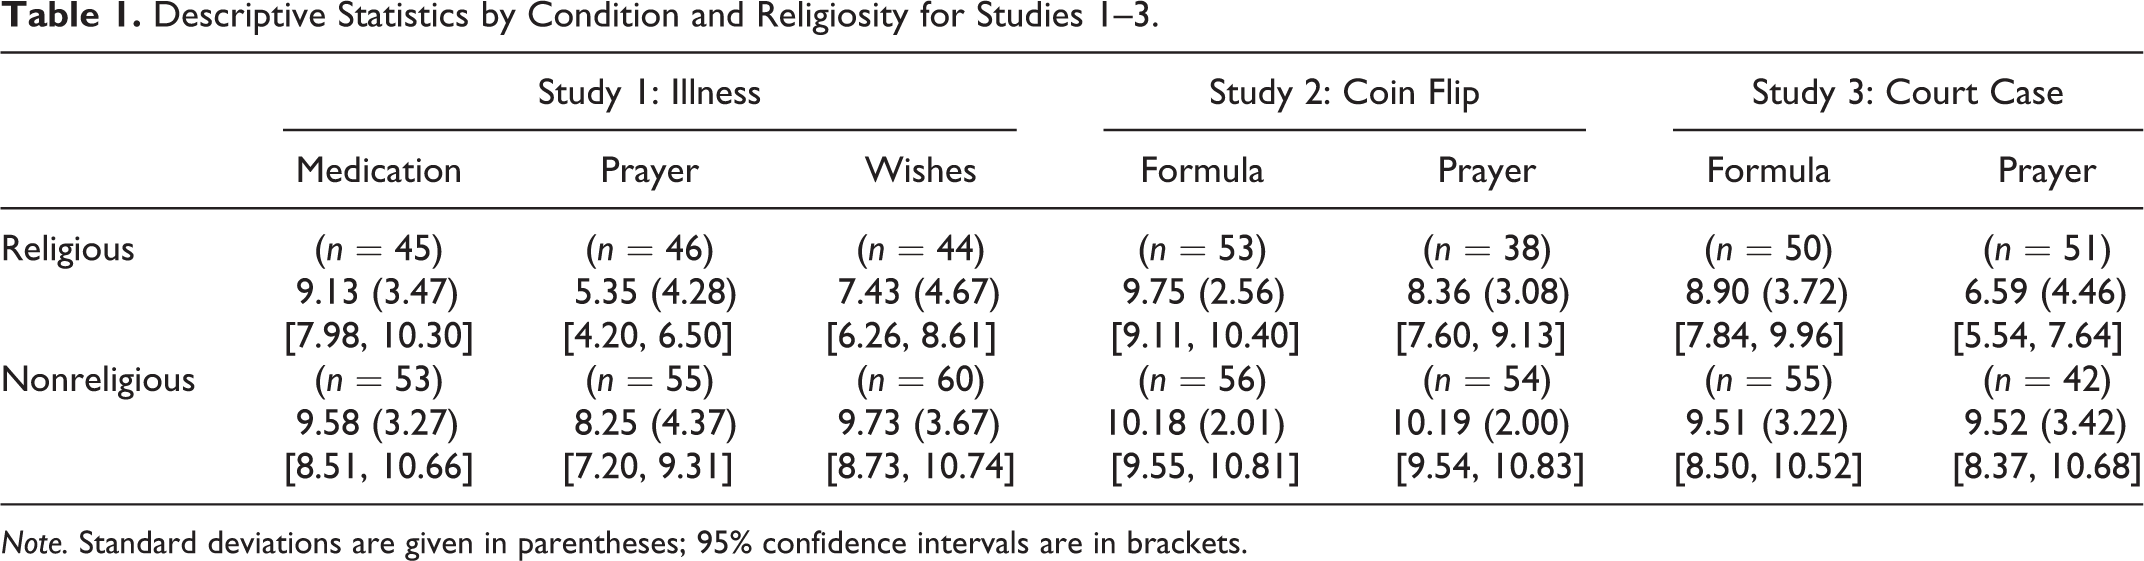
Note. Standard deviations are given in parentheses; 95% confidence intervals are in brackets.
There were significant main effects of religiosity, F(1, 297) = 16.94, p < .001, η2 p = .05, and condition, F(2, 297) = 10.86, p < .001, η2 p = .07. However, these effects were qualified by a marginal interaction between religiosity and condition, F(2, 297) = 2.56, p = .079, η2 p = .02. As shown in Figure 1, while religious and nonreligious people did not differ in the medication condition, F(1, 297) = .32, p = .57, η2 p = .001, nonreligious people required more repetitions in both the prayer, F(1, 297) = 13.47, p < .001, η2 p = .04, and positive wishes conditions, F(1, 297) = 8.56, p = .004, and η2 p = .03. Pairwise comparisons for nonreligious people showed that the number of repetitions was similar across the medication and positive wishes conditions, p = .843, marginally higher in the medication compared to the prayer condition, p = .082, and higher in the positive wishes compared to the prayer condition, p = .047. Religious people required more repetitions in the medication condition compared to the positive wishes, p = .044, and prayer conditions, p < .001, and more repetitions in the positive wishes compared to the prayer condition, p = .013.
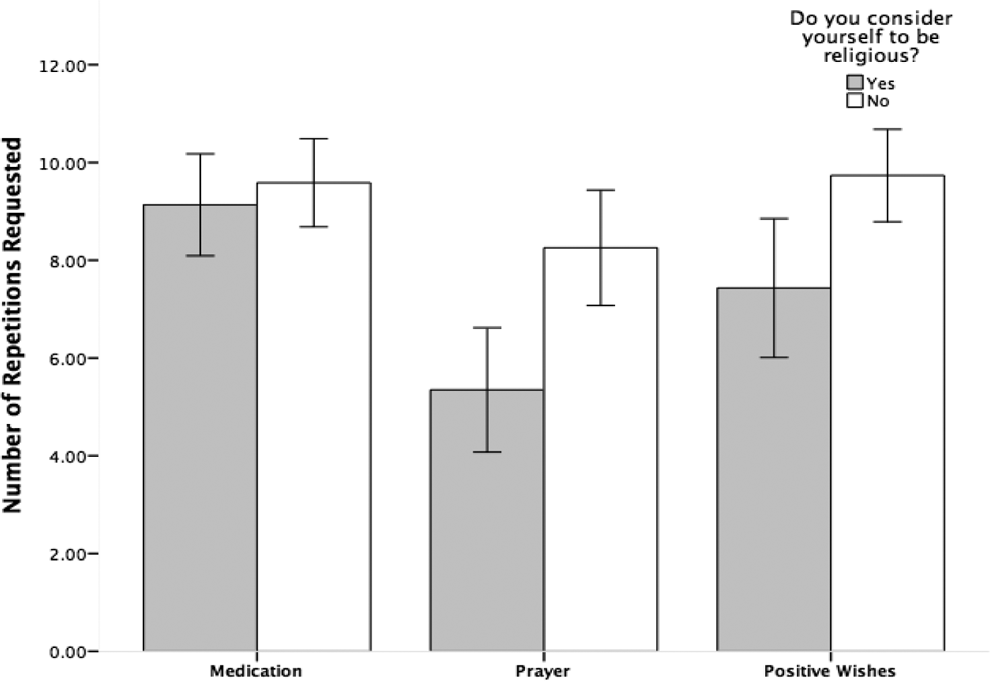
The interaction between religiosity and condition for Study 1. Responses were made on a scale ranging from 1 (one more) to 12 (100+).
In summary, religious and nonreligious people differed on the number of repetitions requested in both the prayer and positive wishes conditions but not in the medication condition. Although nonreligious people also differed somewhat across conditions, these differences did not emerge in the regression and nonparametric analyses reported in the supplementary materials. Whether nonreligious people respond differently to scientific versus religious claims will be retested in the next two studies.
Because religious and nonreligious people differed in the prayer and positive wishes condition but not in the medication condition, we can tentatively conclude that religious participants were biased (requesting less repetitions) toward nonscientific claims, believing in the power of religious prayer and good wishes (albeit, more strongly in the power of prayer than in the power of good wishes). It is possible, however, that the lack of difference between religious and nonreligious people in the medication condition was due to the familiarity that most people have with medications, such as the large number of people who usually participate in clinical trials. Therefore, we thought to replicate the results in Study 2, using a nonmedical setting.
Study 2
In Study 2, we replaced the medical outcome (curing an illness) with predicting coin flips from mathematical formulas. Thus, both the nature of the event (overcoming illness vs. predicting coin flips) and the scientific means of achieving successful outcome (medication vs. mathematical formulas) were drastically changed. Prayer was retained as the religious means of getting successful results. At issue, again, was the number of repetitions required by religious and nonreligious people to achieve certainty in a successful outcome for each scenario.
We again calculated the required sample size by estimating 80% power for a small (η2 p = .05) effect size using G*Power (Faul et al., 2009), resulting in a sample size of 152. We again aimed to exceed this sample size and recruit 200 participants, so as to obtain 50 participants per cell in a 2 (religious: yes vs. no) × 2 (condition: Science vs. Prayer) design.
Method
Participants
We recruited 201 participants (117 females) from MTurk in exchange for monetary compensation. Those who participated in Study 1 were not eligible to participate in Study 2. Participants ranged in age from 19 to 72 (M = 35.4, SD = 11.63) and were 79% White, 10% Black, 8% Asian, 3% mixed/other, and 2% Native American. Sixteen percent reported a high school education, 39% some college, 26% a bachelor’s degree, and 19% a postgraduate education or advanced degree. Finally, the sample comprised 47% Christians; 14% atheist; 16% agnostic; 9% other; and 13% Jewish, Islamic, Hindu, Buddhist, or spiritual.
Materials and Procedure
Participants were randomly assigned to one of two conditions, where they read a scenario about a group of people trying to predict coin flips (see Online Supplemental Appendix). In one condition (n = 109), participants read about a group of scientists using a math formula to predict the coin flips; in the other condition (n = 92), participants read about a group of people praying to God to predict the coin flips. Participants were asked how many times the group of people would need to accurately predict the coin flips to be certain their method was effective. Because we reasoned that people would have lower standards for predicting coin flips (as compared to trials involving the health outcomes in Study 1), responses here ranged from 1 (once more) to 11 (more than 10).
After responding to the scenario, participants were asked if they considered themselves to be religious (yes or no), to identify their religious affiliation, and to complete the same religiosity scale (α = .96) as in Study 1. Finally, participants responded to demographics questions.
Results and Discussion
The data were examined in a 2 (religious: yes vs. no) × 2 (condition: formula vs. prayer) ANOVA. Again, variance was heterogeneous but, as we obtained the same results using a nonparametric Kruskall–Wallis test as well as regression, we report here the results from the ANOVA. We report the nonparametric and regression analyses in the Online Supplemental materials. Descriptive statistics are displayed in Table 1.
There were significant effects for religiosity, F(1, 197) = 10.76, p = .001, η2 p = .05, condition, F(1,197) = 4.08, p = .045, η2 p = .02, and the Religiosity × Condition interaction, F(1, 197) = 4.16, p = .043, η2 p = .04. As shown in Figure 2, while religious and nonreligious people did not differ in the math formula condition, F(1, 197) = .86, p = .36, nonreligious people required more repetitions in the prayer condition, F(1, 197) = 12.87, p < .001, η2 p = .06. While nonreligious people did not differ between conditions, F(1, 197) = .00, p = .99, religious people required fewer coin tosses in the prayer condition than in the math formula condition, F(1, 197) = 7.44, p = .007, η2 p = .04.
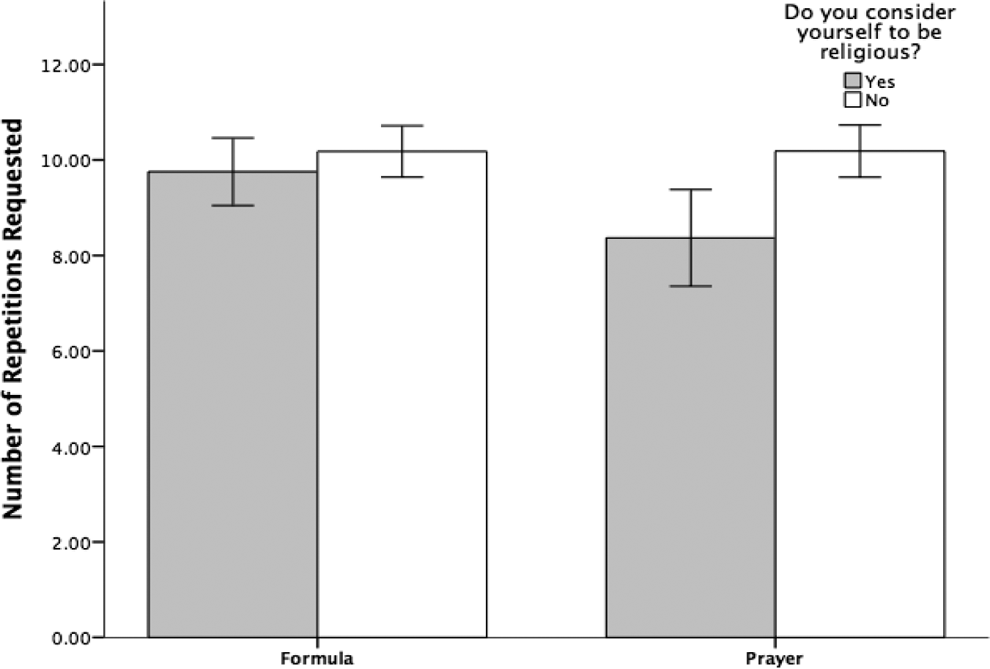
The interaction between condition and religiosity for Study 2. Responses ranged from 1 (one more) to 11 (more than 10).
The results of Study 2 replicated those of Study 1 with a new sample and with a new scenario. Religious people again required fewer repetitions to be certain that coin flips could be predicted by prayer, compared to nonreligious people in this condition, and compared to repetitions required by religious people in the math formulas condition. Unlike the results of Study 1, nonreligious people did not request different numbers of repetitions across conditions. Once again, therefore, the data suggest that religious people are biased toward believing in religious explanations. Although the successful replication increased our confidence in the results, it seemed desirable to conduct yet another replication with a scenario that was very different from those used in Studies 1 and 2.
Study 3
In Study 3, we used the same design as in Study 2 but changed the outcome to successfully identifying a guilty suspect in a court case. We followed the same procedure for calculating power as in Study 2 and aimed to recruit 50 participants per cell for a total of 200.
Method
Participants
We recruited 201 participants from Amazon’s Mechanical Turk in exchange for monetary compensation. Those who participated in Studies 1 or 2 were not eligible to participate in Study 3. However, three participants did not complete all measures, resulting in a total sample of 198 (124 females). Participants ranged in age from 18 to 69 years (M = 35.63, SD = 12.99) and were 80% White, 10% Asian, 6% Black, 3% mixed/other, and 1% Native American. Seven percent reported a high school education, 38% some college, 34% a bachelor’s degree, and 21% postgraduate education or a degree. Finally, 57% of the participants were Christians, 13% atheist, 15% agnostic, 5% other, 3% Buddhist, 4% spiritual, 2% Jewish, and less than 1% Islam or Hindu.
Materials and Procedure
Participants were randomly assigned to either a math formula (n = 105) or a prayer (n = 93) conditions, where they read about a group of people who were trying to identify a murderer from among suspects in a court case (see Online Supplemental Appendix). In the math formula condition, participants read about a group of scientists who were trying to use a mathematical formula to identify the murderer. We used the same formula description as in Study 2 to retain the same level of believability of the manipulation across the two studies. In the prayer condition, participants read about a group of people who were praying to God to identify the murderer. Participants were asked to assess the number of times a murderer must be accurately identified for the people to be sure their method was effective. Responses were made on a scale ranging from 1 (one more) to 12 (100+). After completing this question, participants again answered the religious identity question, the religiosity scale (α = .97), and demographics questions.
Results and Discussion
To test our main hypothesis, we conducted a 2 (religious: yes vs. no) × 2 (condition: math formula vs. prayer) ANOVA. The variance was again heterogeneous, but as the nonparametric Kruskall–Wallis test, regression analysis, and the ANOVA produced the same results, we report here the results of the ANOVA. Again, we show the nonparametric and regression analyses in the Online Supplemental Materials. Descriptive statistics are displayed in Table 1.
As in Study 2, we obtained significant effects for religiosity, F(1, 194) = 10.68, p = .001, η2 p = .05, condition, F(1, 194) = 4.49, p = .035, η2 p = .03, and Religiosity × Condition, F(1, 194) = 4.60, p = .033, η2 p = .023. As shown in Figure 3, religious and nonreligious people requested the same amount of repetitions in the math formula condition, F(1, 197) = .67, p = .413. However, religious people requested fewer repetitions than nonreligious people in the prayer condition, F(1, 194) = 13.77, p < .001, η2 p = .07. Further, nonreligious people requested similar number of repetitions across conditions, F(1, 197) < .001, p =.99, whereas religious people requested fewer repetitions in the prayer condition than in the math formula condition, F(1, 194) = 9.36, p = .003, η2 p = .05. Overall, these results replicate those of Study 2.
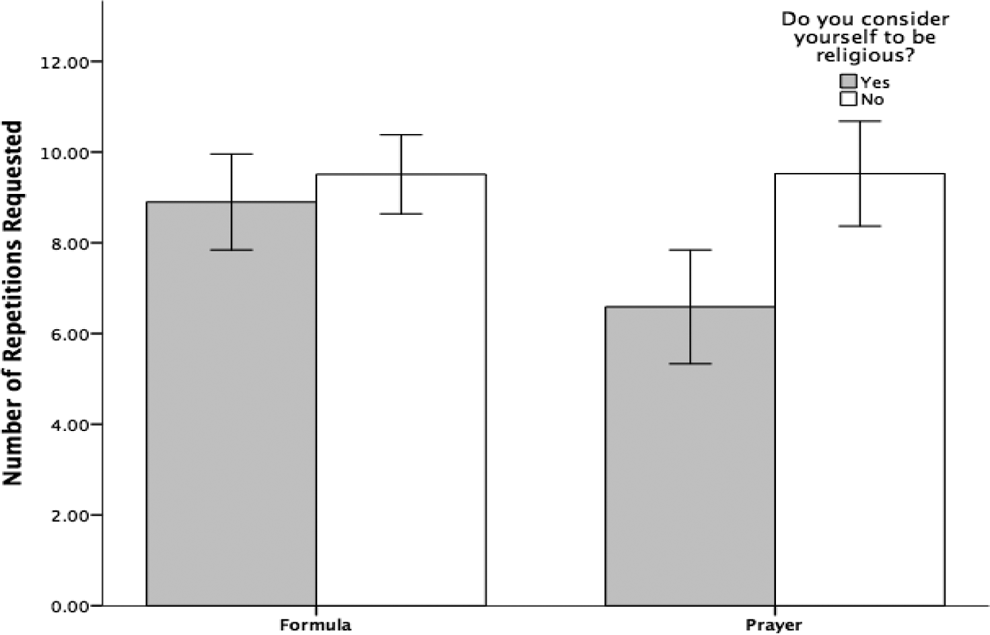
The interaction between religiosity and condition in Study 3. Responses were made on a scale ranging from 1 (one more) to 12 (100+).
Meta-Analytic Summary
To gain a clearer overall picture of the results of the three studies, we combined the effects of interest using standard meta-analytic techniques for a fixed-effects model (Rosenthal & Rosnow, 2007). We excluded the “positive wishes” condition from Study 1 because there was no equivalent condition in Studies 2 and 3; accordingly, we were left with the same 2 (condition: scientific vs. religious) × 2 (religiosity: yes vs. no) design across all three studies. We focused on the main effect of religiosity, the two-way interaction, and the simple effects within the interaction. We combined the significance levels across the three studies as follows: Each F- or t-test value was converted to a Z-score (normal deviate); the three Zs (one for each study) were summed and the sum was divided by the square root of three (the number of studies) to yield a combined Z. We combined the effect sizes across the three studies as follows: For each F or t-test, we calculated the corresponding effect size r; the three rs (one for each study) were converted to Fisher’s z and averaged; the average was then converted back to r.
Overall, religiousness was negatively related to the number of repetitions being requested (combined Z = 6.07, p < .001, r = −.23), independent of condition. However, this main effect was modified by an interaction between religiosity and condition (combined Z = 3.32, p < .001, r = .14). In the prayer condition, religious people requested significantly fewer repetitions compared to nonreligious people (combined Z = 6.24, p < .001, r = −.24); religious people also requested fewer repetitions in the prayer condition compared to the science condition (combined Z = 5.91, p < .001, r = −.23). Nonreligious people did not differ between the science and prayer conditions (combined Z = 1.01, p = .309, r = .04).
General Discussion
The meta-analytic results of the three studies indicate that religious people require less evidence when a claim is presented in a nonscientific context as opposed to a scientific context; nonreligious people require the same amount of evidence independent of context. Viewing the results from a different perspective, religious and nonreligious people treated scientific claims alike; however, religious people required less evidence than nonreligious people when evaluating religious claims. This pattern was true for situations where people were trying to cure an illness (Study 1), predict coin flips (Study 2), or identify a guilty suspect (Study 3). Together, these results suggest that religious people have less stringent standards of evidence when evaluating religious claims.
Why do religious people require less evidence to validate religious claims? In all likelihood, religious people have stronger a priori beliefs in religious claims than do nonreligious people. In our specific case, religious people are more likely to believe in the power of prayer and, therefore, require less evidence to validate the claim that it is an effective means of getting a certain outcome. Note that the situation we created in the lab has parallels in real life. One might wonder, for example, about the standards of evidence that the Catholic Church uses when establishing the occurrence of miracles as part of canonizing someone as a saint. Additionally, one might consider research investigating the viability of prayer as a medical treatment (Benson et al., 2006; Vess, Arndt, Cox, Routledge, & Goldenberg, 2009). However, where one might reason that nonreligious people are biased toward believing in science, they displayed a consistent standard of evidence across domains; in other words, they were more skeptical (than religious people) in the case of nonscientific claims (power of good wishes and prayer) but not when scientific claims were concerned.
Is it possible that the bias religious people display toward religious claims extends to other domains? Recently, Tullet, Hart, Feinberg, Fetterman, and Gottlieb (2016) found that conservatives requested less evidence compared to liberals, when given the opportunity to look at data on political outcomes. The authors also collected religious demographic information and, in their supplementary reports, reported a negative correlation between religiosity and the amount of data requested. This may suggest that the bias religious participants displayed toward religious claims in the present studies might generalize to claims in the political arena. Recall also that in Study 1, religious people also requested less evidence with regard to the power of good wishes. It will be important to determine in future research, in which domains religious and nonreligious people differ and in which domains they do not.
Why do religious people need less evidence to believe in nonscientific claims? Religious people are more likely to endorse a spiritual epistemology—the belief that valid knowledge about the world can come from spiritual experiences (Browne, Pennycook, Goodwin, & McHenry, 2014); they are also more likely to believe that mental or immaterial properties can interact with the physical world and result in objective, material outcomes, referred to as “ontological confusions” (Lindeman, Svedholm-Hakkinen, & Lipsanen, 2015, p. 65). Beliefs that rocks or plants can know things or that prayers can heal physical ailments (i.e., Study 1) are examples of ontological confusion. Ontological confusions are also related to an increased reliance on intuition (Svedholm & Lindeman, 2013) and a tendency toward belief bias (Pennycook et al., 2015). Additionally, nonscientific claims may also benefit from being unfalsifiable (Friesen et al., 2015) and may require less evidence or may be perceived as being beyond the scope of empirical evidence. It is left for future research to investigate which, if any, of these mechanisms might better explain the current pattern of results.
The present studies do have some limitations. Our participants responded to vignettes, which is only one mode of providing information and, as such, limit the ecological validity of the results. More importantly, we used repetitions as a measure of confidence in the method that was used to secure the outcomes. Future research would benefit from including behavioral outcomes as well as other means of measuring the believability of information. Additionally, in these three studies, we relied on the same methods when framing the context as religious (i.e., prayer) or scientific (i.e., medication and mathematical formula). Future research should examine other types of scientific versus religious methods by which outcomes can be obtained. As mentioned above, future research might also examine additional contexts (e.g., political, interpersonal, and philosophical) to examine whether religious and nonreligious people differ in the amount of evidence that is needed to support particular claims.
In conclusion, the present studies provide evidence that religious people may evaluate religious and scientific claims against different standards of evidence. It is important to examine whether this difference generalizes to other contexts as well as other methods of assessing confidence in certain claims.
Footnotes
Authors’ Note
We affirm that we have reported all measures, conditions, data exclusions, and how we determined sample size. Additionally, this manuscript contains all studies attempted in this program of research—no studies were excluded from this report because of nonsignificant effects and all relevant effects are represented in the internal meta-analysis.
Acknowledgments
Special thanks to Harry Reis, Andrew Elliot, and Thuy-vy Nguyen for their input on this study.
Declaration of Conflicting Interests
The author(s) declared no potential conflicts of interest with respect to the research, authorship, and/or publication of this article.
Funding
The author(s) received no financial support for the research, authorship, and/or publication of this article.
Supplemental Material
The supplemental material is available in the online version of the article.
References
Supplementary Material
Please find the following supplemental material available below.
For Open Access articles published under a Creative Commons License, all supplemental material carries the same license as the article it is associated with.
For non-Open Access articles published, all supplemental material carries a non-exclusive license, and permission requests for re-use of supplemental material or any part of supplemental material shall be sent directly to the copyright owner as specified in the copyright notice associated with the article.