
Abstract
We examine the appropriateness of response speed and response consistency as data quality indicators within online samples. Across several inventories, results show that response consistency decreases dramatically at response rates faster than 1 second per item. Our results suggest that careless responding may be fairly common in online samples and often functions to increase the expected correlation between items in a survey, which has implications for the likelihood of false positives and the analysis of factor structure. Given how careless responding can influence estimated associations between variables, we strongly recommend that researchers include response speed and consistency screens in their research and provide empirically informed cut points for data screens that should be useful across a wide range of instruments and settings.
Although research has shown that online samples can be used to garner high-quality data (Buhrmester, Kwang, & Gosling, 2011; Gosling, Vazire, Srivastava, & John, 2004; Mason & Suri, 2012), such samples may often be more contaminated with “dirty data” than nononline samples (e.g., DeSimone, Harms, & DeSimone, 2015; Johnson, 2005; Meade & Craig, 2012). This concern is compounded by the difficulty in obtaining accurate estimates of data quality, as most researchers rarely report attempts to screen data. Moreover, common screening techniques such as bogus items can have questionable utility because participants often warn one another of their presence on bulletin boards frequented by users of these sites (Chandler, Mueller, & Paolacci, 2014). However, other features of online surveys, such as the greater ease of randomizing items and recording response times, afford opportunities for better evaluating data quality. In the current study, we explore the utility of indicators of response speed and response consistency as intuitive indices that may be added to the researcher tool kit to identify “dirty data” and explore how basic measures of association are impacted by the exclusion of participants identified by speed and consistency data screens.
Effects of Careless Responding
One of the most common threats to the quality of survey data is that respondents are not responding meaningfully to items because they are distracted or are trying to complete the task as quickly as possible. Recent research suggests that careless responding has characteristic properties that produce undesirable and perhaps unexpected effects in survey research. Rather than being understood as adding “random error” that moves all correlations toward zero, careless responding is better understood as providing data with a person-specific mean (Mi ) and standard deviation (SDi ) that applies to all items rated in this manner. To the extent that the distribution of a person’s careless responses is systematically lower or higher than the responses given by other participants, these responses are not “random” but rather are expected to be disproportionately located in the extreme corners of the bivariate distributions of item responses, which will frequently increase correlations (Credé, 2010). 1 This in turn can increase the likelihood of false positives and biased analyses of factor structure (Anusic, Schimmack, Pinkus, & Lockwood, 2009; Huang, Liu, & Bowling, 2015; Schmitt & Stults, 1985; Soto, John, Gosling, & Potter, 2008; Woods, 2006). These effects are further accentuated by the tendencies for careless respondents to provide the same rating to many consecutive items (Schonlau & Toepoel, 2015; Zhang & Conrad, 2014), which decreases response variability. Such response patterns are often found among high-frequency participants on data collection websites (Behrend, Sharek, Meade, & Wiebe, 2011; Deneme, 2009; Harms & DeSimone, 2015).
Given the nature of the problem careless respondents can introduce in drawing proper conclusions from research and indications of the prevalence of these issues, we propose that researchers should make use of two intuitive forms of data quality indicators: response time and response consistency.
Response time, seconds per item (spi)
A widely used means to index the speed at which people complete a survey is simply a ratio of the time from the beginning to the conclusion of item ratings divided by the number of items rated, which we will refer to as an index of seconds per item, or spi. For clarity, we will generally refer to higher spi estimates as corresponding to higher response times, as higher estimates actually correspond to lower response speeds. 2
Although extremely long response time estimates may signal potential problems, extremely short response times are more clearly diagnostic of careless responding. This is because there are effective limits in how quickly participants can respond meaningfully to survey items (Huang, Curran, Keeney, Poposki, & DeShon, 2012; Zhang & Conrad, 2014).
Within-session response consistency, qi(d)
We can estimate response consistency as the profile correlation qi (t) indexing the level of similarity in a participant’s responses to items they have rated twice, with t denoting the time between survey sessions. For instance, an individual who provided scores of 1, 2, 3, 4, and 5 when rating a 5-item inventory and then scores of 3, 2, 1, 5, and 4 when rating these items again (in the same order) would receive a qi (t) value of +.50, indicating that they have provided a fairly similar ordering of ratings across administrations. By extension, we denote within-session response consistency estimates as qi (d), where d indicates a special increment of time meaning different administrations of the same instrument within the same survey (Wood et al., 2017). This screen can be thought of as an extreme version of a semantic data screen (DeSimone et al., 2015) by operationalizing consistency across items which are identical rather than merely similar in content.
Response consistency estimates are regularly examined in longitudinal studies and observed qi (t) levels are generally quite high (Caspi & Herbener, 1990). For instance, Wood and Furr (2016) found average qi (t) levels on a personality inventory over a 1-year retest interval to be .87. Although response consistency values near qi (t) = 0 over long retest intervals can be valid indicators of dramatic psychological change, such scores become much clearer indicators of careless responding during at least one administration when the inventory is retested within minutes.
Current Studies
In two studies using “workers” from Amazon’s Mechanical Turk (MTurk), we explore the relationship between response time and response consistency in several different measures. In addition, we examine how response time and consistency are associated with a participant’s overall response variability and how including or excluding careless respondents alters the nature of correlations between variables in the data set.
Study 1: Properties of Response Time and Response Consistency Estimates
Method
Participants and Design
Participants were recruited via MTurk and completed surveys on Qualtrics. Participants were informed that the study would take approximately 25–45 min to complete and were reimbursed US$1.75 for their participation. Participants were randomly assigned to complete one of the three surveys, listed as S1.1, S1.2, and S1.3 in Figure 1, which were completed in median response times of 21.6, 20.7, and 21.0 min, respectively. Each survey contained one or more repeated inventories, with administrations separated by a large number of other items related to workplace experiences (Nk ≥ 138). The order of items was randomized within each inventory. Prior to rerating inventories, participants were shown a screen that read “In the next section, you will be asked to rate some of the same items you rated earlier. Do not worry about the answers you provided earlier. Similar to the first set of items, please rate how much you think each characteristic describes you.”
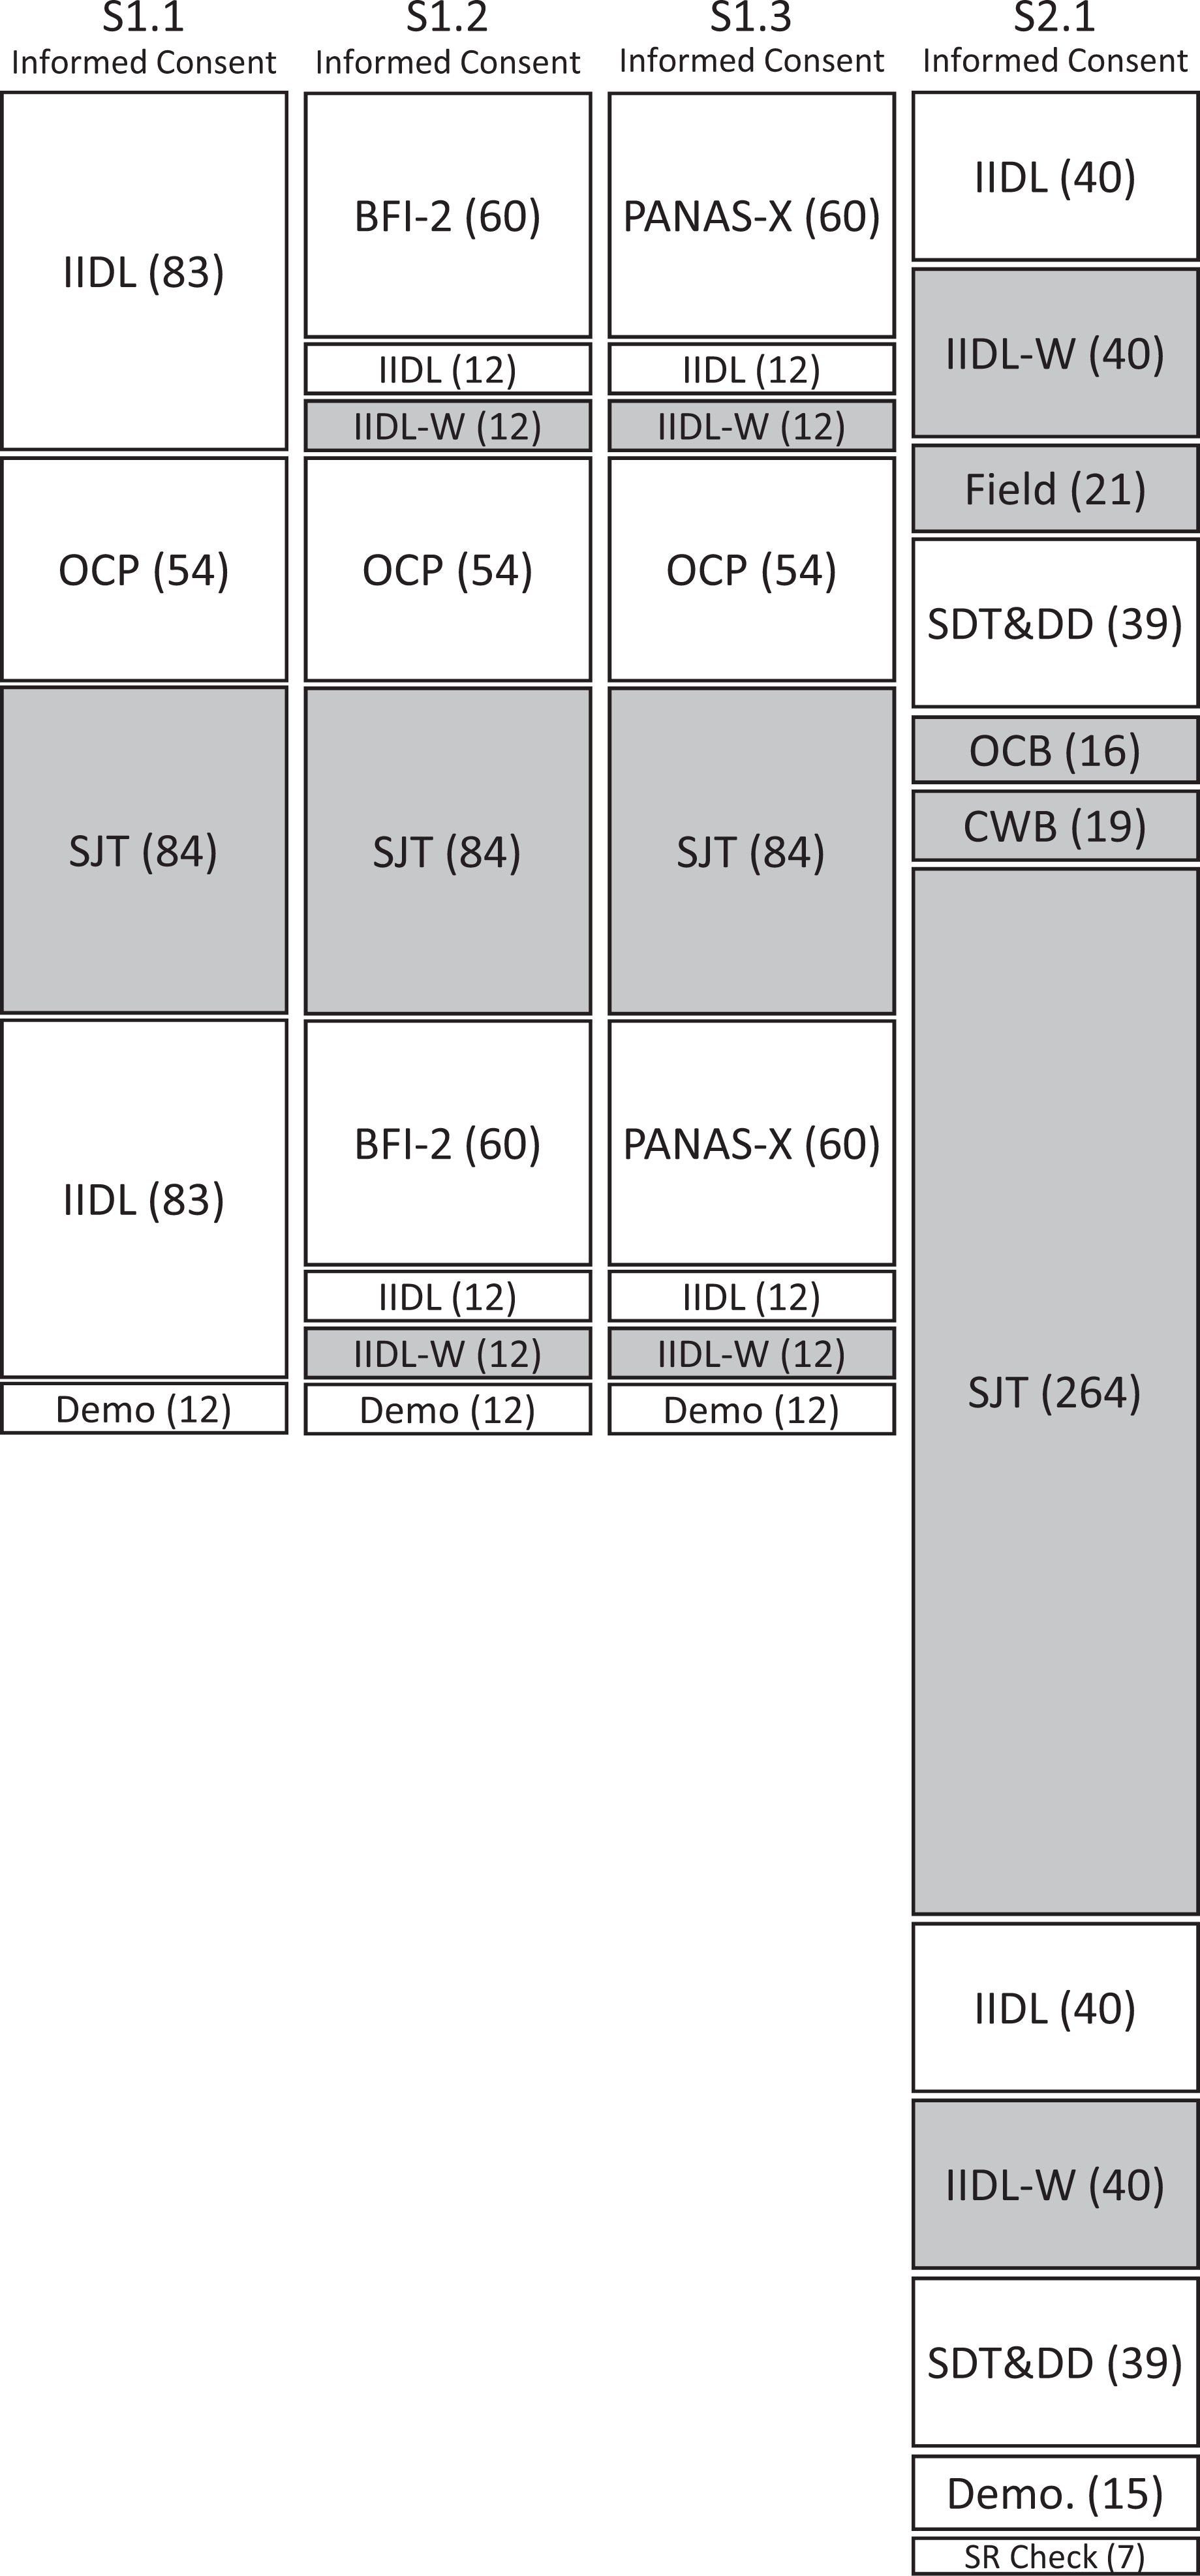
Survey flow for S1.1-S1.3 and S2 samples. Number of items for the instrument are given in parentheses, and vertical length boxes are sized to roughly match the number of items. Boxes in dark gray concern tests not examined as part of the present study. For examined scales: DD = Dirty Dozen, Demo = demographics, IIDL = Inventory of Individual Differences in the Lexicon, OCP = Organizational Culture Profile, SDT = Short Dark Triad, and SR check = self-reported data quality check (for unexampled scales: IIDL-W = workplace contextualized IIDL (i.e., how I see myself at work), SJT = situational judgment task, OCB = organizational citizenship behaviors, CWB = counterproductive work behaviors, and WorkExps. = workplace expectations).
We aimed to recruit enough participants to retain at least 100 participants in each survey after expected data quality screens. An initial 530 participants completed some part of the survey. Participants were only included if they rated at least 90% of the items within each of the inventories used in analyses, resulting in a final sample size of 421 participants, (45% female; M [SD]age = 33.9 [10.1]; 77.4% White, 8.3% Black, and 8.5% Asian).
Retested Inventories
Big Five Inventory-2 (BFI-2)
The BFI-2 is a 60-item instrument designed to measure 15 personality dimensions by items consisting of short statements (e.g., “Is polite, courteous to others”) on a disagree strongly = 1 to agree strongly = 5 response scale (Soto & John, 2016). Each scale was balanced to have 2 positive and negative items.
Positive Affect and Negative Affect Schedule – Expanded Form (PANAS-X)
The PANAS-X is a 60-item measure designed to measure facets of emotion related to positive and negative affect, mostly with items consisting of single adjectives (e.g., blameworthy; attentive; Watson & Clark, 1999). Participants were instructed to “Indicate to what extent you have felt this way during the past few weeks” (very slightly = 1; extremely = 5).
Inventory of Individual Differences in the Lexicon (IIDL)
Participants completed an 83-item version of the IIDL, an instrument composed of short highly synonymous adjective pairs (e.g., relaxed/calm; undependable/unreliable), using all items provided in Wood, Nye, and Saucier (2010, Table 2 and Appendix A) except the item retarded/senile, which was excluded due to a programming error. Items were rated on a scale from very uncharacteristic of me = 1 to very characteristic of me = 5.
Participants assigned to rate the BFI-2 or PANAS-X instruments also completed a 12-item subset of the IIDL consisting of desirable behavioral and psychological tendencies. This scale was included to balance survey length across conditions (Figure 1) but also allowed examination of how response consistency estimates function when based (1) on a considerably smaller number of elements and (2) on elements which varied less in desirability. We expect both of these qualities to reduce the effectiveness of response consistency estimates (qi[d] ) as indicators of data quality. We refer to the longer and shorter versions of the instrument as IIDL-83 and IIDL-12, respectively.
Organizational Culture Profile (OCP)
All participants completed the 54-item OCP (O’Reilly, Chatman, & Caldwell, 1991), where participants are asked “How desirable would this characteristic be as part of your ideal organization you would work for?” (highly undesirable = 1) to (highly desirable = 6). Items consisted disproportionately of desirable job characteristics such as autonomy and high pay for good performance.
Data Quality Indicators
Response time, spi
Response time estimates were calculated as the time taken to make a first click on each page (TC 1) and to click submit (TCS ) on each page, divided by the number of items rated (NR ) on that page:
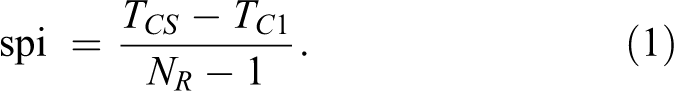
We subtracted 1 in the divisor as the quantity in the numerator reflects the time taken to rate all items following the first item rated, which is assumed to prompt the first click. For unclear reasons, two participants had values on the TCS and TC 1 variables of 0; these were coded as missing values.
We transformed this index using a base-2 log transformation. Thus, unadjusted scores of .25, .5, 1, 2, 4, 8, 16, and 32 spi become log2 scores of −2, −1, 0, 1, 2, 3, 4, and 5, respectively. Scores outside these minimum and maximum ranges were rare and were rescored to these values for simpler graphical presentation.
Response consistency, qi(d)
Response consistency was indexed as the profile correlation, qi (d), linking the person’s responses across the different administrations of a particular instrument within the same survey session. As correlations, qi (d) values can range from −1 to 1 and index the level of pattern similarity in responses across the two time points. When a participant provided completely invariant responses to one or both administrations, their qi (d) estimate could not be calculated and was scored as a missing value.
Results and Discussion
Distributions of Response Time and Consistency Indices
Although summary statistics provided in Table 1 are given in the units of spi, the calculation of these statistics and of associations between response time estimates and other variables was performed using log2-transformed variables. Only response times to the first administration of the instruments are shown. Response time estimates varied across instruments, with the fastest responses being provided on the IIDL-12 (M = 1.5 spi) and the slowest responses on the BFI-2 (M = 2.6 spi). Individual differences in response times were highly consistent across instruments (e.g., all rs between .51 and .66). Although not shown in Table 1, the second administration of the instrument was completed in approximately 80% of the time taken to complete the first administration, and individual differences in response times were fairly consistent across first and second administrations of the same instrument (all rs between .62 and .69).
Descriptive Statistics Between Participant-Level Response Speeds, Consistencies, and Variabilities (Study 1).
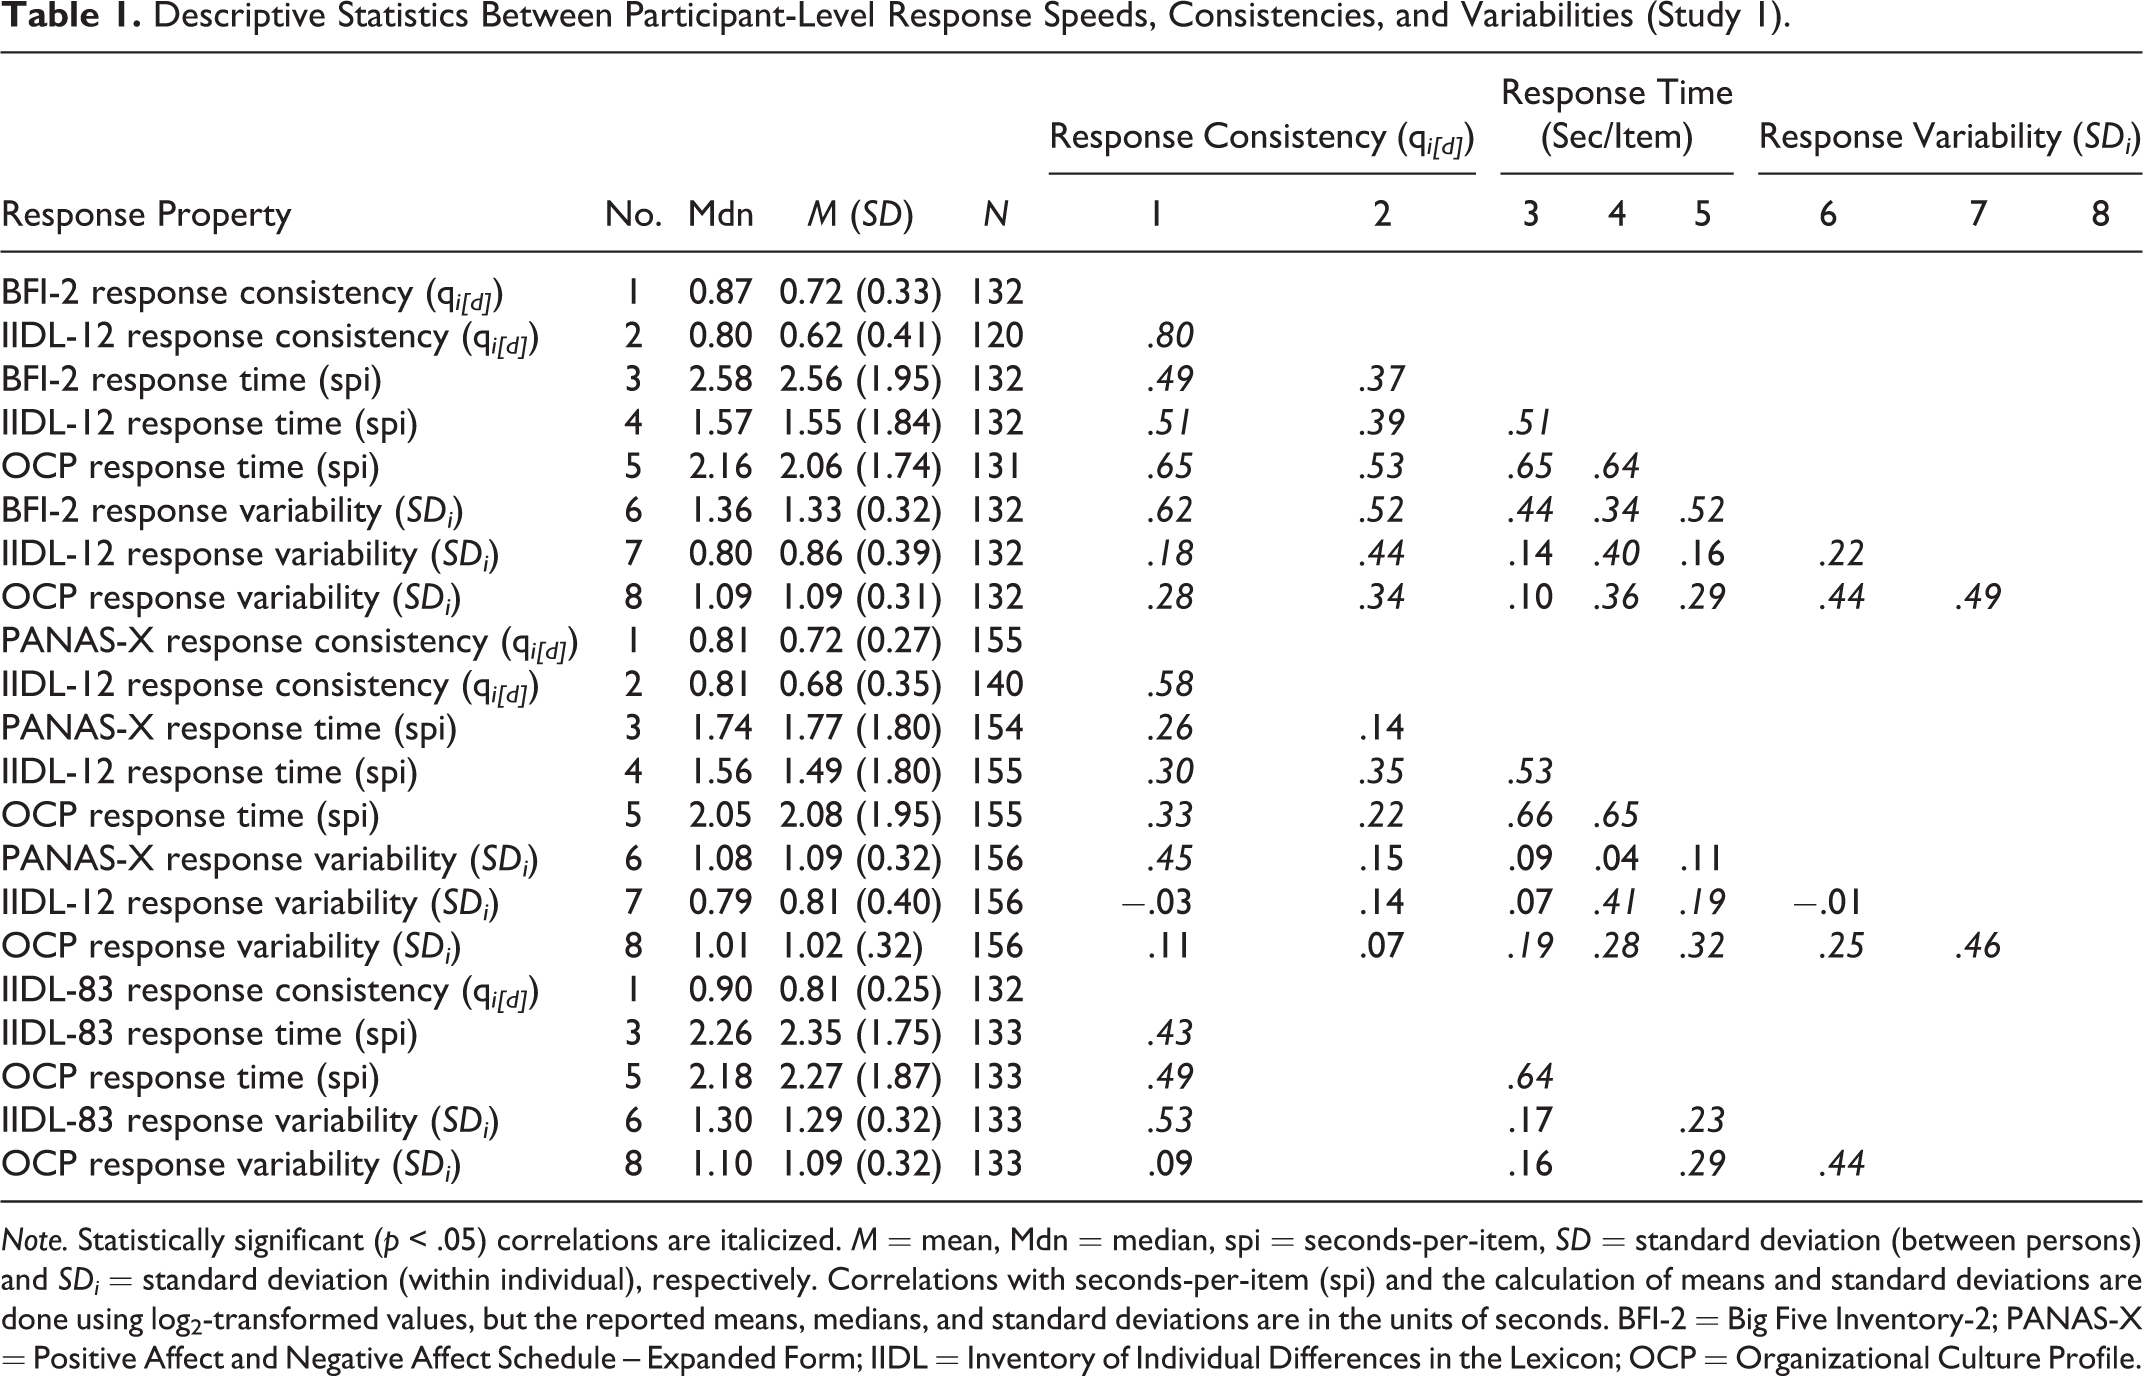
Note. Statistically significant (p < .05) correlations are italicized. M = mean, Mdn = median, spi = seconds-per-item, SD = standard deviation (between persons) and SDi = standard deviation (within individual), respectively. Correlations with seconds-per-item (spi) and the calculation of means and standard deviations are done using log2-transformed values, but the reported means, medians, and standard deviations are in the units of seconds. BFI-2 = Big Five Inventory-2; PANAS-X = Positive Affect and Negative Affect Schedule – Expanded Form; IIDL = Inventory of Individual Differences in the Lexicon; OCP = Organizational Culture Profile.
As shown in the middle column of Figure 2, participants showed very high consistency in their responses when completing two administrations of the same measure, with median consistencies ranging from .90 for the IIDL-83 to .80 for the IIDL-12. Additionally, individuals who responded to the IIDL-12 consistently were much more likely to respond consistently to the BFI-2 (r = .80) or PANAS-X (r = .58).
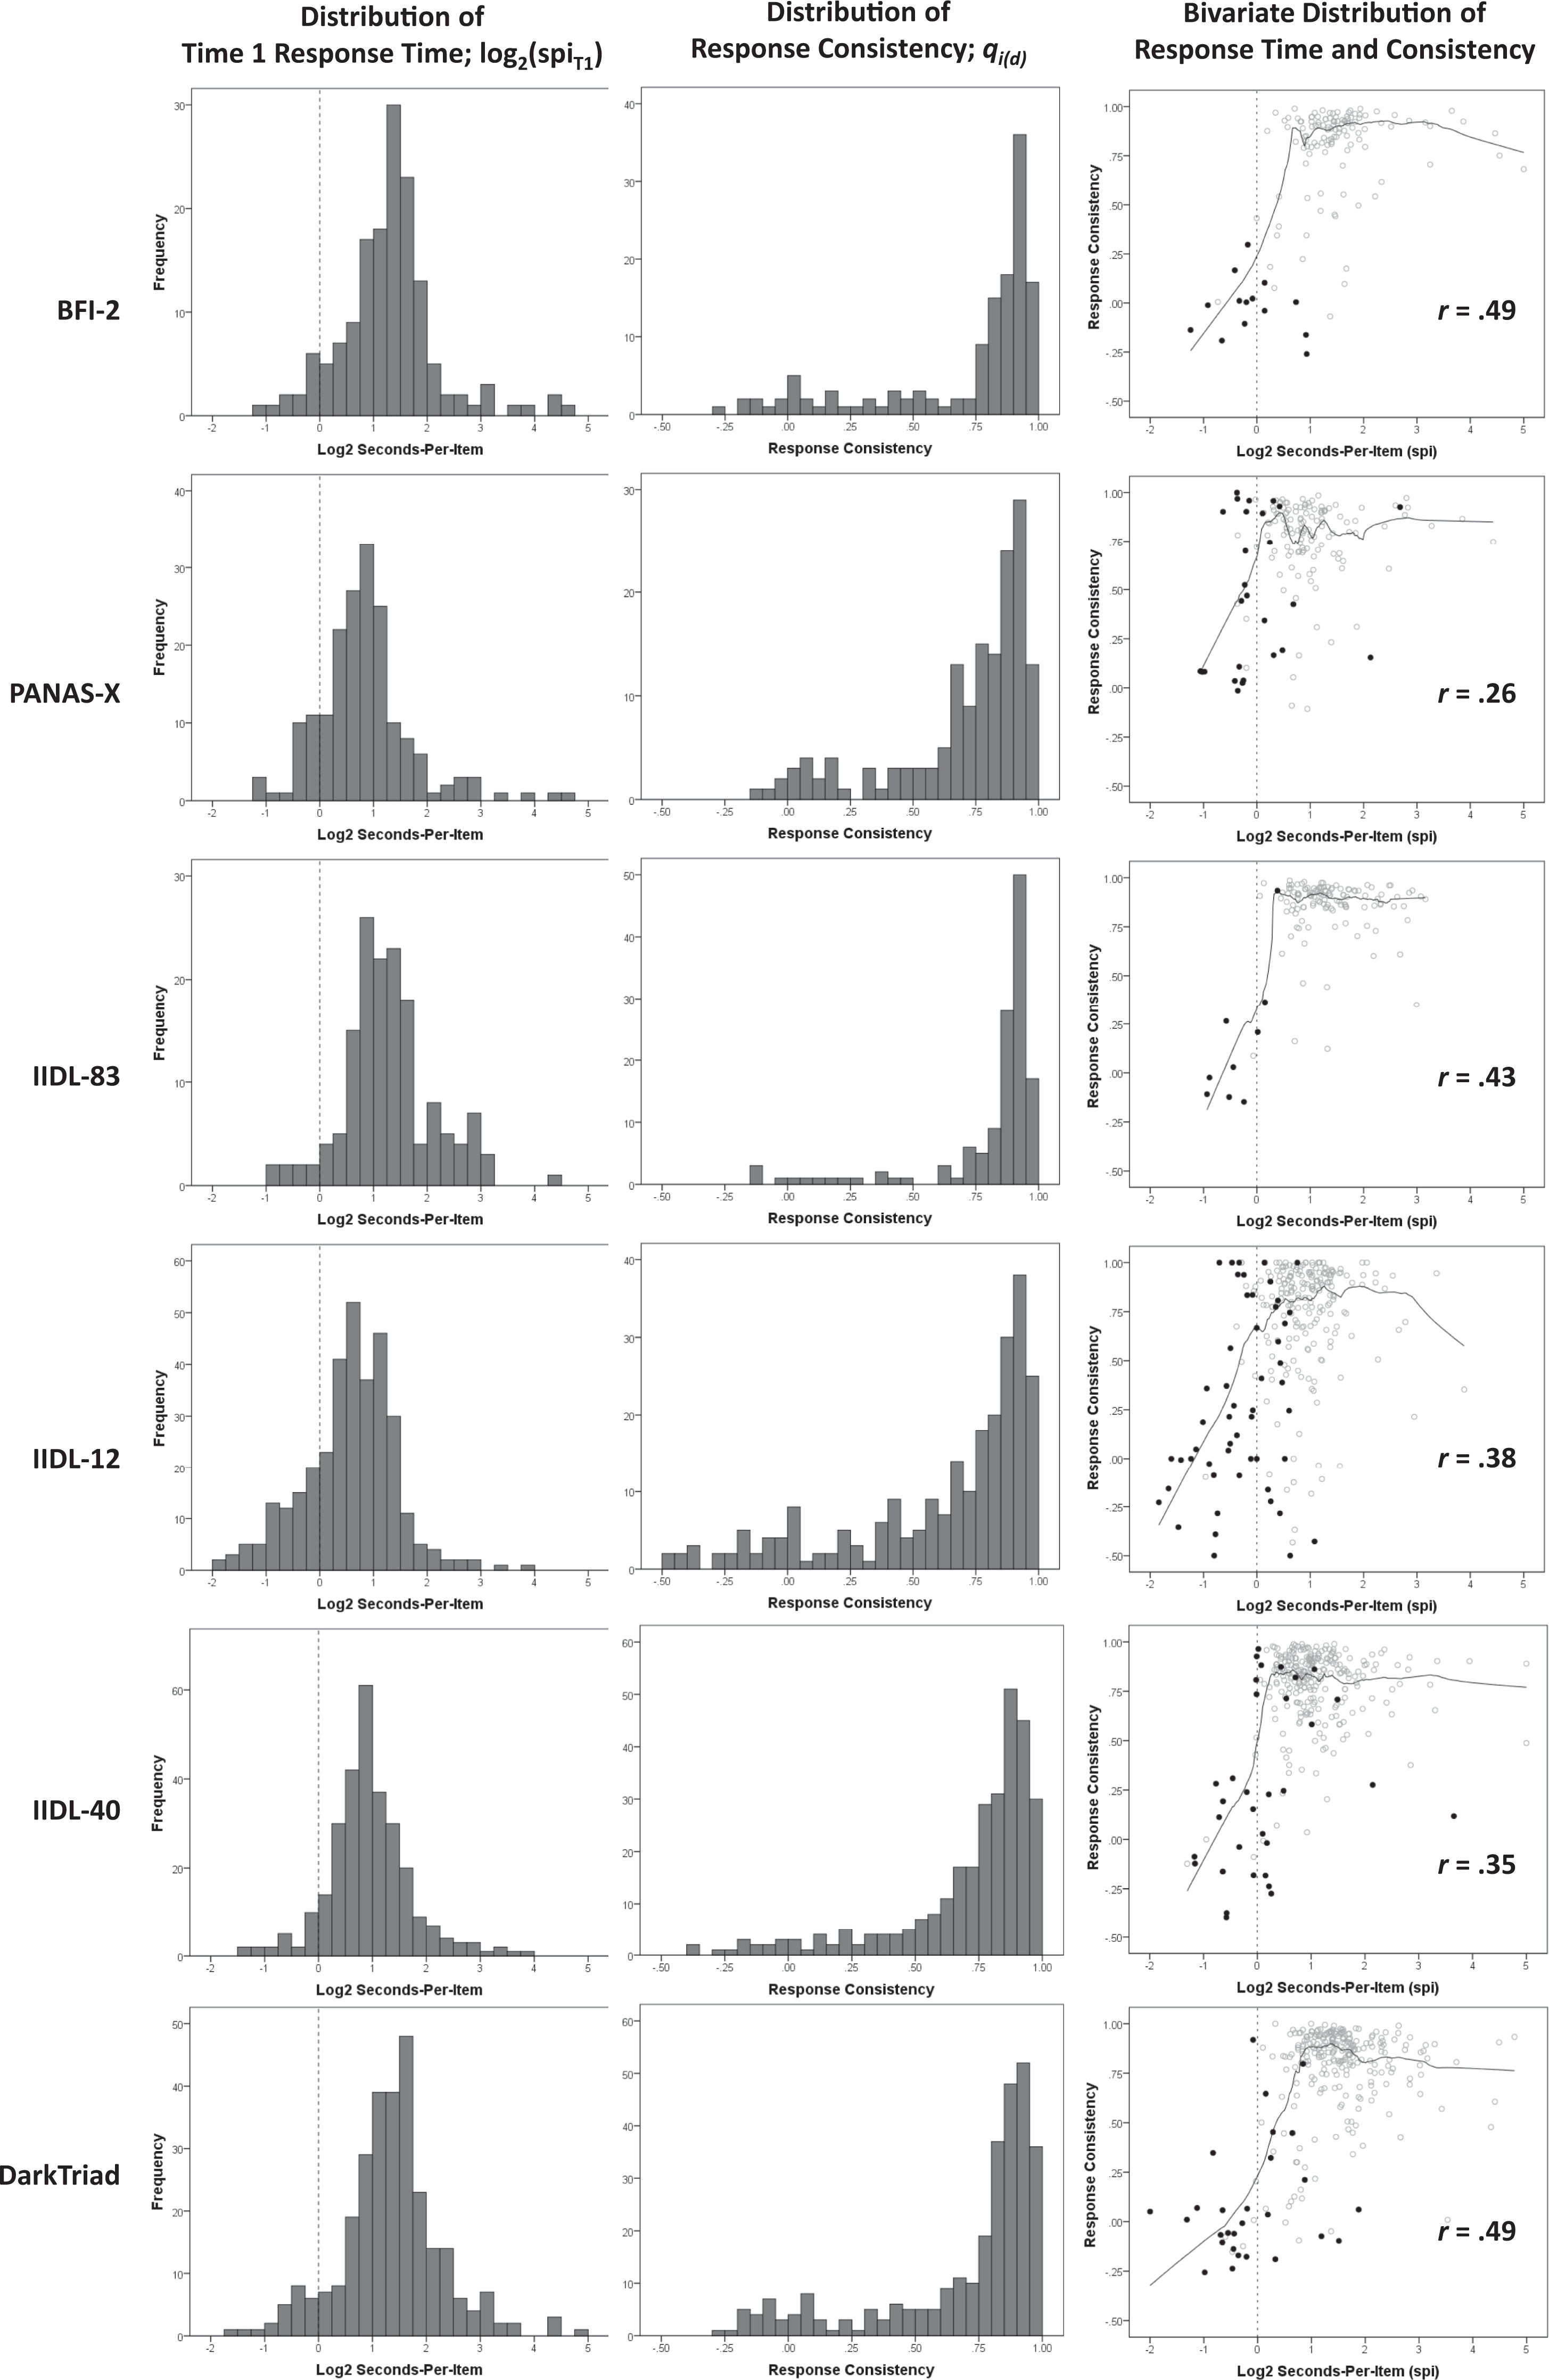
Distributions and interrelationships of log2 transformed seconds-per-item (e.g., .25 spi = −2, 8 spi = +3) and response consistency. Larger log2-transformed spi values indicate slower response speeds. Because response inconsistency can be due to rapid responding solely to the second administration of the survey, participants who responded faster than 1 spi to the second administration are shown by filled black dots and those who responded at rates slower than 1 spi are shown by unfilled gray dots.
Relations Between Response Time and Consistency
The relationship between response time and consistency is depicted in the rightmost scatterplots in Figure 2. To help identify general trends, we have added lowess lines (Cleveland & Devlin, 1988) using 20% data windows. A vertical line at the response time of 1 spi (log2 = 0) was added to aid comparisons of response times faster and slower than this value. Since the graph only shows the relationship between response times to the first administration of the inventory with response consistency, we also have indicated participants who completed the second administration of the inventory with response times faster than 1 spi as dark dots, given that low consistency could be due to a participant responding meaningfully to the first administration of the scale but carelessly to the second.
As shown in the Figure 2 scatterplots and in Table 1, response time and consistency estimates within a given inventory showed relationships ranging from r = .26 to .49 when using the response time estimates from the first set of item ratings. Despite the strength of these linear relationships, the relationship between response time and consistency was actually strikingly nonlinear for all instruments, with levels of response consistency being broadly similar for all response times slower than 2 spi but plummeted for response times faster than this value. To illustrate, although the median response consistency scores for the BFI-2 and IIDL-83 were .87 and .90, respectively, no participant who responded to these inventories at a rate faster than 1 spi (log2 = 0) achieved a qi (d) estimate higher than .50. For all inventories, the expected response consistency for participants who completing the inventory with response times faster than .5 spi was very nearly zero.
Additionally, we found response times and consistency to be routinely positively associated across inventories. For instance, response times to either the OCP or IIDL-12 consistently showed moderate to strong positive relationships with response consistency in the BFI-2 and PANAS-X instruments (rs between .22 and .65).
Relationship Between Response Time and Consistency With Response Variability
As shown in Table 1, response variability within a given inventory was higher among participants with longer response times (rs between .09 and .44) and with greater response consistency across repeated administrations (rs between .14 and .62). Further, associations linking response times and consistency to response variability were not inventory specific, for instance, slower and more consistent responding to the BFI-2, PANAS-X, and IIDL measures was generally associated with greater variability in OCP ratings (rs between .07 and .36).
Consequences of Excluding Very Fast and Very Inconsistent Respondents
We continued by exploring the effect of fast and inconsistent respondents on two basic indicators of data structure: Average interitem correlation (rkk’ ) and the percentage variance explained by the first unrotated principal component (FUPC) in exploratory factor analysis (both using the first set of ratings for repeated inventories). No items in the inventory were reverse scored prior to these calculations. To examine this, we flagged participants who responded with times faster than 1 spi to their first rating of the inventory or with a level of consistency across their first and second ratings that was less than qi (d) < .25. As shown in Table 2, for the four inventories examined, between 5% and 24% of participants were flagged by these criteria. Because all participants completed the OCP (Figure 1), we additionally explored how the decision to exclude fast or inconsistent respondents influenced rkk’ and FUPC values not just within the inventory used for exclusions but for the OCP as well. These analyses are presented in Table 2.
Comparison of How Removing Very Fast Respondents (spi < 1) and Very Inconsistent Respondents, qi(0) < .25, Affects Average Interitem Correlations (rkk ’) and Percentage Variance Summarized by FUPC.
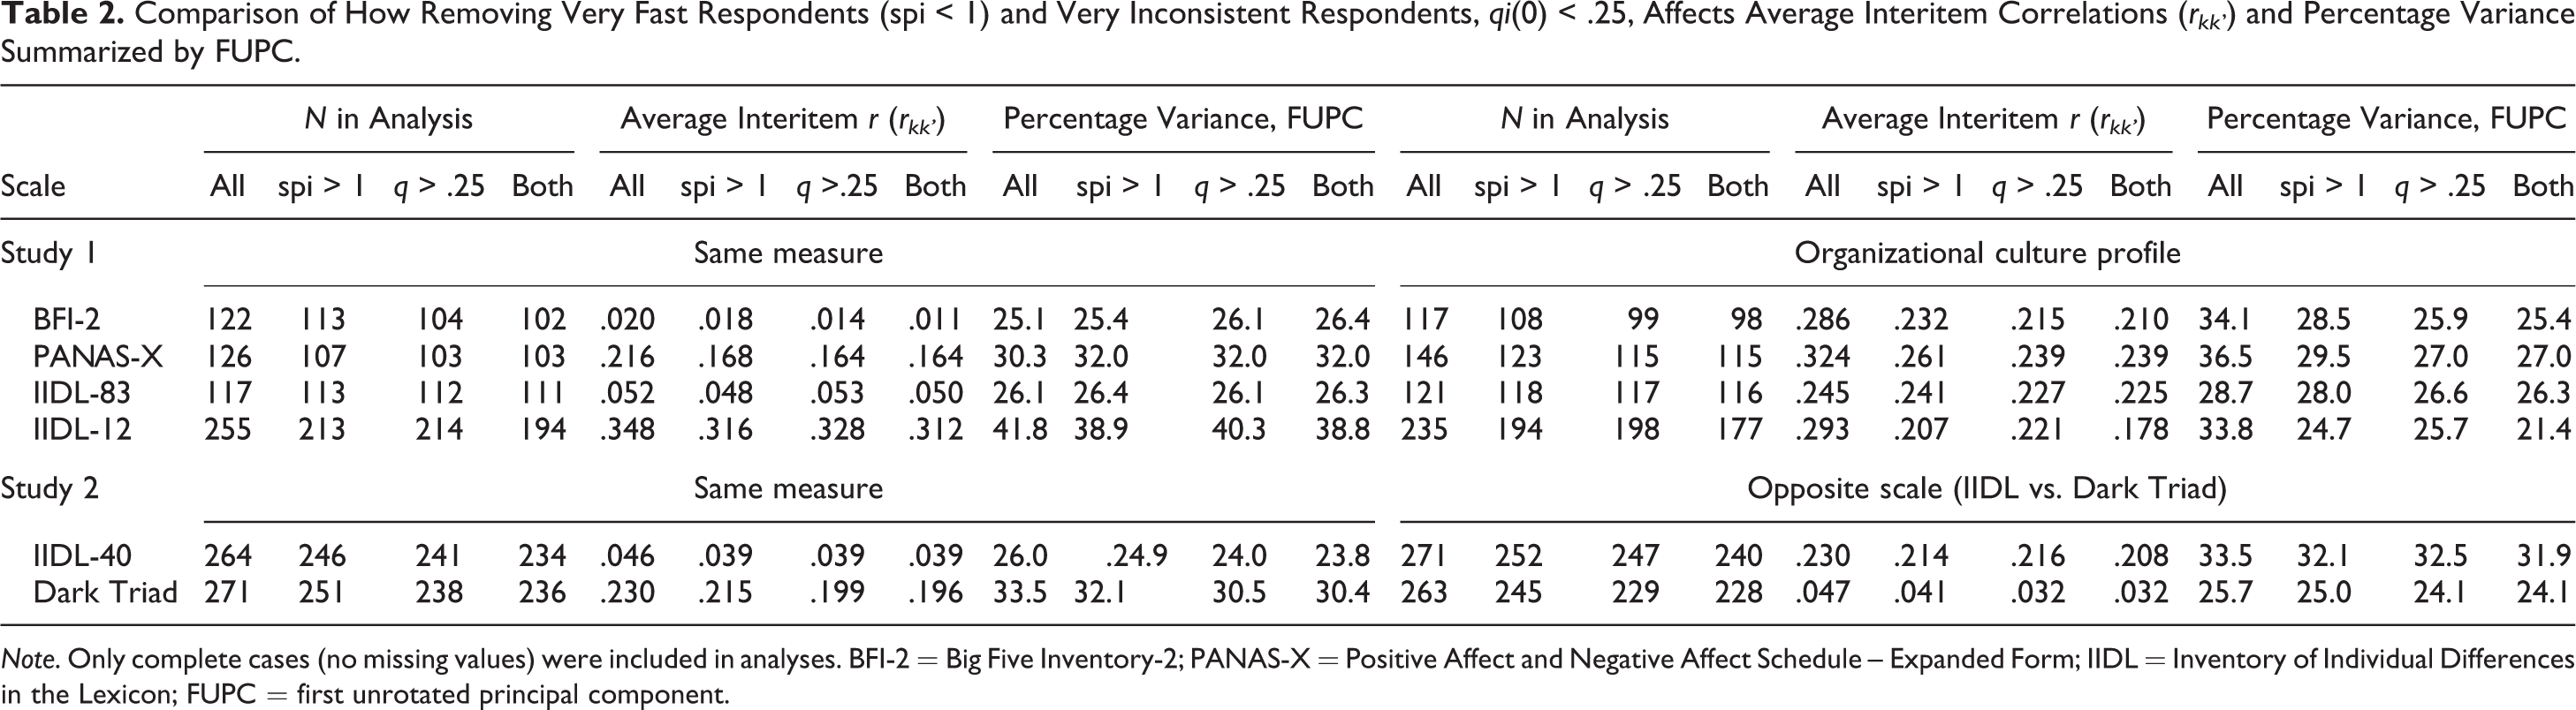
Note. Only complete cases (no missing values) were included in analyses. BFI-2 = Big Five Inventory-2; PANAS-X = Positive Affect and Negative Affect Schedule – Expanded Form; IIDL = Inventory of Individual Differences in the Lexicon; FUPC = first unrotated principal component.
Effect on interitem correlations (rkk’)
Excluding very fast or inconsistent respondents had a fairly consistent effect of decreasing the average interitem correlation. Sometimes this effect was dramatic: Results indicated that in certain conditions, the average interitem correlation within an inventory was inflated by over r = .10 in magnitude by fast and inconsistent respondents who found at the rates present of this sample. Additional analyses indicated that the tendency for fast and inconsistent respondents to increase the average interitem correlation was generally statistically significant and was largest within inventories where the average response across all items departed considerably from the scale midpoint (see Online Supplemental Materials).
Effect on FUPC
Given that the removal of fast and inconsistent respondents tended to decrease correlations between items, it was anticipated that the percentage of variance explained by the FUPC would generally decrease after excluding fast or inconsistent respondents. However, although the IIDL-12 and the OCP showed the decreases in the variance explained by the FUPC (from approximately 35% before exclusions to approximately 25% subsequently), the BFI-2 and PANAS-X actually showed modest increases in the FUPC after exclusions.
These discrepancies may be due to the range of interitem correlations in these inventories. As shown in Table 2, the BFI-2 and PANAS-X showed average interitem correlations close to zero. Because rapid and inconsistent respondents may tend to make items correlate more positively, excluding these participants may have allowed the large number of negative interitem correlations expected within these instruments to be appropriately estimated and serve a larger role in the factor structure.
Study 2: Conceptual Replication With Additional Measures
In a second study, we attempted to replicate our findings with a larger sample, additional instruments, and compare the proposed screens to self-reports of response quality.
Method
Participants and Procedure
Participants were again recruited from MTurk and were informed that the study would take approximately 25–45 min to complete with US$2.16 reimbursement for participation. As shown in Figure 1, in this study, all participants completed the same survey, which was considerably longer than the surveys used in Study 1 (median response time = 37.5 min). The survey consisted of completing another version of the IIDL, two measures of the Dark Triad (Paulhus & Williams, 2002), and then additional items that were not examined here (Nk = 299) before rating the IIDL and Dark Triad measures again (Figure 1). A total of 296 individuals were included in analyses using the same inclusion rules as Study 1 (47% female; M [SD]age = 33.2 [9.8]; 78.6% White, 6.1% Black, and 7.5% Asian).
Measures
IIDL-40
We assessed a new subset of 40 IIDL items from the larger set surveyed in Study 1. This subset was created to have approximately equal numbers of items rated as desirable and undesirable in previous samples (Wood & Furr, 2016).
Dark Triad
Participants completed both the 27-item Short Dark Triad (Jones & Paulhus, 2014) and 12-item Dirty Dozen (Jonason & Webster, 2010) measures of the Dark Triad dimensions. Both inventories consist of short statement–based items generally consisting of somewhat undesirable psychological or behavioral tendencies (e.g., “I’ll say anything to get what I want;” strongly disagree = 1, strongly agree = 5). Items were presented together to form a single 39-item profile.
Self-reports of response quality
Participants were also asked to rate agreement with seven direct reports of the quality of their response (strongly disagree = 1, strongly agree = 5) items are listed in Table 3.
Relations Between Response Consistency, Speed, Deviation From Sample Mean, and Variability and Self-Reports of Data Quality (Study 2).
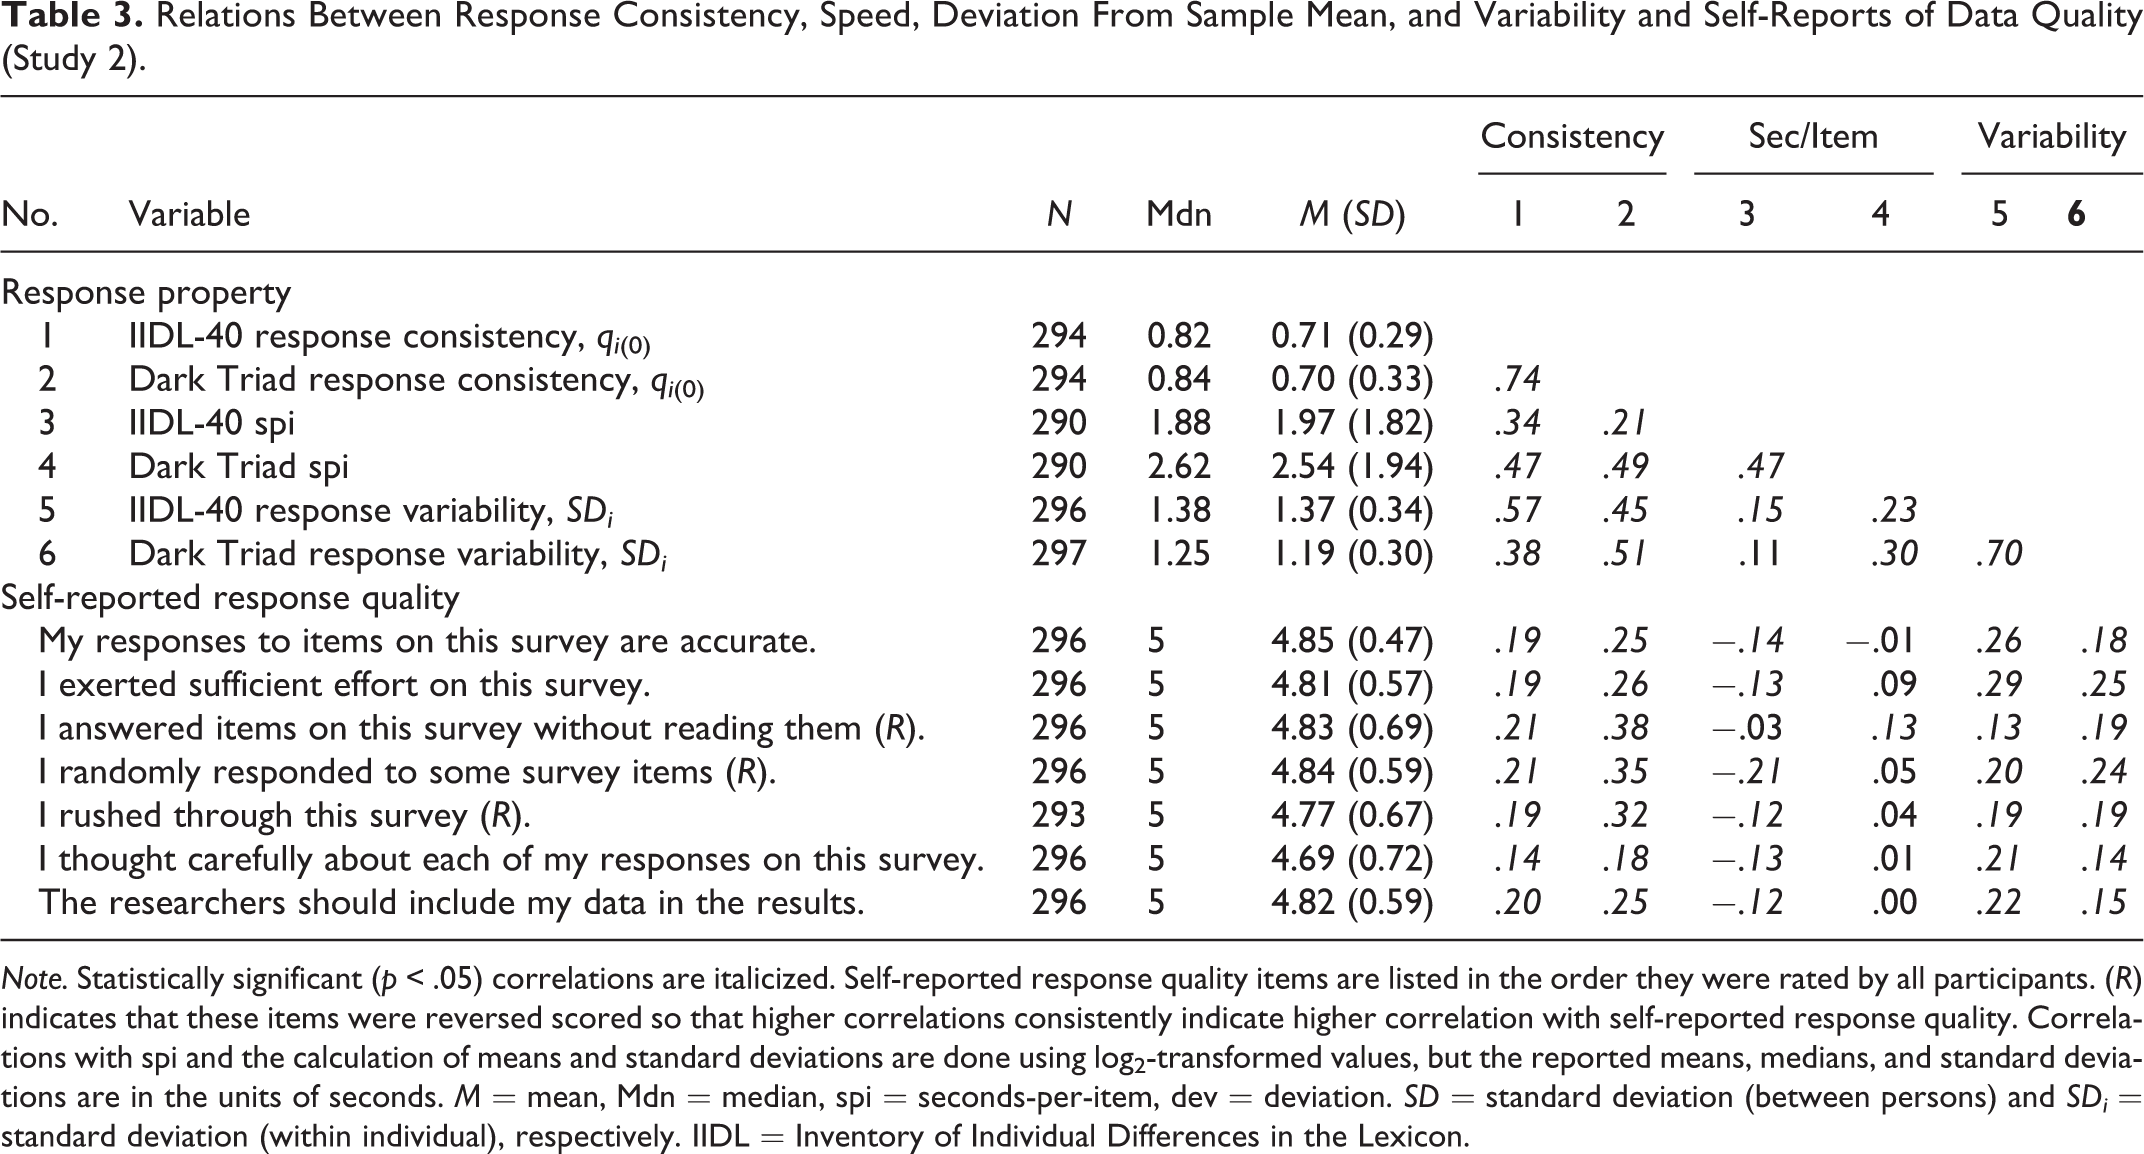
Note. Statistically significant (p < .05) correlations are italicized. Self-reported response quality items are listed in the order they were rated by all participants. (R) indicates that these items were reversed scored so that higher correlations consistently indicate higher correlation with self-reported response quality. Correlations with spi and the calculation of means and standard deviations are done using log2-transformed values, but the reported means, medians, and standard deviations are in the units of seconds. M = mean, Mdn = median, spi = seconds-per-item, dev = deviation. SD = standard deviation (between persons) and SDi = standard deviation (within individual), respectively. IIDL = Inventory of Individual Differences in the Lexicon.
Results and Discussion
Distributions and Relations Between Response Time and Consistency Indices
As shown in Table 3, participants responded faster to the IIDL items than the Dark Triad items, M spi = 1.97 vs. 2.54; t(287) = −6.96, p < .01, and response time estimates to both were highly correlated (r = .47). Response consistency estimates were comparable in magnitude to levels found in Study 1, with median values of .82 for the IIDL-40 and .84 for Dark Triad. The response consistency scores separately estimated from the IIDL-40 and Dark Triad items were also very highly related (r = .74). We also found that IIDL-40 and Dark Triad response times were highly related to response consistencies estimated from the same inventory (rs = .34 and .49, respectively) and were only slightly lower when obtained from the complementary inventories (rs = .21 and .47).
Finally, the sharp drop-off in response consistency found within surveys completed at rates faster than 1 spi (log2 = 0) in Study 1 was again found for both instruments. As shown in Figure 2, no participants were able to attain response consistencies higher than qi (d) = .43 at speeds faster than .94 spi.
Correlates of Response Time and Response Consistency
Response variability
As in Study 1, an individual’s level of response variability (SDi ) was positively associated with response times from the same measure (rs = .15 and .30 for the IIDL-40 and Dark Triad, respectively) and showed very high associations with response consistency (rs = .57 and .51).
Self-reported response quality
As shown in Table 3, there were regular significant relationships linking response time and consistency estimates with self-reported response quality, however, these were also relatively modest. There were higher relationships between self-reported quality with estimates of response consistency than with response time estimates; indeed, some relationships with response time estimates were in the unexpected direction. 3
Consequences of Excluding Very Fast and Very Inconsistent Respondents
Approximately 11% and 13% of participants were flagged as fast or inconsistent respondents for the IIDL-40 and Dark Triad inventories, respectively, via the criteria used in Study 1 (Table 2). As in Study 1, removing these participants consistently decreased the average interitem correlation, both within the same inventory used for exclusions and across the other inventory as well. The findings here were more consistent in indicating that exclusions for fast or inconsistent respondents served to decrease the size of the FUPC in factor analysis.
We also explored the consequences of excluding individuals who self-reported providing low-quality data, by identifying 38 individuals who provided a score of 3 or lower in the desirable direction of any of the seven self-reported response quality items listed in Table 3. Excluding these individuals resulted in final sample sizes of 230 for the IIDL-40 and 238 for the Dark Triad items and resulted in average interitem correlations of .037 and .216, respectively, and percentage variance for the FUPC of 26.2 and 33.0, respectively. By comparing these two levels without exclusions in Table 3, this suggests exclusions based solely on low self-reported response quality result in changes in data structure comparable in magnitude to excluding fast responders but less than excluding inconsistent responders.
General Discussion
Recommendations for Response Time and Consistency Measures as Data Screens
Response time
We strongly recommend that researchers make the automatic removal of participants who complete survey instruments at rates faster than 1 spi part of their “standard operating procedures” for data processing (Lin & Green, 2016). Response speed information can be collected at no cost to participants and is increasingly easy to add to online surveys. A 1 spi screen in particular offers advantages beyond other screens proposed in the literature. The largest is that this speed cut point is empirically based, with our results demonstrating a sharp drop-off in response consistency for most inventories at approximately 1 spi (Figure 2). Strikingly, for most of the inventories examined, the high levels of response consistency that were routinely observed by participants with average response speeds (e.g., >2 spi) were never observed by participants who responded at speeds much faster than 1 spi. This indicates that it may be nearly impossible for participants to provide meaningful data at such response rates.
Response consistency
We further recommend that researchers consider the use of response consistency estimates in the form of qi (d) profile correlations as data quality screens. We specifically recommend that response consistencies below qi (d) = .25 indicate that the respondent should be removed. This data screen is particularly easy to recommend when the number of repeated items is at least moderate and in the situation where the median level of response consistency is far above 0 (which is typical; Wood & Furr, 2016). When these two conditions are met, it is very unlikely that participants will achieve response consistencies as low as .25 when responding meaningfully. For instance, if an individual’s response consistency when responding meaningfully should be expected to be at least .70—a conservative estimate given medians for all inventories exceeded .80 in the present studies—and the instrument consists of at least 30 items, sampling variation should result in qi (d) values below .35 less than 1% of the time. The high correlations with response speed and with self-reports of response quality strongly indicate its value as an indicator of careless responding.
A particularly useful way to utilize response consistency indices may be to have participants provide repeated ratings of a randomly selected subset of the items they completed earlier in the survey, which is sufficiently large to yield relatively stable response consistency estimates (again, 30 items should suffice). Such a procedure would both require a fairly trivial cost in terms of participant time and would additionally provide estimates of the retest reliability of the items used in research, which may ultimately be more conceptually appropriate reliability estimates than standard statistics such as coefficient α (Cronbach, 1947; Guttman, 1945; McCrae, Kurtz, Yamagata, & Terracciano, 2011; Wood et al., 2017). By selecting the repeated items randomly for each participant, this procedure should also reduce the ability of participants to report quality screens to subsequent participants, as often occurs with more direct data quality items (Chandler et al., 2014; Harms & DeSimone, 2015).
Implications for Online Sources as a Data Collection Resource
Finally, our findings help to illuminate the promise and pitfalls of web-based data collection sites such as MTurk that pay participants to complete surveys. The amount of research that has been conducted on such sites has exploded in the past decade (Bohannon, 2016; Harms & DeSimone, 2015; Zhou & Fishbach, 2016). Our findings indicate that a nontrivial percentage of respondents to surveys on MTurk provide meaningless data, by responding at rates that are unreasonably fast right from the very start of the survey. Estimated rates of “bad” data in the present MTurk samples ranged from about 5% to 25%, paralleling other published estimates (Feitosa, Joseph, & Newman, 2015; Harms & DeSimone, 2015).
Implications for Understanding the Effects of Careless Responding
Finally, our findings indicate that rapid and inconsistent responding appears to have a fairly characteristic effect of increasing the positive correlations between surveyed variables (Table 2 and Online Supplemental Materials). As we detail, the net effect of this dynamic should be to increase the likelihood of Type 1 errors as well as biasing analyses of factor structure (Credé, 2010; Credé & Harms, 2015; Huang et al., 2012). Perhaps more than any other reason, this consideration underscores the importance of identifying and removing careless respondents to reach valid inferences.
Conclusion
The present studies strongly indicate that fast and inconsistent responding often occurs at nonnegligible rates in paid online samples and that the inclusion of data from such respondents will regularly increase the likelihood of observing artifactual associations. Our analyses indicate that these problematic respondents can be identified through the use of response speed and response consistency indices, which identify many of the same cases in a logically satisfying way: If the participant responds extremely quickly, it appears to become almost impossible for their responses to be consistent, indicating the validity of both indices. These data quality checks are easy to implement; and given the problematic role that “dirty data” can play in estimating relationships between variables, we strongly recommend that researchers utilize these screens in conducting basic survey research.
Footnotes
Authors’ Note
Some data from this study are examined in another investigation concerning the utility of repeated assessments of measures to obtain retest reliability estimates for corrections for measurement unreliability (Wood et al., 2017), however, the current analyses represent entirely different analyses on different substantive questions from this data set.
Declaration of Conflicting Interests
The author(s) declared no potential conflicts of interest with respect to the research, authorship, and/or publication of this article.
Funding
The author(s) received no financial support for the research, authorship, and/or publication of this article.
Supplemental Material
Notes
References
Supplementary Material
Please find the following supplemental material available below.
For Open Access articles published under a Creative Commons License, all supplemental material carries the same license as the article it is associated with.
For non-Open Access articles published, all supplemental material carries a non-exclusive license, and permission requests for re-use of supplemental material or any part of supplemental material shall be sent directly to the copyright owner as specified in the copyright notice associated with the article.