




Abstract
Due to a lack of data, the demographic and psychological factors associated with lethal force by police officers have remained insufficiently explored. We develop the first predictive models of lethal force by integrating crowd-sourced and fact-checked lethal force databases with regional demographics and measures of geolocated implicit and explicit racial biases collected from 2,156,053 residents across the United States. Results indicate that only the implicit racial prejudices and stereotypes of White residents, beyond major demographic covariates, are associated with disproportionally more use of lethal force with Blacks relative to regional base rates of Blacks in the population. Thus, the current work provides the first macropsychological statistical models of lethal force, indicating that the context in which police officers work is significantly associated with disproportionate use of lethal force.
Minorities killed by police officers in the United States is an issue that regularly garners national attention. The extent to which it is occurring and the role that racial prejudice might play are regular questions in the discourse following these incidents. However, because the U.S. government does not mandate reporting of lethal force (Byers & Moskop, 2014), it has been difficult to empirically investigate associated factors. More recently, the Guardian news agency developed a database of U.S. individuals killed by police. Integrating traditional reporting with police reports, fact-checked witness statements, monitoring of regional news, and other open-sourced police fatality databases (Swaine, Laughland, & Lartey, 2015), it is currently the most comprehensive and reliable database of individuals killed by police. 1 To examine what factors might be associated with Black and White Americans being disproportionately killed by police relative to their presence in the population, the current research integrated use of lethal force data with demographics and a large database of implicit and explicit biases.
Racial bias can take many forms. Prejudice refers to a valenced evaluation (e.g., good, bad) of a group, and stereotypes refer to mental associations between a group (e.g., Blacks) and attributes (e.g., threat). These distinct forms of bias can be measured relatively directly or indirectly. For example, prejudice can be measured directly through explicit questions (e.g., “How warmly or coldly do you feel toward Black people?”) or indirectly through so-called implicit tasks that infer bias from the speed or accuracy with which a response is made, rather than from the contents of the response itself (Fazio, Jackson, Dunton, & Williams, 1995; Greenwald, McGhee, & Schwartz, 1998). Biases measured explicitly are assumed to reflect relatively deliberate and conscious mental processes, often predicting intentional judgments and behaviors. In contrast, implicit biases have traditionally been conceptualized as reflecting less intentional or controlled processes (Dovidio, Kawakami, & Gaertner, 2002; Gawronski, Peters, Brochu, & Strack, 2008) that can influence judgments and behaviors outside of conscious awareness.
Rather than examine the racial biases of police officers directly as in previous work (Correll et al., 2007; Sim, Correll, & Sadler, 2013; Terrill & Reisig, 2003), we instead examined the context in which officers operate. Specifically, we used regional demographic factors and the racial biases of residents to capture that context and tested the relationships between racial demographics, biases, and lethal force. Context and behavior are closely linked (Asch, 1946; Barden, Maddux, Petty, & Brewer, 2004) because environmental factors (e.g., social norms, institutions) shape decisions made within that environment. Thus, there are several reasons police officers operating in racially biased contexts may be more likely to use lethal force.
How might the biases of many people in a region translate into disproportionate lethal force? Macropsychological factors such as the prevailing attitudes and beliefs within a region might shape the manner in which police encounters unfold. Models of attitude spread hold that individuals can be influenced by the attitudes of others in their communities and that such biases can be “contagious” (Rentfrow, Gosling, & Potter, 2008; Weisbuch & Pauker, 2011). Attitudes and stereotypes can spread through explicit conversations, as well as through nonverbal vectors such as observing facial expressions and body language (Weisbuch, Pauker, & Ambady, 2009). To the extent that police officers are exposed to the biases of their fellow residents in their region, they may adopt those same attitudes themselves. Accordingly, one possibility is that prevailing regional biases might shape police officers’ own attitudes, and their behaviors on the job are a result of these attitudes.
For instance, lab-based research at the individual level has revealed that attitudes and stereotypes can influence perceptual decisions (e.g., whether a person is holding a wallet or a gun), particularly when such decisions must be made rapidly (Kubota & Ito, 2014; Payne, 2001). Common individual-level factors, such as mental stressors or fatigue, exacerbate the influence of attitudes and stereotypes on judgments and behaviors (Ma et al., 2013; Payne, 2006). Thus, it is reasonable that the demographics and/or biases of a region might create a context that influences police officers, as they make challenging, split-second, life-and-death decisions in the line of duty.
Alternatively, the opposite causal direction is equally plausible that disproportionate lethal force might contribute to regional racial biases. Individuals being killed by police frequently receive media attention. If minorities being killed by police are given selective media attention, it may create or strengthen links between racial groups and crime or threat in the minds of residents. Therefore, there are multiple plausible mechanisms by which we might expect a relationship between regional biases and police behavior. Consequently, the analytical focus of the current research lies not on police officers’ individual demographics or personality factors but, instead, on the broad contextual factors present in the environments in which police officers live and work.
In summary, we examined associations between regional bias and use of lethal force. Moreover, there is ample evidence from across the social sciences that both explicit and implicit biases and stereotypes can jointly influence judgments and behaviors (Dovidio & Gaertner, 2000; Gawronski & Creighton, 2013). Accordingly, we investigated both possibilities in the current research: Analysis 1 examined the possible influence of racial prejudice (i.e., positive or negative evaluations of racial groups), and Analysis 2 examined the possible influence of racial stereotypes (i.e., threat-related beliefs about racial groups).
Methods
Analysis 1: Prejudice
The most widely used method of assessing implicit biases is the implicit association test (IAT; Greenwald et al., 1998), a speeded dual-categorization task in which participants must simultaneously respond to social targets (e.g., White, Black) and attributes (e.g., good, bad) by timed computer-key press. The speed and/or accuracy with which participants respond to one set of target-attribute pairings (e.g., White–Good) than another set of pairings (e.g., White-–Bad) is assumed to reflect the strength with which the target is associated with one attribute relative to the other. Project Implicit (implicit.harvard.edu) has been collecting various IATs and measures of explicit bias over the Internet since 2002. By geolocating respondents, we used this data set (Xu, Nosek, & Greenwald, 2014) to compute point estimates of implicit and explicit biases by region. We did so at the level of core-based statistical areas (CBSAs), a geographic area defined by the U.S. Office of Management and Budget of at least 10,000 people and adjacent areas that are socioeconomically tied to a metropolitan center by commuting. Importantly, Project Implicit data are not systematic samples of CBSAs: Although the percentage of Black and White Project Implicit respondents in each CBSA correlates strongly with the racial demographics of each CBSA as reported by the U.S. Census (r = .931, p < .001), Project Implicit data differ from the general population on other demographic factors and may not be representative.
To test whether Blacks were being killed by police officers at a rate disproportionate to their CBSA populations, the percentage of Blacks living in each CBSA was subtracted from the percentage of Blacks killed in each CBSA relative to the total amount of individuals killed by police officers. Individuals were not killed by police in every CBSA, and CBSAs could only be included in analyses if at least one individual in the region (Black or White) had been killed by police. Population data were obtained from the 2010 census (U.S. Census Bureau, 2010) and lethal force data from the Guardian (Swaine et al., 2015). A higher score on this variable reflected greater usage of lethal force with Blacks than would be expected based on the CBSA population. An identical score was calculated for White/non-Hispanic individuals to test whether Whites were being disproportionally killed by police.
Racial Prejudice IAT
To create CBSA-level implicit and explicit prejudice scores of respondents to Project Implicit (Xu et al., 2014), we used only those that were U.S.-based, had CBSA-level geographic information included, and implicit and explicit data. We focused on Black and White participants only, as sufficient data were not available for reliable estimates from other groups. These criteria left 1,860,818 (out of a total of 4,023,404) respondents collected between 2003 and 2013 from which to calculate point estimates of CBSA-level implicit and explicit biases. We created variables reflecting the biases of Black and White respondents separately to assess the unique contribution of each group to the overall context and outcomes. We created CBSA-level implicit prejudice scores by averaging the IAT D scores of Black and White respondents (separately) in each CBSA. CBSA-level explicit prejudice scores come from responses to two feeling thermometer items, separately asking how warm or cold participants felt toward both Blacks and Whites (0 = very cold, 10 = very warm). Responses to the Black feeling thermometer were subtracted from responses to the White feeling thermometer for both Black and White respondents and averaged for each CBSA. Consequently, positive scores on the implicit and explicit prejudice measures represent positive attitudes toward Whites relative to Blacks.
Demographics
We also included additional CBSA-level demographic variables in the models. Socioeconomic status for Blacks and Whites in each CBSA was represented by 5-year estimates of median household income calculated with data reported in the 2011–2013 American Community Survey (U.S. Census Bureau, 2010). Two education variables representing the percentage of Blacks and Whites of the CBSA population who received a high-school or equivalent degree or a BA or equivalent degree were calculated using 3-year estimates from data reported in the 2011–2013 American Community Survey (U.S. Census Bureau, 2010). The residential segregation of each CBSA was represented by an isolation index calculated with 2010 census data (Glaeser & Vigdor, 2012), with higher scores representing greater residential segregation of Blacks from all other racial groups in that CBSA. Population density is expressed as the average number of people per square mile, as assessed by 2010 census data (U.S. Census Bureau, 2010). Employment rate was calculated using 3-year estimates from data reported in the 2011–2013 American Community Survey (U.S. Census Bureau, 2010). Total lethal force (regardless of victim race) was included from the Guardian database (Swaine et al., 2015). Violent crime rate represents the number of crimes in this category per 100,000 inhabitants. Rates for 2010–2013 were obtained from the Federal Bureau of Investigations and averaged (Federal Bureau of Investigation, 2015).
When incorporating this large number of covariates from different databases, many CBSAs had missing data on one or more covariates. To compensate, all analyses were repeated using multiple imputation, the best currently available missing data approach (Enders, 2010). Conclusions based on these analyses were identical (Supplemental Table S1). In addition, identical analyses were completed using disproportionate lethal force calculated both as a risk ratio and as an odds ratio as outcome measures. Conclusions based on these analyses were identical (Supplemental Table S2).
Results
From when the Guardian began aggregating the lethal force database in January 1, 2015, to September 30, 2015, a total of 875 (Mage = 37.3 years, SD = 13.3, 35 female), individuals had been confirmed as killed by police officers in the United States. Across all 196 CBSAs in which lethal force occurred, Black people represented 22.76% of all deaths, but constituted only 11.76% of those CBSA populations, indicating that Blacks are killed by police at a rate roughly double their presence in the population, t(195) = 4.46, p < .001, 95% CI [6.14, 15.89] (Figure 1A). In contrast, the percentage of White deaths (77.24% of all lethal force) was consistent with the presence of Whites in those populations (78.70% of CBSA populations), and the disproportionate lethal force of Whites did not significantly differ from zero, t(195) = −.57, p = .573, 95% CI [−0.07, 0.04]. This result indicates that Blacks, but not Whites, are killed by police at rates disproportionate to their presence in the U.S. population.
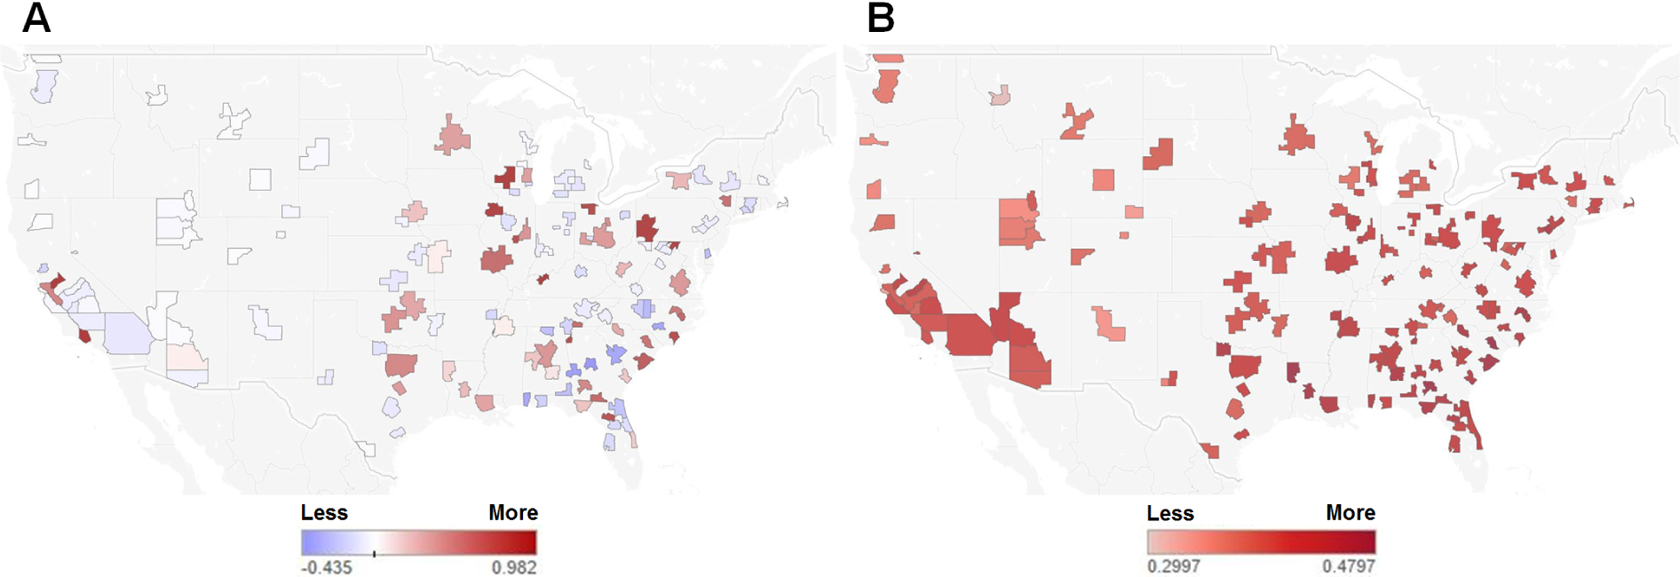
Disproportionate lethal force (A) and implicit racial prejudice of Whites (B) by core-based statistical area (CBSA). Tick marks on scale represent zero points in which no disproportion is present. CBSAs are included in analyses if at least one individual had been killed by police.
Because Blacks are being killed at a rate disproportionate to their population and Whites are not, we frame the subsequent models as predicting disproportionate use of lethal force with Blacks (but note these variables are highly correlated). We tested statistical models of racial biases to explain variance in disproportionate lethal force. Because the number of respondents in each CBSA varied significantly (range = 1–23,753 respondents), we were concerned that a low number of respondents in a CBSA would lead to unstable estimates of CBSAs’ mean bias. To balance this concern with maximizing the number of CBSAs included in the analysis, we included a CBSA only if at least 150 residents (on average, .0005% of a CBSA population) completed an IAT, resulting in 135 CBSAs included in the analysis. However, results for Analysis 1 are identical when using no such threshold and including all CBSAs. The number of respondents in each CBSA used in each analysis is reported in Supplemental Table S3.
We regressed disproportionate lethal force on the implicit and explicit prejudices of White and Black residents (though the number of Black respondents in each CBSA was frequently below our threshold of 150 set for White respondents) in each CBSA in a single linear regression model. Covariates in this model included Black and White income, education level, residential segregation, violent crime, unemployment, population density, and total lethal force (Table 1).
Full Model of Disproportionate Lethal Force From the Racial Prejudice Implicit Association Test.

Note. HS = high school. BA = bachelor of arts. R2 = .14.
Only the implicit prejudice of Whites (Figure 1B) was associated with disproportionate lethal force of Blacks, β = .354, p = .031, 95% CI of B [0.374, 7.885]. 2 As the implicit prejudice of Whites in a CBSA increased, so too did disproportionate use of lethal force with Blacks (Figure 2). Overall, this model explained 14% of the variance in disproportionate lethal force. Post hoc estimate of the achieved power with White implicit bias was .67.

The correlation between the core-based statistical area (CBSA)-level implicit racial prejudice and disproportionate use of lethal force with Blacks. Circle size represents the number of respondents in each CBSA.
There were many CBSAs in which no Black individuals had been killed by police which contributed to a nonnormal distribution of disproportionate lethal force with Blacks. Accordingly, all analyses for this and the subsequent analysis were additionally tested by examining 95% confidence intervals derived from 5,000 bias-corrected bootstraps, a technique that does not require normally distributed data (Efron & Tibshirani, 1993). All results using this technique were identical (i.e., in the same direction and significant) to those reported throughout. Additionally, all results using multiple imputation and calculating outcomes as risk and odds ratios were identical (Supplemental Tables S1 and S2). Finally, we note this model is inflated with a large number of covariates and not parsimonious. We have adopted this approach to develop initial predictive models of lethal force but also used ridge regression and forward and backward stepwise regression techniques to converge on a parsimonious model (Cohen, Cohen, West, & Aiken, 2013). Based on the results of these follow-up analyses, we present parsimonious models in the supplemental materials (Supplemental Table S3). Critical to our conclusions, the implicit racial biases of Whites remain the primary predictor in the most parsimonious model.
Analysis 2: Stereotypes
Racial bias can take many forms. In Analysis 1, we operationalized racial bias in terms of prejudice, that is, as an association between a group (e.g., White) and an evaluation (e.g., positive). Another form of racial bias is stereotypes, that is, as an association between a group (e.g., Black) and an attribute (e.g., threatening) (Dovidio, Hewstone, Glick, & Esses, 2010). To test whether specific stereotypes might better predict disproportionate lethal force than White implicit prejudice, we utilized a different data set from Project Implicit examining racial threat stereotypes. Individuals responded to pictures of Black and White people paired with weapons and harmless objects. Thus, responses on the Weapons Stereotypes IAT indicate the strength with which weapons are stereotypically associated with Blacks relative to Whites. Though this data set is smaller than the Racial Prejudice IAT data set used in Analysis 1, we used the same respondent inclusion criteria in Analysis 2, which gave us 295,235 (out of a total of 631,276) participants from which to calculate point estimates of CBSA-level associations. We used the same threshold used in Analysis 1 of 150 respondents per CBSA for inclusion, which left 81 CBSAs for analysis. 3
The smaller size of this data set necessarily meant that fewer CBSAs were included in this analysis. However, all the CBSAs that met the inclusion threshold of 150 respondents for the Racial Prejudice data set reported in Analysis 1 also met this criterion for the Racial Stereotype data set. Consequently, we were able to fit a model that included both prejudice and stereotype estimates for each CBSA, which allowed us to examine which better explained disproportionate lethal force. Thus, Analysis 2 simultaneously compared the relationships among prejudice, stereotypes, and lethal force. We entered the average Weapons Stereotypes IAT score of White residents in each CBSA into the full model used in Analysis 1 including all covariates (Table 2).
Full Model of Disproportionate Lethal Force From the Weapons Stereotype Implicit Association Test.
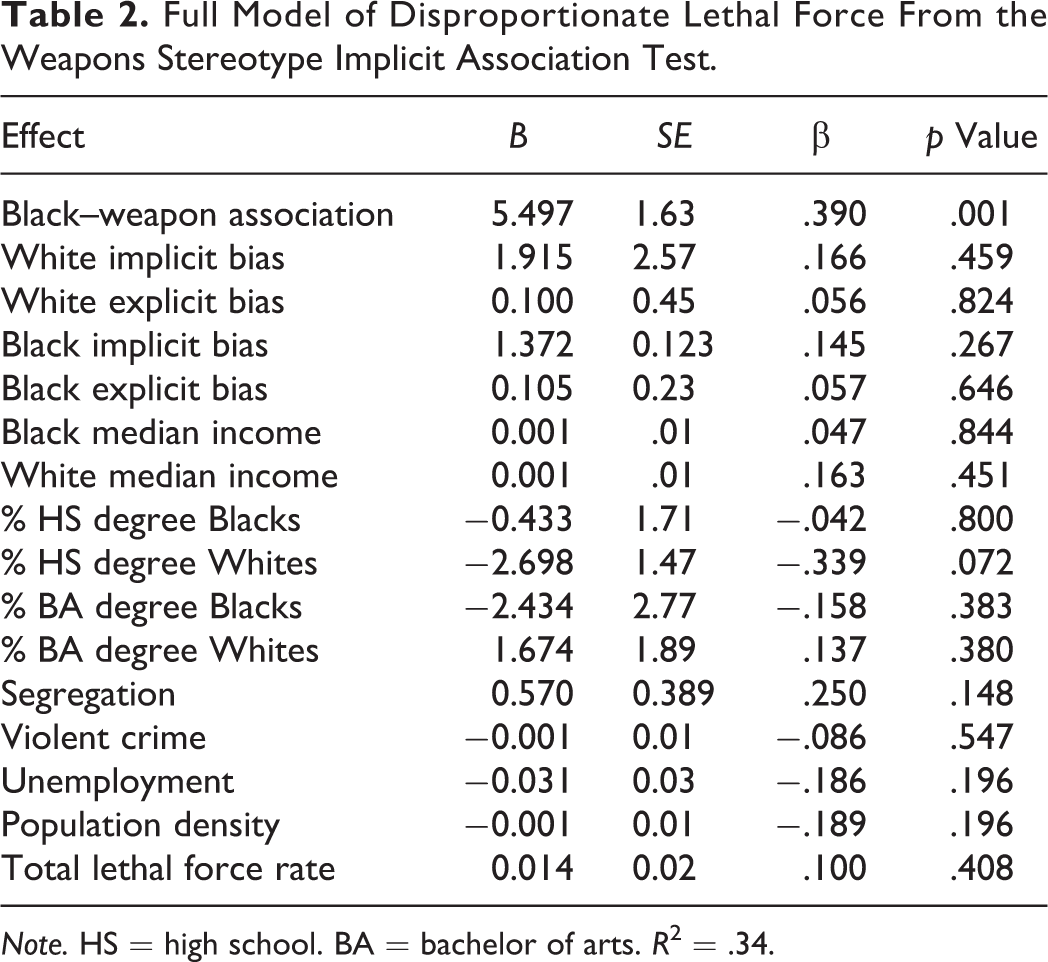
Note. HS = high school. BA = bachelor of arts. R2 = .34.
In this model, implicit threat stereotypes better predicted disproportionate lethal force, β = .390, p = .001, 95% CI of B [2.241, 8.752] 4 (Figure 3), than the implicit racial prejudice of Whites, β = −.166, p = .459, 95% CI of B [−3.220, 7.050]. Moreover, this model explained a substantial 34% of the variance in disproportionate lethal force in these CBSAs (as compared to 14% in Analysis 1). Post hoc estimate of the achieved power with Black–weapon association was .96.
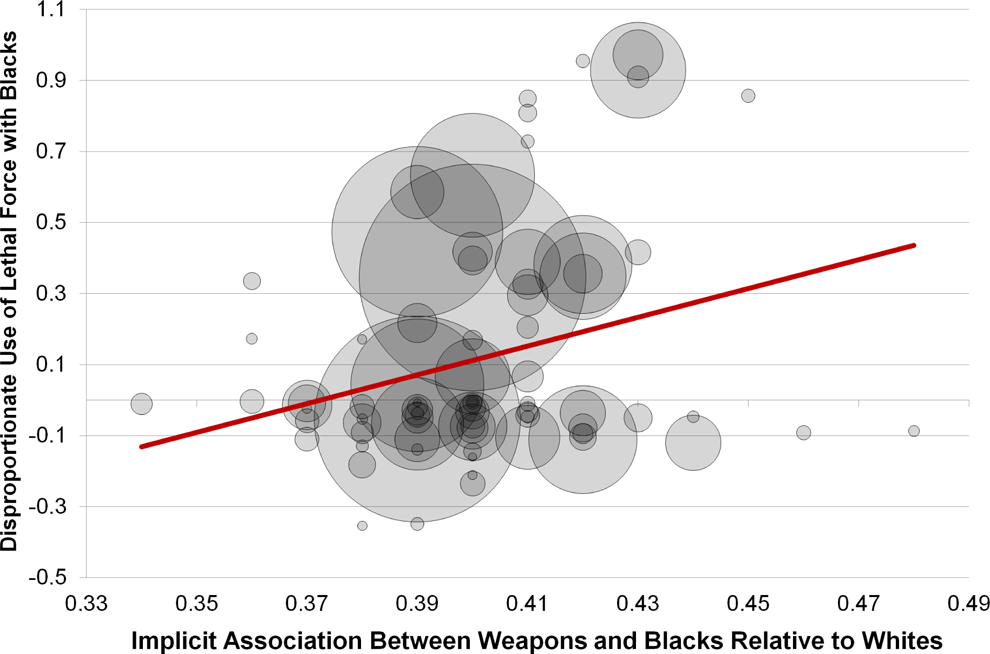
The correlation between the core-based statistical area (CBSA)-level implicit weapon stereotypes and disproportionate use of lethal force with Blacks. Circle size represents the number of respondents in each core-based statistical area.
Discussion
We find that the implicit racial biases of White residents predict disproportionate regional use of lethal force with Blacks by police. This association is robust, reliably emerging across two conceptually distinct measures of racial bias, multiple imputations, three different transformations of the outcome measure, traditional and bootstrapped distributions, and above and beyond 14 sociodemographic covariates. Though the implicit prejudice of Whites is sufficient to significantly predict disproportionate lethal force (Analysis 1), the strongest predictor of lethal force was the regional implicit stereotypical association between Blacks and weapons (Analysis 2). These results also suggest that disproportionate lethal force is not as strongly related to sociodemographic characteristics of a region as might be expected. Rather, in the present analyses, the macropsychological characteristics of residents, operationalized at the CBSA level, are uniquely associated with meaningful and important behavioral outcomes. Importantly, CBSA-level effects may be quite different than individual-level effects (Selvin, 1958). Hence, the research cannot describe effects associated with racially biased individuals, and the correct interpretation of these results is that racially biased contexts are related to disproportionate lethal force.
That demographic covariates were consistently not associated with patterns of disproportionate lethal force in any analysis is as compelling as finding associations with bias. Demographics are associated with a wide variety of important behaviors and outcomes, and ostensibly might be expected to be significant predictors in the analyses reported here. It is possible that the influence of demographic factors may be obscured at the CBSA-level resolution of the present research. CBSAs are large geographic units capturing metropolitan areas, and the multiple communities within a CBSA may be diverse, varying in important socioeconomic factors such as wealth or ethnicity. Because these factors were averaged across CBSAs, one possibility is that this process may have masked the influence of these factors on lethal force. Because we cannot draw inferences from null results, future research should continue to consider these factors. But we can conclude that in the CBSAs included here, racial prejudices and particularly Black–weapon stereotypical associations are a stronger predictor of lethal force than these demographic factors (see Supplemental Materials for parsimonious models).
That implicit bias was the sole predictor raises some interesting methodological and theoretical questions. Recent debate has challenged the reliability and predictive validity of the IAT (Blanton, Jaccard, Strauts, Mitchell, & Tetlock, 2015; Greenwald, Poehlman, Uhlmann, & Banaji, 2009; Lai, Hoffman, & Nosek, 2013; Oswald, Mitchell, Blanton, Jaccard, & Tetlock, 2015). Much of this debate has focused on the link between individual-level IAT bias and behavior. In contrast, the unit of analysis in the current research is geographic region, rather than individuals, in which implicit and explicit bias scores are the aggregate of many individuals. Whether similar psychometric and validity criticisms apply to implicit bias aggregated at a regional level remains an open question. Nevertheless, the relationship between implicit bias and lethal force demonstrated in the current work makes an important contribution to this conversation.
As seen in Figures 2 and 3, multiple CBSAs do not have disproportionate lethal force, in that no Blacks were killed by police in these areas which, in turn, creates a nonnormal distribution. Though statistical approaches were used to ensure accurate standard errors for all of our tests, this distribution suggests that two distinct processes may be driving these data. In other words, CBSAs with zero disproportionate deaths may be qualitatively different from those with disproportionate deaths. Future research might incorporate zero-inflated Poisson models to address this distinct question, facilitating an understanding of differences between areas in which individuals are and are not killed by police.
Limitations
The present research has several limitations due to the data and its sources. First, the approach is correlational in nature, which limits conclusions. Establishing the causes of disproportionate use of lethal force with Blacks is important, but establishing causality requires several steps. One step is demonstrating an association between two variables, and another step is establishing clear temporal precedence. Reliable data on lethal force do not exist prior to 2015 so we are limited in our ability to establish temporal precedence. Consequently, we can only conclude that an association exists between racial biases and lethal force, and future research can build upon this finding, providing more evidence of causal relationships.
Second, though we utilized the most comprehensive database of U.S. lethal force currently available, the data rely partly on crowd-sourcing. Lower population areas have a reduced media presence, so deaths in these areas may be less likely to be reported. Thus, a systematic bias toward high-population areas may restrict the conclusions of the present research to these areas. We note, however, that most of the U.S. population resides in the areas covered, which means that our results may be limited to areas where the majority of U.S. citizens reside (Figure 1).
Further, these analyses examine data collected through the Project Implicit website. Though our sample was representative of CBSA-level racial demographics, it is unlikely to be a representative sample of residents on all other demographic factors. That said, responses from this sample are correlated with serious police outcomes. Moreover, previous research has used this same data source (i.e., Project Implicit) to predict other large-scale outcomes associated with the racial biases in this sample (Leitner, Hehman, Ayduk, & Mendoza-Denton, 2016a, 2016b). Thus, rather than considering the representativeness of Project Implicit data, we believe it more productive to consider why the biases reflected by their visitors are related to lethal force above all other predictors. To be sure, Project Implicit respondents differ from the general population in at least two ways: They have access to the Internet and have visited a website to learn more about bias. Having Internet access may be a function of wealth or influence. Thus, one explanation for the relationship between Project Implicit responses and police behaviors is that police selectively act in a manner consistent with the attitudes of the wealthy and influential residents of the region. Conversely, Internet access and/or motivation to learn about one’s biases may be characteristics of people who pay attention to police behavior in their area, which informs their racial biases. These and other links might explain why Project Implicit respondents’ bias is related to the behavior of police in their region. Nevertheless, future research should examine whether these effects persist when bias is measured with representative sampling methodology.
In the current research, we operationalize our baseline against which to compare lethal force with Blacks as the population of Blacks in the United States. Other possible baselines have been used by other research, including general crime rates, violent crime rates, police encounters, arrest rates, conviction rates, or incarceration rates. However, as discussed more fully elsewhere (Bayley & Mendelsohn, 1969; Smith, 1986; Terrill & Reisig, 2003), these rates all originate within the criminal justice system and are therefore unreliable due to biases that stem from factors such as the disproportionate policing, behaviors, reporting, and enforcement of lower socioeconomic areas that typically have greater numbers of racial minorities. For example, police may patrol an area with a greater proportion of minorities more regularly, such that more encounters and arrests in this area are likely than in areas with fewer minorities, even controlling for crime rates. Compounding the issue, the same infractions can result in an arrest in one neighborhood but not another (Terrill & Reisig, 2003). Therefore, we utilized general population statistics in the current analyses to avoid the circularity inherent in using these other potential baselines.
Another limitation is that our lethal force data is from 2015, whereas our racial bias data were collected between 2003 and 2013. Other work has reported the stability of U.S. racial biases over the past decade with this very data set (Schmidt & Nosek, 2010). Our supplementary analyses are consistent with this conclusion: White implicit bias decreased very slightly by year, B = −0.000355. Thus, these estimates of bias are extremely stable and suggest that implicit bias scores collected in 2015 would not vary meaningfully from the data reported here in their ability to predict disproportionate lethal force. Additionally, we focused on Black/White relations only, because (a) the most data were available for these groups, (b) Whites are the largest group in the United States, and (c) Blacks are the minority group most frequently killed by police. However, whether these results hold for other minority populations is an open question.
Finally, in the current work, we report relationships between lethal force and implicit measures of both prejudice and stereotyping. A marginal relationship is additionally found between explicitly reported prejudice, as measured by the difference between a feeling thermometer for Blacks and Whites, and lethal force in Analysis 1 (though this relationship was not found in Analysis 2). We used this measure of explicit bias because it was available for the largest number of participants, but there are limitations of validity and reliability of limited-item measures (Flake, Pek, & Hehman, 2017; Nunnally, 1978). Thus, examining the relationships between explicit prejudice and lethal force with comprehensive, multi-item scales would be valuable in future work.
Conclusions
Social scientists have long recognized that context is strongly associated with behavior (Asch, 1946; Barden et al., 2004; Terrill & Reisig, 2003), and the present research provides evidence that prevailing racial attitudes and beliefs in a region are related to life-or-death decisions that police officers make in the line of duty. To our knowledge, the present work is the first to develop models of disproportionate lethal force on such a scale, and the first to implicate psychological processes (beyond socio-demographic factors) as central to this phenomenon. Though examined at the CBSA level, our results converge with research at the individual level in finding that biased racial associations may influence life-or-death decisions (Correll et al., 2007; Correll, Crawford, & Sadler, 2015; Correll, Park, Judd, & Wittenbrink, 2002; Sim et al., 2013). Again, however, it is critical to avoid the ecological fallacy (Selvin, 1958) when interpreting these results: The region-level effect may be quite different than the individual-level effect. Given the correlational nature of the analyses, the causal relationship between CBSA-level biases and lethal force cannot be determined. One interpretation of these results is that Whites’ biases create a racially charged atmosphere that contributes to police killing Blacks disproportionately. Alternatively, Blacks in some regions may be more violent when interacting with police, resulting in more justifiable lethal force, in turn influencing the prejudice and stereotypes about Blacks held by people in the region. Importantly, because of the correlational nature of the analyses, we cannot rule out either interpretation. Moreover, like all correlational work it is possible that a third, unobserved variable better explains the relationship between lethal force and regional biases. Thus, this research represents an important first step in demonstrating an association between the regional racial biases of Whites and the disproportionate use of lethal force with Blacks. With increased data and improved reporting, understanding the challenging contexts in which police officers operate and decide to use lethal force will be possible in future research.
Supplemental Material
SPPS711229_suppl_mat - Disproportionate Use of Lethal Force in Policing Is Associated With Regional Racial Biases of Residents
SPPS711229_suppl_mat for Disproportionate Use of Lethal Force in Policing Is Associated With Regional Racial Biases of Residents by Eric Hehman, Jessica K. Flake, and Jimmy Calanchini in Social Psychological and Personality Science
Footnotes
Authors’ Note
All authors designed the study. E.H. and J.C. compiled the data. E.H. and J.K.F. analyzed the data. All authors contributed to writing the manuscript.
Acknowledgments
We thank Katherine Greenaway, Jordan Leitner, Michael Slepian, and Jeff Sherman for providing feedback on earlier versions of this manuscript.
Declaration of Conflicting Interests
The author(s) declared no potential conflicts of interest with respect to the research, authorship, and/or publication of this article.
Funding
The author(s) disclosed receipt of the following financial support for the research, authorship, and/or publication of this article: This research was partially supported by a SSHRC Institutional Grant and SSHRC Insight Development Grant (430-2016-00094) to EH, and the Alexander von Humbolt Post-Doctoral Fellowship to JC.
Supplemental Material
The supplemental material is available in the online version of the article.
Notes
References
Supplementary Material
Please find the following supplemental material available below.
For Open Access articles published under a Creative Commons License, all supplemental material carries the same license as the article it is associated with.
For non-Open Access articles published, all supplemental material carries a non-exclusive license, and permission requests for re-use of supplemental material or any part of supplemental material shall be sent directly to the copyright owner as specified in the copyright notice associated with the article.
