



Abstract
Most people report that they are superior to the average person on various moral traits. The psychological causes and social consequences of this phenomenon have received considerable empirical attention. The behavioral correlates of self-perceived moral superiority (SPMS), however, remain unknown. We present the results of two preregistered studies (Study 1, N = 827; Study 2, N = 825), in which we indirectly assessed participants’ SPMS and used two incentivized economic games to measure their engagement in moral behavior. Across studies, SPMS was unrelated to trust in others and to trustworthiness, as measured by the trust game, and unrelated to fairness, as measured by the dictator game. This pattern of findings was robust to a range of analyses, and, in both studies, Bayesian analyses indicated moderate support for the null over the alternative hypotheses. We interpret and discuss these findings and highlight interesting avenues for future research on this topic.
Self-perceptions of moral superiority appear robust and relatively widespread. In numerous studies, majorities of people rate themselves as fairer, more trustworthy, and more honest—more moral—than the average person (Epley & Dunning, 2000; Fetchenhauer & Dunning, 2006; Klein & Epley, 2016, 2017; Tappin & McKay, 2017; Van Lange & Sedikides, 1998). Under the broader phenomenon of “self-enhancement” (Alicke & Sedikides, 2011), past work has investigated (i) psychological explanations for (Sedikides, Meek, Alicke, & Taylor, 2014; Tappin & McKay, 2017; Van Lange & Sedikides, 1998) and (ii) interpersonal consequences of (Barranti, Carlson, & Furr, 2016; Heck & Krueger, 2016) self-perceived moral superiority (SPMS). There is a conspicuous lack of evidence, however, for how these perceptions relate to engagement in behaviors commonly considered moral—such as freely helping others or reciprocating trust. In the present article, we report an initial investigation of this relationship.
SPMS and Engagement in Moral Behavior
There exists much debate over whether the prevalence of self-superiority phenomena is best explained by motivational or nonmotivational processes (Brown, 2012; Chambers & Windschitl, 2004; Taylor & Brown, 1988). This offers a useful framework for speculating on how SPMS may relate to engagement in moral behavior.
Consider people who perceive themselves to be strongly morally superior to the average person. As a function of their strong sense of righteousness relative to other people, these individuals may be motivated to behave in (moral) ways to protect this positive social comparison. According to various reviews, self-protection is a fundamental human motivation (Sedikides, Gaertner, & Cai, 2015) and social comparison, a common process by which people derive positive self-evaluation (Sedikides & Strube, 1997; Wills, 1981). Moral traits, moreover, are held in high regard (Van Lange & Sedikides, 1998), and morality appears to be central to notions of identity (Strohminger & Nichols, 2014, 2015). Individuals who possess a weaker sense of righteousness over the average person, then, may accordingly possess a relatively weaker motivation to protect the (less positive) social comparison. This implies that SPMS may be positively associated with engagement in moral behavior.
Another motivational process that might predict a positive association is sensitivity to the charge of hypocrisy. Hypocrites are loathed—more so than people who are honest about their moral limitations (Jordan, Sommers, Bloom, & Rand, 2017)—and especially so when the hypocrite considers themselves to be superior to others (Alicke, Gordon, & Rose, 2013). Heck and Krueger (2016) recently reported evidence that agents who made inaccurate claims of moral self-superiority received the strongest moral condemnation from observers; stronger, even, than agents who accurately reported being less moral than the average person. Put another way, observers punished people most when their self-reported moral superiority was shown to be false by their behavior. These findings imply added motivation for such people to behave morally, so to avoid harsh social censure. Consistent with this suggestion is evidence that individuals behave more prosocially after criticizing another person (Simpson, Harrell, & Willer, 2013).
Some nonmotivational processes, on the other hand, may lead us to expect a negative association between SPMS and engagement in moral behavior. Fetchenhauer and Dunning (2009, 2010) provide evidence that individuals underestimate the moral goodness (specifically, trustworthiness) of other people due to an informational asymmetry in the social environment. If Person A decides to trust Person B, this occasionally results in surprising and costly betrayal by Person B. In contrast, when Person A decides not to trust Person B, this necessarily precludes Person A learning that Person B was, in fact, trustworthy. The implication is that individuals learn asymmetrically about the trustworthiness of other people, an asymmetry that may underlie cynicism about the moral goodness of others more generally (Fetchenhauer & Dunning, 2010; Miller, 1999).
Such a mechanism could help explain the prevalence of SPMS. Specifically, because the lion’s share of the variance in SPMS likely derives from variance in how people perceive the moral goodness of others rather than themselves. There is relatively limited variance in the latter—people seem largely in agreement that they themselves are morally virtuous (for a brief review, see Tappin & McKay, 2017). Taking this in conjunction with evidence that—in interdependent contexts—individuals’ moral behavior is conditional on whether they think others will behave in kind (Krueger & Acevedo, 2007) implies that greater cynicism—and, thus, greater SPMS—may be associated with less moral behavior.
Overview
Given the uncertainty over how SPMS relates to engagement in moral behavior, we set out to investigate this relationship. Specifically, across two studies, we used canonical economic games as measures of moral behavior and indirectly assessed how moral individuals perceived themselves to be relative to the average person.
Method
The preregistered protocols, analysis scripts, and data for both studies are available on the Open Science Framework: https://osf.io/p42mp/. Because of their similarity, we present the methods and results of these studies together.
Engagement in Moral Behavior
To measure engagement in moral behavior, we used two incentivized, one-shot, anonymous economic games (with no deception), the trust game (TG, Study 1) and dictator game (DG, Study 2). These games are typically taken as providing measures of trust in others and trustworthiness, and fairness, 1 respectively (see below for descriptions of the games).
While a general prosocial preference is likely to underpin behavior in both the TG and DG (Peysakhovich, Nowak, & Rand, 2014), past work suggests that trusting behavior in the TG is distinct from giving in the DG (Brülhart & Usunier, 2012), and, indeed, a recent large investigation reported that the shared variance between trusting behavior in the TG, and behavior in the DG, was relatively modest at 12% (Peysakhovich et al., 2014). The relationship between DG behavior and trustworthy behavior in the TG was estimated to be somewhat higher—at 25% shared variance with behavior in the DG. In both cases, however, there was evidence of unique variance between the games. This suggests that inclusion of both the TG and DG provided us with three somewhat overlapping but distinct measures of behavior.
We used economic games to measure engagement in moral behavior because numerous studies indicate that people subjectively imbue choices in these games with moral weight. For example, recent evidence suggests that prosocial behavior in economic games is driven by an explicit preference for behaving morally (Capraro & Rand, 2017), and behaving prosocially in such games is consistently and strongly judged to be morally superior to behaving self-interestedly (Krueger & Acevedo, 2007; Krueger & DiDonato, 2010; Krueger, Massey, & DiDonato, 2008). The inclusion of the TG and DG thus provided a straightforward decision environment with a recognizable “moral” behavior.
TG
In our TG, participants are anonymously paired and assigned the role of either “trustor” or “trustee.” Both participants are given US$0.20 as a starting endowment, and the trustor has the option to transfer any amount of their endowment to the trustee (from US$0.00 to US$0.20 in increments of US$0.01). Any amount they transfer is tripled on its way to the trustee, and the trustee is then able to decide how much, if any, of this tripled amount they would like to transfer back to the trustor (from 0% to 100%). Since the trustor takes a risk by sending money to the trustee, their decision is usually taken as a measure of trust. The trustee, on the other hand, has the option to reciprocate the trust placed in them by the trustor, by sending some amount of money back to the trustor. The trustee decision is thus usually taken as measure of trustworthiness (e.g., Berg, Dickhaut, & McCabe, 1995).
DG
In our DG, participants are anonymously paired and assigned the role of either “dictator” or “receiver.” The dictator is given US$0.30 as a starting endowment, whereas the receiver starts with nothing. The dictator then has the option to transfer any amount of their endowment to the receiver (from US$0.00 to US$0.30 in increments of US$0.01). Since the dictator’s decision is unilateral, with no possibility of reciprocation (or punishment) from the receiver, they have no financial incentive to share the money. As such, the dictator’s decision to share money is usually taken as a measure of fairness (more technically, inequity aversion, see Fehr & Schmidt, 1999).
SPMS
To measure SPMS, 2 we used a regression-based index of trait self-superiority developed and described in detail elsewhere (Heck & Krueger, 2015; Tappin & McKay, 2017). In brief, participants are asked to judge the extent to which 10 moral traits describe (i) themselves and (ii) the average person. They also rate (iii) the social desirability of the traits. The moral traits are presented in Table 1. Conventional measures of self-superiority typically compare how positive self-judgments are with respect to judgments of the average person. However, this overestimates the magnitude and frequency of people who harbor perceptions of self-superiority. The current measure accounts for this overestimation by estimating—and allowing the researcher to remove—a component of self-superiority that may be deemed “defensible” because of the uncertainty people face when making judgments of the average person. Below we describe the computational steps of the measure only (for more detail, see Heck & Krueger, 2015; Tappin & McKay, 2017).
Positive and Negative Moral Traits Used in Studies 1 and 2.
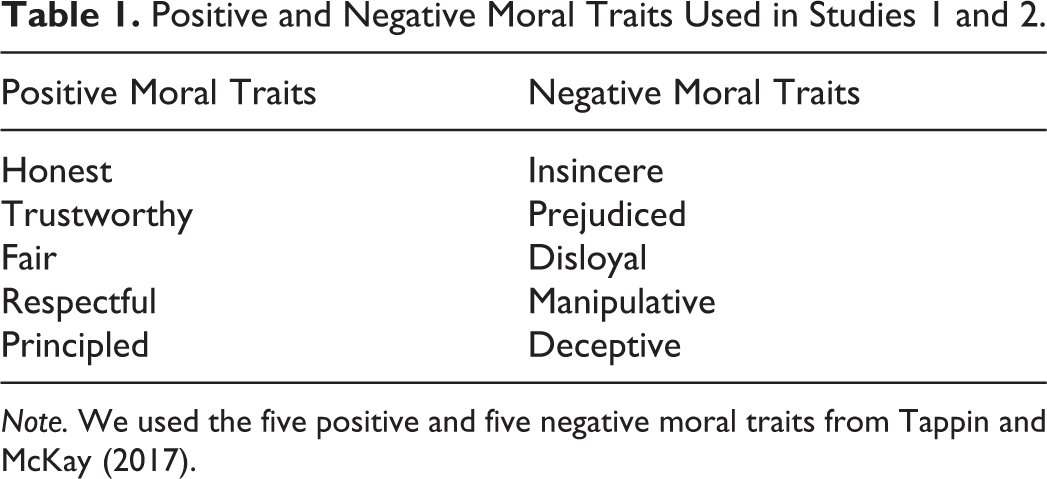
Note. We used the five positive and five negative moral traits from Tappin and McKay (2017).
Step 1
We first estimate how similar each participant’s moral self-judgments are to those of the average participant in the sample. To do so, we calculate the average self-judgment for each moral trait over all participants and then regress these averages on the moral self-judgments made by each individual participant. This provides a moral “coefficient of similarity” (unstandardized slope, b) and intercept for each participant. Higher coefficient values indicate that the participant is more like the average participant in the sample. We then compute the mean moral coefficient of similarity and intercept across participants.
Step 2
Next, we generate inferred moral self-judgments (I) by weighting participants empirically observed moral judgments of the average person (O) by the mean coefficient of similarity and intercept, using the formula:

Inferred self-judgments represent self-judgments an ideal judge would have made. That is, a judge who perceives how morally similar people are and uses this information to weight their judgment of the average person to make a more accurate self-judgment. (The basic rationale is this: The more similar people are—defined here by the mean coefficient of similarity—the less participants’ self-judgments are expected to deviate from their judgments of the average person; see Heck & Krueger, 2015; Tappin & McKay, 2017.) At this stage, then, each participant has four sets of judgments for the 10 moral traits. Their empirically observed self-judgments (S), judgments of the average person (O), and social desirability judgments (D), and the new inferred self-judgments (I) computed according to the preceding method.
Step 3
In the final step, we regress S, O, and I on D judgments for each participant. This produces three unstandardized slopes per participant. These slopes express how well moral trait desirability predicts their (i) moral self-judgments (b SD), (ii) judgments of the average person (b OD), and (iii) inferred self-judgments (b ID). In other words, b SD describes the positivity of participants’ moral self-perception, b OD describes the positivity of participants’ perception of the average person’s morality, and b ID describes the positivity of the participants’ moral self-perception presupposing they were an ideal judge.
The index of SPMS is computed as the difference between b SD and b ID (specifically, b SD − b ID). This index represents SPMS but is more conservative than conventional measures because it partitions out a defensible component of self-superiority (which is defined by the difference between b ID and b OD). 3
Samples
We sought to recruit 824 participants in each study, providing approximately N = 412 in each role. Participants were recruited via Amazon’s Mechanical Turk (Amir & Rand, 2012; Arechar, Gaechter, & Molleman, 2017; Chandler & Shapiro, 2016; Rand, 2012). Sample sizes were determined via power analyses: Our smallest effect size of interest was r = .15, which we required N = 343 to achieve 80% power (α = .05) to detect in each of our three primary linear regression analyses (Faul, Erdfelder, Buchner, & Lang, 2009). We deliberately oversampled by approximately 20% to guard against power loss due to planned data exclusions. Sample sizes after data collection were: Study 1 N = 827 (50.18% female; M age = 38.35, SD age = 12.97; trustor n = 413, trustee n = 414), Study 2 N = 825 (55.27% female; M age = 37.50, SD age = 12.62; dictator n = 413, receiver n = 412).
Procedure
The procedure in both studies was substantively identical, and we recruited separate samples in each case (Study 1 participants were identified via their unique Mechanical Turk ID and blocked from participating in Study 2). All participants provided informed consent, before being assigned their role in their respective economic game (Study 1: TG, trustor or trustee, Study 2: DG, dictator or receiver, role assignments were counterbalanced). All participants then completed (i) the trait judgment task and (ii) the economic game (counterbalanced), except for those assigned the role of receiver in the DG. These participants always completed the DG first and then completed an unrelated task (receivers are entirely passive, and so collecting their trait judgments was unnecessary).
In the trait judgment task, participants were presented with the list of 10 moral traits alongside 20 additional, nonmoral filler traits (inclusion of the nonmoral traits allowed us to replicate the primary results reported by Tappin & McKay, 2017; see Supplemental Material, Section 6). Participants were asked to judge (i) the extent to which each trait described themselves, (ii) the extent to which each trait described the average person, and (iii) the social desirability of each trait. Participants rated all 30 traits according to (i), (ii), or (iii), before moving onto the next set of ratings, and the order of these three sets of judgments was counterbalanced across participants. The presentation order of the traits themselves was randomized in each rating set and for each participant. Rating judgments for the self and the average person were provided on a 7-point scale, ranging from 1 (not at all) to 7 (very much so). Social desirability judgments were also provided on a 7-point scale, ranging from −3 (very undesirable) to +3 (very desirable).
In the economic games, participants read instructions and completed three comprehension questions assessing their understanding of the payoff structure. Failure to answer all three comprehension questions correctly after two attempts resulted in participants being prevented from completing the survey. After these questions, we revealed which role the participant had been assigned, and they made their decision. We informed them that pairs of decisions would be combined and their bonus calculated and awarded after the survey had concluded (which was true). In addition to bonuses, all participants received a base fee of US$0.50 for taking part. At the end of the survey, participants completed simple demographic questions, provided feedback on their experience, and were asked whether they had previously taken part in a similar decision task.
Results
All analyses were conducted in the R environment (R Core Team, 2016). Only dictators are used in Study 2 analyses. Table 2 displays the descriptive statistics.
Descriptive Statistics From Studies 1 and 2.
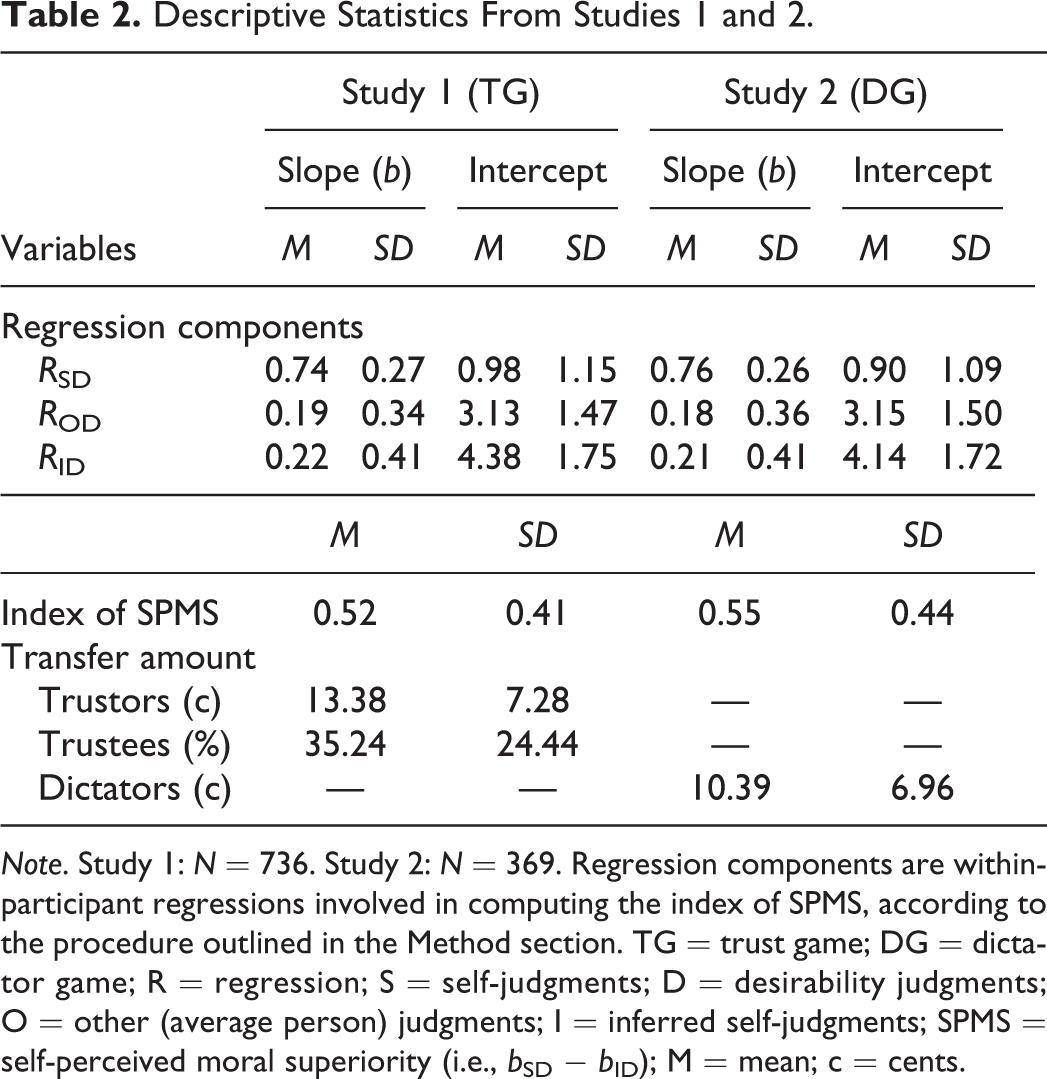
Note. Study 1: N = 736. Study 2: N = 369. Regression components are within-participant regressions involved in computing the index of SPMS, according to the procedure outlined in the Method section. TG = trust game; DG = dictator game; R = regression; S = self-judgments; D = desirability judgments; O = other (average person) judgments; I = inferred self-judgments; SPMS = self-perceived moral superiority (i.e., b SD − b ID); M = mean; c = cents.
Data Exclusions
All data exclusions were preregistered. Before computing the SPMS index, we excluded responses that contained duplicate IP addresses (Study 1: n = 8, 0.97%, Study 2: n = 2, 0.48%) and/or one or more failed attention checks (there were three embedded in the trait judgment task; Study 1: n = 28, 3.39%, Study 2: n = 22, 5.33%). We then proceeded to compute the index as outlined in Steps 1–3 in the Method section. During Step 1, those participants who responded uniformly on moral self-judgments were excluded (Study 1: n = 0, 0%, Study 2: n = 4, 0.97%), because the regression analyses in this step require at least some variation. During Step 3, for the same reason, we additionally excluded participants who responded uniformly on moral judgments of the average person (Study 1: n = 54, 6.53%, Study 2: n = 19, 4.60%) and/or social desirability judgments (Study 1: n = 1, 0.12%, Study 2: n = 4, 0.97%). Sample sizes for the primary analyses were, thus, Study 1: trustors n = 369, trustees n = 367, Study 2: dictators n = 369.
SPMS and Trust in Others
Preregistered analyses
We first regressed trustor decisions on SPMS scores (Figure 1). SPMS was trivially related to transfer amount, model summary: F(1, 367) = .14, p = .706, R = .02 (predictor summary: b = −.34, SE = 0.89, t = −.38]. Because the decision data were nonnormally distributed, we also conducted a Spearman’s rank correlation with the same two variables. The results mirrored the parametric analysis: rs = −.05, p = .326. Magnitude of SPMS was not meaningfully associated with trusting behavior in the TG.
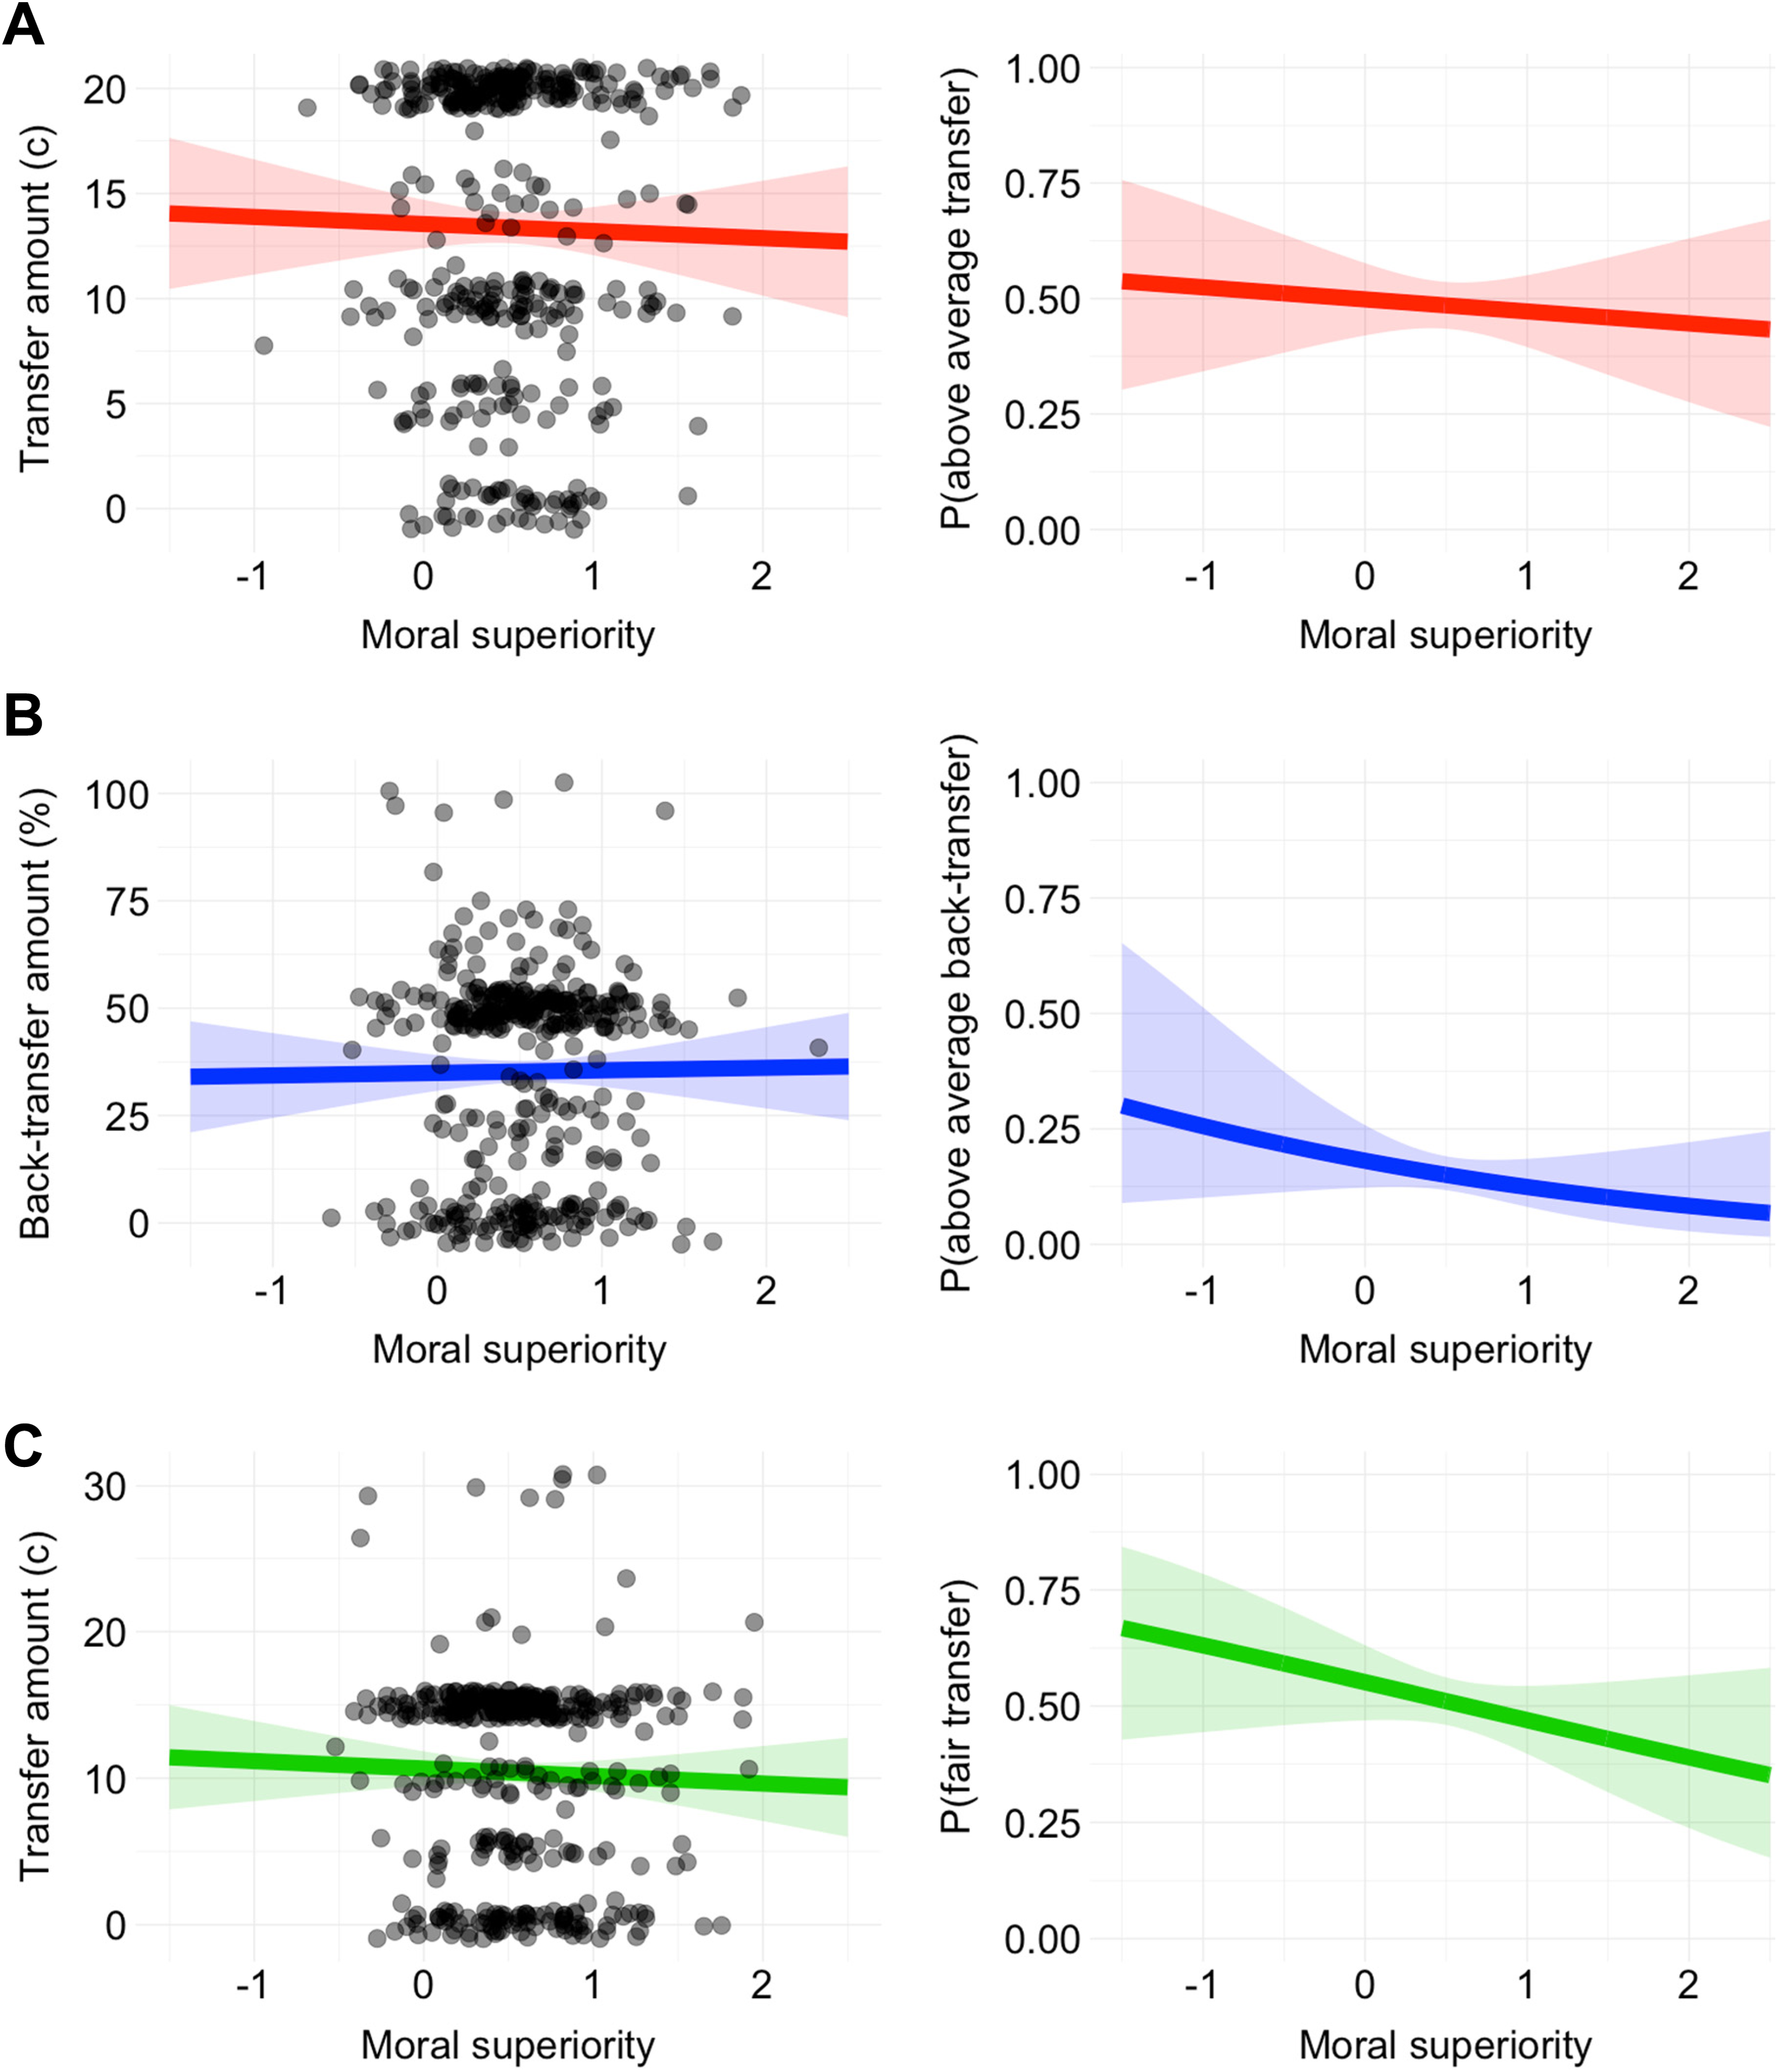
Relationship between self-perceived moral superiority (SPMS) and transfer amounts in Studies 1 (A, B) and 2 (C). Scatter points are raw data with slight jitter for visibility, and the shaded regions denote 95% confidence intervals. (A) Left panel: Preregistered analysis regressing trustor transfer amount on SPMS (b = −.34, SE = 0.89). Right panel: Exploratory binary logistic regression analysis of the probability that trustor transfer was greater than the median transfer amount (15c) based on SPMS scores (odds ratio [OR] = .90 [0.55, 1.46]). N = 369. (B) Left panel: Preregistered analysis regressing trustee back-transfer amount on SPMS (b = .60, SE = 3.17). Right panel: Exploratory binary logistic regression analysis of the probability that trustee back-transfer was greater than the median back-transfer amount (50%) based on SPMS scores (OR = .64 [0.31, 1.32]). N = 367. (C) Left panel: Preregistered analysis regressing dictator transfer amount on SPMS (b = −.62, SE = 0.83). Right panel: Exploratory binary logistic regression analysis of the probability that dictator transfer was fair (15c) based on SPMS scores (OR = .72 [0.45, 1.15]). N = 369.
Exploratory analyses
We conducted several exploratory analyses to test the robustness of this conclusion. First, we dichotomized the trustor decisions by assigning them a value of 1 if they were greater than the median transfer amount of 15c and a value of 0 if they were equal to or less than this amount. A total of 179 (48.51%) participants transferred greater than the median amount of 15c. A binary logistic regression predicting the probability of an above median transfer, based on SPMS scores, corroborated the preregistered analyses: odds ratio (OR) = .90, 95% CI [0.55, 1.46], p = .669 (Figure 1). That is, SPMS was not meaningfully associated with the probability of transferring greater than the median transfer amount. For all dependent variables (trust in others, trustworthiness, fairness), we also explored whether prior experience with the games was masking an association between SPMS and transfer amounts in our sample (it wasn’t; cf. Chandler, Paolacci, Peer, Mueller, & Ratliff, 2015; see Supplemental Material, Section 2 for these analyses).
Given these results, we sought to quantify the relative strength of evidence in favor of the null hypothesis. We conducted a Kendall’s τ Bayesian correlation analysis using JASP software (version 0.8.0.1, JASP Team, 2017). Under a uniformly distributed prior, we obtained a Bayes factor (BF) of 8.23 in favor of the null hypothesis. That is, the BF indicated moderate support for the null over the alternative hypothesis. The BF in favor of the null remained moderate-to-strong over a wide range of priors (see Supplemental Material, Section 1). The results of the exploratory analyses support those of the preregistered analyses.
SPMS and Trustworthiness
Preregistered analyses
As before, we began by regressing trustee decisions on SPMS scores (Figure 1). SPMS was trivially related to back-transfer amount: F(1, 365) = .04, p = .851, R = .01 (b = .60, SE = 3.17, t = .19]. Because the decision data were again nonnormally distributed, we followed with a Spearman’s rank correlation. The results mirrored the parametric analysis: rs = −.004, p = .931. Magnitude of SPMS was not meaningfully associated with trustworthiness behavior in the TG.
Exploratory analyses
Once again, we conducted several exploratory analyses to investigate the robustness of this conclusion. We first dichotomized the trustee decisions by assigning them a value of 1 if they were greater than the median back-transfer amount of 50% and a value of 0 if they were less than this amount. A total of 55 (14.99%) participants back-transferred greater than the median amount of 50%. A binary logistic regression predicting the probability of an above median back-transfer, based on SPMS scores, corroborated the preregistered analyses: OR = .64 [0.31, 1.32], p = .233 (Figure 1). That is, SPMS was not meaningfully associated with the probability of an above median back-transfer. As before, a Kendall’s τ Bayesian correlation analysis conducted in JASP (uniformly distributed prior) returned a BF of 14.58 in favor of the null hypothesis. That is, the BF indicated strong support for the null over the alternative hypothesis. The BF remained moderate-to-strong over a wide range of priors (see Supplemental Material, Section 1). The results of the exploratory analyses thus support those of the preregistered analyses.
SPMS and Fairness
Preregistered analyses
We began by regressing dictator decisions on SPMS scores (Figure 1). SPMS was trivially related to transfer amount: F(1, 367) = .57, p = .452, R = .04 (b = −.62, SE = 0.83, t = −.75). Because the decision data were nonnormally distributed, we conducted a Spearman rank correlation with the same two variables. The results mirrored the parametric analysis: rs = −.05, p = .345. We quantified the relative strength of evidence in favor of the null by conducting a Bayesian correlation analysis in JASP. We preregistered our intention to conduct a Pearson ρ Bayesian correlation, but, given the severe nonnormality of the decision data, a Kendall’s τ Bayesian correlation is more appropriate. For transparency, we report both. The BFρ was 11.57, and BFτ was 8.38 in favor of the null hypothesis (uniformly distributed priors). Both indicated moderate-to-strong support for the null over the alternative hypothesis. In Supplemental Material, Section 1, we report BFτ over a wide range of priors (it remained moderate-to-strong in favor of the null).
Next, to account for the fact that transfer amounts of greater than 15c—that is, greater than half the dictator’s endowment—are technically “unfair” (Fehr & Schmidt, 1999), rather reflecting altruism or “hyperfairness” (Henrich et al., 2006; Rand, Brescoll, Everett, Capraro, & Barcelo, 2016), we repeated the above analyses with a truncated sample of dictators—excluding those who transferred greater than 15c (N excluded = 15, 4.07%). The truncated analyses thus tested whether SPMS was associated with fairness behavior, where unfair behavior was defined as inequity in favor of oneself (i.e., the dictator). The pattern of results was the same as in the full sample, regression: F(1, 352) = .87, p = .351, R = .05 (b = −.73, SE = 0.78, t = −.93), Spearman’s rank correlation: rs = −.06, p = .235, Bayesian correlation: BFρ = 9.75 and BFτ = 5.88 in favor of the null (uniform priors; BFτ robust over a range of priors, see Supplemental Material, Section 1). Magnitude of SPMS was not meaningfully associated with fairness behavior in the DG.
Exploratory analyses
To check robustness, we dichotomized the dictator decisions by assigning them a value of 1 if they were equal to 15c and a value of 0 if they were greater than or less than this amount. Fairness was thus strictly defined as rejection of inequity in favor of either oneself (dictator) or the other person (receiver). A total of 187 (50.68%) participants split the money fairly, transferring exactly 15c. A binary logistic regression predicting the probability of fair transfer, based on SPMS scores, corroborated the preregistered analyses: OR = .72 [0.45, 1.15], p = .174 (Figure 1). That is, SPMS did not meaningfully predict the probability of a fair transfer. The results of the exploratory analyses are consistent with those of the preregistered analyses.
Discussion
We investigated how SPMS related to behavior in two canonical economic games—the TG and DG. Across two studies, SPMS was not meaningfully associated with magnitude of trust in others, trustworthiness, or fairness, as these behaviors are measured in the games. This pattern of results was robust to a variety of analyses, and, for each of the three dependent variables, Bayesian analyses indicated relatively strong support for the null versus alternative hypotheses.
The findings are inconsistent with our hypotheses that SPMS would be associated with (i) more or with (ii) less, moral behavior. Whereas some evidence suggests that perceptions of nonmoral self-superiority are associated with (Blanton, Buunk, Gibbons, & Kuyper, 1999; Heck & Krueger, 2015) and possibly facilitate (O’Mara & Gaertner, 2017) behavioral performance, we found that SPMS was not associated with behavior in canonical economic games—in which moral motivation appears reliably engaged (Capraro & Rand, 2017) and where morally superior decisions are readily discerned (Krueger & Acevedo, 2007; Krueger & DiDonato, 2010; Krueger et al., 2008).
Why was SPMS unrelated to behavior in the games? One explanation is that our measure of SPMS was domain general. That is, participants provided judgments for a range of moral traits, which fed into a single score indexing their SPMS. It is possible that superiority perceived on specific moral traits is associated with behavior representative of those traits but that our domain general measure obscured these relationships. We examined this possibility by computing raw difference scores between participants’ self-judgments and their judgments of the average person for the traits “trustworthy” and “fair” only and correlating these scores with trustee decisions and dictator decisions, respectively (Supplemental Material, Section 3). These coefficients were also trivial in size (|rs | < .03)—suggesting that the domain generality of our measure does not account for the current pattern of results.
An interesting and related question is whether individuals’ moral self-perception—not their perceived superiority over others—was associated with absolute magnitude of monetary transfer in the games. Exploratory correlations suggested a small but consistently positive association between moral self-perception (b SD) and transfer amount across dependent variables: trust in others (rs = .12), trustworthiness (rs = .15), and fairness (rs = .06). We observed some evidence for self-knowledge—those people who had a more positive view of their own morality tended to transfer more money to their partners. This is consistent with prior evidence that self-perceptions are at least somewhat diagnostic of behavior/reality (Epley & Dunning, 2000; Vazire & Carlson, 2010) and that self-reported traits correlate with prosociality in economic games (Hilbig, Zettler, Leist, & Heydasch, 2013). This raises the question of what role moral judgments of the average person had in participants’ behavior.
It is plausible that the magnitude of SPMS is driven primarily by variance in how people view the morality of other people, not themselves (cf. Tappin & McKay, 2017), and that greater moral cynicism about others is associated with lower engagement in certain types of moral behavior (Krueger & Acevedo, 2007). This provides one explanation for why the above positive associations between moral self-perception and behavior did not emerge for SPMS. Specifically, because they were canceled out by the cynicism disproportionately driving the latter.
We subjected this speculation to the data. First, comparing the shared variance between SPMS scores and both (i) moral self-perceptions (b SD) and (ii) perceptions of the average person’s morality (b OD) revealed that the latter explained, on average, 64% variance in the scores, whereas the former accounted for less than a quarter of this amount (Supplemental Material, Section 4). Second, the perceptions of the average person’s morality were weakly but consistently positively related to transfer amount across dependent variables: trust in others (rs = .11), trustworthiness (rs = .12), and fairness (rs = .08). In other words, SPMS was mainly driven by how individuals viewed the morality of other people, not themselves, and greater moral cynicism about these others tended to be associated with lower monetary transfers. This supports our speculation on both counts and is consistent with two areas of prior work: the first, that observers interpret expressions of self-superiority as condemnation of others, rather than egregious self-flattery (Van Damme, Deschrijver, Van Geert, & Hoorens, 2017; Van Damme, Hoorens, & Sedikides, 2016), and, the second, that individuals condition their behavior in these games on whether they think others will behave in kind (Krueger & Acevedo, 2007).
Based on this, we suggest that, despite the robust observation that most people report themselves as morally superior to the average person, this phenomenon has limited predictive validity due to the seemingly opposed behavioral influences of self- and other-perception that comprise its measurement. That said, we note there is mixed evidence over whether economic games are valid analogues of behavior in the real world (Benz & Meier, 2008; Fehr & Leibbrandt, 2011; Franzen & Pointner, 2013; Galizzi & Navarro-Martinez, in press). It is thus reasonable to ask whether our results would generalize to more ecologically valid cases of moral behavior. This represents an interesting avenue for future research. Furthermore, there is evidence that East Asian samples do not report self-superiority perceptions to the same extent as Western samples (Heine & Hamamura, 2007), indicating our results may differ along these specific cultural lines.
We do expect, however, that our results will be robust to variations in the economic game environment—in particular, changes to the size of the monetary stakes. Indeed, meta-analytic reviews indicate that game behavior tends to differ rather minimally over variance in stake size (Engel, 2011; Johnson & Mislin, 2011). In addition, both our measure of SPMS and our analytic approach were comprehensive—comprising a variety of validated moral traits (see Tappin & McKay, 2017) and a range of robustness checks, respectively. We expect conceptual replications that use alternative measures of moral superiority and alternative analytic approaches to produce similar results to those we observed here. We have no reason to believe that the results depend on other characteristics of the participants, materials, or contexts (Simons, Shoda, & Lindsay, 2017).
Here, we investigated how SPMS related to moral behavior as measured in canonical economic games. We observed robust evidence that SPMS is not meaningfully associated with magnitude of trust in others, trustworthiness, or fairness, as defined by the games, a result seemingly accounted for by the opposite behavioral manifestations of (i) self-knowledge and (ii) cynicism about the morality of the average person.
Supplemental Material
Supplemental Material, SPPS750736_suppl_mat - Investigating the Relationship Between Self-Perceived Moral Superiority and Moral Behavior Using Economic Games
Supplemental Material, SPPS750736_suppl_mat for Investigating the Relationship Between Self-Perceived Moral Superiority and Moral Behavior Using Economic Games by Ben M. Tappin, and Ryan T. McKay in Social Psychological and Personality Science
Footnotes
Declaration of Conflicting Interests
The author(s) declared no potential conflicts of interest with respect to the research, authorship, and/or publication of this article.
Funding
The author(s) disclosed receipt of the following financial support for the research, authorship, and/or publication of this article: This research was supported by a grant from the Economic and Social Research Council awarded to the first author, reference number ES/J500148/1.
Supplemental Material
The supplemental material is available in the online version of the article.
Notes
References
Supplementary Material
Please find the following supplemental material available below.
For Open Access articles published under a Creative Commons License, all supplemental material carries the same license as the article it is associated with.
For non-Open Access articles published, all supplemental material carries a non-exclusive license, and permission requests for re-use of supplemental material or any part of supplemental material shall be sent directly to the copyright owner as specified in the copyright notice associated with the article.
