
Abstract
In this research, we test the central hypothesis that perceptions of Asian Americans as a high-status “model minority” lead to overestimates of the extent of wealth equality between Asian and White Americans. We test this hypothesis across three studies that manipulate the salience of high- or low-status Asian American exemplars before soliciting estimates of Asian-White wealth equality. A meta-analysis of the results revealed that participants significantly overestimated Asian-White wealth equality and that making low- versus high-status Asian American exemplars salient decreased this tendency. These data suggest that activation of high-status Asian American exemplars elicits greater overestimates of Asian-White wealth equality, obscuring existing wealth disparities relative to White Americans and significantly downplaying the economic inequality that burdens a subset of Asian Americans from less prototypical ethnic backgrounds. The findings echo recent calls by sociologists and political scientists for a more nuanced understanding of the diversity and economic inequality among Asian American communities.
Asian Americans are commonly perceived in the United States as a monolithic racial group (e.g., Ong, Burrow, Fuller-Rowell, Ja, & Sue, 2013; Sue, Bucceri, Lin, Nadal, & Torino, 2007) despite members of this broad category having roots in more than 20 countries with unique cultures and immigration histories (Lee & Zhou, 2015; López, Ruiz, & Patten, 2017). Perceptions of Asian immigrants tend to focus on the more recent arrivals during the last few decades after 1965, often overlooking waves of immigration that began as early as the 19th century (Spickard, 1999). This tendency results in perceptions of Asian Americans in aggregate as high in socioeconomic status both in general and relative to other racial minority groups, owing in some measure to the high proportion of hyperselected Asian immigrants (i.e., highly educated immigrants from China and India) among this latter wave (Lee & Zhou, 2015). It is also owing to these high-status prototypical Asian subgroups that people are largely unaware of the within-group economic inequality among Asian Americans (Fiske, Cuddy, Glick, & Xu, 2002; Ong et al., 2013; Sue et al., 2007; Zou & Cheryan, 2017), some of whom come to America as refugees escaping conflict and live in food and financial insecurity (Kochhar & Cillufo, 2018).
In this research, we predict and test the central hypothesis that the tendency to think of Asian Americans as a high-status group results in the tendency to overestimate wealth equality between Asian and White Americans. We test this general hypothesis across three studies that manipulate the salience of high- or low-status Asian American exemplars. One direct implication of this work is that activation of the prototypical image of Asian Americans directly impacts how Americans, as a whole, downplay or outright ignore the significant economic inequalities that burden a subset of Asian American families.
Two lines of research provide rationale for our central prediction. First, a growing body of research indicates that people are overly optimistic about levels of economic equality in general (Kiatpongsan & Norton, 2014; Norton & Ariely, 2011) and between Black and White Americans (Kraus, Rucker, & Richeson, 2017). In that latter research, samples of Black and White Americans overestimated current levels of equality in health care, wealth, income, and wages shared between Black and White Americans by more than 20 percentage points on average (Kraus et al., 2017). These studies align with prior work indicating that people believe that Americans have made substantial progress toward racial equality in society (Eibach & Ehrlinger, 2006; Wilkins, Hirsch, Kaiser, & Inkles, 2017), perceptions inconsistent with actual indices of wealth inequality, for instance, which suggest that Black Americans had roughly US$10 for every US$100 held by Whites since the 1960s (Hamilton, Darity, Price, Sridharan, & Tippett, 2015). In the particular case of perceptions of Asian-White wealth equality, in addition to narratives of racial progress, Asian American exemplars tend to be high in social status. Perceptions of Asian Americans are thus likely to reflect this advantaged subset of the racial category, thereby eliciting overestimates of Asian-White wealth equality. In this research, we directly test the prediction that Americans will overestimate Asian-White wealth equality in a similar—though less extreme—fashion.
Second, prototypical racial group representations and exemplars are likely to play a significant role in eliciting overestimates of Asian-White wealth equality (Brown-Iannuzzi, Dotsch, Cooley, & Payne, 2017; Lei & Bodenhausen, 2017). As we argued, Asian Americans are largely perceived to be high in social status in general and relative to other racial minority groups like Latinx and Black Americans (Zou & Cheryan, 2017). Additionally, according to data from the General Social Survey, people are aware that Asian Americans, when considered as a broad category, are wealthier than other racial minority groups (Xu & Lee, 2013) and higher in income relative to Whites (Kochhar & Cillufo, 2018). Perceptions of the overall category, largely driven by more prototypical subgroups and stereotypical “model minority” exemplars, we argue, are likely to lead to overestimates of Asian-White wealth equality. However, making salient lower status exemplars or subgroups should reduce these overestimates.
We tested two specific hypotheses in the present research: (1) Americans will systematically overestimate wealth equality between Asian and White Americans and (2) overestimation of Asian-White wealth equality is caused, in part, by the salience of high- (vs. low-) status Asian American exemplars. To test our two specific hypotheses, we used three methods to activate high- versus low-status exemplars of Asian Americans, through (1) news summaries of Asian American social issues on college campuses, (2) narratives of Asian American immigrants, and (3) aggregating or disaggregating Asian American subgroups that differ in prototypicality prior to estimating wealth disparities. Across studies, we expected that people would overestimate Asian-White wealth equality overall, but that activating low-status exemplars would reduce these overestimates relative to the activation or salience of high-status exemplars.
Method
Overview
We report all measures, manipulations, and exclusions in these studies. In all studies, our main objectives were to measure perceptions of Asian-White wealth equality and manipulate participants’ perceived status of Asian Americans, by making salient different exemplars or subgroups of the category, through (a) information about college student concerns (Study 1), (b) narratives, photographs, and national origins of specific Asian American individuals (Study 2), or (c) disaggregating Asian Americans into subgroups that vary in their prototypicality with the larger category (Study 3).
In all studies, an informed consent page explained that the study examined how “perceptions of news media” (Study 1), “personal stories of immigrants” (Study 2), or “individual personality” (Study 3) were related to social judgments. Participants were informed that they would fill out surveys assessing their beliefs about society, their responses were anonymous, and they could skip any questions without loss of compensation. After consenting, participants were randomly assigned to one of the experimental conditions (Study 1: low-status, high-status, foreigner; Study 2: low-status, high-status; Study 3: low-status, high-status). Participants were next provided with definitions of wealth and income (Norton & Ariely, 2011) before responding to critical dependent variables related to wealth equality. Lastly, participants completed measures of related psychological constructs and demographic questions and were debriefed about study hypotheses.
Participants
For each study, a large online sample of participants was recruited to take a 10- to 15-min survey. Study 1 and Study 2 participants were recruited through Amazon Mechanical Turk; Study 3 participants were recruited through Prolific, another online crowdsourcing platform, out of concern that bot responses contaminated data on MTurk (Bai, 2018). All participants were compensated US$1.50 for participation, and all consented to participate in this research, approved by the Yale University Institutional Review Board.
In Study 1 (n = 603; 257 women, Mage = 35.33, SDage = 11.83), the largest ethnoracial group was European American/White (n = 404), followed by African American/Black (n = 92), Asian American (n = 48), Latino/a (n = 36), Other (n = 12), and American Indian (n = 11). The sample size of each study was determined before any data analysis. Our target sample size of 200 per condition guaranteed us greater than 99% power to detect an R = 0.21 effect size, the average effect size in the history of social psychology (Richard, Bond, & Stokes-Zoota, 2003).
In Study 2 (n = 607; 276 women, Mage = 36.80, SDage = 12.85), the largest ethnoracial group was European American/White (n = 450), followed by African American/Black (n = 51), Asian American (n = 41), Latino/a (n = 28), Other (n = 19), and American Indian (n = 18). Because the size of the difference between the low- and high-status conditions was smaller than anticipated in Study 1, we increased our target sample size to 300 per condition to give us 80% power to detect an R = 0.11 effect size. We also increased the salience of status in our manipulation in Study 2 to make the experimental manipulation of status more powerful (see below).
In Study 3 (n = 612; 284 women, Mage = 32.35, SDage = 11.26), the largest ethnoracial group was European American/White (n = 446), followed by Asian American (n = 57), African American/Black (n = 45), Latino/a (n = 32), Other (n = 20), and American Indian (n = 4). Our target sample size remained 300 per condition.
See Table 1 for all participant demographic characteristics. All participants were included in analyses across all studies except in specific cases where they had missing data. The studies reported here represent all of the studies we conducted on this topic. Uniquely, Study 3 was preregistered, including specific code for analyses, before data collection (see osf.io/jk49m). All meta-analytic estimates of effect sizes are conducted using fixed-effects models (Goh, Hall, & Rosenthal, 2016).
Demographic Characteristics of Participants From Studies 1 to 3.

Asian American Status Manipulations
Study 1
In Study 1, we manipulated the perceived status of Asian Americans by heightening participants’ access to different Asian American exemplars (Lee & Zhou, 2015; Zou & Cheryan, 2017). Participants were randomly assigned to read a university newspaper’s Twitter updates about a low- or high-status group of Asian American students or, instead, a foreign student group (for all study materials, see: osf.io/kcsjf/).
In the low-status condition, participants read that the Asia Refugee Rights Network urged the university to offer more academic and financial resources to low-income and first-generation students. In the high-status condition, participants read that the Society of Asian Scientists and Engineers advocated for more merit-based scholarships to students in science and engineering.
Because recent research indicates that foreignness is a salient stereotype of Asian Americans (Kim, 1999; Xu & Lee, 2013; Zou & Cheryan, 2017), we included a third condition highlighting the apparent foreignness of Asian American students. In the foreigner condition, participants read that the Asia International Student Society advocated for more language and community resources to international students. Because college campuses are so intimately tied to “model minority” stereotypes, we expected the foreignness manipulation to reinforce high-status aspects of Asian Americans as a group.
Study 2
In Study 2, we manipulated the perceived status of Asian Americans more strongly through a combined manipulation of a narrative, photograph of an Asian individual who varied in skin tone (Willer, Feinberg, & Wetts, 2016) and country of origin (Lee & Zhou, 2015). Participants were randomly assigned to read the story of a low-status or high-status Asian American immigrant. To increase immersion in the intervention, participants also listened to the narrative via recordings ostensibly by the protagonist.
In the low-status condition, participants saw a photograph of a young woman with dark skin and read that this woman, Sophia Meng, is a Cambodian American who immigrated with her family as refugees from Cambodia to escape the civil war. Sophia’s mother is a supermarket cashier and her father is unemployed. She works part-time as a waiter and hopes to find a full-time job to help with bills. In the high-status condition, Sophia has lighter skin and is Chinese American. Her family immigrated to seek better opportunities. Sophia’s mother is a radiologist and her father a software engineer. She plays the piano in her spare time and hopes to become a doctor like her mother. Controlling for foreignness, in both conditions Sophia struggled to learn English and experienced stereotypes of foreignness, such as people not believing that she was from California.
Study 3
In Study 3, we manipulated the perceived status of the Asian American category by asking participants to think about Asian Americans as a general, aggregated pan-ethnic whole or, instead, by first considering 10 Asian-origin subgroups based on the groups reported by the 2016 National Asian American Survey (Ramakrishnan, Lee, Lee, & Wong, 2017). We reasoned that highlighting Asian-origin subgroups would increase the salience of low-status Asian American exemplars and affect the perceived status of the entire category. Asian-origin subgroups have distinct patterns of arrival, either through, for instance, the skilled work H-1B visa like immigrants from India (Kochhar & Cillufo, 2018) or through refugee settlement as in the case of Vietnam and Cambodia (Zong & Batalova, 2016). These migration patterns engender different levels of social status as a function of subgroup, which we used in our manipulation for Study 3.
Participants in the low-status condition were asked to first make Asian-White wealth equality estimates for 10 Asian-origin subgroups and then make general Asian-White wealth equality estimates for the groups in aggregate. Participants in the high-status condition were asked to make the same estimates in reverse order; thus, aggregate estimates occurred after our main dependent measure.
Measures
Estimates of Asian-White wealth equality
We measured participants’ estimates of Asian-White wealth equality using items similar to those used in Kraus, Rucker, and Richeson (2017). We asked participants to, thinking of current times, estimate the wealth of an average Asian American family “for every US$100 in wealth accumulated by an average White family.” Participants entered their estimates on a 0–200 scale, in which a zero indicates that Asian families have no wealth, and a 200 indicates that Asian families have double the wealth of White families. We refer to this measure as general Asian-White wealth equality estimates.
We also measured wealth equality estimates at the subgroup level for 10 Asian-origin subgroups, based on the 6 largest subgroups plus South and Southeast Asian subgroups reported by the 2016 National Asian American Survey (Ramakrishnan et al., 2017): Asian Indian, Bangladeshi, Cambodian, Chinese, Filipino, Hmong, Japanese, Korean, Pakistani, and Vietnamese. We presented the subgroups in random order, which did not affect results. We refer to this measure as subgroup-level Asian-White wealth equality estimates.
Subjective social status of Asian Americans
In all three studies, we measured participants’ perceptions of the social status of Asian Americans using the MacArthur Scale of Subjective Social Status (Adler, Epel, Castellazzo, & Ickovics, 2000). An illustration of a 10-rung ladder represented ascending levels of income, educational, and occupational status in the United States, and participants placed Asian Americans on one of the rungs. See the Online Supplement for all descriptive statistics of the psychological correlates.
Familiarity with Asian subgroups
In Studies 1 and 2, participants indicated how familiar they were with each of the 10 Asian-origin subgroups (10 items; Study 1: α = .93; Study 2: α = .92) on a 5-point Likert-type scale (1 = not familiar at all, 5 = extremely familiar).
Political ideology
We measured economic and social political orientation (2 items; Study 1: α = .89; Study 2: α = .87; Study 3: α = .84) on 7-point Likert-type scales (1 = very liberal, 7 = very conservative).
Belief in a just world
In Studies 1 and 2, we measured general beliefs in a just world (Lipkus, 1991) with 6 items (e.g., “I think basically the world is a just place”; Study 1: α = .92; Study 2: α = .91) on 6-point Likert-type scales (1 = strongly disagree, 6 = strongly agree).
Social dominance orientation
In Study 2, we measured social dominance orientation (Pratto, Sidanius, Stallworth, & Malle, 1994) with 8 items (e.g., “Some groups of people are simply inferior to other groups”; α = .89) on a 7-point Likert-type scale (1 = strongly oppose, 7 = strongly favor).
Inclusion of Asian-origin subgroups
Park (2008) found a subtle hierarchy within the label “Asian American” such that East Asian-origin subgroups (e.g., Chinese) come more readily to mind (i.e., are more prototypical) than Southeast (e.g., Vietnamese) and South (e.g., Indian) Asian-origin subgroups. Therefore, in Study 3, after participants made their general Asian-White wealth equality estimates, we presented a list of 10 Asian subgroups, plus three South American countries, three African countries, and three European countries. Participants indicated the countries they had in mind when making general Asian-White wealth equality estimates.
Results
Manipulation Check
As a manipulation check, participants in Studies 1 and 2 completed a recall task at the end of the experiment. In Study 1, 492 participants (81%) correctly answered the question, “What was the content of the tweets that you read?” Only in Study 1 did participants differentially fail the manipulation check by condition, F(2, 600) = 4.80, p = .009 (see Supplement). In Study 2, participants answered four questions (e.g., “Where is Sophia Meng from?”). Of the sample, 556 (92%) did better than chance at the recall task, meaning they answered at least three questions correctly. Participants’ mean scores on the manipulation check questions (out of four) did not differ by condition, t(605) = 1.34, p = .180.
We did not plan to remove participants who failed the manipulation check because removal threatens the validity of the manipulation (Montgomery, Nyhan, & Torres, 2018). The general pattern of results is roughly the same if participants who did not successfully complete the manipulation check and failed the data quality check are excluded. For Study 3, all preregistered analyses are reported in the manuscript or online supplementary materials except data quality analyses for our captcha question: Participants who failed the captcha were not invited to complete the rest of the study, so we could not analyze data for these participants.
Perceptions of Asian-White Wealth Equality
To test our first hypothesis, we examined whether our sample of Americans overestimated Asian-White wealth equality. To conduct this analysis, we computed accuracy scores for participants’ perceptions of Asian-White wealth equality across studies and experimental conditions by subtracting 84.73—the median federal estimate of Asian wealth per US$100 in White wealth, calculated from the 2013 Survey of Income and Program Participation (SIPP; Wealth, Asset Ownership, & Debt of Households Detailed Tables: 2013 , 2013)—from these estimates. Thus, an accuracy score of zero indicates perfect accuracy in the estimate of Asian-White wealth equality, and a positive score indicates an overestimate of equality.
Consistent with our first hypothesis, participants significantly overestimated Asian-White wealth equality in Study 1, M = 11.71, 95% CI [8.80, 14.62], t(602) = 7.90, p < .001, d = 0.64; Study 2, M = 12.44, 95% CI [9.76, 15.12], t(606) = 9.12, p < .001, d = 0.74; and Study 3, M = 13.86, 95% CI [11.56, 16.16], t(603) = 11.85, p < .001, d = 0.97. A meta-analysis across studies and experimental conditions (Goh et al., 2016) reveals that participants significantly overestimated Asian-White wealth equality, dCombined = 0.78, ZCombined = 16.23, pCombined < .001.
Social Status and Perceptions of Asian-White Wealth Equality
Our second hypothesis held that manipulating the salience of low- versus high-status Asian American exemplars or subgroups would reduce overestimates of Asian-White wealth equality. We tested this across our three experiments using different manipulations of low- and high-status Asian Americans (see Figure 1).
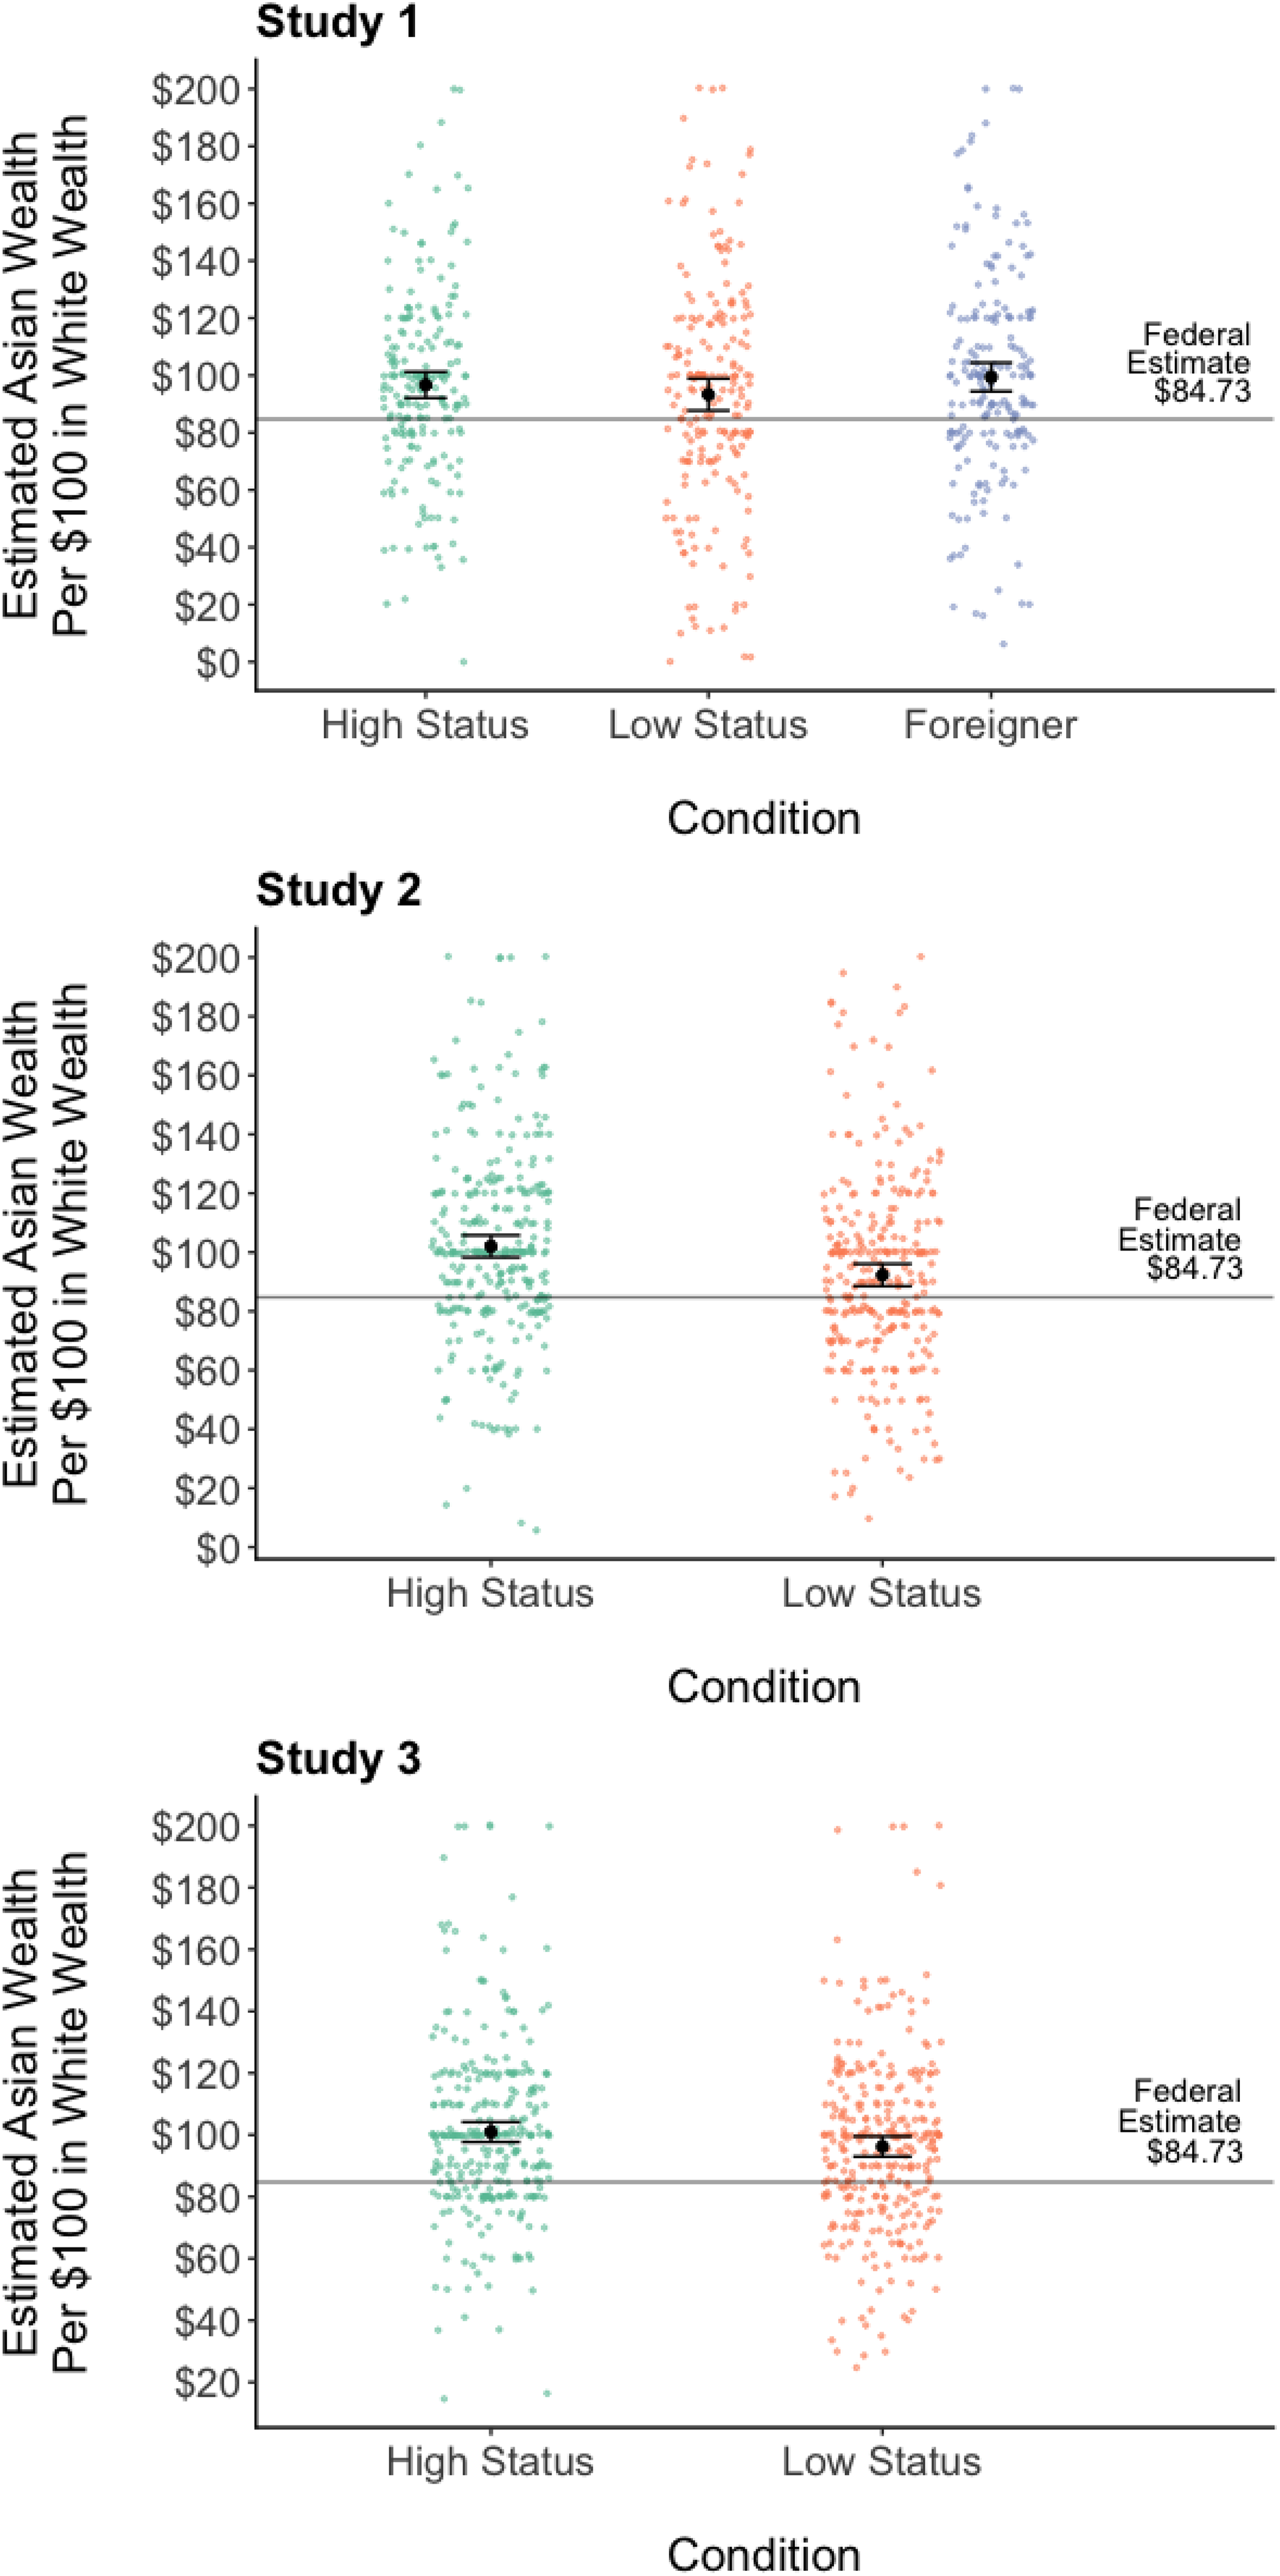
The graphs show overestimates of Asian-White wealth equality across all three studies. Scatterplots represent respondent perceptions of typical family wealth of Asian American relative to White American wealth set to US$100. The horizontal line represents the federal estimate of the median wealth for Asian Americans when White American wealth is set to US$100 and was calculated using the 2013 Survey of Income and Program Participation. Error bars indicate 95% confidence intervals surrounding the mean.
In Study 1, we heightened the salience of low-status (n = 203), high-status (n = 201), or foreign (n = 199) Asian Americans exemplars on college campuses. We conducted a one-way between-subjects analysis of variance to investigate differences between conditions on general Asian-White wealth equality perceptions. The effect of the manipulation on general Asian-White wealth equality estimates was not significant, F(2, 600) = 1.43, p = .239. A descriptive examination of means reveals that the pattern was, however, aligned with expectations, as participants in the low-status condition made more accurate estimates (M = 8.56), 95% CI [2.99, 14.13] than participants in the high-status condition (M = 11.95), 95% CI [7.41, 16.50], (d = 0.09) and foreigner condition (M = 14.69), 95% CI [9.69, 19.68], (d = 0.16).
In Study 2, we used narratives, country of origin, and skin tone to manipulate the low (n = 302) and high status (n = 305) of Asian American exemplars. Consistent with predictions, an independent samples t test revealed that participants made significantly more accurate general Asian-White wealth equality estimates in the low-status condition (M = 7.55), 95% CI [3.76, 11.33] than the high-status condition (M = 17.29), 95% CI [13.56, 21.02], t(605) = 3.61, p < .001, d = 0.29.
In Study 3, we manipulated the salience of low-status Asian American exemplars by asking participants to consider perceptions of a variety of Asian-origin subgroups before (low-status; n = 305) or after (high-status; n = 307) they estimated general Asian-White wealth equality. Consistent with predictions, an independent samples t test revealed that participants in the low-status (subgroups first) condition made significantly more accurate general Asian-White wealth equality estimates (M = 11.51), 95% CI [8.24, 14.79], than participants in the high-status (general first) condition (M = 16.19), 95% CI [12.97, 19.41], t(602) = 2.00, p = .046, d = 0.16.
A meta-analysis across all of our studies comparing the low- and high-status experimental conditions revealed that participants generated more accurate estimates of Asian-White wealth equality when they were in the low-status rather than high-status condition, dCombined = 0.19, ZCombined = 3.83, pCombined < .001.
Subgroup-Level Estimates of Asian-White Wealth Equality
At the heart of our rationale for this research is the reality that Asian Americans are best conceived of in disaggregation as unique peoples with their own cultures and immigration histories (Lee & Zhou, 2015). Related to this central point, another way to test our second hypothesis about status salience is to directly compare general perceptions of Asian-White wealth equality to subgroup-level perceptions when considering Asian Americans as a collection of 10 Asian-origin subgroups. Specifically, we expected that estimates of Asian-White wealth equality made while focused on Asian-origin subgroups would be more accurate than general-level estimates of Asian-White wealth equality.
To test our prediction that estimates based on Asian-origin subgroups would result in greater accuracy, we compared mean subgroup-level perceptions of Asian-White wealth equality (10 items; Study 1: α = .97; Study 2: α = .96; Study 3: α = .95; see Figure 2) to general-level perceptions. Consistent with predictions, paired t test analyses revealed that participants made more accurate estimates of Asian-White wealth equality based on mean subgroup-level perceptions of Asian-White wealth in Study 1 (M = −6.11), 95% CI [−8.94, −3.29], t(602) = 15.85, p < .001, d = 1.29; Study 2 (M = −1.19), 95% CI [−3.73, 1.36], t(606) = 14.02, p < .001, d = 1.14; and Study 3 (M = −2.47), 95% CI [−4.50, −0.44], t(602) = 20.83, p < .001, d = 1.70, relative to Asian-White wealth perceptions at the general level.
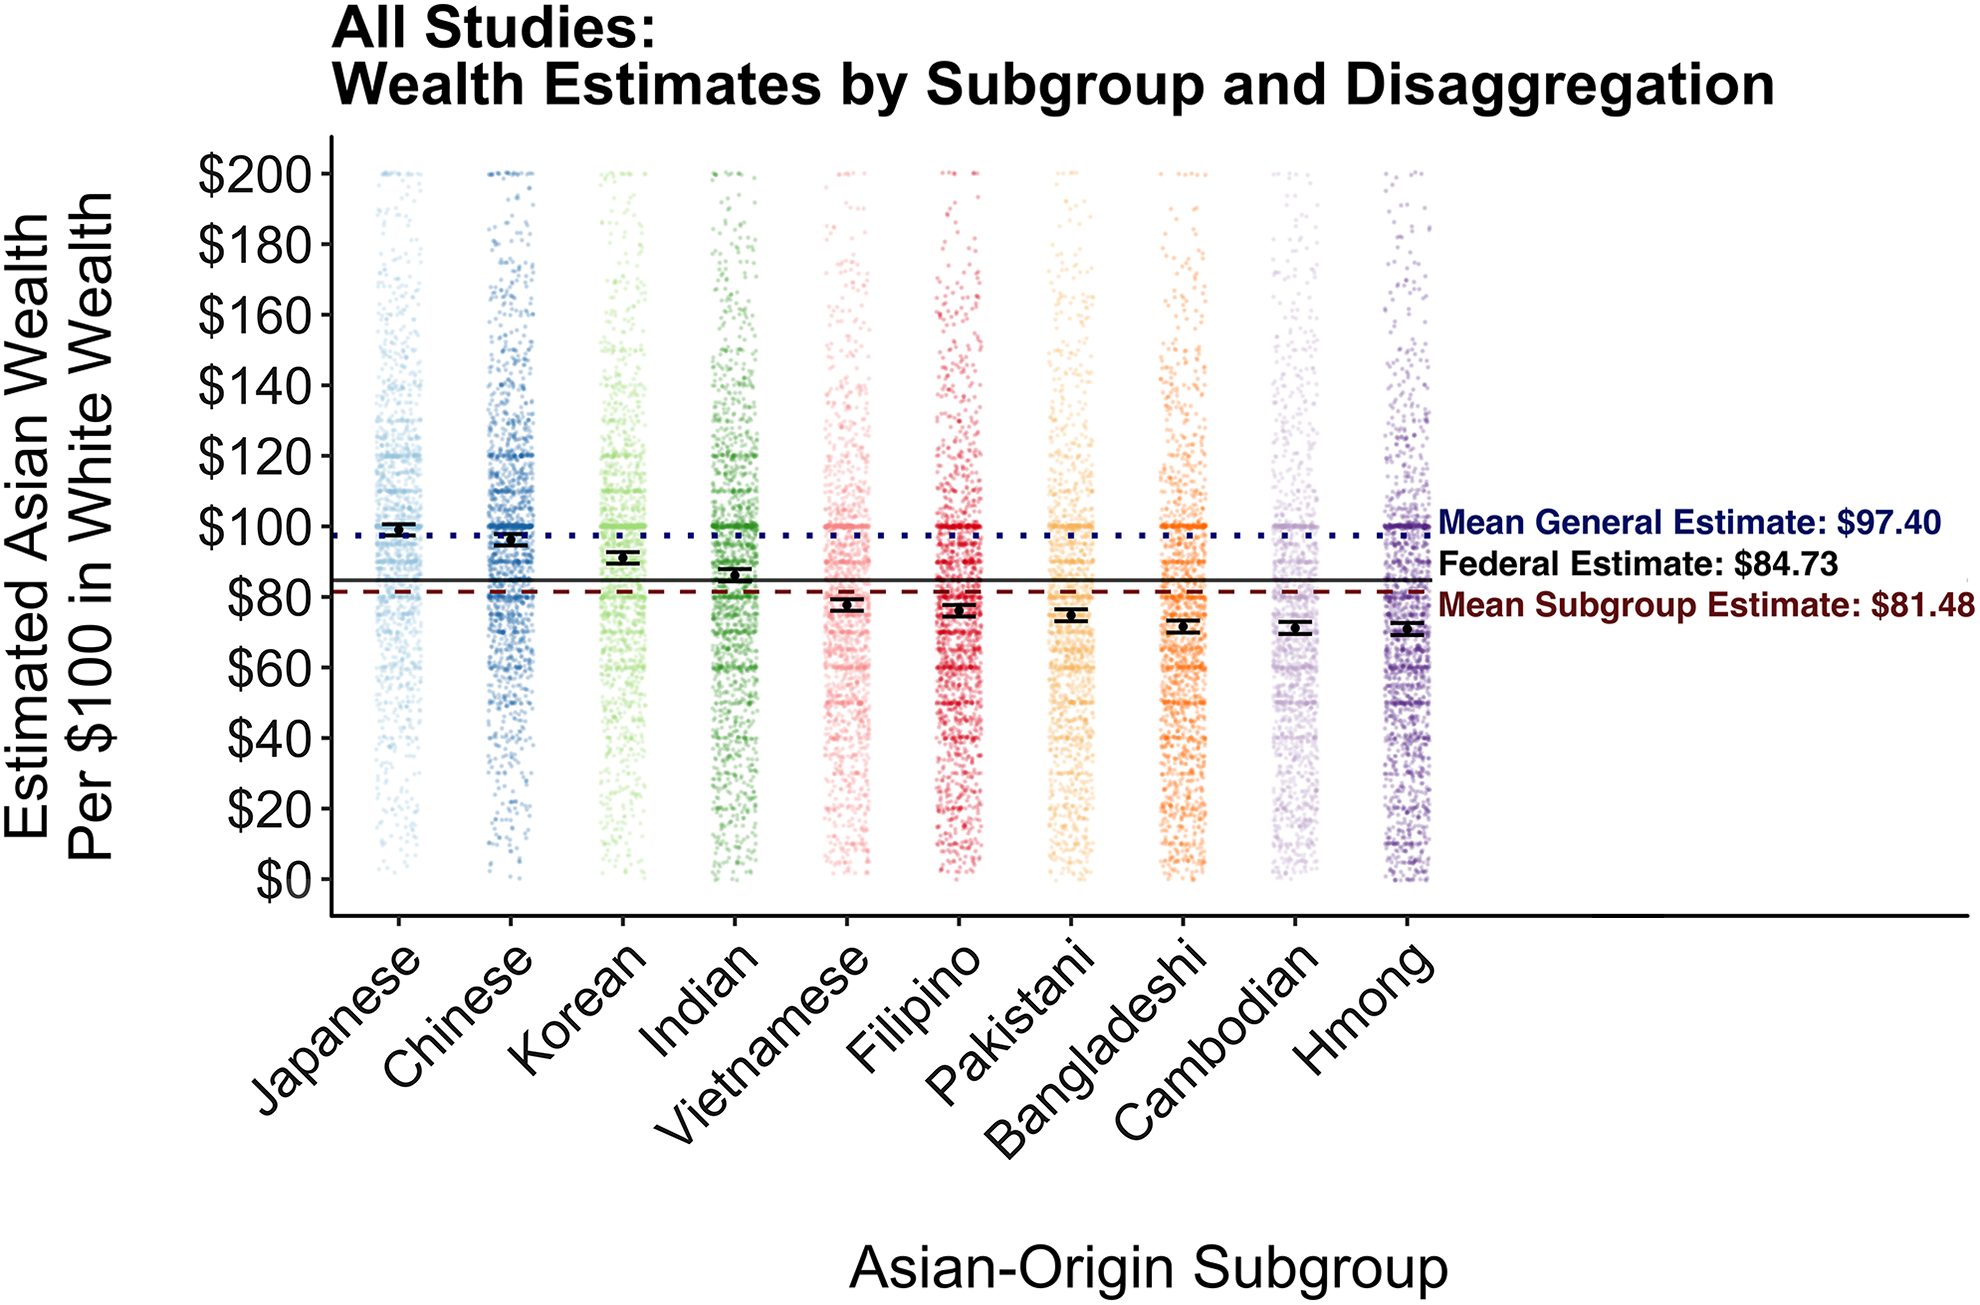
The graph shows estimates of Asian-White wealth equality across 10 Asian-origin subgroups, collapsed across all three studies. Individual dots represent individual respondent perceptions of typical family wealth of the Asian subgroups relative to White wealth set to US$100. The solid line represents the federal estimate of the median wealth for Asian Americans when White wealth is set to US$100 and was calculated using the 2013 Survey of Income and Program Participation. The dotted line represents mean estimates of general-level Asian wealth when White wealth is US$100. The dashed line represents mean estimates of Asian wealth calculated from the composite of subgroup-level estimates. Error bars indicate 95% confidence intervals surrounding the mean estimate.
Across the studies (see Figure 2), a meta-analysis suggests that participants made more accurate estimates of Asian-White wealth equality with mean subgroup-level perceptions than general-level perceptions, dCombined = 0.46, ZCombined = 13.51, pCombined < .001. Critically, though subgroup-level perceptions reduced overestimates of Asian-White wealth equality, this method of wealth equality assessment actually resulted in inaccuracy in the opposite direction. Mean subgroup-level perceptions elicited inaccurate perceptions of Asian-White wealth equality in Study 1, t(602) = −4.25, p < .001, d = −0.35; Study 3 t(602) = −2.39, p = .017, d = −0.19, and across the studies in our meta-analysis, dCombined = −0.21, ZCombined = −4.413, pCombined < .001. Only in Study 2 were subgroup-level perceptions consistent with federal data, t(606) = −0.92, p = .359, d = −0.07. However, we do not necessarily interpret these subgroup-level perceptions as overestimates of inequality because the 10 subgroups are not equally represented in the Asian American population. For instance, when we computed these composite estimates based on the share of the population per subgroup via the U.S. Census Bureau’s 2017 American Community Survey 1-Year Estimates (Asian Alone or in Any Combination By Selected Groups: 2017 American Community Survey 1-Year Estimates, 2018), the difference between the population-weighted estimate and wealth equality comparator was not different in the combined sample of all the studies, suggesting accuracy when breaking up data into subgroups (see Supplement).
An unanticipated result that arose in the subgroup-level perceptions of Asian-White wealth equality is the reliable hierarchy that people perceived in wealth disparities between Asian American subgroups and Whites with Japanese and Chinese Americans on top and Cambodian and Hmong Americans at the bottom (see Figure 2). These results are broadly consistent with demographic data on poverty rates in Asian-origin subgroups in America (López et al., 2017).
Preliminary Tests of Mechanism
We primarily conceived of these studies to examine whether perceptions of the social status of Asian Americans influence overestimates of Asian-White wealth equality, and some mediational analyses are consistent with this prediction. When we examined the influence of our manipulations on the perceived social status of Asian Americans, the overall condition meta-analytic effect was significant in the predicted direction, dCombined = −0.19, ZCombined = −3.701, pCombined < .001. We also examined status of Asian Americans as a mediator through an analysis using the PROCESS macro with 5,000 bootstrapped resamples, confidence intervals calculated using the percentile method (Hayes, 2012), and the combined sample with study as a covariate. This analysis found a significant indirect effect of condition on accuracy in Asian-White wealth estimates through perceived status of Asian Americans, B = 2.26, SE = 0.64, 95% CI [1.08, 3.57]. High-status condition participants’ greater relative tendency to overestimate Asian-White wealth equality, C = 6.26, SE = 1.62, t(1,611) = 3.86, p < .001, was reduced, C′ = 4.00, SE = 1.51, t(1,611) = 2.65, p = .008, after accounting for participants’ self-reported perceptions of Asian Americans’ social status (see Supplement for full path analysis).
A second potential mechanism at play in our studies involves the expansion of the Asian American overall category to include additional subgroups beyond the high-status groups that are typically activated. Consistent with this second mechanism, in Study 3 we found that the more Asian subgroups participants’ tended to include in the overall Asian category, the more accurate their estimates—a finding suggesting that a more diverse rather than prototypical perception of the Asian American category is related to enhanced accuracy in wealth estimates, R(604) = −.12, p = .003. Thus, subgroup category inclusion is a potential contributor to perceptions of Asian American wealth equality that warrants future research (see Supplement).
Discussion
Asian Americans, a fast-growing racial minority group representing about 5% of the U.S. population (U.S. Census Bureau QuickFacts: UNITED STATES, 2017), are typically perceived as a “model minority” (Zou & Cheryan, 2017). These prototypical high-status conceptions of Asian Americans motivate the recent litigation against Harvard University, claiming that Asian Americans are underrepresented on college campuses relative to their academic promise as a group.
However, more than a cursory examination of this group reveals a diverse and multifaceted collection of histories—contrary to dominant conceptions of Asian Americans in the media and on many college campuses, some Asian-origin subgroups came to America as refugees and/or live in poverty (López et al., 2017). In this research, we find preliminary evidence that reminding respondents of low- versus high-status Asian American exemplars reduces overestimates of general Asian-White wealth equality. Across three studies, we found a pattern consistent with this prediction. Americans overestimated general Asian-White wealth equality relative to estimates of wealth based on federal data. Moreover, by highlighting low- versus high-status Asian American exemplars, we found general support for the prediction that the relative salience of high-status—relative to low-status—exemplars is causal in this process. To our knowledge, this is the first causal evidence implicating the salience of high-status exemplars in shaping (mis)perceptions of racial wealth equality (e.g., Kraus et al., 2017). However, our conclusions about the data involving ease of exemplar activation are preliminary and need future research.
A few limitations of the present work bear mentioning. Importantly, the methodology with which respondents estimate wealth inequalities between racial groups is subject to a few qualifications—It is not clear what information participants use to generate these estimates, and the findings depend somewhat on the availability of high-quality economic comparator data on wealth inequality (Davidai & Gilovich, 2018; Swan, Chambers, Heesacker, & Nero, 2017). We tried to account for both of these limitations by reducing the math participants must do to generate their wealth inequality estimates, by avoiding percentages and instead using equivalent comparisons (Gigerenzer & Hoffrage, 1995), and by relying on the highest quality comparator data available; namely data from the Survey of Income and Program Participation. Attesting to the quality of these data, when we average across all dates of SIPP data on Asian-White wealth inequality, the comparator estimate becomes US$86.19 in Asian wealth for every US$100 in White wealth versus the comparison we used in the studies of US$84.73. Importantly, all the results reported here remain unchanged with the SIPP aggregate comparator.
In addition, our Study 3 manipulation of status is executed differently than Studies 1 and 2. Whereas the prior two studies highlight group members who are lower versus higher in status among Asian Americans as an aggregate group, Study 3 does this merely by making these subgroups salient prior to or after estimates of aggregate Asian American wealth. We acknowledge that this difference in the type of manipulation suggests a separable set of mechanisms—one of status and one of subgroup salience—in Study 3. However, our mediational analysis did not observe a significant effect of study when entered as a covariate (see Supplement). Still, subtle differences in methods highlight two primary mechanisms, perceived Asian American status and subgroup salience, that warrant future research.
Implications
Ultimately, one implication of this research is that it reveals the tension between conceiving of racial groups in monolithic, category-level terms rather than based on the unique subgroups with distinct histories that make up the larger category (Lee & Zhou, 2015). As others have argued, we find evidence that when people draw from their perceptions of Asian Americans in aggregate, the overgeneralization of the experiences and characteristics of higher status subgroups and exemplars obscures the most vulnerable among Asian American communities. While people can disaggregate, they do not when perceiving Asian Americans at the larger overall category level, and this, in part, reflects a focus on higher status Asian-origin subgroups (e.g., Chinese Americans) when estimating Asian American wealth equality relative to Whites. Conceiving of Asian Americans as high-status, for instance, may divert social safety net programs away from communities living in poverty or close off affirmative action admissions policies that increase the representation of members of Asian subgroups that—like Black and Latinx Americans—remain underrepresented at universities (Lee & Bean, 2010).
Overall, this research fits into a growing body of work suggesting—with a few exceptions (Chambers, Swan, & Heesacker, 2015; Martin, Nezlek, & Voracek, 2014)—that Americans tend to be overly optimistic about economic equality in society in general and in particular, with respect to the way resources are shared between racial groups (Kraus et al., 2017). The current work suggests that this pattern of overly optimistic belief, which is not born out in data, extends beyond Black Americans and even applies to a relatively high-status racial minority group. That is, although smaller in magnitude than the misperception of Black–White wealth equality, the perception of racial wealth equality between Asian and White Americans outstrips reality. Given that solidarity between racial groups is engendered by the perception of shared experiences with discrimination (Cortland et al., 2017; Craig & Richeson, 2012), a more nuanced understanding of wealth inequality in Asian American communities may be essential for interracial coalition building.
Supplemental Material
Supplemental Material, AWWealthGap_SPPS_Supplement_Revision2_Final - High-Status Exemplars and the Misperception of the Asian-White Wealth Gap
Supplemental Material, AWWealthGap_SPPS_Supplement_Revision2_Final for High-Status Exemplars and the Misperception of the Asian-White Wealth Gap by Entung Enya Kuo, Michael W. Kraus and Jennifer A. Richeson in Social Psychological and Personality Science
Footnotes
Declaration of Conflicting Interests
The author(s) declared no potential conflicts of interest with respect to the research, authorship, and/or publication of this article.
Funding
The author(s) received no financial support for the research, authorship, and/or publication of this article.
Supplemental Material
The supplemental material is available in the online version of the article.
References
Supplementary Material
Please find the following supplemental material available below.
For Open Access articles published under a Creative Commons License, all supplemental material carries the same license as the article it is associated with.
For non-Open Access articles published, all supplemental material carries a non-exclusive license, and permission requests for re-use of supplemental material or any part of supplemental material shall be sent directly to the copyright owner as specified in the copyright notice associated with the article.