
Abstract
We tested the effectiveness of a growth mindset intervention for N = 354 adolescents from low resource schools in the Western Cape, South Africa. Growth mindset measures demonstrated good psychometric properties in our sample. We found mixed evidence of an intervention effect: We did not find evidence that the intervention improved mastery behavior or math achievement test scores, but treatment-on-the-treated (TOT) analyses showed positive effects on growth mindset for those who received the intervention (0.32 SDs). TOT analyses provided some evidence for effects on math grades, comparable in magnitude with previous research (0.24–0.34 SDs), although tests were underpowered and not all reached significance. The intervention cost approximately R4.4 (31 U.S. cents) per student. A growth mindset intervention may be a low-cost way to shape motivation and grades for those attending low resource schools, but more research is needed to address the mixed results obtained in the current study.
With one of the largest youth unemployment rates in the world and one of the highest secondary drop-out rates, South Africa is challenged with creating a development strategy for at-risk youth who are in school and entering the labor market. One strategy is to try improving the malleable socioemotional skills that contribute to success inside and outside of school (Heckman et al., 2006). For example, individual differences in self-control, conscientiousness, and grit contribute to academic and occupational success independent of IQ, and beliefs about intelligence contribute to academic achievement independent of socioeconomic status (Claro et al., 2016; Duckworth & Seligman, 2005; Eskreis-Winkler et al., 2014; Poropat, 2009). Shaping such skills and beliefs could potentially increase the educational attainment and labor market participation of disadvantaged students and help close labor market gaps in South Africa, which is ranked first in the world in socioeconomic inequality (Sulla, & Zikhali, 2018).
The goal of the present research is to evaluate whether an intervention aimed at promoting a growth mindset of intelligence—belief that one’s intelligence is malleable and can grow—can improve students’ motivation and achievement in South Africa. Growth mindset interventions have been shown to improve student achievement in more developed countries (Bettinger et al., 2018; Blackwell et al., 2007; Sisk et al., 2018; Yeager et al., 2019; Yeager et al., 2016), and there is evidence of impact in Peru (Outes et al., 2017). However, there is very little growth mindset research conducted outside of Western, educated, industrialized, rich, and democratic societies, and to our knowledge, no intervention studies in South African townships, which are underdeveloped, racially segregated urban areas suffering the legacy of Apartheid.
Would We Expect a Growth Mindset Intervention to be Effective in South African Townships?
There is reason to believe that a growth mindset intervention would boost academic achievement in South African townships. First, longitudinal research suggests growth mindset correlates with achievement for students living in poverty (Claro & Loeb, 2017; Claro et al., 2016). Second, a growth mindset intervention boosted test scores for adolescents living in Peru (Outes et al., 2017). This sample included over 1,200 schools across rural and urban environments wherein the intervention primarily benefited students in the rural schools, where resources were lower. Overall, this research suggests students in low resource schools in a developing country can benefit from a growth mindset intervention.
Although promising, there is also reason to question whether a growth mindset intervention would be beneficial for South African township youth. Resource constraints in township schools are substantial and include low numbers of qualified teachers and lack of funding for school infrastructure and materials (Sulla, & Zikhali, 2018). Thus, even if a growth mindset intervention could increase students’ motivation to learn, the context may not provide enough opportunity or challenge to allow this motivation to take hold (Yeager et al., 2019).
The Current Study
Given high interest in socioemotional interventions as low-cost ways to improve achievement and labor market prospects for disadvantaged youth, but little evidence on the effectiveness of such interventions in the lowest resourced contexts, we tested the effect of a growth mindset intervention for South African township youths’ motivation and achievement in school. Specifically, we implemented computer-based growth mindset lessons in after-school programs for students attending the lowest resourced schools in the Western Cape. The intervention consisted of a 3-day growth mindset tutorial and two booster sessions.
We had three primary goals. The first was to test the psychometric properties and convergent validity of growth mindset measures with youth living in South African townships. The second was to test whether or not the growth mindset intervention changed growth mindset, mastery behaviors, math grades, and math test scores for students living in a very low resource context. We focused on these dependent variables because prior research supports a link between these outcomes and a growth mindset (Blackwell et al., 2007; Burnette et al., 2013; Outes et al., 2017; Sisk et al., 2018). The third and final goal was to test the cost-effectiveness and feasibility of implementing a growth mindset intervention in South African townships.
Method
Intervention materials and protocols, surveys, and analysis scripts, are available at https://osf.io/ucymr/. The data can be made available on request (due to confidentiality agreements).
Participants and Procedure
Eighth-, ninth-, and a few tenth-grade students from the YearBeyond after-school program participated in the study. All students were attending poorer resourced schools, and student participation in the YearBeyond program was voluntary. Parents chose whether to opt their children out of the current study or not. School participation was also voluntary, and interested schools were screened by YearBeyond to ensure that they had a sufficient number of volunteers and a computer lab. YearBeyond activities took place inside each school at the end of the regular school day. Typical YearBeyond activities involved around 2–4 hr of computer time per week; thus, students had exposure to computers prior to participating in the current investigation. The YearBeyond program is financially supported by the Western Cape Government and was run by the Department of the Premier at the time of the study. The program provides volunteer tutoring in literacy and math to students attending underserved schools. Visit https://www.yearbeyond.org, for more information about the YearBeyond program.
A total of 441 students completed some portion of the baseline survey and were randomized to the treatment (n = 239) or control (n = 202) condition. 1 Community unrest caused by teacher and taxi strikes and gang violence lead two schools to withdraw from the study before completing the intervention. In addition, disruptions delayed the intervention, causing it to straddle two school years, which contributed to additional student attrition due to student mobility. In total, 354 students (80.27% of those who completed the baseline survey; 62% female), from eight schools, completed the endline survey. The full analytic sample comprised students who were randomized at baseline, and completed both baseline and endline surveys (treatment n = 188; control n = 166).
Statistical power was determined with Optimal Design, an open-source software used for individual- and cluster-level randomized controlled trials (Spybrook et al., 2011). We calculated the number of students needed to detect a minimum standardized mean difference (i.e., effect size) between the treatment and control groups of 0.20 standard deviations (SDs). This effect size was informed by findings from prior research (Sisk et al., 2018; Yeager et al., 2019). We used a single-level trial design because students were randomized individually. We estimated 0.50 proportion of variance explained by covariates (e.g., baseline growth mindset) and used an α level of .05. With these criteria, we needed 400 students to have 80% power to detect an effect of 0.20 SDs. Notably, our final analytic sample fell below the target of 400 students, leaving our power at 75% to detect a 0.20 effect size (but 98% power to detect a 0.30 effect size).
Self-report questionnaires, a behavioral performance task, and math tests were administered during the after-school program at baseline, in June and July 2017. A pairwise matching randomization was performed with students who participated in the baseline to ensure balanced comparison groups. Stratified within grade and school, we used a nearest-neighbor matching technique (coarsened exact matching) based on students’ growth mindset index and math test scores at baseline. Students were then randomly assigned to the treatment or control group.
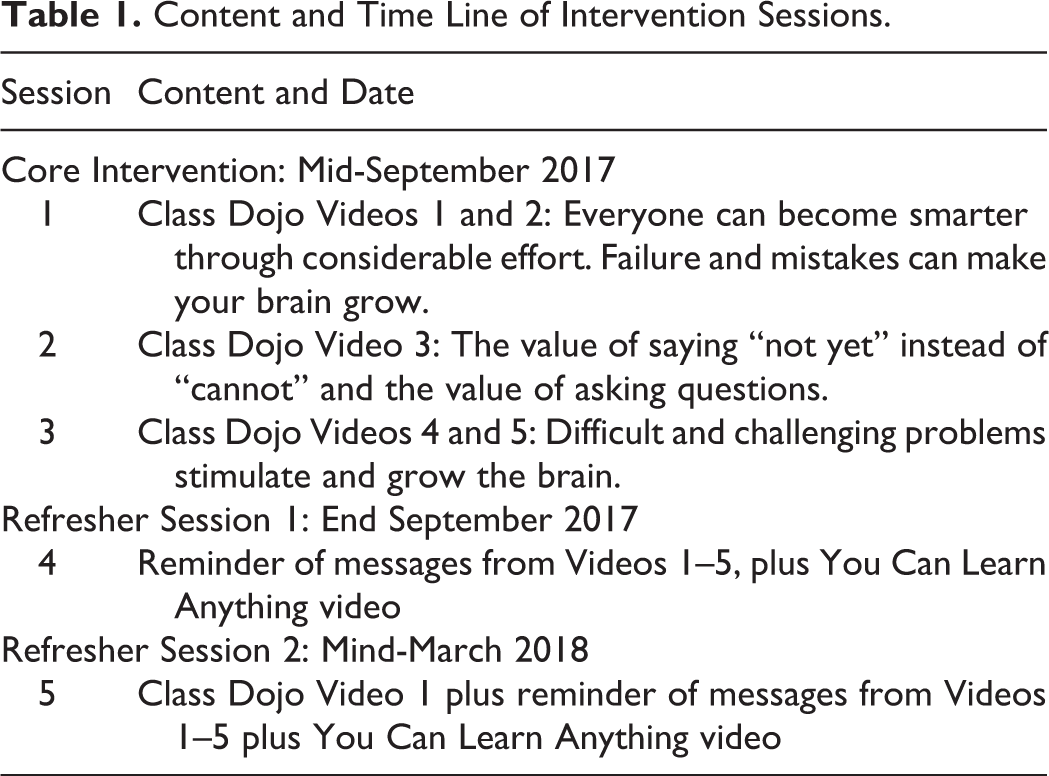
The intervention was administered approximately 2 months after baseline assessments. The core intervention comprised three 30-min sessions delivered individually on computers every 2 days at the after-school program. In total, students watched five, 3-min growth mindset videos created by Class Dojo (https://ideas.classdojo.com/b/growth-mindset; Class Twisted, 2016; Table 1). The videos feature nondescript cartoon monsters who teach growth mindset concepts through their struggles in school. After each video, students were asked to complete reflection questions designed to increase comprehension and internalization of the growth mindset messages, including saying-is-believing prompts that have been effective in Western contexts (e.g., Yeager et al., 2016). Approximately 2 weeks after the third session, and then again after 5 months, students completed two different booster sessions that reminded them of the primary messages of the videos and asked them to reflect again on the video content.
Content and Time Line of Intervention Sessions.
The control group followed the same procedure, but viewed and responded to questions about animal and nature videos (e.g., National Geographic content) that were matched for length with the Class Dojo videos. Treatment and control students used the computer lab at different times to mitigate spillover. Incentives such as lollipops and raffle drawings for larger prizes were provided in the treatment and control groups to encourage attendance throughout the study.
Approximately 6 months after the initial intervention session and 1 month after the second refresher, the endline questionnaires, performance task, and math tests were administered.
Measures
Growth mindset was assessed before and after the intervention with 3 items adapted from previous studies (e.g., Blackwell et al., 2007): “You can learn new things, but you cannot make yourself smarter,” “You cannot change how smart you are,” “How smart you are is something about you that you cannot change very much.” A fourth item was developed for this study: “People are born smart or not smart. This can’t be changed.” Based on previous work showing low reliability for agree–disagree scales in developing contexts (Laajaj & Macours, 2017), we used a new pictorial Likert-type scale (Figure 1). In a pilot of 210 American 13-year-olds recruited through Qualtrics, the new measure converged with a standard mindset measure (r = .61), mastery responses to challenge (r = .28), and self-report grades (r = .27).
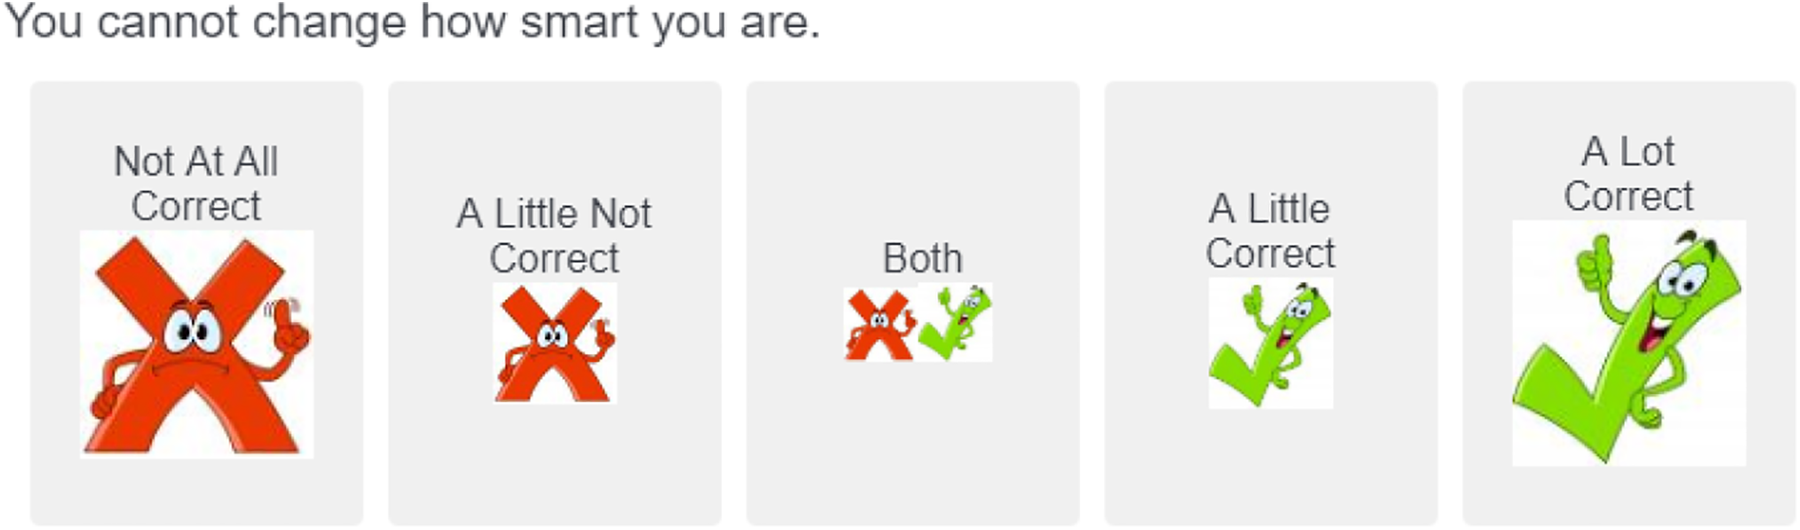
Alternative Likert-type scale for assessing beliefs used in the current study.
Beliefs about effort were assessed before and after the intervention using 5 items adapted from Blackwell et al. (2007). This scale showed very poor reliability (α = .34) and is not used in the current analyses.
Mastery behaviors were assessed with the Persistence, Resilience, Effort, and Challenge-seeking task (PERC; Porter et al., 2020), which is a performance measure of students’ mastery behaviors modeled after Mueller and Dweck’s Laboratory Task (1998). In PERC, students do several sets of Raven’s progressive matrices during which challenge-seeking (choice of difficult or easy puzzles), effort (time spent on medium-difficulty puzzles and tips), persistence (time on hard puzzles), and resilience (poststruggle accuracy) are assessed and combined to form a single indicator of mastery behaviors. A high PERC score indicates students sought challenge and maintained high engagement and striving throughout the task.
Math achievement was assessed in two ways. First, math tests tailored to each grade level by local test developers (Olico) were administered before and after the intervention. Second, postintervention math grades were provided by some schools. For 39% of the sample, schools provided final grades for 2017 (averaged for January–December 2017). For 59% of the sample, schools provided first term 2018 grades (averaged for January–March 2018). For 29% of the sample, schools provided both the 2017 and 2018 grades.
Analysis Approach
We conducted intent-to-treat (ITT) analyses to estimate the average treatment effect for students who were randomized at baseline, regardless of how many treatment sessions they received. We fit ordinary least squares regression models predicting each of four dependent variables from treatment status while controlling for school, grade level, and baseline outcome measures. We also clustered standard errors at the school level to account for nonindependence of outcomes for students who attended the same school.
In addition, because only 47% of treatment students attended all three of the core intervention sessions and low compliance may have diluted the intervention effects (Luca & Cole, 2017), we estimated the treatment-on-the-treated (TOT) 2 effects to test whether the intervention was effective for those who received the core intervention sessions. In this method, treatment assignment is considered an instrumental variable that is assumed to have a causal effect on an outcome through a second explanatory variable, such as complying with the treatment (Huang, 2018). For example, in a medical trial, the instrumental variable of being assigned to receive a new medicine is assumed to have an effect through the explanatory variable of taking the medicine. In our case, the instrumental variable of being randomized to the treatment group is assumed to have an effect through the explanatory variable of receiving the core treatment sessions. Thus, the TOT analyses estimate the impact of the intervention for students who received the core treatment messages, without potentially diluting the impact with students assigned to the treatment condition who did not receive the full treatment.
To estimate the TOT impact, we followed guidelines specified by the Institute for Education Sciences’ What Works Clearinghouse (2017) and fit two-stage least squares (2SLS) regressions using the ivregress command in STATA. This method fit two regression models for each outcome. The first model created an estimate of compliance by regressing the treatment assignment (the instrumental variable) and covariates on a dummy variable that indicated whether a student attended the three core treatment sessions or not (the explanatory variable). The second regression used the estimated compliance (the explanatory variable) to estimate the impact of the intervention for those who complied. The TOT models controlled for school, grade level, and baseline outcome variables, and used robust standard errors clustered at the school level.
Results
Can Growth Mindset Be Measured in South African Adolescents?
Exploratory factor analysis of the baseline growth mindset items supported a single-factor structure: The first eigenvalue was 1.72, and the second and third were 0.92 and 0.77, respectively. Estimation of a single-factor model using maximum likelihood confirmatory factor analysis had adequate fit to the data (comparative fit index [CFI] = 0.97; standardized root mean residual [SRMR] = 0.03; root mean square approximation [RMSEA] = 0.07), and item loadings were adequate (Table 2; Clark & Watson, 2019). Baseline items had an internal reliability coefficient of α = .56.
Factor Loadings of Baseline and Endline Growth Mindset Items.
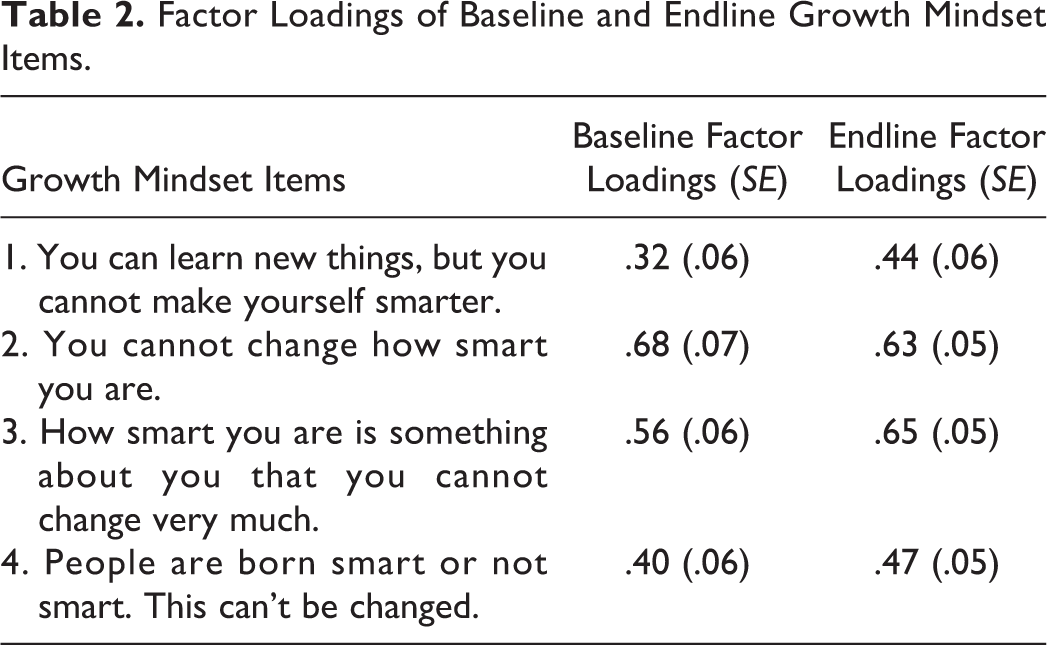
Endline items followed the same pattern. Exploratory factor analysis again supported a single factor (eigenvalues 1, 2, and 3 were 1.91, 0.80, and 0.75). A single-factor confirmatory model had adequate fit (CFI = .97; SRMR = .03; RMSEA = .09) and adequate item loadings (Table 2; Clark & Watson, 2019). Endline items had an internal reliability coefficient of α = .63.
As seen in Table 3, we also found evidence of strong longitudinal measurement invariance. The fit of the fully constrained model (factor loadings and means in the baseline and endline measures fixed to equal one another) was roughly equivalent to that of the less constrained models.
Longitudinal Measurement Invariance of Growth Mindset Measures.
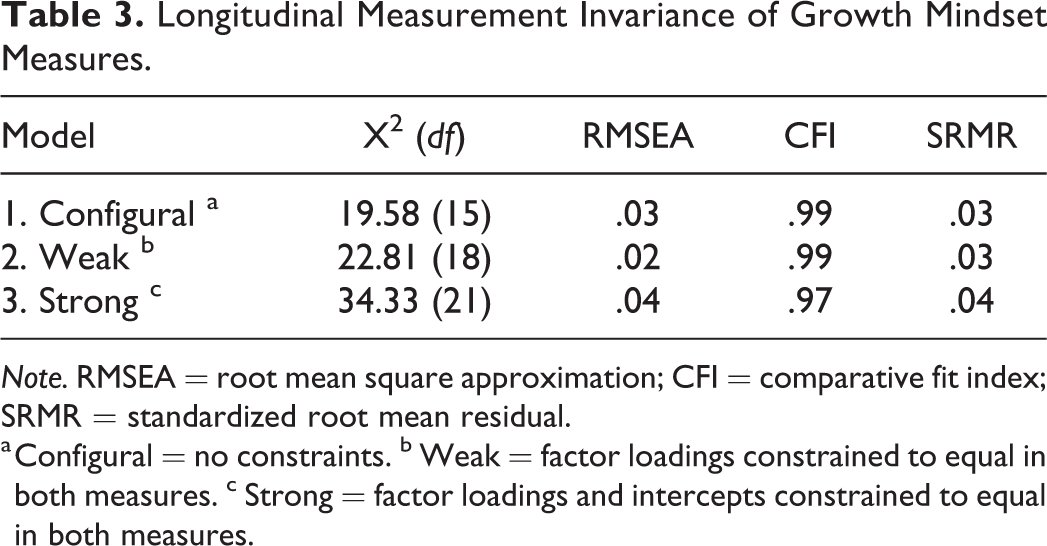
Note. RMSEA = root mean square approximation; CFI = comparative fit index; SRMR = standardized root mean residual.
a Configural = no constraints. b Weak = factor loadings constrained to equal in both measures. c Strong = factor loadings and intercepts constrained to equal in both measures.
In addition, we found evidence of cross-cultural invariance of the growth mindset measure. We tested approximate cross-cultural measurement invariance using Bayesian structural equation modeling by comparing the factor structure of the growth mindset items among South African adolescents to a sample of 210 American adolescents recruited through Qualtrics. The posterior predictive probability was nonsignificant, demonstrating invariance: 0.14 (95% credible intervals: −7.46, 35.63). All of the item intercepts and factor loadings were invariant. We did, however, find a standardized latent mean difference, which showed that South African youth had lower mean levels of growth mindset than U.S. youth: latent d = −1.35.
Finally, we tested the convergent validity of the baseline growth mindset measure, finding the expected pattern that South African students with a stronger growth mindset had higher mastery behaviors as assessed by the PERC task (r = .10, p = .04) and higher math test scores (r = .19, p < .001).
Did Students Engage With the Intervention and Control Activities?
We asked students to rate “how much did you enjoy the activities with the Mojo videos (for the treatment group)/animal videos (for the control group),” from 1 = did not enjoy at all to 5 = enjoyed a lot. Enjoyment was high in both the treatment, M = 4.52, SD = 1.00, and control groups, M = 4.56, SD = .79, t(241) = .32, p = .748. High enjoyment suggests the activities were developmentally appropriate and engaging. Responses to the reflection questions provided evidence that students were processing the material. For example, when asked how they would encourage a younger student to take on challenging work, responses included: “Doing challenging work makes you intelligent and you get more information because if you keep on learning the same stuff there is nothing that you are going to learn”; “when you try challenging work you grow and you get to know the things that you do not know”; and “It is important to try new challenges because it helps your brain work better and think wisely…When you try new challenges that will help you do incredible things in [the] future.”
Is a Growth Mindset Intervention Effective for South African Adolescents?
Baseline equivalence of the analytical sample
The treatment and control students in the analytical sample (defined as students having both baseline and endline data) were balanced on growth mindset, mastery behavior, and math test scores at baseline (Table 4; see Table S1 for detailed sample sizes and effect sizes).
Means, SDs, and t tests (To Test Baseline Balance) of Main Study Variables in the Analytic Sample at Baseline.
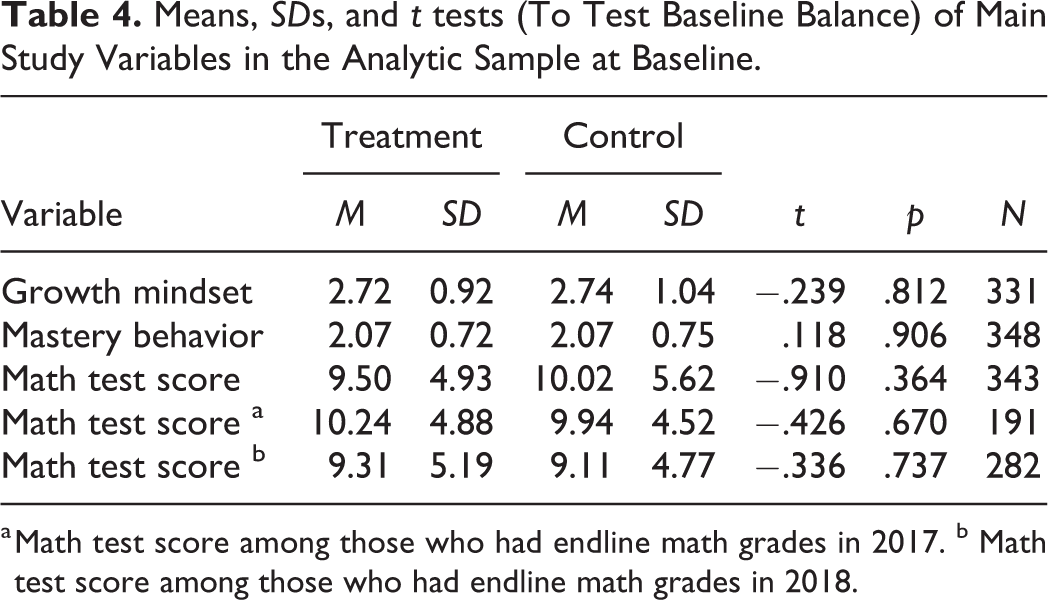
a Math test score among those who had endline math grades in 2017. b Math test score among those who had endline math grades in 2018.
Did the intervention change growth mindset, mastery behavior, or math test scores?
Results from the final regression models are summarized in Table 5, and detailed regression results are available in the Supplementary Materials (Tables S3–S6). The ITT analyses did not support evidence of a treatment effect on growth mindset, mastery behaviors, or math test scores. However, the TOT analyses suggested the intervention was successful in boosting growth mindset among those who received the three core intervention sessions (Table 5; Table S3). The 2SLS regression showed that receiving the core treatment increased growth mindset by 0.322 SDs (SE = 0.158, z = 2.04, p = .041, CI [0.013, 0.632]). There was no evidence of an intervention effect on mastery behaviors or math test scores in treatment-on-the-treated analyses (Table 5; Tables S3–S4).
Regression Analyses in Intent-to-Treat (ITT) and Treatment-on-the-Treated (TOT) Models Testing the Intervention’s Effect on Dependent Variables.
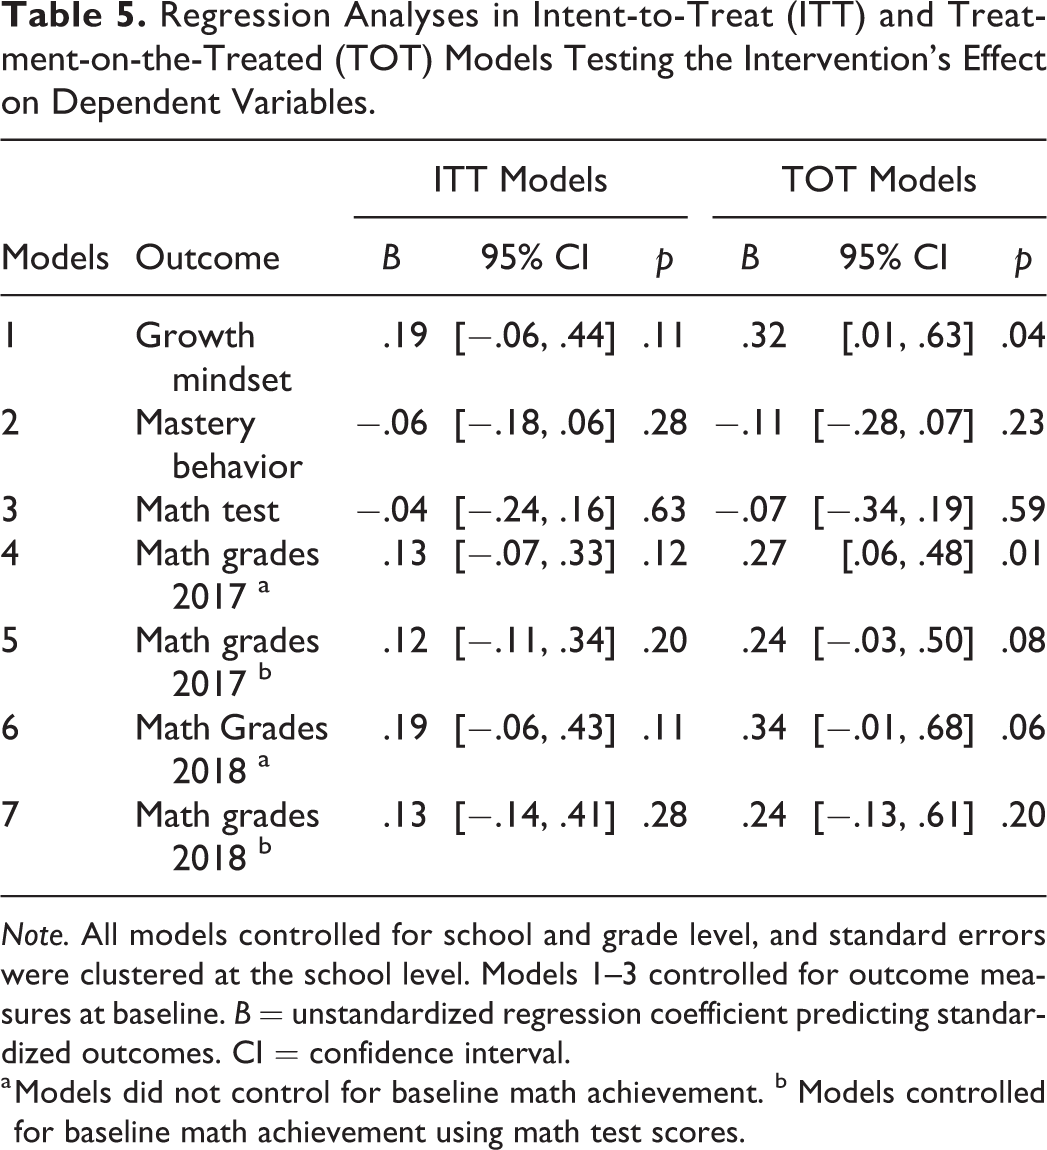
Note. All models controlled for school and grade level, and standard errors were clustered at the school level. Models 1–3 controlled for outcome measures at baseline. B = unstandardized regression coefficient predicting standardized outcomes. CI = confidence interval.
a Models did not control for baseline math achievement. b Models controlled for baseline math achievement using math test scores.
Did the intervention shape math grades?
The ITT analyses did not support evidence of a treatment effect on math grades. However, the TOT analyses suggested the intervention boosted math grades for those who received the core intervention sessions relative to those in the control group (Table 5; Table S5). The 2SLS regression showed that for students who received the core intervention, 2017 grades increased by 0.271 SD relative to the control group (SE = 0.107, z = 2.53, p = .011, 95% CI [0.061, 0.480]) and 2018 grades increased by 0.336 SD relative to the control group (SE = 0.176, z = 1.92, p = .055, 95% CI [−0.008, 0.681]). Adding a control for baseline math ability (using the baseline math test scores because we did not have access to baseline grades) reduced the effect on 2017 grades (0.236 SD, SE = 0.136, z =1.74, p = .082, 95% CI [−0.030, 0.503]) and 2018 grades (0.240 SD, SE = 0.188, t = 1.29, p = .197, 95% CI [−0.126, 0.610]), though the reduced effect sizes remained comparable to effects observed in previous research (Sisk et al., 2018; Yeager et al., 2019).
Cost-Effectiveness
A rough calculation showed that the intervention cost approximately R31 (US$2.2) per high school student if we used existing internal capacity to implement (e.g., current teachers). Focusing on the higher effect sizes from the TOT analyses (the impact for those that attended the three core intervention sessions), the cost was reduced to R4.4 (31 U.S. cents) for each point increase in grades.
Discussion
In the current study, we tested a growth mindset intervention for students attending low resource schools in South Africa. We found mixed evidence of the intervention’s effect. The intervention was successful in boosting students’ growth mindset and showed promise in shaping math grades, but only for those who received the core intervention sessions. In contrast, we failed to find effects on mastery behaviors and math test scores, and there was no evidence for the intervention’s effect in ITT analyses.
Results should be contextualized in light of challenges encountered while administering the intervention and limitations of the study. First, several factors disrupted student attendance, resulting in highly variable compliance: 47% of participants attended all three core treatment sessions, and only 14% attended all five sessions (three core intervention sessions and two booster sessions). Factors that disrupted attendance included community unrest, strikes, gang violence, children’s involvement in other after-school activities, parents needing children home to complete chores, and parents requesting children come home after school because of safety concerns. The intervention was already brief, and receiving less than the intended dosage likely diluted its effect. Second, attrition throughout the study meant that our final analytical sample was not adequately powered to detect effect sizes that have been observed in prior research. Loss of statistical power was also worsened for key dependent variables like math grades because some schools did not share grade data.
Third, disruptions that occurred over the course of the study meant that we were not able to administer more proximal endline measures (i.e., 2 weeks after the intervention) as originally planned. The delay in measurement may have diluted effects on mastery behaviors in particular, given that performance task measures are less stable over time than questionnaire and achievement measures (Enkavi et al., 2019). Disruptions also extended the study beyond the original time line, causing it to straddle two school years, which further exacerbated attrition because some students moved or dropped out of school after the first year of the study.
Fourth, certain schools experienced significant technical challenges including lags in internet connectivity due to slow connections. Although we did our best to anticipate and preempt these challenges (e.g., providing off-line versions of the intervention sessions, preloading sessions into the off-line Qualtrics app), technical difficulties may have disrupted the intervention experience for some learners.
Fifth, the math tests we administered were based on Western Cape grade-level standards but were not tailored to the students enrolled in the study. Given that our sample attended low resource schools, and that South African students from low resource schools earned scores half as high as those from better resourced schools in a national assessment of math achievement (Reddy et al., 2006), students in our sample were likely behind state standards. Accordingly, we do not know if students were taught the math that was on the tests we administered. In the absence of relevant math instruction between the baseline and endline assessments, there is little reason to expect a growth mindset intervention to increase scores on these math tests.
However, despite the challenges and limitations, we observed intervention effects on growth mindset in TOT analyses. We also observed promising effects on math grades for students who received the core intervention (0.24 SDs), though the confidence intervals around this effect could not rule out a null effect. Effects were comparable to those observed in prior research. A recent nationally representative study of U.S. high school students found a growth mindset intervention increased grade point average for low-achieving students by .11 SDs (Yeager et al., 2019). Similarly, a recent meta-analysis found an overall effect size of growth mindset interventions on academic achievement of 0.08 SDs, but for samples from low socioeconomic (SES) households, the impact was larger (0.34 SDs). Thus, our findings are most consistent with previous research conducted with low SES samples. Moreover, cost-effectiveness analysis suggested the intervention was low cost and could therefore provide a feasible approach to intervening in contexts where resources are limited.
The current study also suggests applications for future research. For interventions such as this to be effective, feasible, and sustainable in similar contexts, a willing and capable local partner is required to champion the buy-in, and roll-out of the program. In our study, the partnership with the provincial government made feasible the buy-in from school principals, and collection of administrative data. Even with support from local partners, we encountered challenges over the course of the study that limited the evidence we were able to collect. Inconsistent intervention compliance and high attrition contributed to uncertainty around our effect estimates, leaving us with some promising effects that were nevertheless inconclusive. Future researchers working in similar contexts should over-recruit to ensure sufficient statistical power given likely attrition and ensure full implementation of interventions.
Conclusion
Overall, we found promising evidence for the impact of a growth mindset intervention in a low resource environment, suffering significant but realistic implementation challenges for its context. We observed improvements in growth mindset and promising results for math grades among students who received the full intervention, though we failed to observe effects on mastery behaviors and math test scores. Although additional research is needed given the mixed evidence obtained in the current study, the results are suggestive that even in a disadvantaged context, the message that one’s abilities and intelligence can grow is motivating and shapes important outcomes.
Supplemental Material
Supplementary_Online_Materials - Changing Learner Beliefs in South African Townships: An Evaluation of a Growth Mindset Intervention
Supplementary_Online_Materials for Changing Learner Beliefs in South African Townships: An Evaluation of a Growth Mindset Intervention by Tenelle Porter, Ammaarah Martinus, Rebecca Ross, Cameron F. Cyster and Kali Trzesniewski in Social Psychological and Personality Science
Footnotes
Acknowledgments
We would like to thank the YearBeyond Programme, the After School Programme, the Western Cape Education Department, and the schools involved in the study, without whom this work would not have been possible.
Declaration of Conflicting Interests
The author(s) declared no potential conflicts of interest with respect to the research, authorship, and/or publication of this article.
Funding
The author(s) disclosed receipt of the following financial support for the research, authorship, and/or publication of this article: This research was supported by R305A150142 from the Institute for Education Sciences.
Supplemental Material
The supplemental material is available in the online version of the article.
Notes
References
Supplementary Material
Please find the following supplemental material available below.
For Open Access articles published under a Creative Commons License, all supplemental material carries the same license as the article it is associated with.
For non-Open Access articles published, all supplemental material carries a non-exclusive license, and permission requests for re-use of supplemental material or any part of supplemental material shall be sent directly to the copyright owner as specified in the copyright notice associated with the article.