



Abstract
People seek out and interpret political information in self-serving ways. In four experiments, we show that people are similarly self-serving in the political information they share with others. Participants learned about positive and negative effects of increasing the minimum wage (in Studies 1–3) or of banning assault weapons (Study 4). They then indicated how likely they would be to mention each effect to close others. Participants were more inclined to share information that was consistent with their political orientation than information that was not. This effect persisted even when participants believed the information, suggesting that selective communication is not just a reflection of motivated skepticism. We also observed ideological differences. Liberals were most biased with their political opponents, whereas conservatives were most biased with their political allies. This biased information sharing could distort the flow of political information through social networks in ways that exacerbate political polarization.
Democracies rely on voters to make decisions based on accurate information—about the state of the world, the behavior of political actors, and the impacts of policies. Without this knowledge, voters are not equipped to identify the problems their government ought to solve, hold politicians accountable for their mistakes, or select candidates whose proposed policies will yield more benefits than costs.
Unfortunately, political biases limit and distort the information that voters possess. People engage in selective exposure, seeking out news sources that confirm their existing beliefs and avoiding sources that might challenge those beliefs (Redlawsk, 2002; Stroud, 2011). When people cannot avoid exposure to counterattitudinal information, they often find reasons to doubt its veracity, engaging in motivated reasoning (Kunda, 1990; Lodge & Taber, 2013; Lord et al., 1979). Individuals are biased at nearly every conceivable stage of their consumption and processing of political information—in what they read, hear, and remember and in what they finally believe. These biases pose a major obstacle to effective democratic decision making.
We find that people are also biased in how they communicate information to others, compounding the problems posed by selective exposure and motivated reasoning. We call this phenomenon selective communication: greater willingness to communicate information that is ideology-, identity-, or attitude-consistent over information that is ideology-, identity-, or attitude-inconsistent.
Evidence of Selective Communication
Studies of information sharing online suggest that people communicate political information selectively. Social media users tend to relay information from sources that share their political views (Bakshy et al., 2015; Barberá et al., 2015; Liang, 2018). People also tend to share information whose content supports their political views or affiliations (Arendt et al., 2016; Pogorelskiy & Shum, 2019; Shin & Thorson, 2017). This bias is not limited to online behavior. In live group discussions, people more often share information that supports their existing preferences than information that would undermine their preferences (Faulmüller et al., 2012).
This evidence of selective communication benefits from ecological validity, but it does not distinguish people’s willingness to communicate information from their willingness to believe it. This distinction matters. Suppose people are selective in what they believe but freely communicate any information that they accept as true. In this case, selective communication poses no unique problem, and motivated skepticism is the main barrier to an unbiased flow of information from person to person. Suppose, in contrast, that people are selective both in what they believe and in which beliefs they are willing to communicate. In this case, selective communication becomes an important problem in its own right. Forcing people to accept facts that challenge their worldview would not keep them from presenting a biased subset of those facts to others.
Consistent with the latter possibility, people do not only communicate political information with the goal of transmitting facts to others. On the contrary, people can communicate political information to express their political identities (Coppini et al., 2017; Shao, 2009; Shin & Thorson, 2017), form and maintain social connections with like-minded others (An et al., 2014), and convert others to their own point of view (Weeks et al., 2017). There is therefore good reason to suspect that people may selectively communicate information that is compatible with their political attitudes and identities even when they are led to believe incompatible information that is objectively true.
Research Overview and Hypotheses
The aim of the present research is to determine whether and why individuals’ political predispositions bias the information they communicate to other people. Our hypotheses are as follows.
Selective Communication Hypothesis
We predict that people are more willing to share information that supports their political identities and attitudes than they are to share information that challenges or undermines those identities or attitudes. To test this idea, we present participants with pieces of information that either affirms or challenges their identities and attitudes and ask them how likely they would be to communicate each piece of information they read. In the first three studies, participants read information about the pros and cons of increasing the minimum wage. In the fourth and final study, participants read about the pros and cons of banning assault weapons.
Beyond Belief Hypothesis
We predict that people will be more willing to share information that supports their political ideology, policy attitudes, and/or partisan affiliation than information that does the opposite, even when they believe both types of information to be true. To test this hypothesis, we measured participants’ belief in each piece of information in addition to their willingness to communicate it.
Additional Analyses: Ideological Differences in When Communication Is Biased
We also examined the circumstances in which selective communication is most and least pronounced through a series of moderating variables. We were especially interested in whether participants showed more or less selective communication with others who agreed vs. disagreed with them about politics. We found that the answer to this question depended on participant ideology. We report this ideological asymmetry below. Other moderation analyses yielded results that were difficult to interpret without additional studies and will be reported in a separate article.
Scope of the Current Study
We have described selective communication as a general phenomenon—an inclination individuals have to share information that affirms their existing political ideologies, policy attitudes, or identities. Accordingly, we measured ideology, policy attitudes, and partisanship separately and tested each as a potential basis for selective communication to test the generalizability of our hypotheses across multiple operationalizations of political bias. Moreover, by presenting participants with information about the minimum wage (in Studies 1–3) and gun control (in Study 4), we avoid limiting our investigation to social or economic issues. Because we are especially interested in the hazards that selective communication may pose to voters’ capacity to make informed decisions, we chose to focus on political issues that people would plausibly support or oppose depending on the information they receive and believe (e.g., whether increasing the minimum wage improves individuals’ standard of living, whether banning assault weapons reduces crime, death, and violence).
Method
For all experiments, we report all measures, conditions, and data exclusions. See the Supplemental Material for verbatim materials, procedural differences between studies, rationales for planned sample sizes, and the results of planned analyses and robustness checks not reported below (https://osf.io/v742s/?view_only=1e7c1d6837524b049f70d63a16563232).
Participants
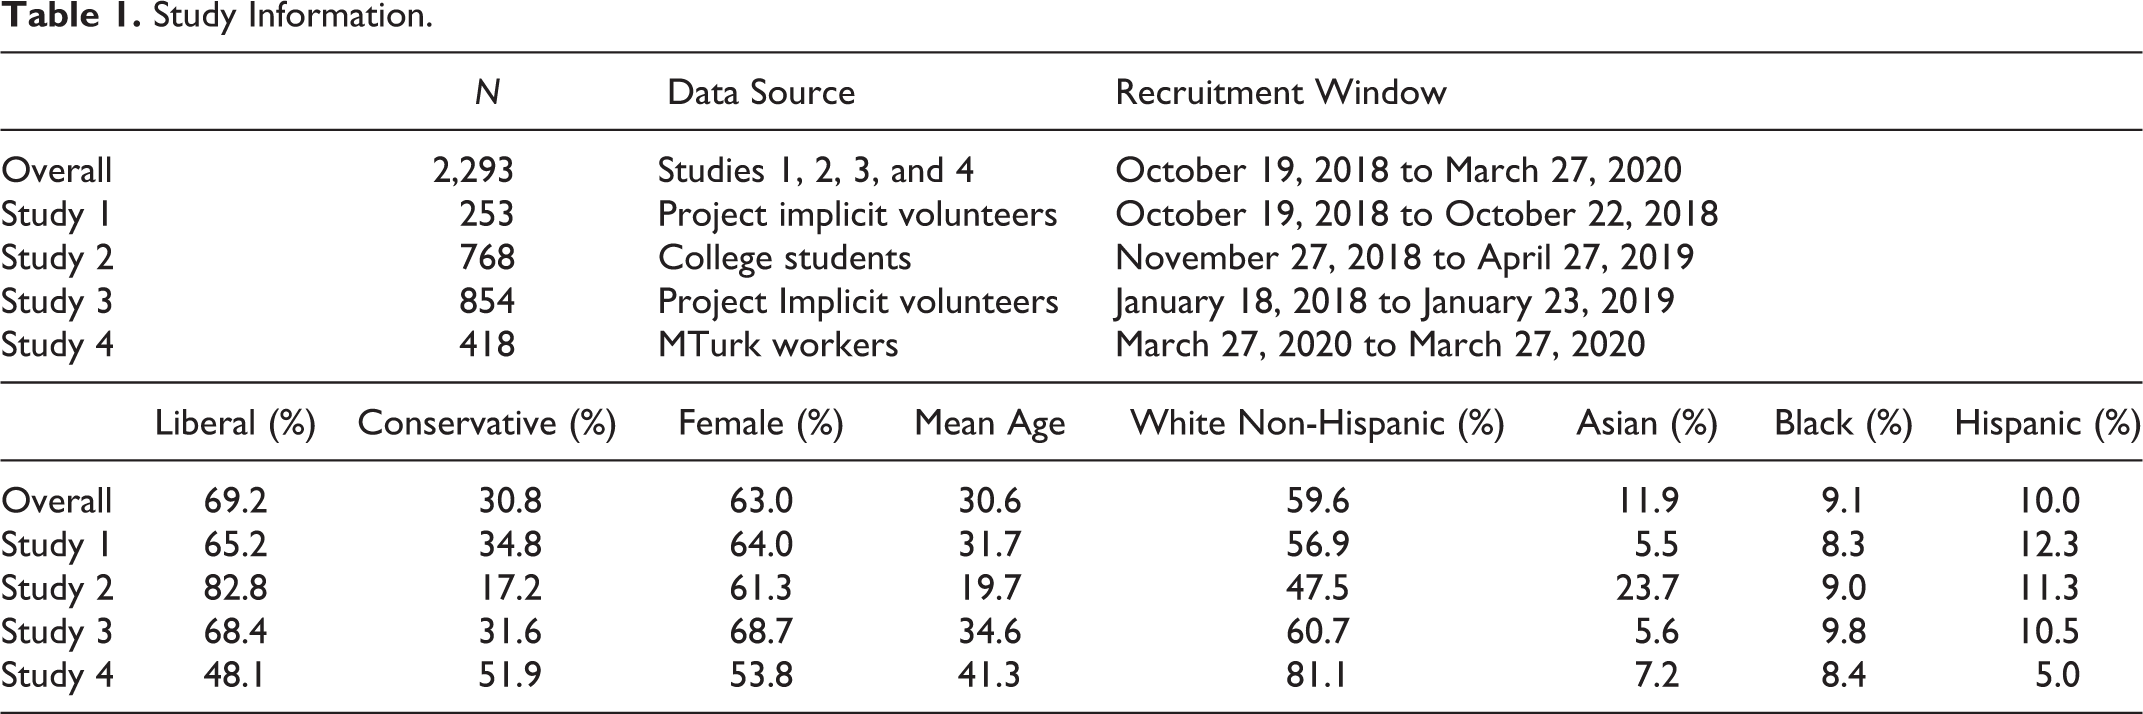
We recruited participants for four studies with similar procedures and materials. Studies 1 and 3 consisted of volunteers at Project Implicit who were U.S. citizens or residents (https://implicit.harvard.edu); Study 2 consisted of undergraduates at Washington University in St. Louis. Study 4 was conducted on Amazon’s Mechanical Turk (MTurk). In Study 4, liberal and conservative participants were recruited through separate MTurk tasks to create an ideologically balanced sample. Demographic data are provided in Table 1.
Study Information.
Procedure
Participants were told that we were “interested in the information that people share with other people in their lives.” They named three people whom they feel close to, answered political orientation questions, then read a fictitious news article split into multiple pages. All procedural differences between studies are summarized in Table 2 and detailed in the Supplemental Material.
Differences in Procedure Across Studies.
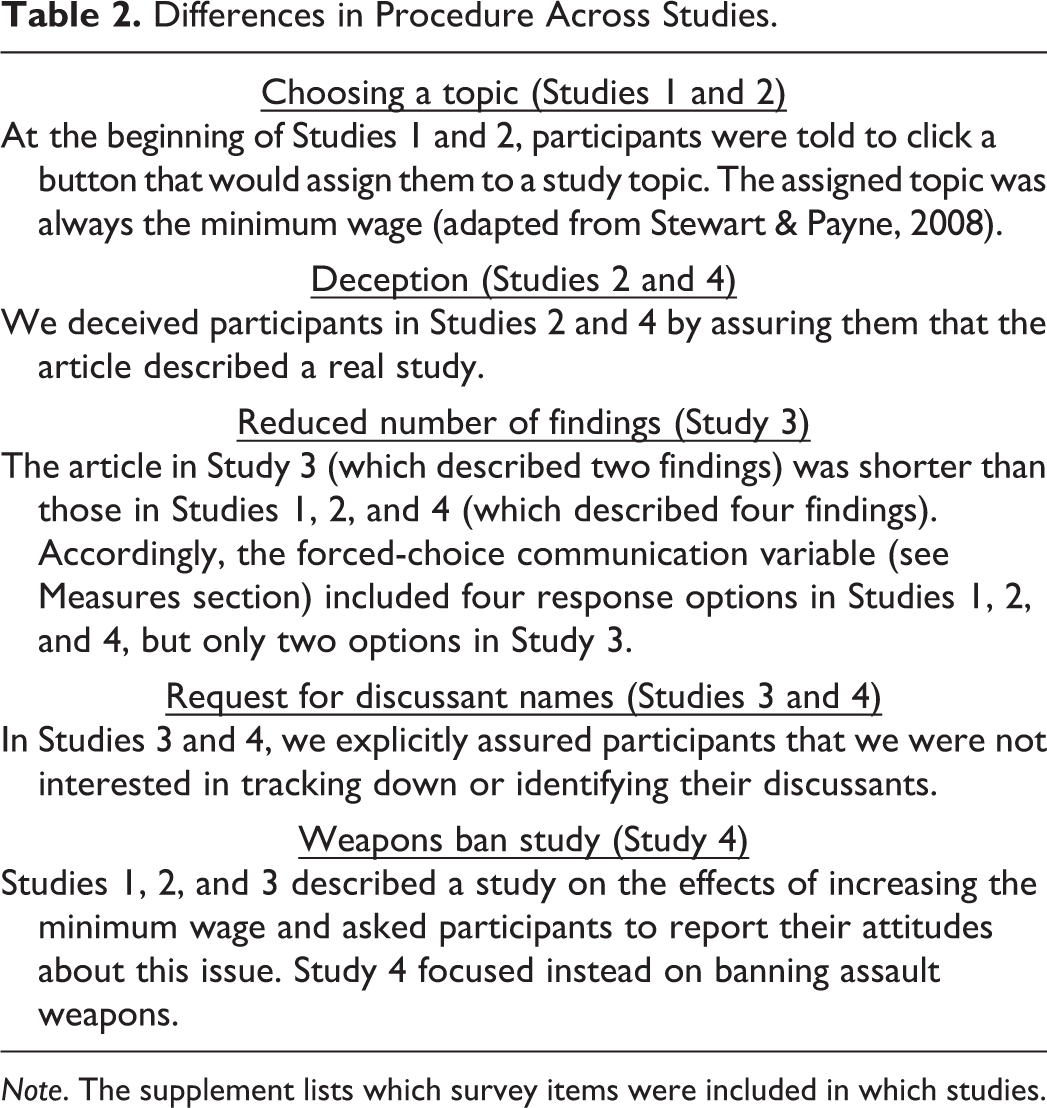
Note. The supplement lists which survey items were included in which studies.
Article contents
In Studies 1 and 2, the article described the effects of increasing the minimum wage on four outcomes that we assumed participants would agree to be objectively good or bad: median income, unemployment, the price of basic goods and services, and the affordability of housing for poor families. The article’s findings varied randomly across participants, such that every participant read about two good and two bad effects. For example, some participants read that increasing the minimum wage not only increased income and reduced unemployment but also increased prices of basic goods and the cost of housing. Which findings were “good” versus “bad” were randomized across participants, such that increasing the minimum wage could have been good or bad for any outcome.
The only difference in the article used in Study 3 was that participants read about only two effects of increasing the minimum wage—one good and one bad—drawn randomly from the set of effects we used in Studies 1 and 2.
The article in Study 4 resembled those in Studies 1 and 2; however, participants in Study 4 read about the effects of banning assault weapons on incidents of gun-related crime, gun-related accidental injuries, illegal gun sales, and injuries sustained by police officers in the line of duty. Once again, each participant read about two “good” effects and two “bad” effects of banning assault weapons, though we randomized which effects were good versus bad across participants.
In Studies 1 and 3, the article was described as “based on real articles.” In Studies 2 and 4, participants were deceived and told that the study was real. The presence or absence of deception did not predict participants’ average belief in the findings (b = .01, SE = .01, p = .449). Participants in all studies were fully debriefed and told the article was fictitious.
Measuring reactions to the article
In all studies, the article was split across multiple pages. The first page introduced the subject of the article: a scientific study of the effects of increasing the minimum wage or the effects of banning assault weapons. This introduction assured participants that the study it described was large, credible, and conducted by a nonpartisan, nonprofit organization. Each subsequent page displayed one of the findings that the participant had been assigned to read. Finding the order was randomized. Participants answered questions about each finding one at a time. For example, if a participant first read that increasing the minimum wage tended to increase unemployment, she next indicated how likely she would be to mention that finding to each of her discussants, then whether she personally believed that increasing the minimum wage increased or decreased unemployment (i.e., whether she believed the finding). Then, the participant proceeded to read about the next finding and answer questions about that. After reading about all of the findings, the participants answered our forced-choice communication question.
Remaining questions
Finally, participants completed questions about their political attitudes, questions about the people they had named, and (in Studies 1–3) an implicit measure of party identification.
Measures
Assume all measures were included in all studies unless otherwise noted. For all measures of political attitudes and identities, higher scores indicate more right-wing responses.
Discussant names
Participants were asked to name three people they feel close to. For the first name, we said “anyone who comes to mind is fine.” We then asked for one person who tends to agree with them about politics and one person who tends to disagree. We excluded participants who provided no usable names (see Supplemental Material).
Ideology
Participants reported their political ideology and their perceptions of their discussants’ ideology on a 7-point scale (from very liberal, to moderate, to very conservative). Midpoint responders were asked which side they would choose if they had to. We combined responses to the 7-point scale and the midpoint branched item to create an 8-point ideology score for the participant and each discussant they named.
Policy attitude
Participants reported their policy attitude (toward increasing the minimum wage or banning assault weapons) and each of their discussants’ policy positions using a 7-point scale (from strongly support to strongly oppose). Midpoint responders were branched and forced to choose a side. Participants reported their attitude both before and after reading the article. Analyses use the prearticle attitude unless otherwise specified.
Explicit party identification
Participants reported only their own party identification, using a series of branching questions to create a 6-point scale ranging from strong Democrat to Strong Republican (Krosnick & Berent, 1993).
Implicit party identification 1
In Studies 1–3, we measured participants’ implicit identification with the Republican versus Democratic parties using a 5-block identification Implicit Association Test (IAT; Greenwald et al., 1998). More positive IAT D scores indicated faster responding in sorting the self with the Republican Party over the Democratic Party.
Communication likelihood
Participants were asked, “If the topic of [the minimum wage/gun bans] came up in conversation, how likely is it that you would mention this finding to [discussant name]” for each of their discussants. The five response options ranged from very unlikely to very likely.
Communication forced choice
After reading all findings, participants indicated which single finding they would share with all of their discussants, if they had to choose.
Belief in information
After reading about each finding, participants were asked whether they thought the focal policy (i.e., increasing the minimum wage or banning assault weapons) increased or decreased the outcome described in the finding (e.g., unemployment, incidents of gun violence). Responses were scored such that higher values indicated stronger belief in the finding participants had read about.
Additional variables
We measured other variables to identify motives underlying selective communication, including the centrality of participants’ political attitudes and ideology to their identity, characteristics of participants’ discussants, and information about the impressions and relationships that participants desire to cultivate with their discussants. These measures will be used in a separate investigation. All measures are described in the Supplemental Material.
Preregistration
We preregistered our procedures, materials, and analyses at https://osf.io/v742s/?view_only=1e7c1d6837524b049f70d63a16563232. We departed from our preregistration in three notable ways. First, we combined data from all four studies in an individual participant data (IPD) meta-analysis (Riley et al., 2010) to simplify reporting. This analysis was only included in our preregistration for Study 4. That said, evidence for the selective communication and beyond belief hypotheses was consistent across all four studies. We summarize key analyses across studies in the Supplemental Material.
Second, we preregistered analyses examining moderators of the selective communication effect. These results were inconsistent across studies and do not permit strong conclusions about the motives which account for selective communication. We will report the results of those analyses and follow-up studies in a separate article. In the current article, we report only one such analysis, comparing the extent of liberals’ and conservatives’ selective communication with same- versus opposite-ideology discussants. This analysis yielded an unanticipated result in Study 1 that replicated in all studies and our IPD meta-analysis.
Finally, we detail some of our preregistered analyses and robustness checks in the Supplemental Material due to space constraints. In the manuscript, we focus on participants’ willingness to communicate information consistent (vs. inconsistent) with their ideology, coded dichotomously. In the Supplemental Material, we find that we obtain the same result across other preregistered model specifications, including (1) when we code “consistency” as a continuous rather than a dichotomous variable and (2) when we substitute policy attitudes, explicit partisanship, or implicit partisanship for ideology. Our four indices of political orientation were related but distinct (.42 ≤ rs ≤ .82), so these supplemental tests provided nonredundant but interdependent evidence of political bias. Analyses reported in the Supplemental Material also address two potential measurement issues: (1) We show that our conclusions are unaffected by participants (11%) who changed their attitudes during the study and (2) we show that our measure of “communication likelihood” specifically assesses the likelihood that participants would mention the information from the article (rather than the likelihood that participants would talk to their discussants in the first place).
Results
Note About Variable Coding and Interpreting Coefficients
Unless otherwise specified, all variables were scaled to range from 0 to 1. This “percent of maximum possible” scoring method (Cohen et al., 1999) facilitates the interpretation of regression coefficients, which will indicate the proportion change in an outcome variable associated with a 100% change in the predictor variable from its minimum to its maximum when all other predictors are held constant at their minima.
Selective Communication
We found robust support for the selective communication hypothesis. First, we examined responses to our forced-choice communication measure—a single item that asked which single piece of information participants would share if they had to choose among those they had read. We found that 69.8% of respondents (N = 2,293) chose an ideology-consistent piece of information. The 95% confidence interval (CI) for this proportion ranges from 68.8% to 70.8%, suggesting significant evidence of bias. This pattern was present across the ideological divide but was more pronounced among liberals than conservatives, χ2(1) = 15.56, p < .001; 72.3% of liberals chose to share the positive effects of wage increases or assault weapons bans, and 63.9% of conservatives chose to share the negative effects of the same policies (see Figure 1).

Summary of forced-choice communication decisions, collapsing across all four studies.
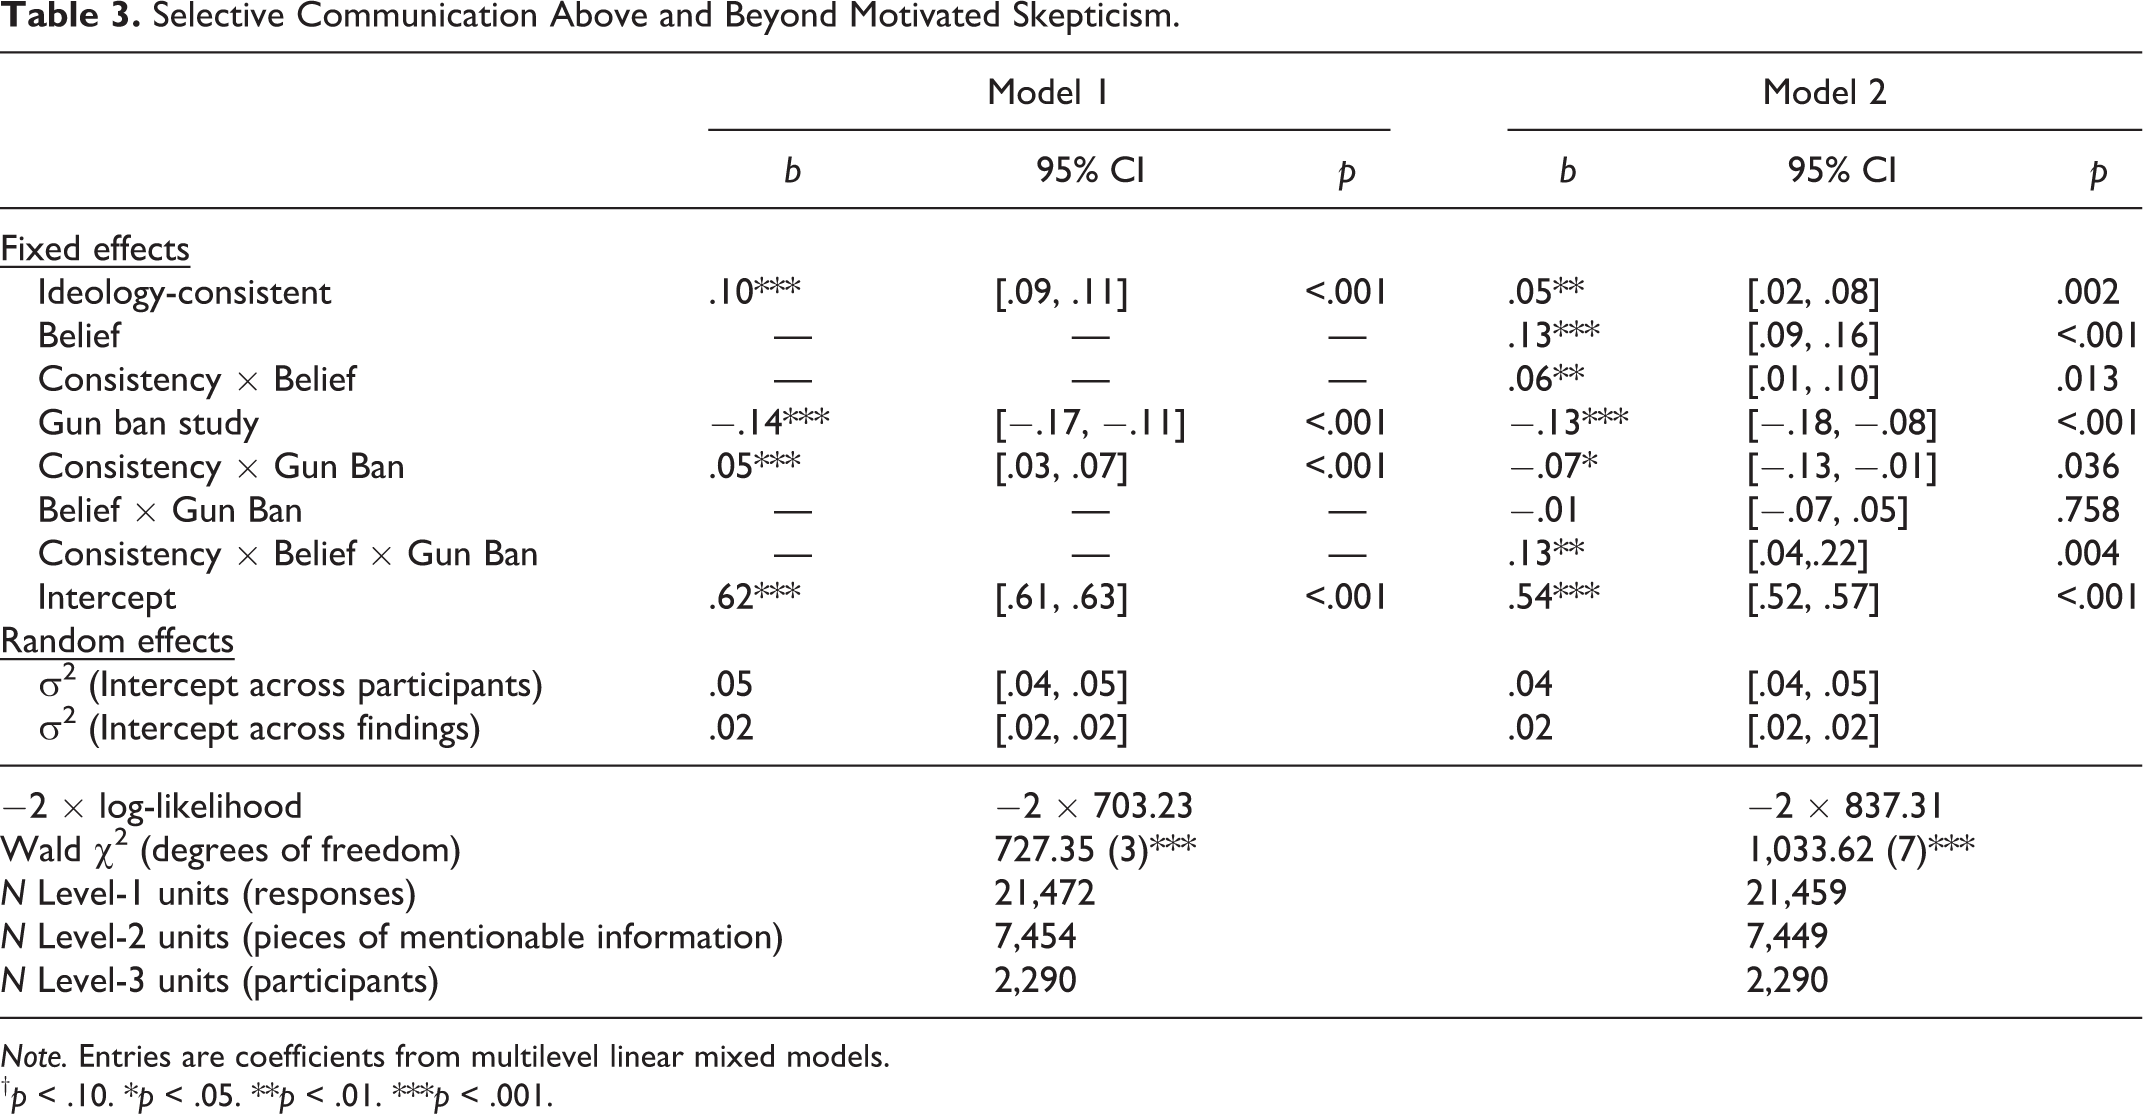
We next examined participants’ self-reported willingness to communicate each piece of information to each of their discussants—an item which each participant answered between 6 and 12 times, given that each participant named three discussants and read either two or four pieces of information. We estimated a mixed linear model predicting communication likelihood from a binary indicator for ideological consistency: 0 for findings inconsistent with respondents’ ideology, 1 for ideology-consistent findings. We also included a binary indicator for the focal policy across studies (0 for the minimum wage and 1 for gun bans) and the interaction between these two indicators. This permits us to observe differences in selective communication across policy domains (as planned in our Study 4 preregistration). This was a multilevel model, with each individual’s decision to communicate as the Level-1 unit, finding a topic (e.g., housing affordability, income, incidents of gun violence, illegal gun sales) as the Level-2 grouping unit, and participant as the Level-3 grouping unit. We allowed the intercept to vary randomly across findings and across participants to account for the interdependence of observations; some participants may have been more eager to communicate certain findings (or all findings) than others. Estimates for this model (Model 1) are provided in Table 3. The first-order coefficients reflect the “simple effect” of each indicator variable when the other is 0. Given that the dependent variable ranges from 0 to 1, the coefficient for ideological consistency (b = .10) indicates that participants in the minimum wage studies were more inclined to mention ideology-consistent findings than ideology-inconsistent findings by about 10% of the scale’s full range. The significant interaction term indicates that this effect of ideological consistency was stronger in Study 4, the gun ban study. Adding the interaction coefficient (b = .04) to the first-order coefficient for ideological consistency (b = .10) yields the simple effect estimate: about 14% of the scale’s full range, 95% CI: [.12, .16]. In short, participants showed evidence of selective communication across both policies. The significant negative coefficient for the gun ban study indicator (b = −.14) can be interpreted in the same way. Participants in the gun ban study reported being less likely to share information than those in the minimum wage studies (by about 14% of the scale’s range for ideology-inconsistent information, 95% CI: [−.16, −.11], and 9% of the scale’s range for ideology-consistent information, 95% CI: [−.12, −.07].
Selective Communication Above and Beyond Motivated Skepticism.
Note. Entries are coefficients from multilevel linear mixed models.
† p < .10. *p < .05. **p < .01. ***p < .001.
To assess whether data were interdependent within studies, we also reestimated this model with the study as a Level-4 grouping unit. The intraclass correlation (ICC) within studies suggested that errors were not interdependent within studies (ICC < .01). We therefore refrained from modeling study-level variance in all reported analyses.
Beyond Belief
We next tested the beyond belief hypothesis. First, we examined forced-choice communication decisions among the subset of participants (56.7%) who believed every finding that they read (i.e., scored above .5 on the belief variable). As shown in the top panel of Figure 1, 69.7% of these “believers” chose to share an ideology-consistent piece of information in the forced-choice question, 95% CI: [67.22, 72.34], suggesting significant bias. “Skeptics” who doubted at least one finding (i.e., scored below .5 on belief) showed a similar pattern but may have declined to share information because they doubted its veracity.
Second, we reestimated Model 1 with additional predictors: participants’ belief in the study’s finding and the interactions between belief and all of the predictors in Model 1. Estimates from this model (Model 2) are presented in Table 3 and illustrated in Figure 2. We can use this model to predict selective communication of information that participants “definitely” believed. Within the minimum wage studies, this would be the simple effect of the ideological consistency indicator when belief was at its maximum (i.e., 1); this effect is equal to the coefficient for ideological consistency (b = .05) plus its interaction with belief (b = .06). Consistent with the beyond belief hypothesis, participants in Studies 1–3 reported being more likely to communicate ideology-consistent than ideology-inconsistent information when they thought both were “definitely” true (b simple = .10, 95% CI: [.09, .12], p < .001). We can estimate the corresponding effect in Study 4 by adding all two- and three-way interaction coefficients that include ideological consistency to the coefficient for its first-order effect. This simple effect (b = .17, 95% CI: [.14, .19], p < .001) again indicates significant evidence of ideological bias in intended communication, even when participants were convinced that counterideological information was true.

Selective communication, above and beyond belief. Note. Figure is based on the fixed portion of the multilevel linear Model 2 presented in Table 3. The left panel depicts predicted values for self-reported communication likelihood in Studies 1–3, in which participants read about the effects of increasing the minimum wage. The right panel depicts predicted values for self-reported communication likelihood in Study 4, in which participants read about the effects of banning assault weapons. Error bars indicate 95% confidence intervals around predicted values.
An Ideological Asymmetry in Selective Communication
We observed an unanticipated but robust ideological asymmetry in the moderating effect of discussant disagreement. Using the multilevel linear model depicted in Table 4, we estimated the simple effects of the ideology-consistent indicator when participants agreed versus disagreed with their discussants, when participants were conservative versus liberal, and when participants had read about gun bans versus the minimum wage (see Table 5). A significant simple effect implies significant evidence of selective communication.
Multilevel Linear Model Examining Ideological Asymmetry.
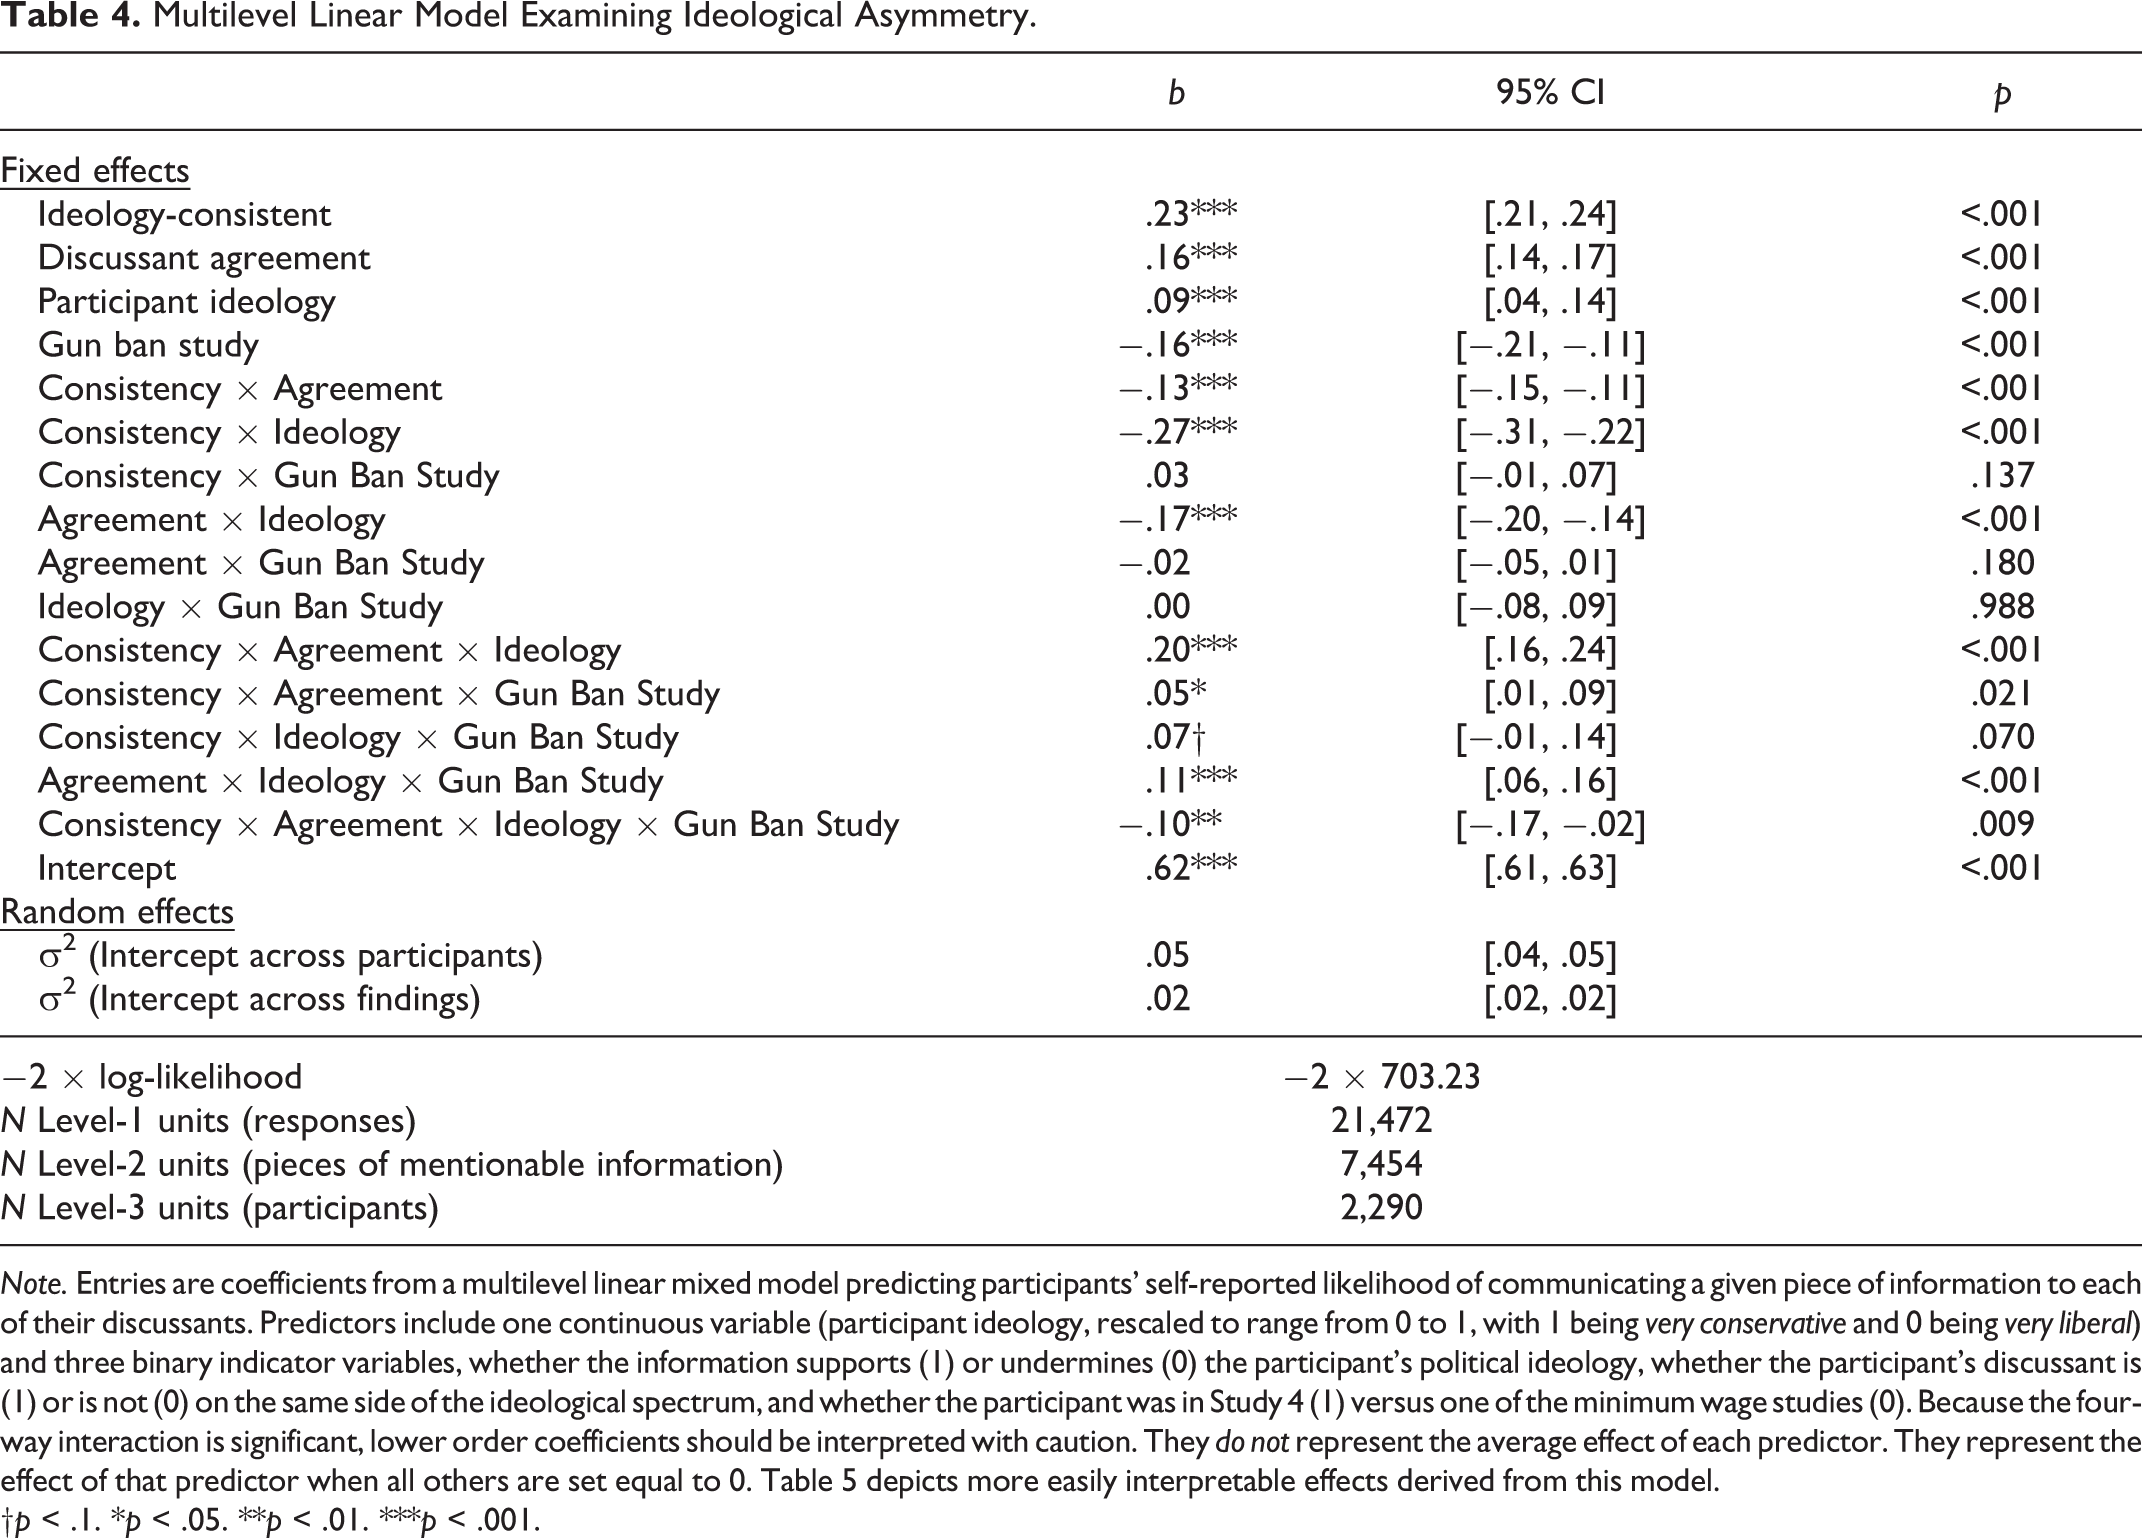
Note. Entries are coefficients from a multilevel linear mixed model predicting participants’ self-reported likelihood of communicating a given piece of information to each of their discussants. Predictors include one continuous variable (participant ideology, rescaled to range from 0 to 1, with 1 being very conservative and 0 being very liberal) and three binary indicator variables, whether the information supports (1) or undermines (0) the participant’s political ideology, whether the participant’s discussant is (1) or is not (0) on the same side of the ideological spectrum, and whether the participant was in Study 4 (1) versus one of the minimum wage studies (0). Because the four-way interaction is significant, lower order coefficients should be interpreted with caution. They do not represent the average effect of each predictor. They represent the effect of that predictor when all others are set equal to 0. Table 5 depicts more easily interpretable effects derived from this model.
†p < .1. *p < .05. **p < .01. ***p < .001.
Ideological Asymmetry in Selective Communication.
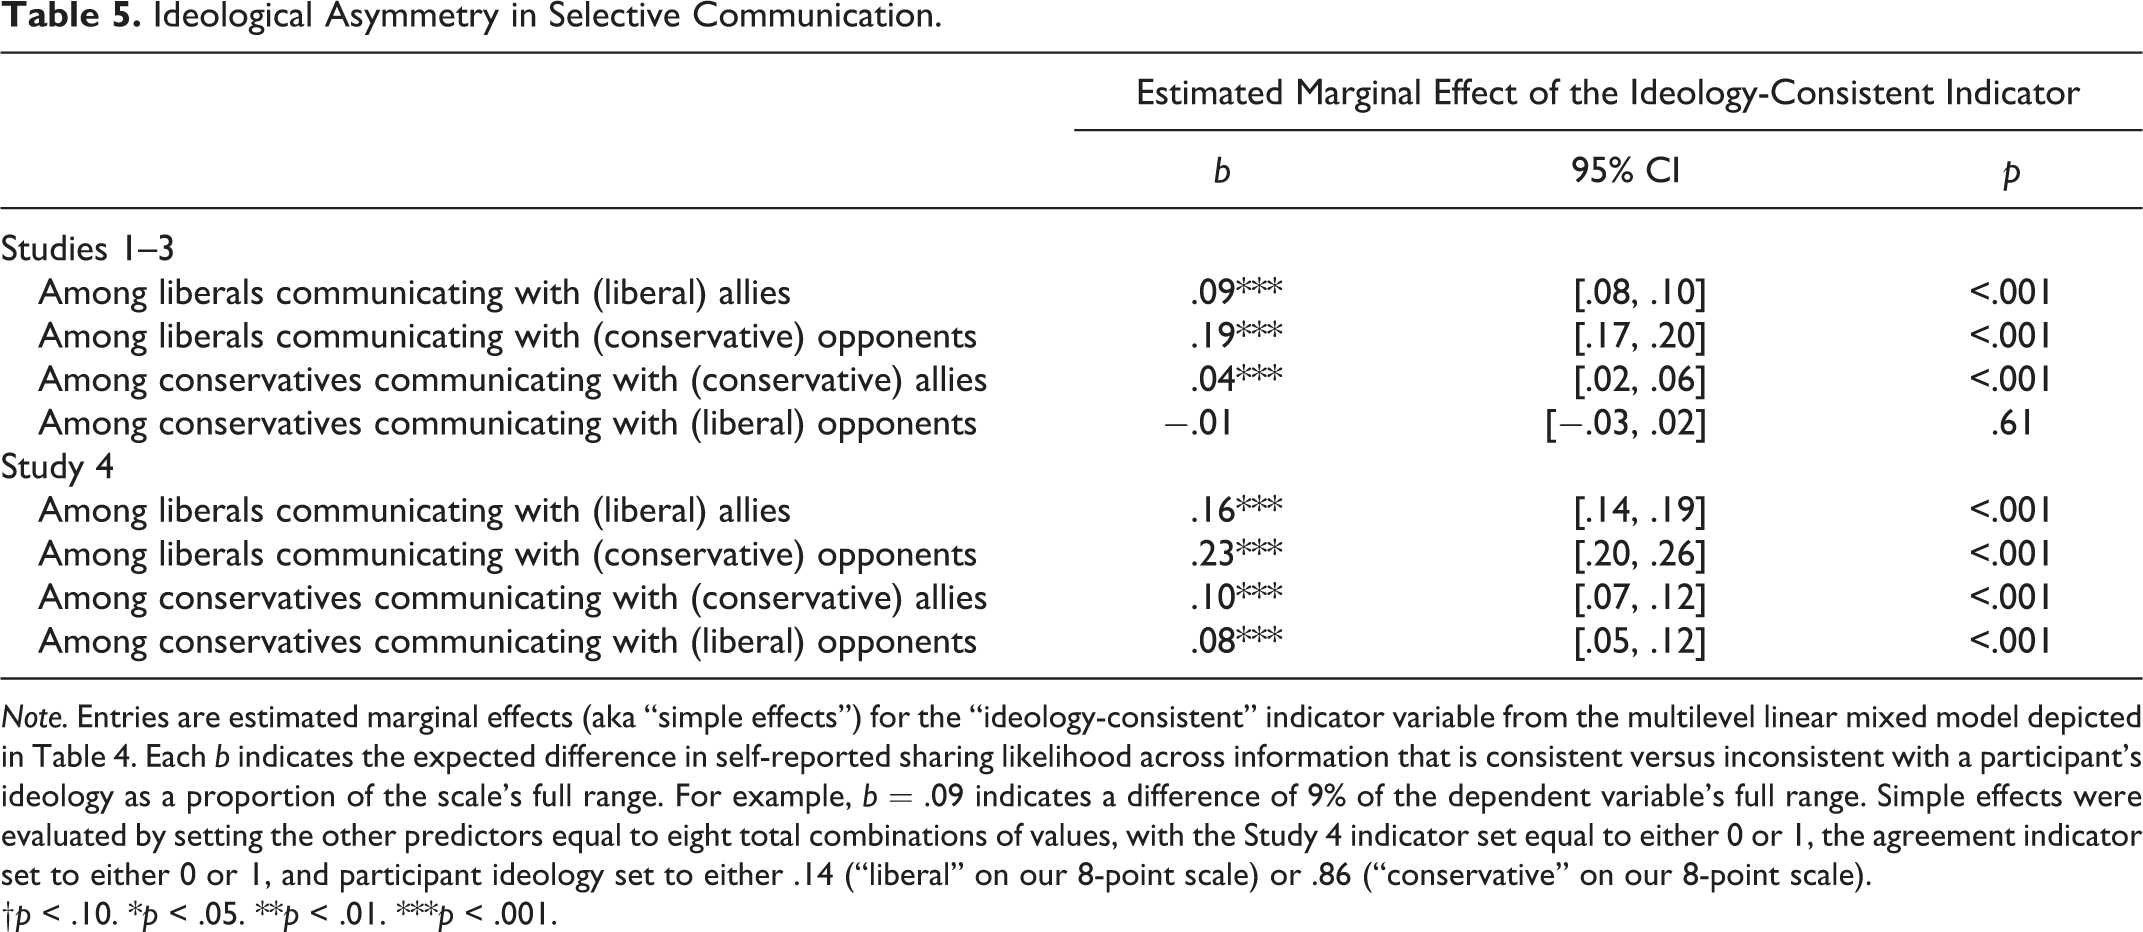
Note. Entries are estimated marginal effects (aka “simple effects”) for the “ideology-consistent” indicator variable from the multilevel linear mixed model depicted in Table 4. Each b indicates the expected difference in self-reported sharing likelihood across information that is consistent versus inconsistent with a participant’s ideology as a proportion of the scale’s full range. For example, b = .09 indicates a difference of 9% of the dependent variable’s full range. Simple effects were evaluated by setting the other predictors equal to eight total combinations of values, with the Study 4 indicator set equal to either 0 or 1, the agreement indicator set to either 0 or 1, and participant ideology set to either .14 (“liberal” on our 8-point scale) or .86 (“conservative” on our 8-point scale).
†p < .10. *p < .05. **p < .01. ***p < .001.
Liberals showed significant evidence of selective communication with all of their discussants in both the minimum wage and gun ban studies, but this bias was more pronounced in what they were willing to share with their conservative opponents (Studies 1–3: b = .19; Study 4: b = .23) than with their liberal allies (Studies 1–3: b = .09; Study 4: b = .16). Conservatives, in contrast, showed less bias overall and showed that bias in different circumstances. They were more biased in sharing with their conservative allies (Studies 1–3: b = .04; Study 4: b = .10) than with their liberal opponents (Studies 1–3: b = −.01; Study 4: b = .08). The significant four-way interaction term in Table 4 indicates that this ideological asymmetry was weaker in Study 4 than in previous studies. However, the three-way interaction between ideological consistency, discussant agreement, and participant ideology—which quantifies this asymmetry—was significant (p
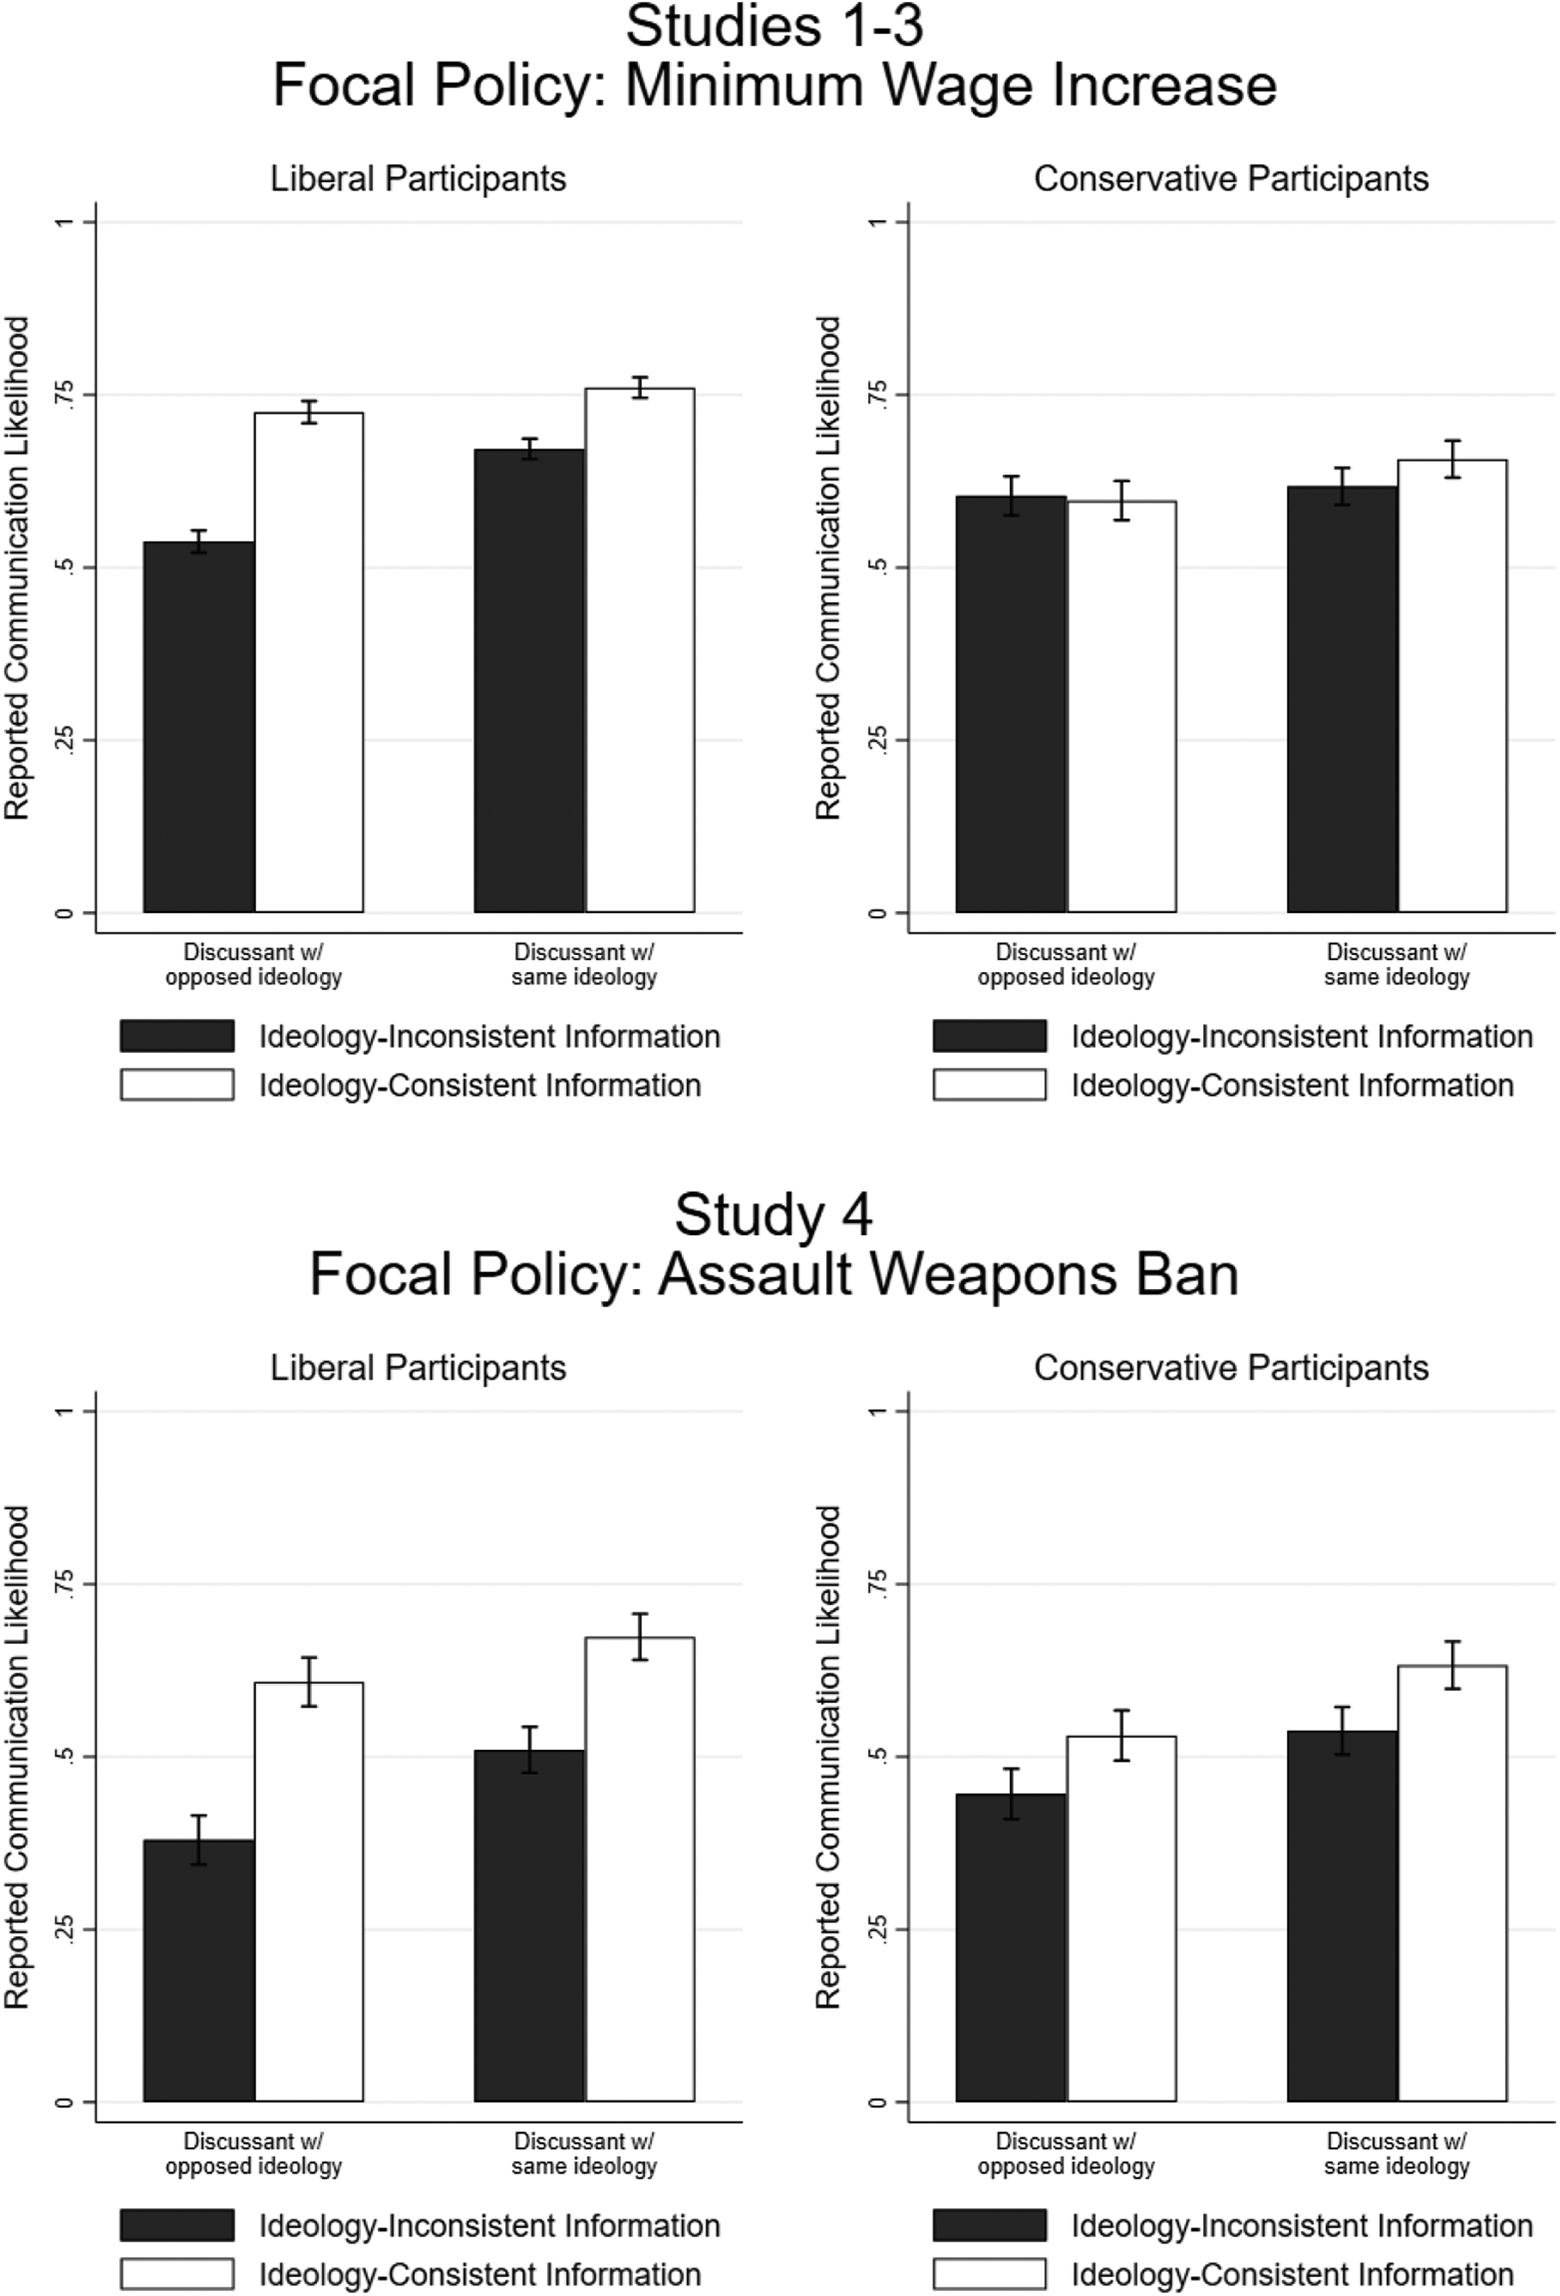
Ideological asymmetry in selective communication. Figure is based on the fixed portion of the multilevel linear model presented in Table 4. Error bars indicate 95% confidence intervals around predicted values.
We observed this asymmetry across all four studies. However, it is possible that liberals and conservatives only appear to have different biases because they systematically named different types of discussants (e.g., cantankerous family members vs. activist friends). To assess this possibility, we asked participants in Study 4 to report their discussants’ demographic characteristics and to describe their relationships with their discussants. We identified the following potential confounds: age, closeness to the participant, gender, and whether the discussant was (vs. was not) the participant’s family member, friend, parent, child, romantic partner, of similar age (within 9 years), or the same gender as the participant. See Supplemental Material for how we made this determination.
We then reestimated the multilevel model depicted in Table 4, (1) dropping the gun ban study indicator (because confounds were only measured in Study 4) and (2) adding every confounding variable and its interaction with ideological consistency. The latter step distinguishes the moderating effects of ideology and discussant agreement from the moderating effects of our nine potentially confounding variables. This revised model showed the same ideological asymmetry as that depicted in Table 4. The coefficients from the original model and the estimated marginal effects of the “ideology-consistent” indicator were identical in direction and significance to those depicted in Table 5. Adding these nine covariates and their associated interactions had no effect on our results.
Discussion
People were consistently more willing to communicate information that supported their ideology than information that might undermine it. We observed this bias even when we specifically examined the information that people believed, suggesting that selective communication could not be explained by motivated reasoning alone.
That said, we found evidence that liberals and conservatives may engage in selective communication to different degrees and in different circumstances. Liberals were most biased in communication with ideological opponents, revealing greater willingness to discuss ideology-inconsistent information with fellow liberals than with conservatives. Conservatives, in contrast, were most biased in communication with ideological allies—and showed no significant evidence of bias in what they were willing to communicate to liberals.
Perhaps liberals are simply more biased in their political communication than conservatives are. However, it is also possible that self-described conservative students, MTurk workers, and/or visitors to Project Implicit showed less selective communication because they are not as ideologically extreme as their liberal counterparts. Or, contemporary liberals may communicate selectively to protect the policies they wish to see implemented from being quashed by the current Republican administration. That said, the direction of our findings is noteworthy given evidence that conservatism can be associated with cognitive rigidity and a disinclination to consider counterattitudinal information (e.g., Jost et al., 2009). From this perspective, one might speculate that conservatives would show more selective communication than liberals; our evidence is inconsistent with this notion.
The asymmetry in the discussants with whom liberals and conservatives show their bias is subject to the same interpretive ambiguity. However, we find evidence that the asymmetry is not attributable to any systematic difference in whom liberals versus conservatives named as their discussants or in whom participants tended to agree with. Thus, it is possible that this difference stems from a more fundamental difference in why liberals and conservatives communicate political information. For example, liberals may communicate political information to persuade their adversaries, defending the esteem of their political group against their rivals; conservatives might communicate political information to affirm the beliefs they share with like-minded others, promoting a sense of group identity and cohesion. We will test these ideas in future research.
Our study has at least two important limitations. First, we assessed sharing by asking participants what they would hypothetically do. In real conversations, however, we would expect even more pronounced selective communication. Hypothetical measures may permit participants to underreport their biases (Pronin, 2007).
Second, our study focuses on political information that makes clear and plausible statements of empirical fact. In the world beyond our study, political information can include ambiguous evidence, untestable opinions, and even outright lies. Existing research suggests that everyday citizens can recognize flagrantly implausible “fake news” (Pennycook & Rand, 2019). We found weaker selective communication for information that participants doubted, suggesting that ideologues did not selectively distribute supposed lies that they found ideologically convenient. However, people may problematically keep facts that would correct this misinformation to themselves, and other research shows that people do selectively share articles that blend fact and opinion (Su et al., 2019). More research is necessary to examine differences in how people communicate facts, falsehoods, and everything in between.
Moreover, facts are not the foundation of all political attitudes. Citizens’ stances on some issues (e.g., the legal status of abortion or same-sex marriage) may be more closely tied to deontological reactions to policies per se (whether a fetus can legally be terminated, whether a woman can legally choose to end her pregnancy, whether a gay couple can legally marry) than to utilitarian assessments of those policies. Selective communication may distort the facts available to citizens, but citizens’ opinions are made of more than facts.
That said, we chose to focus on issues that make the normative hazards of selective communication clear. If increasing the minimum wage has adverse impacts on the cost of housing or food, that information ought to directly inform the policy stances of advocates seeking to help people live in comfort and dignity. If increasing the minimum wage has no adverse effects on local or national economies, that information ought to inform the stances of critics motivated to preserve economic stability. Likewise, support or opposition to any given regulation on the sale of guns should be contingent on whether that regulation helps to reduce violence, injury, and death in the views of many citizens (Kleck et al., 2009). When citizens withhold this information from one another, reserving it for those circumstances in which they can impress their friend or put their uncle in his place, they withhold from one another the means to identify and vote for their real preferences.
To the extent that people selectively communicate ideology-consistent information to their political allies, they will create echo chambers that overstate the strength and wisdom of their group’s beliefs (Brauer et al., 1995; Myers & Lamm, 1976). To the extent that people selectively communicate ideology-consistent information to their political opponents, they run the risk of appearing to be under-informed hypocrites and exacerbating the mistrust that partisans already feel toward their opponents (Levendusky, 2013). Over time, the adverse effects of selective communication on the scope and quality of information available to voters may widen the existing gulf between liberals’ and conservatives’ basic perceptions of reality, making it even more difficult for voters to separate fact and fiction as they struggle to make sense of the political world.
Supplemental Material
Selective_Communication_Supplemental_Online_Material_R1_submitted - The Selective Communication of Political Information
Selective_Communication_Supplemental_Online_Material_R1_submitted for The Selective Communication of Political Information by Pierce D. Ekstrom and Calvin K. Lai in Social Psychological and Personality Science
Footnotes
Declaration of Conflicting Interests
The author(s) declared the following potential conflicts of interest with respect to the research, authorship, and/or publication of this article: Dr. Calvin Lai is the Director of Research and a consultant with Project Implicit, Inc., a non-profit organization that includes in its mission “to develop and deliver methods for investigating and applying phenomena of implicit social cognition, including especially phenomena of implicit bias based on age, race, gender or other factors.”
Funding
The author(s) received no financial support for the research, authorship, and/or publication of this article.

Supplemental Material
The supplemental material is available in the online version of the article.
Note
References
Supplementary Material
Please find the following supplemental material available below.
For Open Access articles published under a Creative Commons License, all supplemental material carries the same license as the article it is associated with.
For non-Open Access articles published, all supplemental material carries a non-exclusive license, and permission requests for re-use of supplemental material or any part of supplemental material shall be sent directly to the copyright owner as specified in the copyright notice associated with the article.
