
Abstract
Background
The high-sugar and high-fat diet exerts distinct effects on bone volume and structure, depending on the type of carbohydrates and the amount of lipids. However, the effects of this diet on human bone health remain unexplored.
Objective
This study examined the effects of a high-sucrose/high-fat diet on the bone health of Sprague–Dawley (SD) rats.
Methods
Five-week-old SD rats were divided into two groups based on whether they received a normal (CE-2) or high-sucrose/high-fat (HSF) diet: SD+CE-2 (control) and SD + HSF (treatment) groups (n = 5 rats/group). After 35 weeks of treatment, bone mineral density, structural parameters, and bone metabolism markers were measured. Student's t-test, Welch's t-test, and Mann-Whitney's U-test were used to determine differences between the two groups.
Results
Femur weight did not differ significantly between the control and treatment groups. The femur area was considerably wider in the treatment group than in the control group. However, trabecular bone density was lower in the treatment group than in the control group. Trabecular volume and node structure number were significantly reduced in the treatment group when compared with those in the control group.
Conclusions
Although high-sucrose/high-fat diet loading decreased trabecular bone volume and node strut number in SD rats, the diet did not contribute to bone density or structural changes.
Introduction
Bone health is associated with aging, exercise load, hormones, and nutrients. 1 The rate of bone remodeling reduces with age and decreased physical activity, 2 especially among older women, given that bone resorption is higher after menopause owing to the decrease in estrogen levels.3,4
The human body requires calcium, vitamin D, phosphorus, and growth hormones for bone growth, 5 and protein intake is important for bone formation because approximately 50% of bone volume and one-third of bone mass are composed of proteins. 5 Higher protein intake (>0.8 g/kg of body weight/day) is associated with higher bone density, lower risk of hip fractures, and a slower rate of reduction in bone mass. 6 Furthermore, specific vitamins are involved in bone metabolism; for example, vitamin K is a coenzyme involved in osteocalcin activation, and vitamin C suppresses osteoclast activity and acts as a cofactor for osteoblasts. 5
Several studies have investigated the association between dietary patterns and bone strength. In postmenopausal Western women, a higher Mediterranean diet score was found to be associated with high bone mineral density and a low risk of hip fracture. 7 A study on postmenopausal women in South Korea revealed that increasing dairy products and fruit intake in a traditional Korean diet based on white rice and vegetables may reduce the risk of osteoporosis. 8 Among Western men, those who consumed a diet rich in fruits, vegetables, and grains had substantially higher bone mineral density than those who ate a diet rich in meat, dairy products, and sweet baked products. Furthermore, the group that consumed more candy had considerably lower bone mineral density. 9
High-carbohydrate and high-fat diets affect bone volume and structure, and these effects vary depending on the carbohydrate type and the amount of fat. 10 For instance, a high-sucrose diet reportedly reduces femur and tibial mass,10–12 whereas a high-glucose diet can decrease the weight of the femur, as well as the bone mineral content and density of the femur and tibia.10,13 Conversely, a high-fructose diet was found to increase the overall bone mineral content and density of the femur and tibia, along with the width of cortical and trabecular bones.10,13,14 Furthermore, a high-fat diet can reduce the trabecular and cortical bone tissue and overall bone density. 10
Although several previous reports employed diets with a fat-to-energy ratio of ≥40%, 10 weight gain due to excess energy consumption could improve bone density by increasing the mechanical load on bones.15,16 Nevertheless, the combined effect of a high-carbohydrate and high-fat diet on the bone remains unclear. Given that a typical diet includes carbohydrates and fats, it is important to investigate their combined effects on bones.
Furthermore, in previous studies that have examined the effects of high-carbohydrate and high-fat meals on bones, most dietary loading periods were approximately 10 to 20 weeks, with few studies exploring long-term effects.10,17,18 In the current study, we investigated the effects of long-term feeding of a high-carbohydrate, high-fat diet on the bone health of Sprague–Dawley (SD) rats.
Materials and methods
Animal care
Male SD rats (5-week-old) were obtained from CLEA Japan, Inc. All rats were housed in cages (one animal/cage) with alpha-dry bedding within a pathogen-free facility maintained on a 12-h light/12-h dark cycle. The rats were bred at the Animal Life Science Research Center, Tokyo University of Agriculture, and allowed to acclimatize in our animal facility for 7 days prior to experimentation.
The animal protocol for this study was designed in accordance with the National Guidelines for the Care and Use of Animals and was approved by the Animal Experiment Committee of the Tokyo University of Agriculture (approval No. 2020002).
Diets and experimental design
The rats were randomly divided into two experimental groups: the SD control group (SD + CE-2; n = 5) and the SD treatment group receiving a high-sucrose high-fat (HSF) diet group (SD + HSF; n = 5). Rats had access to tap water ad libitum. During the study, the control group had ad libitum access to a CE-2 CLEA Rodent Diet (CLEA Japan, Inc.), while the treatment group received Quick Fat® (CLEA Japan, Inc., https://www.clea-japan.com/products/general_diet/item_d0070) for 35 weeks. The composition of the diet is shown in Table 1. Body weights and food consumption were recorded weekly.
Nutritional content of two experimental diets.

Sample preparation
At the end of the experimental period, the rats were fasted for 24 h, anesthetized with Escain® (Isoflurane sodium 1 mL/mL solution), and euthanized by total blood collection from the portal vein. To determine the blood glucose and serum component levels, blood samples were collected and centrifuged at 1200 ×g for 10 min to separate the serum and then stored at −80°C until use. Visceral fat, subcutaneous fat, and the pancreas of each rat were collected and immediately stored at −80°C until use. Both femurs of each rat were harvested, and the adherent tissue was cleaned. Subsequently, one femur was fixed with ethanol, the other was stored at −80°C, and both were weighed.
Serum biochemistry and bone metabolism markers
Fasting blood glucose levels were measured using a self-monitoring glucometer (GR-102; Terumo, Tokyo, Japan). Urinary glucose levels were quantified using a dipstick (E-UR 67; Eiken Chemical, Tokyo, Japan). Leptin levels were measured using kits supplied by the Morinaga Institute of Biological Science (M1305: Yokohama, Japan). Serum calcium (Ca) levels were measured on slides using FUJI DRI-CHEM (Fujifilm, Tokyo, Japan). Alkaline phosphatase (ALP) was measured using kits supplied by TaKaRa (MK301; Otsu, Shiga, Japan). Osteocalcin was measured using kits supplied by LSBio (LS-F70560; Seattle, WA, USA). Osteopontin was measured using kits supplied by LSBio (PGI KE10046; Rosemont, IL, USA). Parathyroid hormone (PTH) was measured using kits supplied by Aviva Systems Biology (OKEH0327; San Diego, CA, USA).
Measurement of mRNA insulin 1 levels
Total RNA was extracted using the RNAiso Plus (TaKaRa) reagent according to the manufacturer's protocol. The RNA was reverse transcribed using the following reagents: 5 × Prime Script RT Master Mix (Perfect Real Time; 2 μL), total RNA, and RNase Free dH2O (up to 10 μL). The reaction mixture was maintained at 37°C for reverse transcription for 15 min, at 85°C for 5 s for heat inactivation of reverse transcriptase, and cooled at 4°C.
The levels of insulin 1 mRNA were determined using quantitative PCR (qPCR).
The oligonucleotide primers were TaKaRa primers for insulin 1 (RA0609848) and actin (RA015375). PCR amplification was performed using a Thermal Cycler Dice (TP760) according to the manufacturer's protocol. RT-PCR products were run on a dissociation curve to confirm the specificity of our primers and ensure that samples were free of DNA contamination. Distinct peaks were observed for each gene (data not shown).
Bone mineral density and structural parameters determined using micro-computed (micro-CT) tomography
Bone mineral density and content were measured in the femur using dual-energy X-ray absorptiometry (DXA) with a DSC-600EX-ⅢR (Hitachi, Ltd, Tokyo, Japan) bone densitometer. Specimens were analyzed using a Scan Xmate-L090 (Comscantecno Co., Ltd, Kanagawa, Japan) micro-CT system. Cortical and trabecular microstructures and a three-dimensional (3D) image of the right femur were analyzed using Scan Xmate-L090 at 75 kV, 100 μA, and a rotation step of 0.6°. Cross-sections were reconstructed using TRI/3D-BON software (Ratoc System Engineering) for 3D analysis and image generation (Kureha Special Laboratory Co. Ltd).
Statistical analysis
Data for all parameters are expressed as the group means ± standard deviation (n = 5 animals/group). Student's t-test, Welch's t-test, and the Mann-Whitney U test were used to determine differences between the two groups. All analyses were conducted using R commander (version 2.7-0; The Foundation for Statistical Computing, Vienna, Austria; http://www.R-project.org/). In all the analyses, results were considered statistically significant at p < 0.05.
Results
Growth curve, food consumption, visceral fat, and subcutaneous fat weight
We investigated the impact of Quick Fat® on the bones of SD rats by establishing an obesity model. First, the presence of obesity in the SD rats was confirmed by assessing their growth curve every 10 weeks beginning at week five. At week 5, there were no significant differences in weight between the two groups. After 15 weeks of age, upon reaching maturity, the body weight of rats in the treatment group was significantly greater than that of rats in the control group (Figure 1(a)). Food consumption was monitored every 10 weeks (Figure 1(b)). The amount of energy per 100 g of Quick Fat® was approximately 1.2 times that of the CE-2 control diet. Energy intake was significantly higher in the treatment group than in the control group after 15 weeks (Figure 1(c)). Subcutaneous and visceral fat and soleus muscle weight were measured to confirm body composition. Rats in the treatment group had significantly heavier subcutaneous and visceral fat than those in the control group (Figure 1(d)), although there was no significant difference in the soleus muscle weight (Figure 1(e)). The treatment group was considered an obesity model, and the ability of Quick Fat® to induce diabetes mellitus in SD rats was examined.
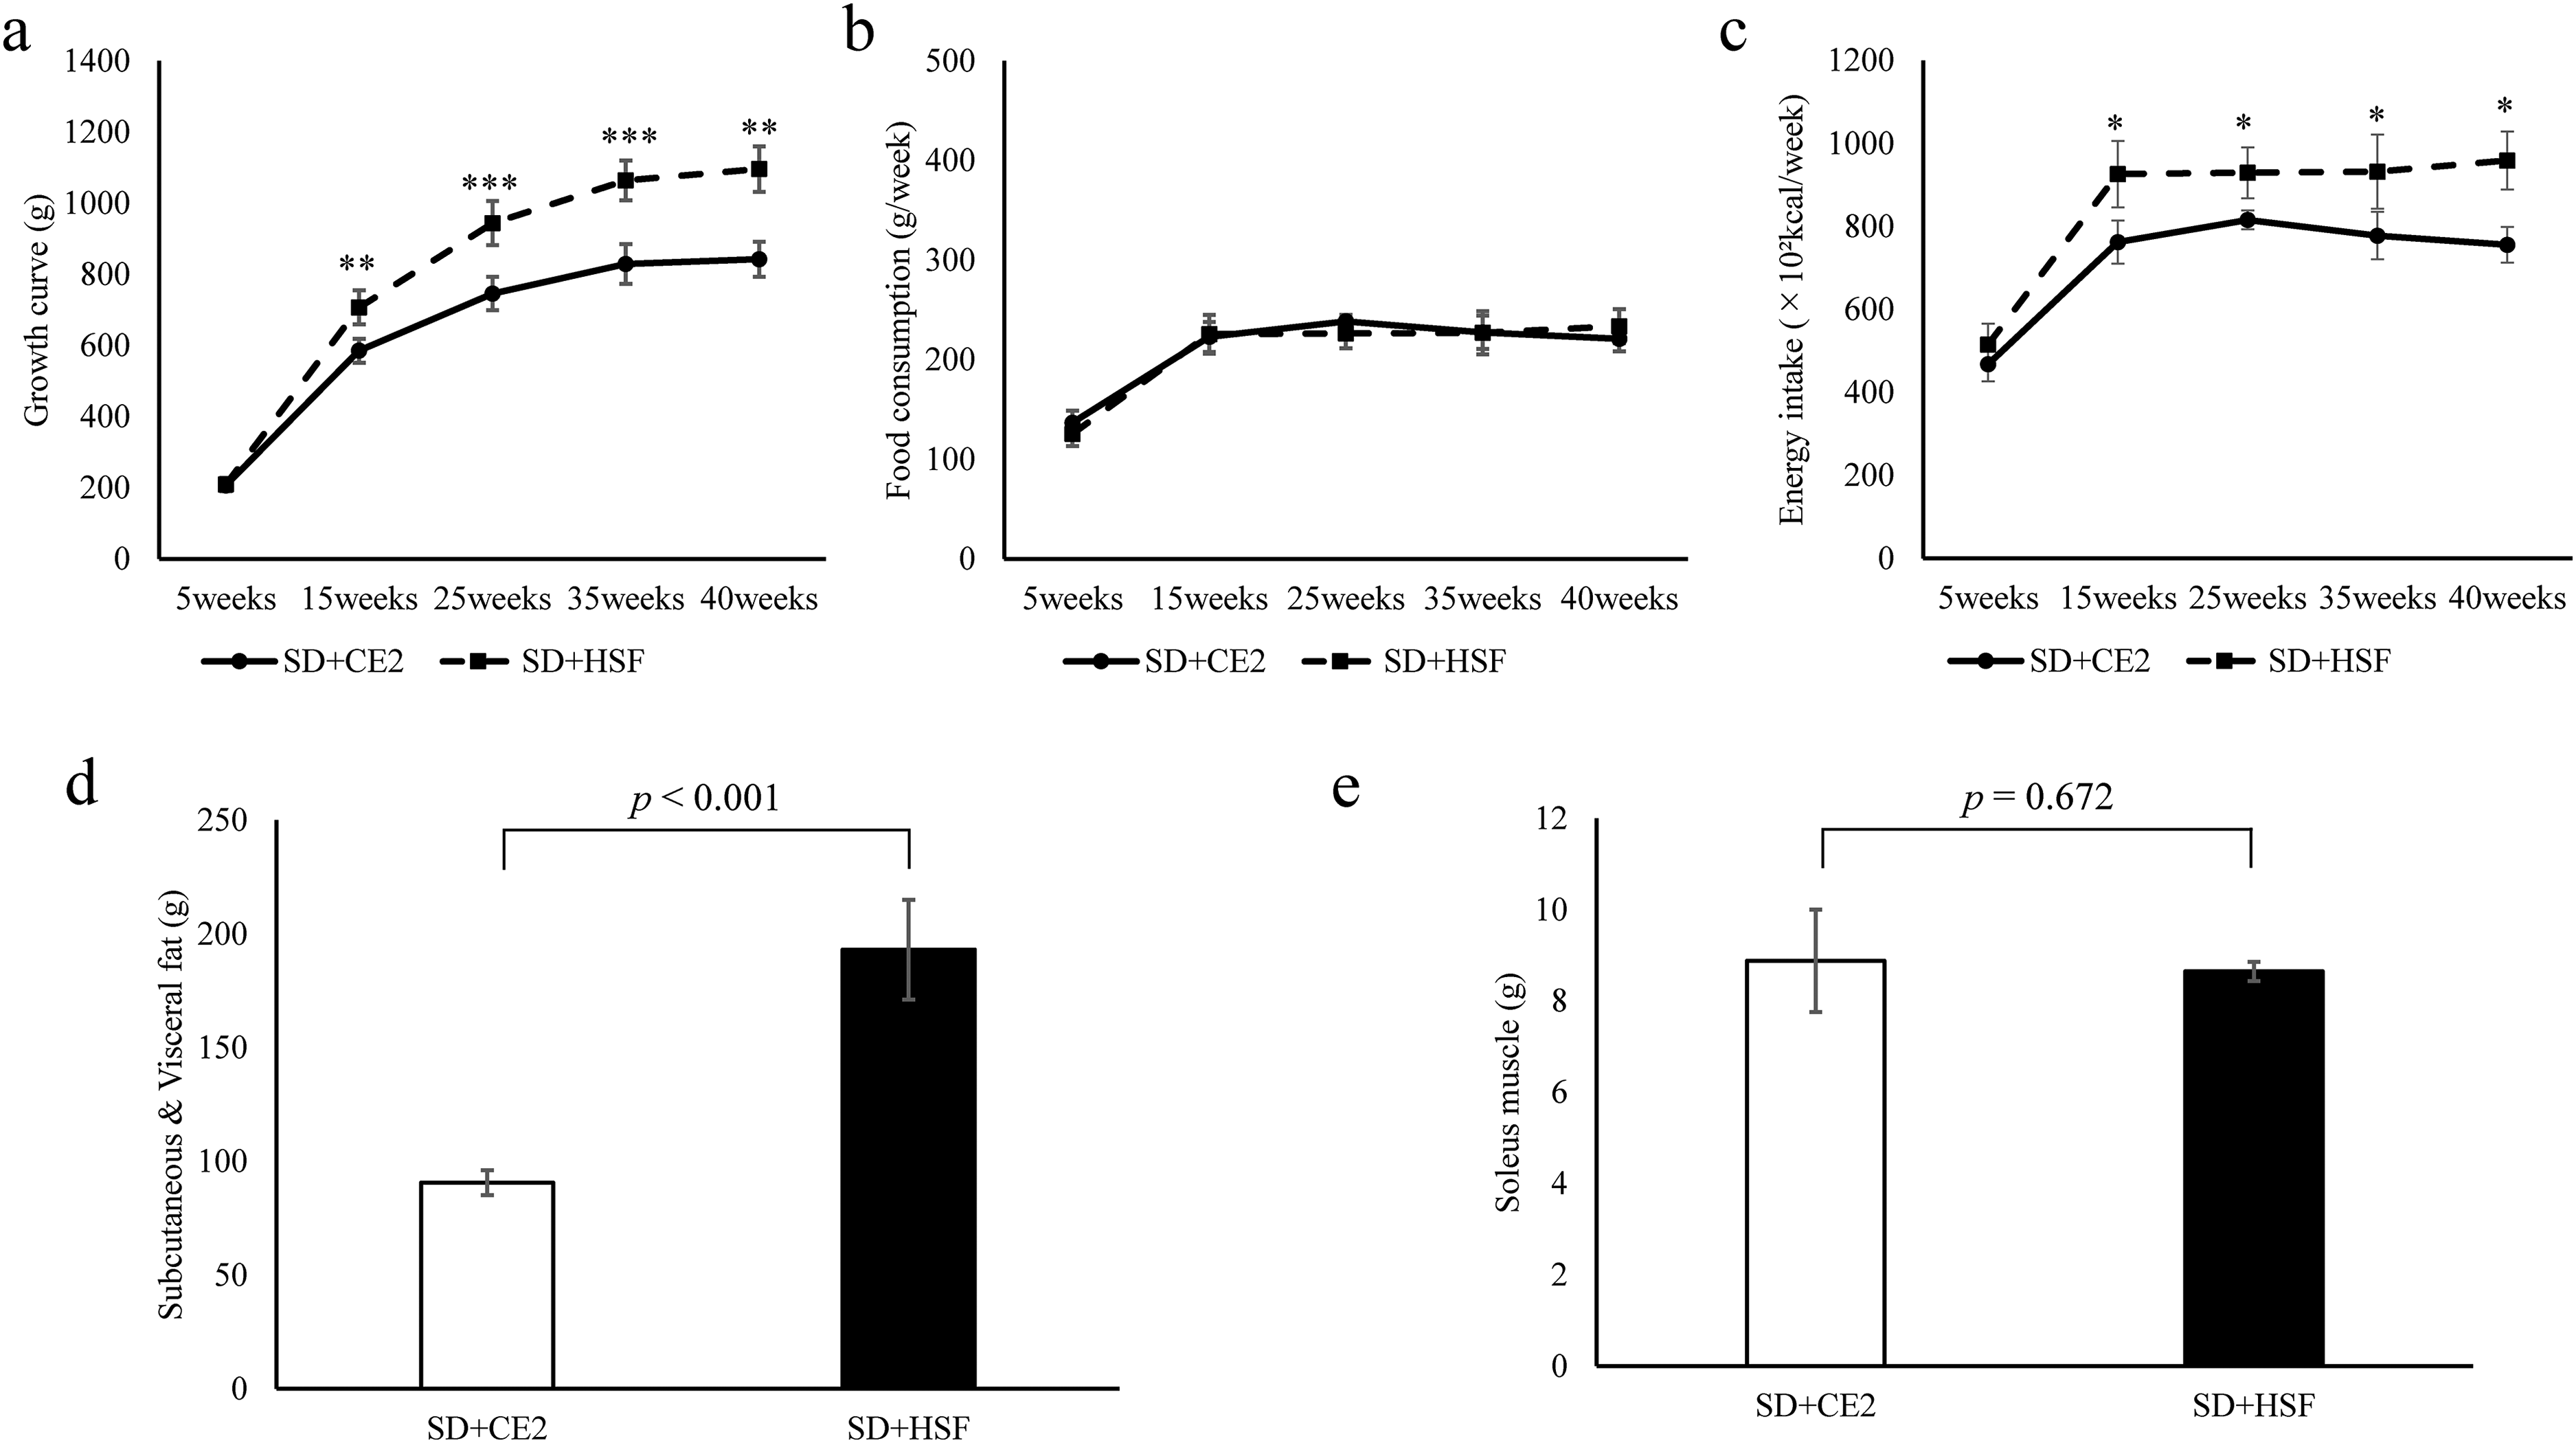
Growth curve, food consumption, energy intake, subcutaneous and visceral fat levels, and soleus muscle size. All values are presented as the mean ± standard deviation. SD + CE-2: Sprague-Dawley (SD) rats fed the CLEA Rodent Diet CE-2 (control group). SD + HSF: SD rats fed Quick Fat® as a high-sucrose/high-fat diet (treatment group). *Asterisks indicate significant differences at *p < 0.05, **p < 0.01, ***p < 0.001, SD + CE-2 vs. SD + HSF, Student's t-test, Welch's t-test, or Mann–Whitney's U test.
Changes in serum biochemical parameters
Fasting blood glucose levels, relative mRNA expression of insulin 1, and urinary glucose levels were measured as indicators of diabetes mellitus. We also measured serum leptin levels, given that leptin secretion can increase with obesity. Blood glucose levels were measured after 24 h of fasting (Figure 2(a)). The relative expression of insulin 1 mRNA was measured in the pancreas (Figure 2(b)). There was no difference in fasting blood glucose levels and relative expression of insulin 1 mRNA between the control and treatment groups. Conversely, serum leptin levels were significantly higher in the treatment group than in the control group (Figure 2(c)).
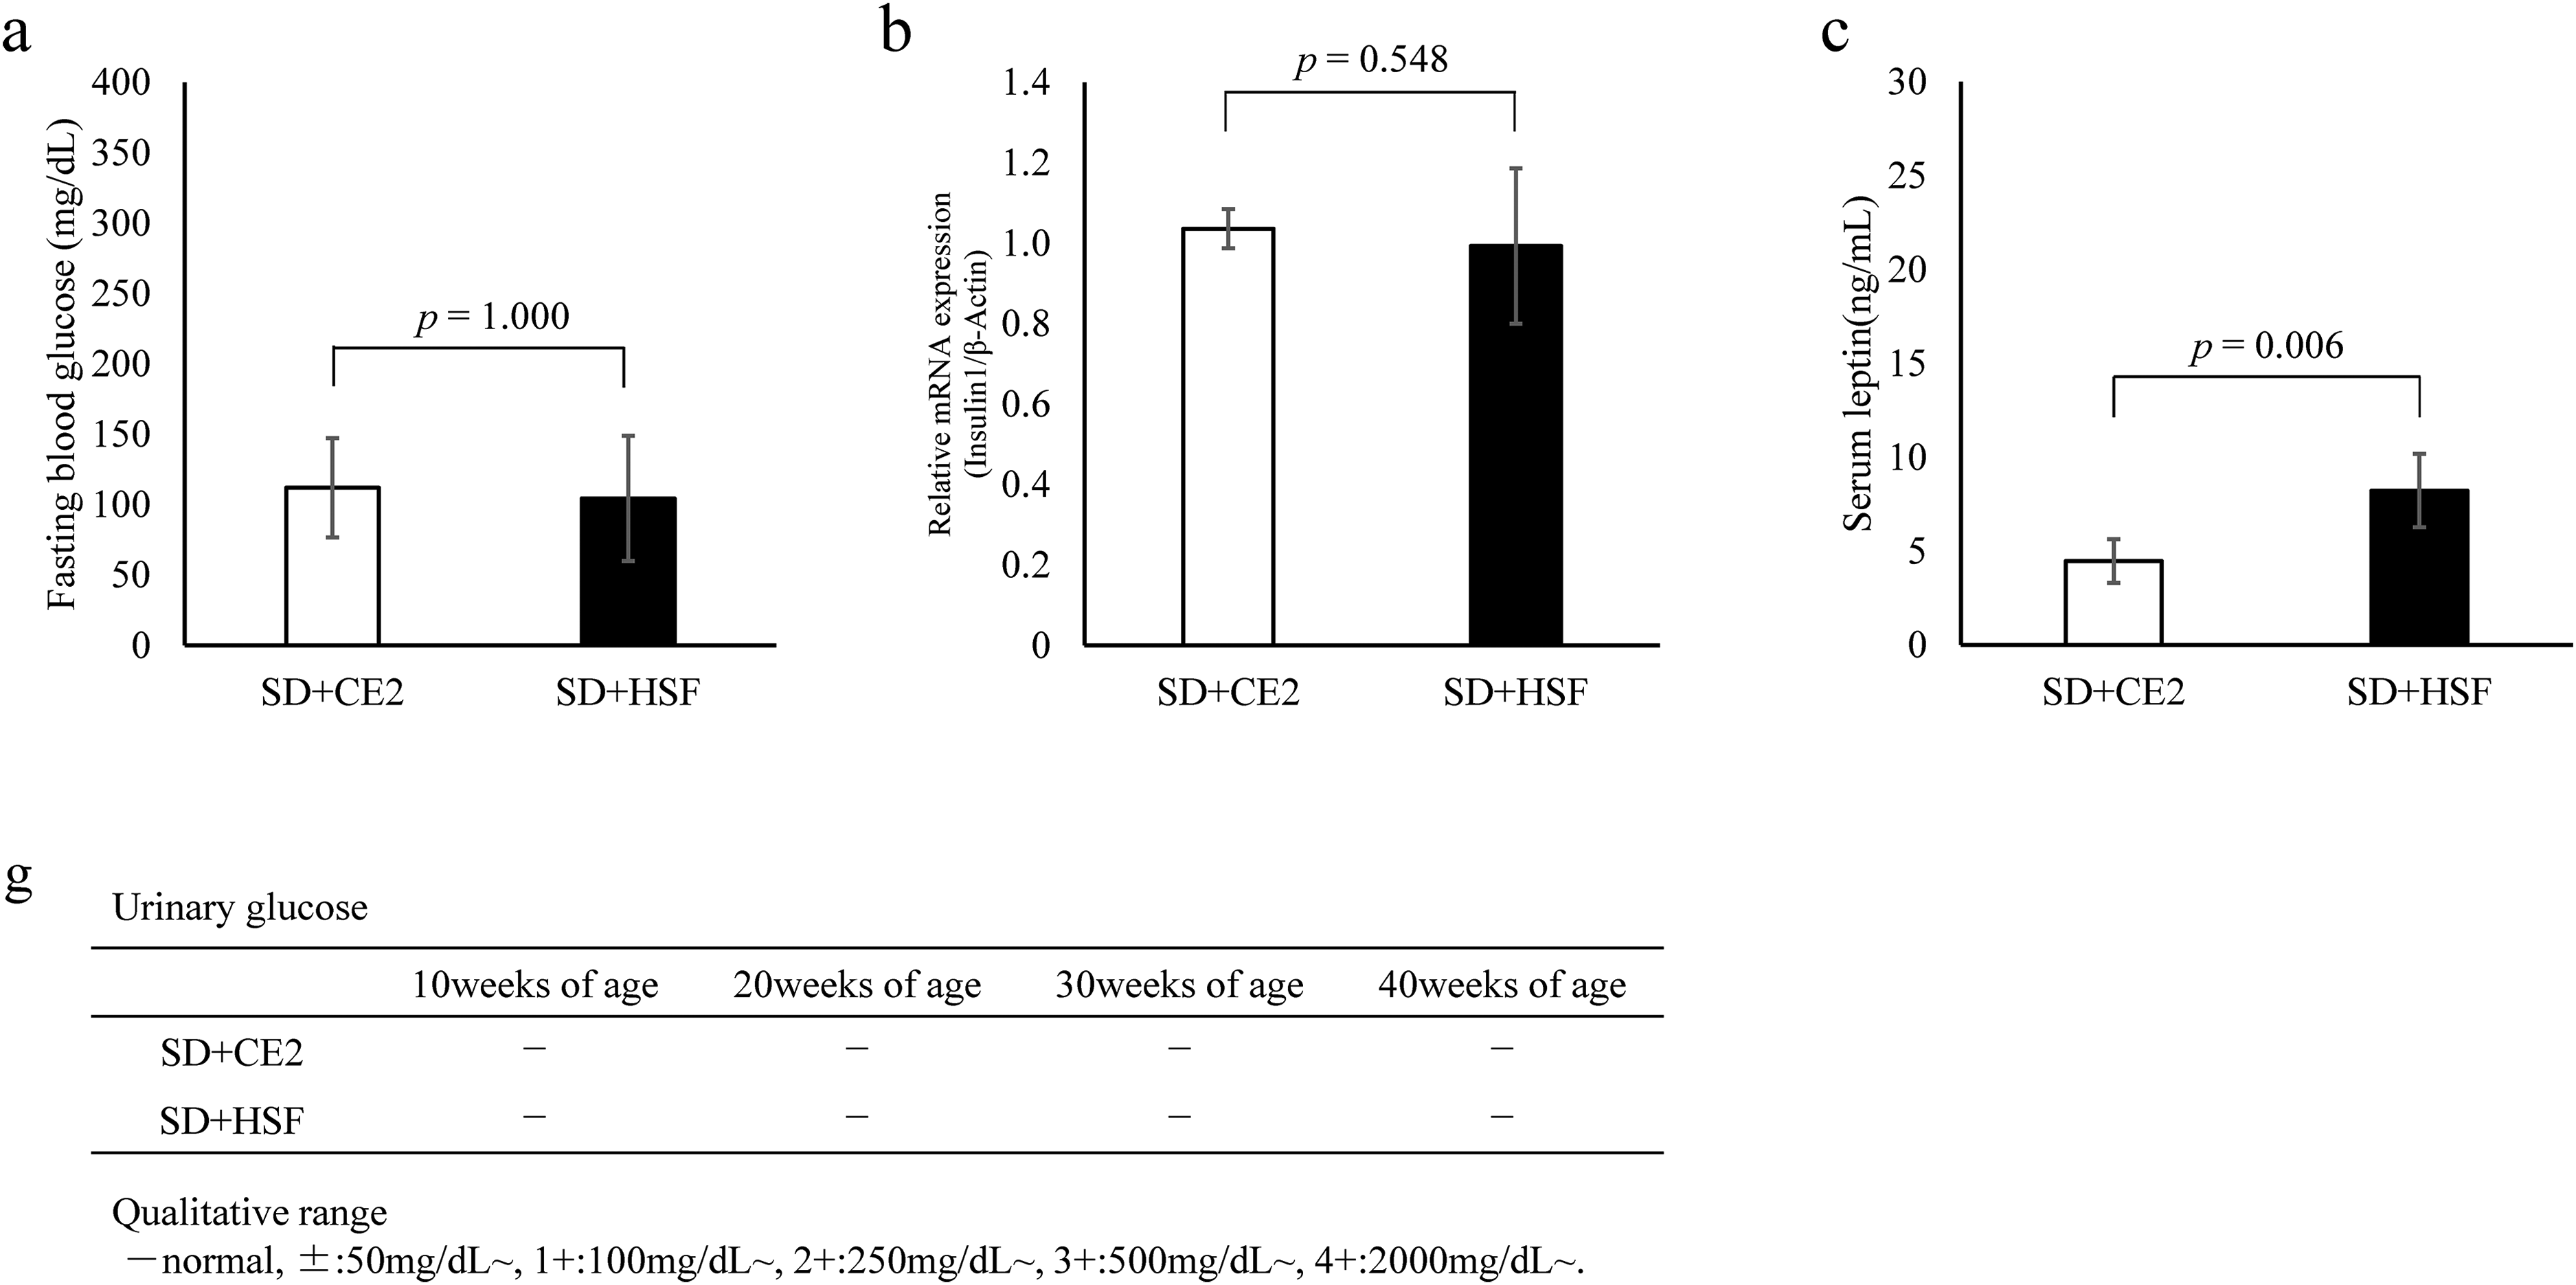
Results of biochemical tests. All values are presented as the mean ± standard deviation. SD + CE-2: Sprague-Dawley (SD) rats fed the CLEA Rodent Diet CE-2 (control group). SD + HSF: SD rats fed Quick Fat® as a high-sucrose/high-fat diet (treatment group). *Asterisks indicate significant differences at *p < 0.05, SD + CE-2 vs. SD + HSF, Student's t-test, or Mann–Whitney U test.
Urinary glucose was qualitatively determined every 10 weeks, beginning at week 10 of age, to confirm the excretion of glucose in the urine (Figure 2(g)). Urinary glucose was not detected in the control or treatment groups from 10 to 40 weeks.
Representative micro-CT images of trabecular bone frontal section and cortical bone cross-section, bone mineral density, and cortical bone structure
The effects of Quick Fat® consumption on the rat femur were examined. Micro-CT images of the frontal and cross-sections of the femur were obtained (Figure 3(a)). In addition, femur weight, femur area, bone mineral content, and bone mineral density were measured using dual-energy X-ray absorptiometry (DXA; Figure 3(b)).
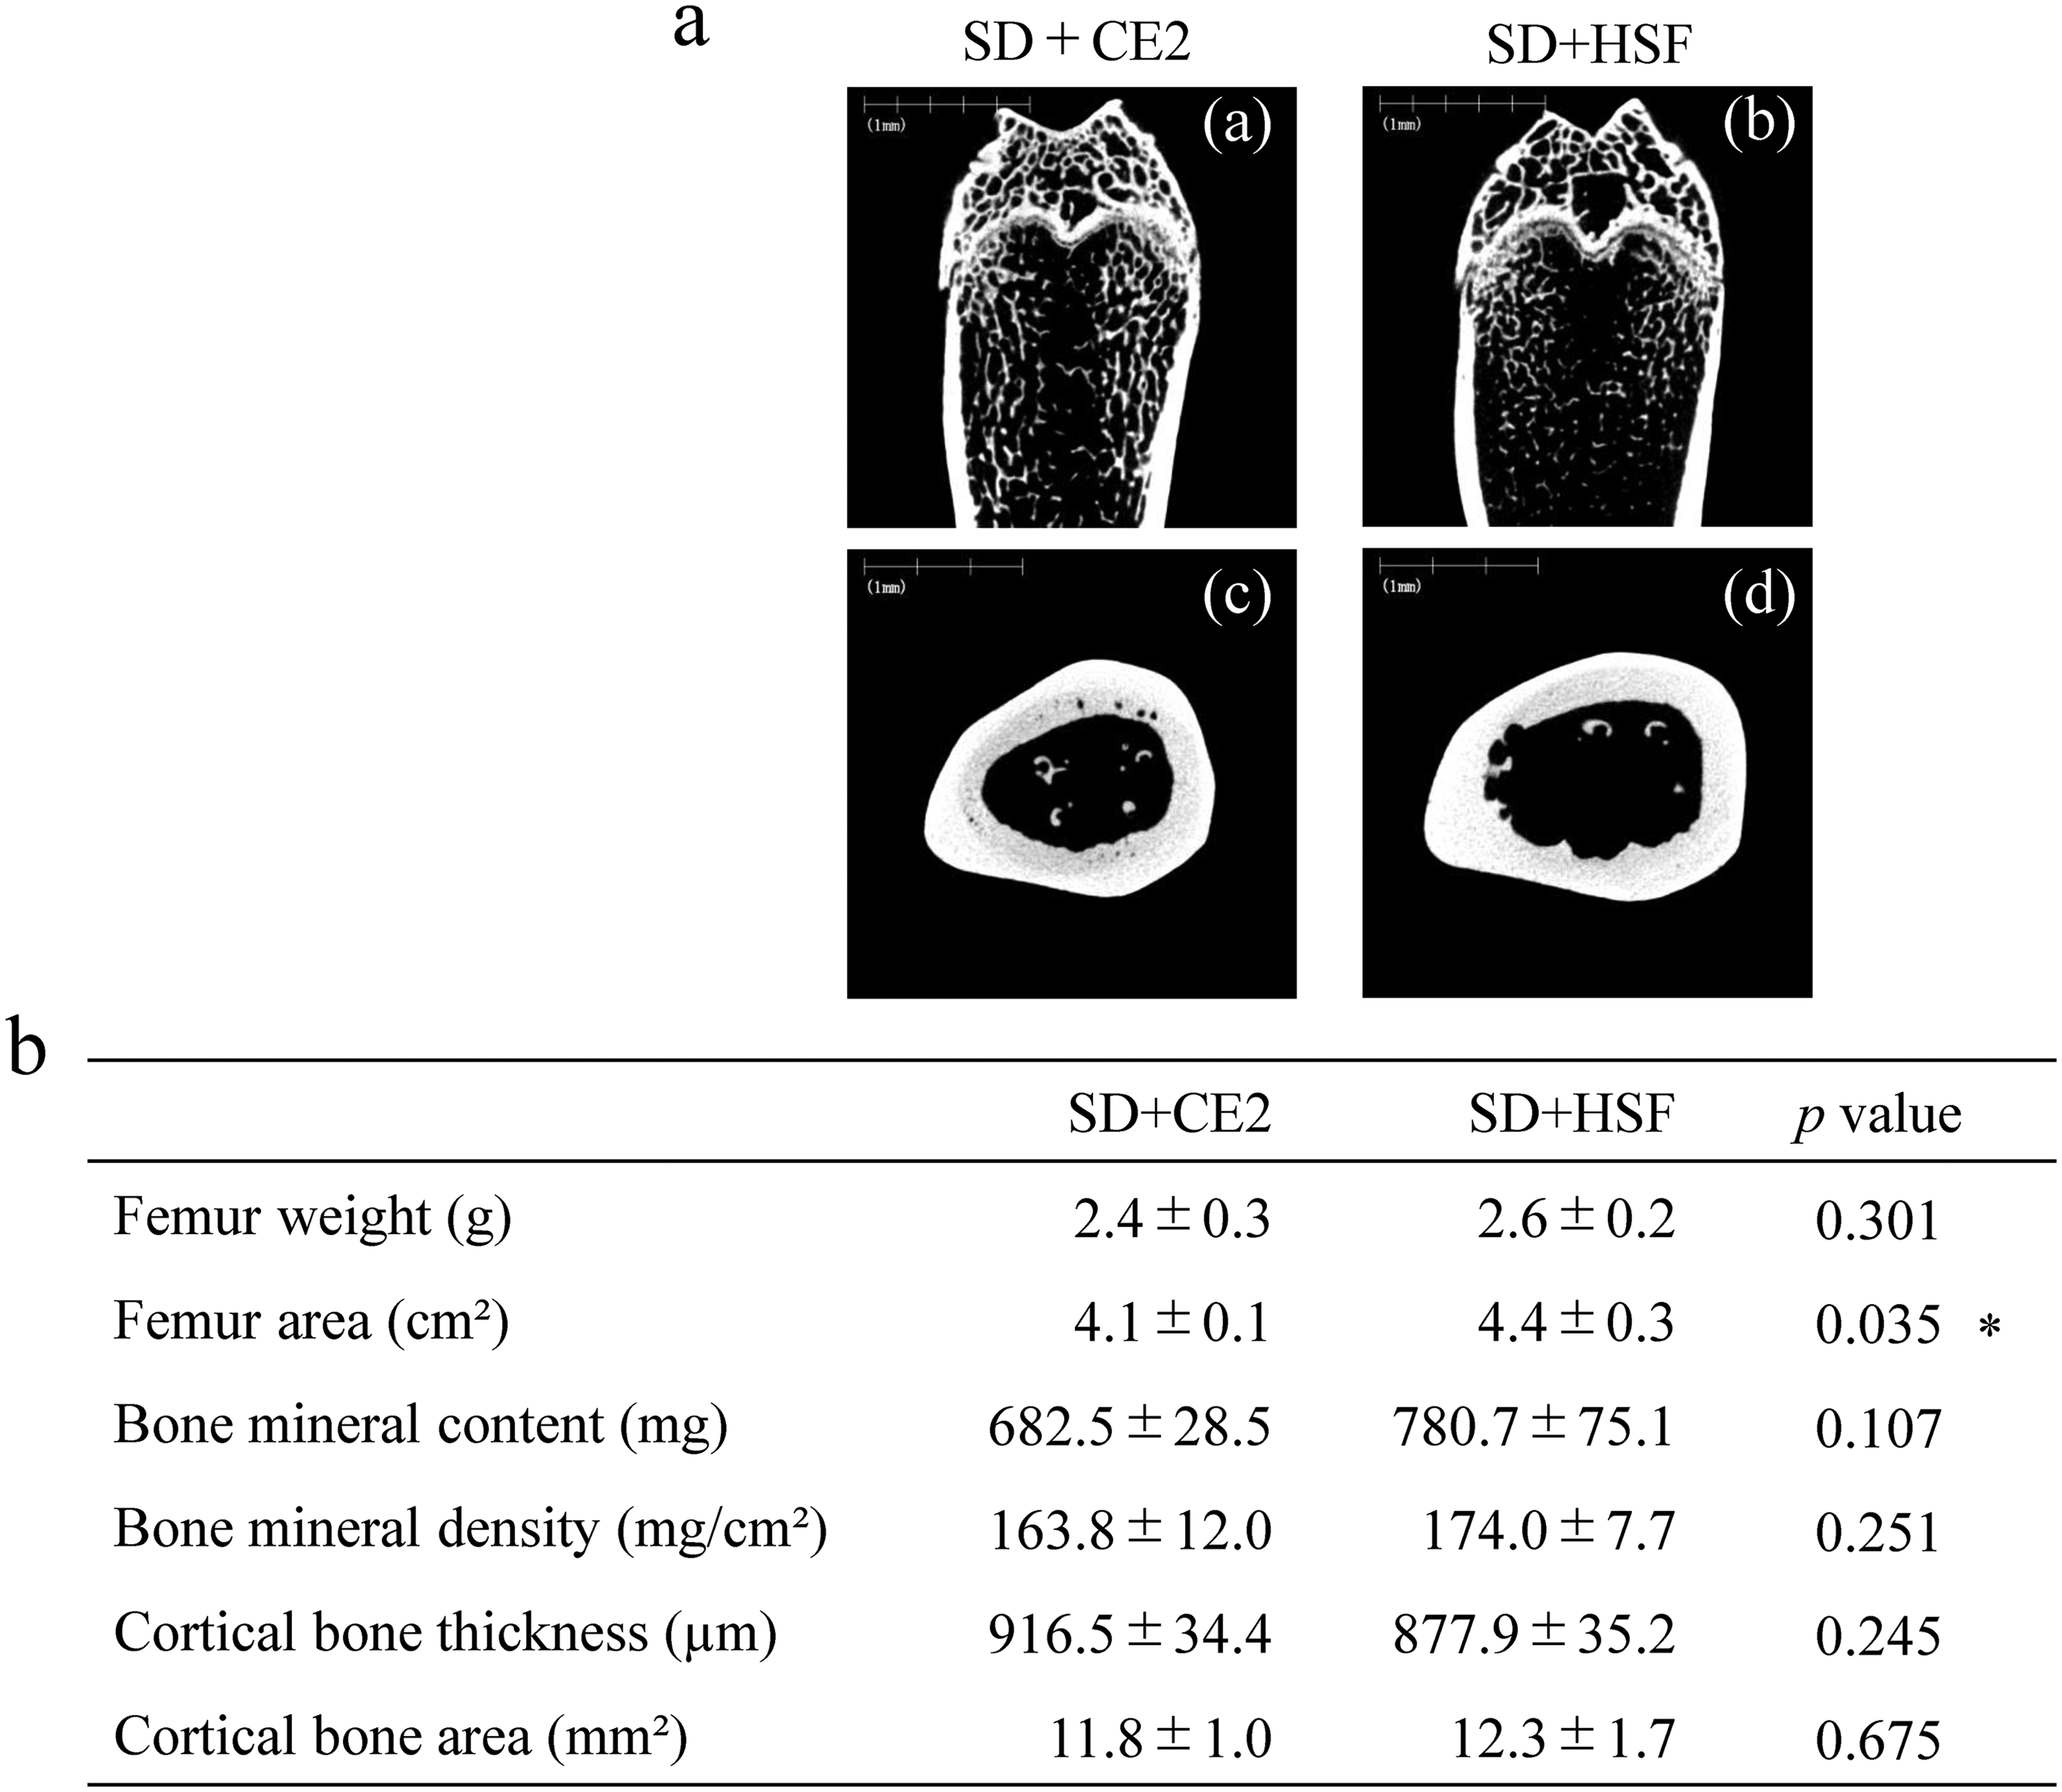
Representative micro-computed tomography (micro-CT) images of trabeculae tissue (frontal section), cortical bone (cross-section), bone mineral density, and cortical bone structure in Sprague-Dawley (SD) rats. Frontal section image of femur metaphysis of rats in control (a-(a)) and treatment groups (a-(b)); cortical bone cross-sectional image of femur diaphysis of rats in the control (a-(c)) and treatment groups (a-(d)). SD + CE-2: Sprague-Dawley (SD) rats fed the CLEA Rodent Diet CE-2 (control group). SD + HSF: SD rats fed Quick Fat® as a high-sucrose/high-fat diet (treatment group). *Asterisks indicate significant differences at *p < 0.05, SD + CE-2 vs. SD + HSF, Student's t-test.
Frontal section images showed that trabecular bone density in the treatment group (Figure 3(a)-(b)) was lower than that in the control group (Figure 3(a)-(a)). In a cross-sectional image of the cortical bone, enlargement of the medullary cavity was observed on the endoperiosteal surface and transverse canal of the cortical bone (Figure 3(a)-(c), (d)). Femur weight did not differ significantly between the control and treatment groups. Interestingly, the femur area was considerably wider in the treatment group than in the control group. Bone mineral content and density did not differ significantly between the control and treatment groups. Similar results were obtained for cortical bone thickness and area (Figure 3(b)).
Trabecula structure of cancellous bone
The trabecular structure of cancellous bones was analyzed using micro-CT (Table 2).
Trabecula structure of cancellous bone.
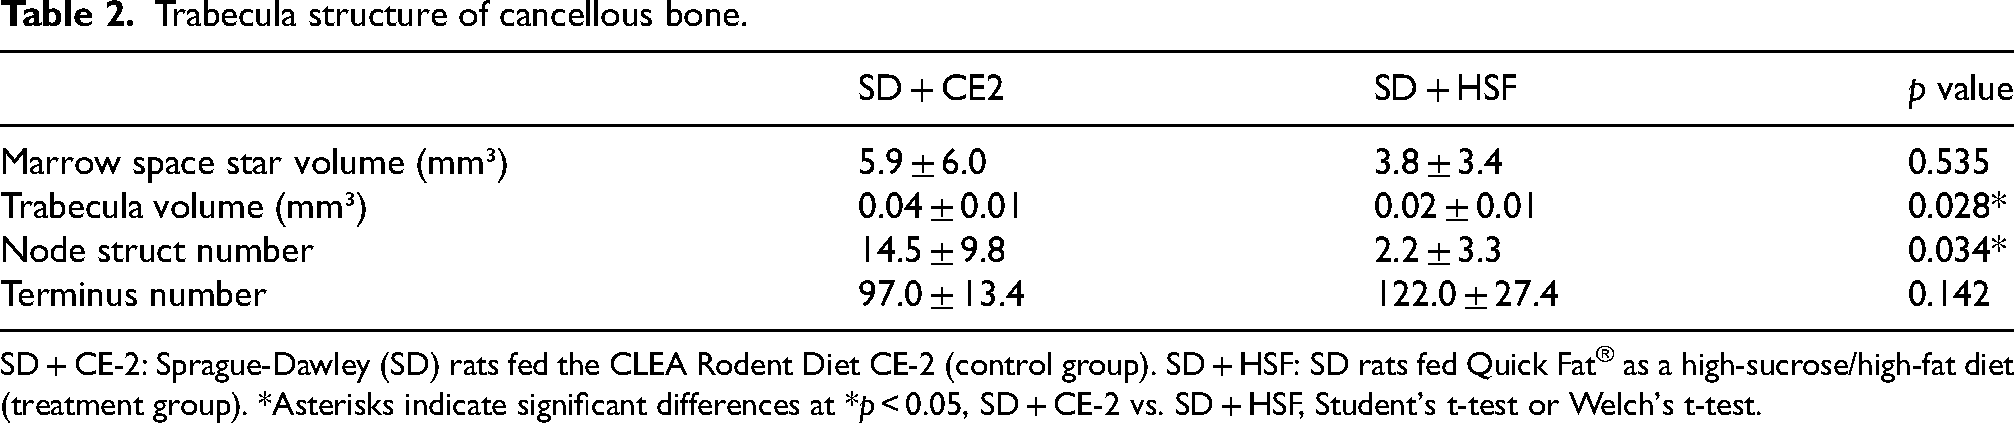
SD + CE-2: Sprague-Dawley (SD) rats fed the CLEA Rodent Diet CE-2 (control group). SD + HSF: SD rats fed Quick Fat® as a high-sucrose/high-fat diet (treatment group). *Asterisks indicate significant differences at *p < 0.05, SD + CE-2 vs. SD + HSF, Student's t-test or Welch's t-test.
Marrow-space star volume did not differ significantly between the control and treatment groups. In contrast, the trabecular volume and node structure number were significantly lower in the treatment group than in the control group. The number of termini did not differ significantly between the control and treatment groups.
Analysis of bone metabolism marker
According to the results of DXA (Figure 3) and micro-CT (Figure 3 and Table 2) in SD rats, the trabecular structure of the cancellous bone was reduced by Quick Fat® feeding. Accordingly, we concluded that bone metabolism was altered in SD rats and confirmed this deduction by assessing bone metabolism markers in the serum.
The osteogenic markers, alkaline phosphatase and osteocalcin, were measured. Alkaline phosphatase levels did not differ significantly between the control and treatment groups (Figure 4(a)). Osteocalcin levels were significantly lower in the treatment group than in the control group (Figure 4(b)). Osteopontin, an osteoclastic marker, tended to be higher in the treatment group than in the control group (p = 0.05; Figure 4(c)). The calcium and PTH hormone levels were also measured. Calcium levels did not differ significantly between the control and treatment groups (Figure 4(d)), whereas PTH levels were significantly higher in the treatment group than in the control group (Figure 4(e)).

Analysis of bone metabolism marker. SD + CE-2: Sprague-Dawley (SD) rats fed the CLEA Rodent Diet CE-2 (control group). SD + HSF: SD rats fed Quick Fat® as a high-sucrose/high-fat diet (treatment group). SD + CE-2 vs. SD + HSF, Welch's t-test, or Mann–Whitney U test.
Discussion
A high-fat diet with approximately 45% fat or lard can reportedly reduce trabeculae tissue. 19 A high-sucrose diet was found to increase bone mineral density by 20% and decrease bone cross-sectional area by 40%. 10 However, the effects of the negative interaction between high-sucrose and high-fat diets remain unclear. Therefore, we investigated the effects of a high-sucrose/high-fat diet on the femurs of SD rats. In this study, Quick Fat® feeding for 35 weeks reduced the size of cancellous bone and separated the trabeculae in SD rats.
Quick Fat® contains animal fats (beef tallow) and sucrose and is known to increase blood glucose levels in the early postnatal period, leading to fat accumulation, induction of diabetes and obesity, elevated blood lipids, and the development of fatty liver and kidney disease. 20 In the present study, consistent with the findings of previous reports, we detected early weight gain and increased subcutaneous and visceral fat (Figure 1).
Reportedly, feeding a high-fat diet (with a fat-to-energy ratio of 45%) to 6-week-old male mice for 14 weeks decreased tibial cancellous bone volume. 19 Herein, we compared the femurs of SD rats in the control and treatment groups. Rats in the treatment group had smaller trabecular bones (Figure 3(a)-(a), (b)) and larger bone perimeters than rats in the control group; however, the cortical bones were damaged from the inside (Figure 3-(a)-(c), (d)). Furthermore, when a high-sucrose diet (fat-to-energy ratio of 46%) was administered to 3-week-old male and female rats for 5 weeks, tibial bone mineral density decreased substantially in both sexes, while femur bone mineral density was markedly reduced in female rats. 11 QuickFat®, comprising 25% sucrose as a carbohydrate, is designed to achieve rapid weight gain. 17 Interestingly, QuickFat® has been associated with increased bone weight due to weight gain, 17 although the observed changes were reported in short-term animal experiments. Furthermore, the addition of sucrose may impact the interior of the bone over a prolonged period of time, as observed in the current study. In Japan, 20–30% of total dietary calories should be derived from fat and 50–65% from carbohydrates. 20 The average Japanese person obtains 29% of his/her energy requirements from fat and 52.2% from carbohydrates. 21 Quick Fat® comprises 31.4% fat and 45.0% carbohydrate. Compared with the normal diet, the Quick Fat® used in this study comprised 20% more lipid content. Although these diets should be compared based on the listed proportions, the ratio of carbohydrate to fat in the Quick-Fat® is similar to the ratio of carbohydrate to fat consumed by Japanese individuals daily. However, in the present study, the long-term consumption of this fat-to-carbohydrate ratio combined with a high sucrose intake can weaken the trabecular bone structure, similar to the effect of eating a high-fat diet (with 45% of the energy derived from fats).
In 7-week-old male mice, administering a high-fat (45%) diet for 15 weeks reduced femur cortical bone volume and width. 22 However, in the current study, Quick Fat® feeding did not alter the cortical bone. In aged rats, the rate of bone resorption is reportedly higher than that of bone formation in the cortical endosteal tissue. 23 This suggests that Quick Fat® feeding may not affect the cortical bone thickness and area but may further increase resorption inside the cortical bone with age. In the treatment group, the trabecular bone structure was fragile; therefore, a decrease in osteocalcin and an increase in osteopontin were expected. Compared with the control group, the treatment group had significantly reduced osteocalcin levels and elevated osteopontin levels (p = 0.057; Figure 4(b), (c)). Hyperglycemia decreases osteocalcin secretion, 24 but whether it is reduced by a high-sucrose/high-fat diet or obesity remains unclear. In the present study, Quick Fat® feeding reduced osteocalcin levels, consistent with a previous study that reported osteopontin expression in adipose tissue increases at the onset of obesity. 25 Serum calcium levels were unchanged. It is well-established that serum calcium levels do not reflect the calcium nutritional status. 26 Levels of serum calcium remained constant (Figure 4(d)), and even a slight decrease in calcium increases calcium absorption and renal calcium reabsorption in a PTH-vitamin D-dependent manner. The alkaline phosphatase level was not significantly altered (Figure 4(a)), and PTH was significantly higher in the treatment group (Figure 4(e)), possibly due to the HSF diet and not abnormal calcium metabolism.
The limitations of this study need to be addressed. One major limitation of the study was that the relative effect of a single nutrient-loaded diet could not be determined for the double-nutrient-loaded nutrient diet. Additionally, the sample size was insufficient. Furthermore, the underlying cause of reduced trabecular volume and node strut number in the treatment group could not be determined. Moreover, the time point at which the trabecular volume and node strut number began decreasing was unclear because changes were not determined in a time-dependent manner. SD rats fed a high-fat, high-sucrose diet were shown to exhibit more severe bone loss and inflammation than Wister-Han rats. 27 Hence, additional studies with other rat species are required. However, given that carbohydrates and fats are consumed through meal intake, this study provides important results regarding the impact of carbohydrates and fats on bone health in accordance with our actual dietary habits.
Conclusion
In this study, we investigated the effects of long-term feeding with a high-sucrose/high-fat diet on the bone. The result revealed that although high-sucrose/high-fat diet loading decreased trabecular volume and node strut number in SD rats, it did not contribute to bone density or structural changes.
Footnotes
Acknowledgements
We would like to thank Comscantecno Co., Ltd and Kureha Special Laboratory Co. Ltd for bone analysis and Editage (![]() ) for English language editing. We would like to express our gratitude to the professors at the University of Agriculture who supported our research and to CLEA Co., Ltd for supplying the animals and food.
) for English language editing. We would like to express our gratitude to the professors at the University of Agriculture who supported our research and to CLEA Co., Ltd for supplying the animals and food.
Author contributions
All authors contributed to the conception and design of this study. TS, MI, RK, and SI prepared the materials and collected and analyzed the data. All authors cared for the animals and collected samples. TS wrote the first draft of the manuscript. All authors have read and approved the final manuscript.
Declaration of conflicting interests
The authors declared no potential conflicts of interest with respect to the research, authorship, and/or publication of this article.
Funding
The authors received no financial support for the research, authorship, and/or publication of this article.