



Abstract
This article presents a three-dimensional constitutive model to replicate the dynamic response of blast-loaded fibre–metal laminates made of 2024-0 aluminium alloy and woven composite (glass fibre–reinforced polypropylene). Simulation of the dynamic response is challenging when extreme localised loads are of concern and requires reliable material constitutive models as well as accurate modelling techniques. It is well known that back layers in a fibre–metal laminate provide structural support for front layers; thus, proper modelling of constituent failure and degradation is essential to understanding structural damage and failure. The improved developed model to analyse damage initiation, progression and failure of the composite is implemented in finite element code ABAQUS, and a good correlation is observed with experimental results for displacements of the back and front faces as presented by other researchers. The model was also able to predict accurately the tearing impulses. Finally, the concepts of the ‘efficiency of the charge’ and ‘effectiveness of the target’ are proposed in the context of localised blast loading on a structure. Dimensionless parameters are introduced to quantify these parameters.
Introduction
Fibre–metal laminates (FMLs) are a class of hybrid materials that have attracted attention and interest due to their improved impact resistance and fatigue behaviour. A number of research works have been conducted comparing FMLs to monolithic metallic plates under dynamic loads (Karagiozova et al., 2010) which signify different aspects behaviour and requirements of modelling and experimentation on this class of structures. Glare, an FML patented by a joint venture of Aluminium Company of America (ALCOA) and Akzo Nobel N.V., has been used in commercial applications in Airbus 380 (Wang, 2009). It comprises thin aluminium 2024-T3 sheets and a unidirectional or a biaxial glass fibre–reinforced epoxy composite interleaved in a periodic structure through the thickness (Langdon et al., 2007a; Vlot, 1996; Vo et al., 2012, 2013).
Fleisher (1996) studied blast resistance of light luggage containers based on Glare and reported the capacity to withstand a bomb blast greater than that of the Lockerbie air disaster. The FML container tested with a Lockerbie-type explosion shows the enormous potential of glare in the design of Blast-Resistant Aircraft Baggage Containers for in-service aircraft use (Fleisher, 1196; Vo et al., 2012, 2013).
More recently, comprehensive investigations on the blast resistance of FMLs have been carried out at the Impact Research Centre of the University of Liverpool and the Blast, Impact & Survivability Research Unit (BISRU) of the University of Cape Town. In a set of the experiments (Langdon et al., 2007a, 2007b; Lemanski et al., 2006, 2007), FMLs composed of 2024-0 aluminium alloy and glass fibre–reinforced polypropylene (GFPP) subjected to localised blast loading were investigated. The test sample consisted of an FML based on 12 different configurations, having total laminate thickness of 2–15 mm. Failure modes in this work were characterised as Mode I failure: large inelastic deformation of the back face of the panel (furthest away from the blast), Mode II failure: complete tearing of the back face and Mode II*: transition between the two failure modes – this occurs at threshold impulses. It was observed that thicker panels exhibit smaller displacements for a given impulse than thinner panels, and that the Mode I non-dimensional displacement of both the front and back faces are linearly related to the non-dimensional impulse. It was also shown that thinner panels exhibit behaviour closer to that of a monolithic plate. As the panel thickness increases, behaviour deviates from the monolithic plate response, that is, debonding and delamination become more pronounced. Further numerical studies for Mode I failure show that when expressed in terms of non-dimensional parameters, the difference between the mean displacements of the front and back faces falls within one plate thickness, following a linear trend, and the threshold impulse for the onset of tearing for Mode II failure was shown to be linearly dependent on panel thickness (Langdon et al., 2007a; Vo et al., 2012, 2013).
Karagiozova et al. (2010) studied the response of FMLs to localised blast loading in order to interpret the deformation mechanisms due to highly localised pressure pulses causing permanent deformations and damage observed. They went on to scrutinise the influence of the loading and material parameters on the final deformation characteristics examined. In addition, a comparison between the responses of relatively thin FML panels, monolithic aluminium alloy plates of equivalent mass and a foam-core panel to localised blast were also presented in their work (Karagiozova et al., 2010). Modelling parameters of GFPP and adhesives used in this work were derived from the work of Karagovizova et al. (2010a).
As observed by Vo et al. (2012, 2013), experimental modelling and subsequent optimisation are quite expensive and there is need for predictive capabilities through finite element (FE) models able to depict the behaviour of FMLs a priori rather than as post-test corroboration tools. As virtual testing proves that valuable attempts in this line have been made to model FMLs by, for example, Vo et al. (2012, 2013). However, the focus of this study is to introduce additional parameters that would increase the confidence of the analyst in modelling FMLs as well as proposing a robust constitutive model to be used in blast loading scenarios usually characterised and accompanied by occurrence of damage and fracture.
Composite laminates composed of fibre-reinforced plies are integral parts of FMLs. Thus, a thorough modelling of composites is an integral part of modelling FMLs. Failure and damage in laminated structures (composites) can be studied using micro-mechanical approach that considers failure and damage at the consistent level, mini-mechanical approach which focuses on the representative volumetric element (RVE) and statistical homogeneity and meso-mechanical approach which looks primarily into delamination or a fully macro-mechanical approach. A Continuum Damage Mechanics (CDM) approach in which material properties of the composite are homogenised and failure and damage are studied at the ply/lamina level (Batra et al., 2012) through several damage parameters is adopted in this work. It is important to note that damage studied at constituent level is both computationally expensive for practical structures and experimentally immoderate, if at all possible. Furthermore, extensive characterisation is required to determine material parameters in the damage model.
One common approach for studying composites is to use a micromechanics approach to deduce effective properties of a ply and CDM to study failure and damage at laminar level. CDM theories capture effects of microscopic damage using the thermodynamics-based theory of internal variables (Coleman and Gurtin, 1967). Ladeveze and LeDantec (1992) used this approach to degrade elastic properties of the composite due to fibre breakage and matrix cracking and plasticity theory to account for permanent deformations induced under shear loading. Hassan and Batra (2008) used three internal variables to characterise damage due to fibre breakage, matrix cracking and fibre/matrix debonding. In their work, delamination between adjacent plies was analysed using a failure surface quadratic (and thus convex) in transverse normal and the transverse shear stresses. Puck and Schürmann (1998) generalised Hashin’s (1980) stress-based failure criteria and proposed a technique to degrade elastic parameters of the lamina subsequent to the initiation of a failure mode. Xiao et al. (2007) validated experimental quasi-static punch-shear test results carried out on plain weave S-2 glass/SC-15 epoxy composite laminates. The numerical modelling was carried out using a material model called MAT162, which was incorporated into LS-DYNA. MAT162 uses damage mechanics principles for progressive damage and material degradation. In their work, the calibrated material properties have been used to simulate plates of other thicknesses, and the simulated results show good agreement with experimental results. Among the earlier works on composite degradation is the work of Matzenmiller et al. (1995). They proposed that when one of the Hashin failure criteria is satisfied at a point in the composite structure, damage ensues at that point and it is depicted by introducing damage variables for fibre breakage in tension and compression, matrix cracking in tension and compression and in-plane shear. It is shown that the evolution of these internal variables depends upon the values of stresses in Hashin’s failure criteria which are expressed in terms of stress invariants for a transversely isotropic body and strength parameters for the composite (Batra et al., 2012).
This work follows the philosophy of Matzenmiller as adopted also by Batra et al. (2012). In Batra and his team’s work, Matzenmiller damage evolution criteria are used to study three-dimensional (3D) deformations of a 16-ply laminate subjected to normal incidence impact by a slow-moving rigid sphere, and the effective elastic–plastic properties of the composite were derived using Paley and Aboudi’s (1992) method of cells but with the continuity of shear tractions across cell boundaries relaxed. A user-defined subroutine (VUMAT) was developed which updates stresses as its main duty. It has to deal with material degradation to enable accurate stress calculations. The subroutine takes as input from the commercial FE software ABAQUS values of six strain components at an integration point of a generic FE, then computes based on intact constitutive coefficients stresses in each ply using the constituent level properties, computes effective stresses at integration points, checks for Hashin’s failure criteria, computes damage if necessary, modifies stresses due to the induced damage and supplies them back to ABAQUS. As the procedure is explicit, there is no need for iterations to update the constitutive model at every increment and the base state for each increment is that of the previous increment. The constitutive tensor is only updated subsequent to calculation of stresses at the end of each increment.
Donadon et al. (2008) used a smear crack approach to develop a failure model for predicting damage in 3D deformations of a composite structure.
Iannucci and colleagues (2008, 2006) have worked extensively on the progressive failure of woven composites. Iannucci (2006) proposed a simple damage mechanics-based progressive failure model for thin woven carbon composites under impact loads (i.e. ballistic damage, bird strike and fragmentation attacked). This model can be appreciated when one considers the difficulty in characterising material constants for existing stress-based scalar functions-based techniques of modelling composite failure. The proposed approach is based on an unconventional thermodynamic maximum energy dissipation approach, which entails controlling damage evolution and hence energy dissipation per second, rather than damage. The method was implemented into explicit dynamic FE code, DYNA3D.
An energy-based damage mechanics approach was also postulated by Iannucci and Willows (2006; 2007) for woven composite materials. Five damage variables were introduced for in-plane damage per ply. The damage variables were directly related to stiffness degradation within the composite lamina and ultimately within the laminate. The evolution of damage was controlled by a series of damage–strain equations. This allows the total energy dissipated for each damage mode to be set as a material parameter. This approach was implemented into both the LLNL and LS versions of DYNA3D for plane stress (shell) elements.
The principle of smeared cracking approach highlighted by Donadon et al. (2007a, 2007b, 2008) and Bažant and Oh (1983) was used in conjunction with some assumptions to ensure its validity in this work. The fundamental principle of smeared crack approach, used in CDM, assumes that the criteria for crack propagation and the prediction of the direction of propagation are based on failure criteria expressed in terms of stresses and strains and the stress intensity factors. In this approach, the cracked material is assumed to remain a continuum, and the mechanical properties (stiffness and strength) are modified to account for the effect of cracking, according to the evolving states of stresses and strains. Thus, re-meshing is in effect not needed (Cervera and Chiumenti, 2006), and volumetric model crack density is linked to a global modal damage parameter at the element level.
Although it is possible to model composites without course for re-meshing using the extended finite element method (XFEM), this method is beyond the scope of this study. XFEM is a fracture mechanics-based approach which allows for crack propagation without re-meshing at the expense of tracking the crack front through the FE mesh and progressively enriching the displacement field with functions that represent displacement jumps across the crack and the developed singular fields at the tip of an advancing crack (Belytschko and Black, 1999; Moës and Belytschko, 2002; Sukumar et al., 2000).
Donadon et al. (2008b) and Bažant and Oh (1983) related volumetric energy, defined as area underneath the stress–strain curve to the fracture energy of the composite material (which depends upon modal stress–displacement curves) in question. This method assumes a strain-softening constitutive law for modelling the gradual stiffness reduction due to micro-cracking process within the cohesive or process zone of the material and translates this damage width to the FE domain. Thus, the fracture energy, that is, energy dissipated per unit area within a fully failed element can be written in terms of the specific energy by multiplying the specific energy by a geometric quantity defined as characteristic length; for example, for a unidirectional stress state, it should have the direction aligned with the loading direction and at most times, equals the side of the element.
This article presents an improved numerical modelling for predicting the response of blast-loaded FMLs. A simplified model is presented to analyse the damage initiation, damage progression and failure of the 3D solid woven GFPP material within the FMLs. The response of the GFPP significantly influences the overall response of the FMLs. The simplified model for the GFPP incorporates strain rate effects and an objectivity algorithm for strain softening to control energy dissipation associated with each failure mode regardless of mesh refinement and topology. This is done within the framework of CDM and using thermodynamically consistent damage variables. Cracking is treated as an irreversible thermodynamic process, and mesh objectivity and inclusion of strain rate effects in 3D are the improvements upon previous works in the literature and encompass the novel aspects of this work. To ensure the appropriateness of the model proposed in this work, the following assumptions are made: (a) the crack growth direction in the modelled composite is parallel to the edge of the FEs and (b) the composite meshes are structured. Experimental and numerical results are compared and discussed, and in all cases, good correlation is observed.
Geometry and modelling
Various 400 mm × 400 mm panels of FMLs were manufactured and tested under localised blast at the University of Cape Town from 0.025 in thick sheets of 2024-0 aluminium alloy and a woven glass–glass fibre/propylene composite. The FML panels tested had exposed areas of 300 mm × 300 mm unanimously and were labelled AXTYZ-#, where A = aluminium, X = number of aluminium layers, T = GFPP, Y = number of blocks of GFPP, Z = number of plies of GFPP per block and # indicates the panel number (Karagiozova et al., 2010; Langdon et al., 2007b; Nurick et al., 2009).
Due to the symmetrical in-plane architecture of the panel, only one-quarter of the panel was modelled in ABAQUS 6.12 with appropriate boundary conditions, that is, symmetry and fully clamped on internal and external edges, respectively. The FML is modelled as a four-part structure, that is, comprising aluminium alloy, composite, interface adhesive layers (cohesive layers representing the adhesive between composite and aluminium alloy) and laminate adhesive layers (cohesive layers representing the adhesive layers between plies of composite). In this work, we introduce a laminate adhesive layer between every two consecutive plies to reduce computational costs while retaining accuracy. Figure 1 illustrates the through-thickness structure of the FML. The aluminium part is meshed using linear brick elements, that is, C3D8R elements, which are eight-noded, linear hexahedral elements with reduced integration formulation and hourglass control. The adhesive layers in the composite and interface between composite and aluminium are modelled with 3D cohesive element with direct traction-separation formulation (COH3D8).

Schematic representation of through-thickness architecture in an FML plate.
Material modelling
Composite modelling
CDM has been adopted in this work which assumes a linear elastic orthotropic response up to the point of damage initiation. Modified Hashin’s damage initiation criteria must be satisfied for damage to initiate as this model is adopted. These damage criteria are similar to the ones proposed by Xiao et al. (2007) for multi-axially loaded composites. The initial elastic constants of the undamaged material are the elastic moduli E1, E2 and E3; shear moduli G12, G23 and G31 and Poisson’s coefficients υ12, υ23 and υ31, where 1, 2 and 3 denote local axes of the material in the direct in-plane fill (warp), transverse in-plane (weft) and out-of-plane directions, respectively.
The constitutive relation for undamaged composite ply is therefore

or by defining


where σ is the stress tensor with respect to the material principal axes,

The components of the stress tensors σ and ϵ are, respectively

It is obvious that any rotation of the axes would result in a corresponding change in constitutive matrix followed by affine transformation of the coordinates, that is, a transformation which is both covariant and contravariant.
Equation (3) is further simplified in the relationship shown in equation (6)

where

Composite material properties
The mechanical properties of composite shown in Table 1 are measurable using standard test procedures (see Karagiozova et al., 2010; Nurick et al., 2009; Paley and Aboudi, 1992). These encompass simple tensile and compressive tests as well as in-plane shear tests and variety of their combinations when convex failure hypersurfaces are relevant. However, values for fracture energies of composites are not readily available in most cases. Donodan et al. (2007b) have highlighted various procedures for measuring modal fracture energies. The directional strengths of the tested composites (GFPP) were obtained from the work of Karagiozova et al. (2010). In order to determine the fracture energy associated with each fracture mode, tests can be undertaken using three different pre-cracked geometries, that is, Overhead Compact Tension (OCT) (tension/compression), double edge notch (DEN) (tension) and four-point-bending specimens. Procedures and techniques employed for the determination of these parameters were highlighted by Donadon et al. (2007b). Due to lack of availability of values for intra-laminar fracture energies in open literature, values presented in Table 2 are calibrated to validate the experimental results for the test samples.
Mechanical properties of GFPP (Karagiozova et al., 2010; Vo et al., 2012, 2013).

GFPP: glass fibre–reinforced polypropylene.
Intra-laminar fracture energies.

Elastic damage energy and dissipation
Using a strain-equivalent damage mechanics formulation, a damage elastic compliance matrix

The above compliance matrix has six scalar damage parameters d1, d2, d3, d4, d5 and d6. Intrinsic to this formulation is the assumption that symmetry of the compliance matrix is preserved throughout the analysis and is never violated. These six damage parameters have values between 0 and 1 corresponding to intact (virgin) and fully damaged (fractured) material, respectively. Values of d1, d2 and d3 are associated with damage in the warp, weft and through-thickness directions, respectively, while d4, d5 and d6 correspond to the in-plane and out-of-plane shear failures. Parameters d1–d6 can be viewed as invariant functions that represent physical parameters. Note there are no additional damage parameters to model independent degradation in Poisson’s ratios. The general damage mechanics formulation is based on an internal energy function ϕ for an orthotropic solid. The function ϕ is a scalar field function shown in the relationship in equation (8)

We introduce thermodynamic forces (

which implies that for elastic material

The variable Yi is referred to as damage energy rates in particular failure modes. It can be inferred, as we will see later that

where fi (f1, f2, f3, f4, f5 and f6) is to be determined from a multi-axial failure or interaction between damage states. Further model assumptions are as follows. (a) The six damage modes in all stress directions are decoupled and determined by Y1, Y2, Y3, Y4, Y5 and Y6. This assumption was made by A.F. Johnson (2001) in modelling two-dimensional (2D) plane elements for reinforced composites. (b) Ply material is non-healing, thus on unloading, subsequent to being damaged, the damage parameter remains constant until a larger damaging load is applied; in other words, each damage parameter is an absolutely ascending function of time irrespective of loading history and multi-axial pattern of damage. Thus, the evolution function depends on the maximum values of Yi attained. (c) The inelastic behaviour of the matrix is ignored and was found in this particular case not to affect the correlation between the experiments and the numerical models.
In order to implement assumption (b), we introduce a parameter

Thus, imagining an elastic domain without damage at the outset of loading and subsequent evolution to a lower than unity value of the modal damage initiation parameter and full separation or cut-off at an upper damage threshold, we deduce that

In this model, we assume nonlinear (exponential) forms for function f, that is, for d1, d2, d3, d4, d5 and d6. Thus, the evolution equations of a 3D composite element requires the relation between di and
Damage initiation criteria
As mentioned earlier, the composite is assumed to behave elastically in an orthotropic manner until the onset of damage. The modified Hashin criteria take into consideration more modes of failure than the traditional one and are applicable to woven as well as unidirectional fibrous composites. This is shown in equation (13a) to (13h) which determine the point of damage initiation. Damage initiates in any of the failure modes when rm = 1.
Fill and warp fibre tensile/shear failure mode
The failure surface that characterises this mode is given by the quadratic interaction between the associated axial and through-thickness shear strains; that is, for fill direction (direction 1)

For warp direction (direction 2)

where the sign <x> is equal to x for positive values of x and is 0 otherwise. For the woven composite plies, 1, 2 and 3 represent in-plane fill (direction 1), in-plane warp (direction 2), and out-of-plane (direction 3) directions, respectively. E and G are tensile and shear moduli, respectively. S1T and S2T are tensile strengths in the fill and warp directions. S1FS and S2FS are fibre shear strengths in 1–3 and 2–3 directions, ϵ1 and ϵ2 are failure tensile strains in a and b directions, ϵ31 and ϵ23 are shear strains in 1–3 and 2–3 planes. We assume that S1FS = SFS and S2FS = SFS*S2T/S1T, where SFS is the fibre shear strength in Table 3.
Strength of composite (GFPP) (Vo et al., 2013).

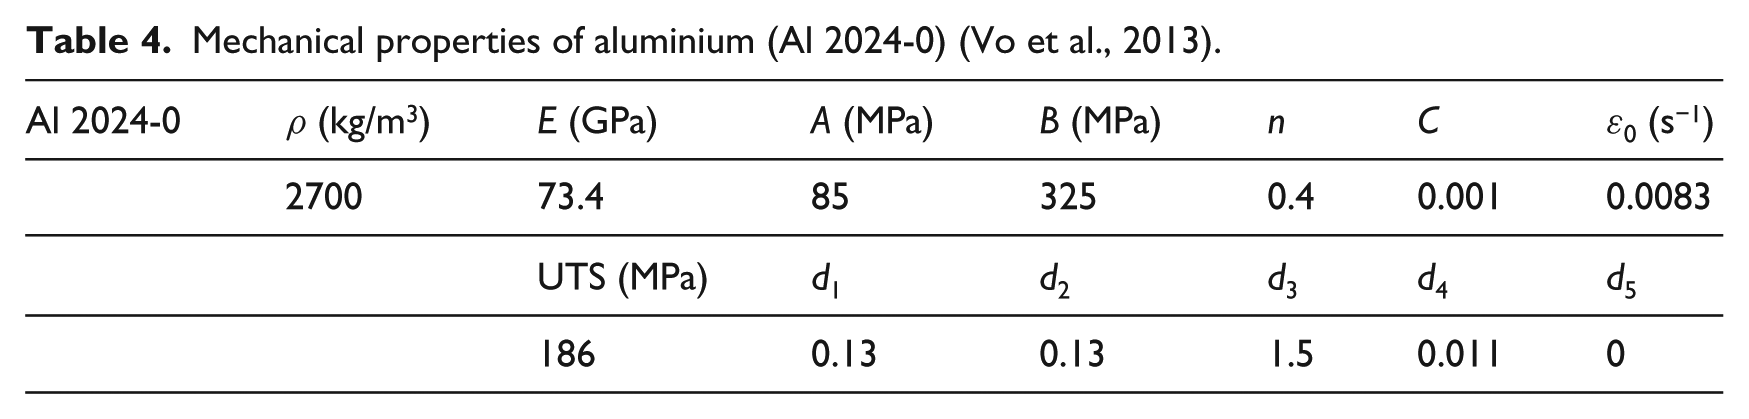
Mechanical properties of aluminium (Al 2024-0) (Vo et al., 2013).
Fibre compressive failure mode
The in-plane compressive damage in directions 1 and 2 are given by the following failure criterion
For fill direction (direction 1)

For warp direction (direction 2)

where S1C and S2C are in-plane compressive strengths in directions 1 and 2, respectively.
Fibre crush failure mode
The crush damage because of high through-thickness compressive pressure from blast waves can be modelled with the hypersurface of equation (13e)

where SFC is the fibre crush strength.
Fibre in-plane shear failure mode (planes 1 and 2)
A woven layer can damage under in-plane shear stress without occurrence of fibre breakage. The in-plane matrix damage mode is given by

where S12 is the layer shear strength due to matrix shear failure.
Fibre out-of-plane shear failure mode (planes 2 and 3)
The in-plane matrix damage mode is given by

where S23 is the corresponding layer shear strength due to matrix shear failure.
Fibre in-plane shear failure mode (planes 1–3)
The in-plane matrix damage mode is given by

where S31 is the corresponding layer shear strength due to matrix shear failure.
Strain rate effect
The effect of strain rate on the strength values of composite failure modes is modelled by multiplying the associated strength values {S0} by a scale factor

where Crate is the dimensionless strain rate constant, and {S0} is the available strength value of {SRT} at the reference strain rate
It has been observed that the through-thickness elastic modulus of GFPP used in this work is strain rate dependent. A through-thickness elastic modulus of 4.8 GPa used was extracted from an experiment under a strain rate of 103s−1, while the static through-thickness elastic modulus was found to be half of the measured value under such strain rate. However, E1 and E2 for GFPP were observed to be strain rate independent (Karagiozova et al., 2010).
Damage progression criteria
The evolution function for the damage proposed in the relationship of equation (12) is empirically determined following a procedure similar to the one adopted by Johnson (2001) and Matzenmiller et al. (1995) (Batra et al., 2012). The damage evolution at a material point is defined in terms of an internal variable Qm (m = 1, 2, 3, 4, 5, 6, 7, 8) associated with failure index fm by the empirical relationship in equation (13). The threshold values of the failure indexes, fm, (represented as f0) in this context are analogous to the terms Y10, Y20, Y30, Y40, Y50, Y60. The eight failure modes showed by the modified Hashin criteria in equation (13) determine the value of the failure index f0.The value Hm measures the rate of damage evolution

Equation (16) shows how the various failure modes (internal variable, Qm) affects the properties of the composite in all directions (i.e. the values of di)

In the relationship above, we see that more than one failure index, Qm, affects the various individual values of failure parameter, di. Fibre damage in either the fill or warp directions results in the reduction in stiffness in the loading direction and in the related shear direction. For failure in shear direction, Q5 influences all six components of the damage vector, di. Notice that Q5 is related to fibre crushing mode, that is, as a resultant of high through-thickness compressive stress as shown in equation (13e).
In this model, we degrade elastic properties as damage evolves, and the damaged and undamaged constitutive equations are checked and updated in the model per increment. The irreversibility of the internal variables is accounted for by requiring that dQm = 0 whenever drm ⩽ 0, where drm represents an increment in rm for an increment in the applied load.
Fracture energy (energy release rate) and mesh objectivity
Equation (16) proposed above defines the softening evolution in composites after the damage is initiated. The finite area under the, that is, individual stress–displacement curve (i.e. each representing an individual damage mode) represents the energy dissipated for each mode. For validity of this proposed model, we assume that the crack growth direction is parallel to one edge of the FE, and the composite meshes are structured.
The specific energy dissipated per unit volume is

It is convenient to express the effective stress damage evolution as

In equation (17), Em corresponds to corresponding shear or elastic modulus, and Sm is the effective strength of the composite in the particular direction in question factoring in rate dependency.
Thus, the rate of mechanical dissipation is valid if the damage indexes increase monotonically, thus

We propose from the above analysis a value for Hm as

where Gm is the specific fracture energy corresponding to each damage mode, gm is the energy dissipated per unit volume, lelm is the characteristic length of the FE, Sm is the effective strength of the composite in the particular direction in question factoring in rate dependency and d(r) depicts that the damage parameter as a function of r, where r0 corresponds to the point of damage initiation.
The value Hm measures the brittleness of the FE. As observed by Cervera and Chiumenti (2006), in an FE analysis, the state variables of the local model are computed at the integration points in terms of the local stress or strain history. Thus, the characteristic length lelm is related to the volume or area of the FE. This implies that for a simple beam element, for instance, the characteristic length can be taken as the size of the element. If we restrict the configuration of our elements in this model as equilateral, we will have for equilateral plane triangular element with area Ae, and we will have the characteristic length as equation (21a). In addition, for equilateral tetrahedral and cubic elements of volume Ve, we have the characteristic length as shown, respectively, by equations (21b) and (21c) as follows


Aluminium constitutive model
The aluminium component of the FML was modelled using the famous Johnson–Cook plasticity failure model, which is a special type of Mises plasticity model with analytical forms of the hardening law and rate dependency. Its suitability for high-strain rate deformation of many materials (including most metals) makes it an attractive option in the development of this model. In using this model, adiabatic transient response is usually assumed. Johnson–Cook’s hardening model (a type of isotropic hardening) is explained below.
The strain rate assumption of the Johnson–Cook material model postulates that

where

The effective plastic strain

where

The Johnson–Cook failure model is used in conjunction with its plasticity model in the numerical modelling of failure of the aluminium metal sheets. The failure mechanism is based on the value of the effective (or equivalent) plastic strain at element integration points. Fracture occurs in the aluminium sheet when the damage parameter ω exceeds 1.0. The evolution of ω is given by the accumulated incremental effective plastic strains divided by the current stain at fracture

where

where d1–d5 are non-dimensional failure parameters measured at or below the transition temperature. It is important to note that the failure parameter d3 is reported as being negative in some literature. However, ABAQUS’ general expression for strain at fracture expects this parameter to be positive. It is worthy of mentioning that failure to properly account for the sign of d3 will result in an inaccurate response. Choosing a value for the fracture energy, which is used as a data parameter for the damage evolution law, completes the setting of the fracture model. Elements are deleted by default upon reaching maximum degradation according to the usual rules of ABAQUS progressive damage framework. Table 2 shows the values of the plasticity and failure parameters used for Al 2024-0 in this work.
Cohesive elements and interface simulation
The constitutive behaviour of the adhesive layer in this work is described in terms of direct traction versus separation model implemented in ABAQUS (usually preferable for bonded interface where the thickness of the adhesive is negligible and the path of fracture lies essentially within the adhesive) (Luo et al., 2012). This means that the variations of stress and strain through the thickness of the adhesive are disregarded. This usually assumes an initial linear elastic model followed by the initiation and evolution of the damage. The nominal stress vector is related to the nominal strain vector across the interface with an elastic constitutive matrix. The nominal stresses are the force components divided by the original area (similar to the second Piola–Kirchhoff stress) at each integration point, while the nominal strains are the separations divided by the original thickness at each integration point (similar to the Green–Lagrange strain). However, the default choice of the constitutive thickness in terms of traction separation is 1.0 (irrespective of the thickness of the adhesive layer). Thus, the diagonal terms of elastic matrix shown in equation 30 are


where tn represents the normal traction, and ts and tt are the two shear tractions (i.e. in the first and second shear directions). The term ρc is the actual density of the cohesive element, and ρ is the inputted density. The parameter tc in equation (28a) denotes the constitutive thickness and should not be confused with a traction. The elasticity matrix in equation (28b) provides a fully coupled behaviour between all components of the traction vector and the separation vector (strain vector). Note the off-diagonal terms in the matrix can be set to 0 if the uncoupled behaviour between stress and strain is desired. This is the case for the model used in this work.
As shown by the graph of typical traction–separation response in Figure 2, the damage initiation refers to the beginning of degradation in material constitutive response at a material point. The damage initiation in damage models begins when the stress and/or strains meet some damage initiation criteria, in this case, a quadratic nominal stress criterion as shown in equation (29)

where

where the mixed-mode fracture energy is Gc = Gn + Gs + Gt when the above equation is satisfied. In the expression, the quantities Gn, Gs and Gt refer to the work done by the traction and its conjugate relative displacement in the normal, the first and the second shear directions, respectively. The specified quantities

Traction–separation response of cohesive element (the parameter δ is the modal separation (difference in top and bottom displacements)).
Properties of cohesive layer.

Localised blast
The simulation of the dynamic response in localised blast-loaded FMLs is of importance owing to the differences between the response modes to this type of loading and global blasts. The apparently peculiar nature of this kind of loads renders the dynamic solution, damage pattern, thresholds and critical conditions intrinsically different. When localised blast loads are applied to plates, it is normal practice to idealise the localised blast as pressure loading relating to impulse obtained from actual experiment. For localised blast at the centre of a plate, the pressure loading is a function of time and distance from the centre of the plate (Karagiozova et al., 2010).
However, for FMLs, like for other plated systems, the response to localised blast includes two regimes: one associated with the initial through-thickness compression phase, the subsequent reflected tensile from the back face, and the other related to the overall response. These characteristics make the time history of localised blast load very important.
This work has been validated by the experimental results generated by other researchers at the University of Cape Town, the loading comprises a disk of 8-g explosive (cylindrical charge) with a diameter of d0 = 30 mm and a leader of 1 g mass which was placed at the centre of the panel. Results from AUTODYN simulation show that the pulse is well described by an exponentially decaying function exp (−2t/t0) in time with t0 = 0.008 ms (Karagiozova et al., 2010). The spatial distribution of the loading shows that the leader influences the shape of the pressure pulse by producing a variable pressure within the area bounded by the disk of explosive, r ⩽ d0/2 (Karagiozova et al., 2010), where d0 denotes the diameter of the charge. Figure 3 shows the temporal and spatial distributions of the localised blast load.

(a) Temporal pressure–time history at a generic fixed position x0 and (b) spatial pressure–time history at a generic time t0.
The pressure function, P (r, t) used in this work is

where


In the above equation, r0 = 15 mm which is the radius of the explosive disc used in the experiments, (k) = (m−1) is an exponential decay constant, which models the pressure distribution over the exposed area of the plate, rb < L/2, where L is the length of the panel, and t0 is the characteristic decay time for the pulse (Karagiozova et al., 2010). The decay constant, k, depends on the ratio d0/L through the relationship

The range d0/L was restricted by the experimental configurations used; however, the above expression is still valid for current configuration, d0/L = 0.1. Thus, k ≈ 114 m−1. The total impulse imparted to the plate is given by the expression

Figure 4 shows the spatial distribution of local blast on the centre of the FML plate. Table 6 shows the values of calculated peak pulse, P0. It must be noted that the spatial distribution of the load is an axisymmetric function.

Panel shows distribution of applied localised blast load.
Computed peak pulse pressure.

Results and discussion
A subroutine (VDLOAD) was developed to depict the localised blast load illustrated in equations (32) to (34). The loads are applied to the developed FML model, and the results are compared with the experimental results presented by Langdon et al. (2007a). The significant back face deflection was observed as the first response mode of the structures in the numerical models. This can be attributed to the through-thickness-reflected tensile wave propagation in the FML as the early time response, scabbing or spalling (regime I of response). Figure 5(b) shows large localised back face deflection with no visible damage in the composites. This can be compared to the diamond-shaped deflected back face of panel A2T14-2 shown in Figure 5(a). Figure 5(c) shows the displacement time history at the midpoint of the plate. This is obviously the point of maximum deflection.

(a) Photograph showing the back faces of the FML panels form experiment for A2T18-3 (Langdon et al., 2007a), (b) numerical simulation for FML panel A2T18-3 for 1 mm × 1 mm mesh at 0.15 ms and (c) displacement time history in the middle (front face) for A2T18-4.
At increased blast loads, the numerical model in Figure 6(a) and (b) shows large plastic deformation and back face delamination. The displacements of the back face and middle start to diverge and more pronounced debonding is observed. Figure 6(c) shows the displacement time history in the middle of the plate.

(a) Photograph showing the back faces of the FML panels form experiment for panel A3T28-4 (Langdon et al., 2007a), (b) numerical simulation for FML panel A2T28-4 for 1.5 mm × 1.5 mm mesh at 0.15 ms and (c) displacement time history in the middle (front face).
At increased blast loads, the numerical model in Figure 7(b) and (c) captures the tearing and eventual perforation of panel A2T14-1 as shown in Figure 7(a). Figure 7(b) shows the numerical simulation of the FML with a mesh size of 1 mm × 1 mm and corresponding softening modulus, while Figure 7(c) shows a mesh size of 1.5 mm × 1.5 mm. Both figures show an average of 75% damage in warp direction in the composite patches close the centre of the panel. Figure 7(a) and (b) shows the failure of the front and back faces of panel A3T24-3 which compares favourably the experimental results in Figure 7(a). Both the 1 mm × 1 mm mesh and 1.5 mm × 1.5 mm mesh were able to capture the failure in the composites with adequate softening modulus. Figure 8(a) and (b) shows similar results as the case depicted in Figure 7.

(a) Photograph showing the back faces of the FML panels form experiment for A2T14-1 (Langdon et al., 2007a), (b) numerical simulation for FML panel A2T14-1 for 1 mm × 1 mm mesh at 0.01 ms and (c) numerical simulation for FML panel A2T14-1 for 1.5 mm × 1.5 mm mesh at 0.01 ms.

(a) Photograph showing the back faces of the FML panels form experiment for A3T24-3 (Langdon et al., 2007a) and (b) numerical simulation for FML panel A2T24-3 for 1.5 mm × 1.5 mm mesh at 0.01 ms.
A good correlation is observed for the maximum displacements of the back and front face panels between the numerical simulation and experimental models of the FML panels. The displacements of the FML panels correlated well as shown in Table 7.
Comparison of displacement of FML panels.

FML: fibre–metal laminate; PE: plastic explosive.
Efficiency of the charge and effectiveness of the target
The efficiency of localised blast on the target can be represented in a non-dimensional form for correlation studies and investigation into the effect of such charges on the target. The equations of spatial and temporal distributions of the above localised blast load on the FML can be rewritten as follows

Thus, for

In addition, for

Introducing non-dimensional parameters, it follows that

where η is referred to as the efficiency of the charge, and Ir is the non-dimensional total impulse on the FML plate. After simplification, η can be written as

It can be shown that for the configuration studied, the efficiency of the charge is 99.5%. This indicates that in these scenarios, the full impulse of the charge is taken by the system. Effectiveness of the target, on the other hand, in a particular localised blast scenario can be defined as the ratio of the impulse corresponding to a particular damage level (most frequently, the tearing threshold damage) to the total impulse delivered to it in that blast scenario, that is

where the effectiveness of the target is denoted by
Conclusion
Several aspects of the study presented in this article are validated against the experimental data for localised blast-loaded FMLs. Thus, using numerical simulations, one is provided by a cost-effective, predictive and efficient way of virtual testing and preliminary study for the response of FMLs without having to go through the rigours of blast testing physical panel prototypes. The response of FMLs has been found to be highly dependent on the thickness of the loaded plate and the characteristics of underlying layers. Thus, it is of crucial significance that in the behaviour of FMLs, highly nonlinear transient dynamic phenomena (i.e. the large plastic deformation, debonding, delamination, tearing and failure of the constituent components of the plate) be captured in order to be able to describe the full response of the FML in such a loading environment.
Layers at the back in a typical FML support layers at the front providing the reason why the back face easily debonds from the rest of the plate when loaded. Thus, the failure of the intermediate composites in the FMLs needs to be adequately captured in order to be able to predict the health of the top aluminium plates. If the composite layers are modelled improperly and do not fail when they ought to fail as observed in the experiments, the maximum deflection of the system would be predicted incorrectly and thus, the overall response of the system rendered under-predicted. As a result of this, subsequent tearing of the aluminium plate might not be captured in the model. The developed model captures the state/health of the aluminium and composite in the FML and the maximum displacements of the back and front faces.
The concepts of charge efficiency and target effectiveness are defined and relevant equations are derived. These are important as far as defensive shields are concerned.
One final remark regarding the constitutive models used in this work is in order. While several nonlinear phenomena have been considered and the corresponding material models are incorporated, the hydrodynamic equations of state (EoSs) have not been used for the target. The loading is obtained as a result of a full fluid–structure interaction (FSI) simulation in AUTODYN; however, material EoSs such as those of Rankine–Hugoniot or Mie–Grüneisen are not included (Cheng et al., 2007; Hanstrom and Lazor, 2000). Such models, while necessary to simulate high-rate phenomena as ballistic perforation are of little use for charge sizes and stand-offs of this study. A more comprehensive study would be needed to show with certainty the little relevance of these EoSs in a blast loading scenario replicated here as well as to give bounds of relevance on charge sizes, stand-offs or related dimensionless parameters.
Since the constitutive models incorporate strain rate effects in metal and composite parts and an objectivity algorithm for strain softening to control energy dissipation associated with each failure mode regardless of mesh refinement and topology, the confidence of the analyst in determining the response of the intermediate composite layers as well as the global response is improved.
Footnotes
Declaration of conflicting interests
The author(s) declared no potential conflicts of interest with respect to the research, authorship and/or publication of this article.
Funding
The author(s) received no financial support for the research, authorship and/or publication of this article.